Silent' Dome Emplacement into a Wet Volcano: Observations from an Effusive Eruption at White Island (Whakaari), New Zealand in Late 2012
←
→
Page content transcription
If your browser does not render page correctly, please read the page content below

geosciences
Article
‘Silent’ Dome Emplacement into a Wet Volcano:
Observations from an Effusive Eruption at White
Island (Whakaari), New Zealand in Late 2012
Arthur Jolly 1, * , Corentin Caudron 2 , Társilo Girona 3 , Bruce Christenson 1 and Roberto Carniel 4
 1    GNS Science, Avalon, Lower Hutt 5010, New Zealand; B.Christenson@gns.cri.nz
 2    ISTerre, Université Grenoble Alpes, Université Savoie Mont Blanc, 73000 Chambery, France;
      corentin.caudron@gmail.com
 3    Jet Propulsion Laboratory, California Institute of Technology, Pasadena, CA 91109, USA;
      tarsilo.girona@jpl.nasa.gov
 4    Laboratorio di Misure e Trattamento dei Segnali, DPIA, University of Udine, Udine, 33100 Friuli, Italy;
      carniel1965@gmail.com
 *    Correspondence: a.jolly@gns.cri.nz

 Received: 2 April 2020; Accepted: 9 April 2020; Published: 14 April 2020

 Abstract: The 2012–2016 White Island (Whakaari) eruption sequence encompassed six small explosive
 events that included one steam driven and five explosive phreato-magmatic eruptions. More enigmatic,
 a dome was observed at the back of the vent and crater lake in November 2012. Its emplacement
 date could not be easily determined due to persistent steam from the evaporating crater lake and
 because of the very low levels of discrete volcanic earthquakes associated with its growth. During
 this period, seismicity also included persistent tremor with dominant frequencies in the 2–5 Hz range.
 Detailed assessment of the tremor reveals a very slow evolution of the spectral peaks from low to
 higher frequencies. These gliding spectral lines evolved over a three-month time period beginning in
 late September 2012 and persisting until early January 2013, when the tremor stabilised. As part of
 the dome emplacement episode, the crater lake progressively dried, leaving isolated pools which
 then promoted persistent mud/sulphur eruption activity starting in mid-January 2013. We interpret
 the emplacement of the dome as a non-explosive process where the hot, mostly degassed, magma
 intruded slowly through the hydrothermal system in late September 2012 and cooled in a relatively
 quiet state. The tremor evolution might reflect the slow contraction of subsurface resonant cavities,
 which increased the pitch of the peak resonant frequency through time. Alternatively, spectral
 evolution might reflect a ‘comb function’ due to clockwork beating of the slowly cooling dome,
 although direct evidence of clockwork beats is not seen in the waveform data. Finally, it might
 represent frothing of the hydrothermal system ahead of the slowly propagating magma.

 Keywords: dome emplacement; hydrothermal system; RSAM; tremor; gliding spectral lines; White
 Island; phreatic eruptions

1. Introduction
      White Island (Whakaari in Te Reo Maori) is a frequently active and hazardous composite cone
volcano with most of its relief lying below sea level within the south-eastern Bay of Plenty (Figure 1A).
While White Island produces only small eruptions by global standards, the tragic 9 December 2019 event
illustrates the possible societal impacts that relate to small eruptions at volcanoes that are frequented
by tourists. Such eruptive activity was also present during the 2012–2016 period (Figure 1) which
proceeded from the onset of unrest in mid-2011 [1,2], produced several well documented explosive

Geosciences 2020, 10, 142; doi:10.3390/geosciences10040142                      www.mdpi.com/journal/geosciences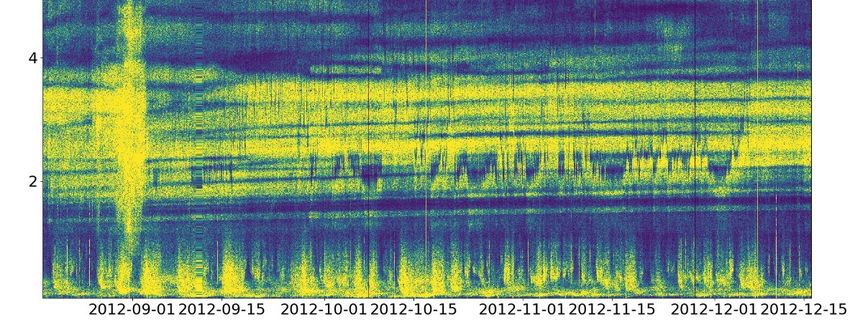
‘wet’ volcano hydrothermal system. The dome effusion had significant consequences for the
evolution of the hydrothermal system, promoting the drying of the lake, and a switch to persistent
and well documented mud/sulphur eruption activity [13−16]. Dome forming eruptive activity is a
frequent occurrence in volcanic systems with viscous magmas and have drawn significant scientific
Geosciences
interest due      10,their
            2020,to   142 persistent medium- to long-term hazards. These hazards are greatest when        2 of 13
                                                                                                             the
domes are perched at elevation on unstable slopes of a volcanic edifice such as at volcanoes like
Soufriere
eruptions Hills,
             [1,3,4]Montserrat    [17];
                       through 2012 andRedoubt,
                                         2013, andAlaska    [18]; or
                                                     culminated   in Merapi,   Indonesia
                                                                      April 2016         [19]. phreatomagmatic
                                                                                 with a small  Domes may also
form   within
event [2,5,6].   positions  of lower  relief (e.g., Mt. St. Helens   [20−22]), and in such cases, the eruptions
can be emplaced through well-developed hydrothermal systems.

     Figure 1. Map of White Island, located in the south-eastern Bay of Plenty (the topographic contour is
     Figure 1. Map of White Island, located in the south-eastern Bay of Plenty (the topographic contour is
     40 m). The single seismic station WIZ (blue triangle) and dome eruption vent (red circle) and south
     40 m). The single seismic station WIZ (blue triangle) and dome eruption vent (red circle) and south
     east eruption vent (red square) shown in (A). Ash venting during the 5 August post eruption ash
     east eruption vent (red square) shown in (A). Ash venting during the 5 August post eruption ash
     venting period is shown for 9 August. The dome is shown in (C) and was taken 12 December. Note the
     venting period is shown for 9 August. The dome is shown in (C) and was taken 12 December. Note
     remainder of the crater lake in the foreground. Photo (B) is unattributed courtesy of GeoNet, while (C)
     the remainder of the crater lake in the foreground. Photo (B) is unattributed courtesy of GeoNet, while
     is by Brad Scott courtesy of GeoNet.
     (C) is by Brad Scott courtesy of GeoNet.
      Eruptions at White Island are driven by persistently active magmatic degassing that is evident over
      The hydrothermal system at White Island results from the interaction between magmatic heat
 the historical record [7]. This degassing requires long-term magmatic injection into shallow portions of
and juvenile fluids with water from meteoric and oceanic sources that percolates into the crust [16].
 the volcanic edifice, which may be accomplished via convective overturn within a conduit [8–10] or
Heat and fluids from the magma drive convective circulation that establish fluid phase transitions
persistent injection of small batches of magma [11,12].
below the surface and a hydrostatically controlled phase equilibrium with its enclosing hydrothermal
      A small effusive dome was also emplaced on the back wall margin of the active lake filled
brine. In particular, at the magma-hydrothermal system interface, a single-phase gas enveloped by a
 eruption vent system, and hence this is an excellent example of magmatic propagation through a
two-phase fluid composed of liquid and gas bubbles dominates, whereas a single-phase liquid will
‘wet’ volcano hydrothermal system. The dome effusion had significant consequences for the evolution
eventuate at shallow levels and within the crater lake. These conditions are generally stable but can
 of the hydrothermal system, promoting the drying of the lake, and a switch to persistent and well
evolve in different ways depending on the position of magma within the system and externally
 documented mud/sulphur eruption activity [13–16]. Dome forming eruptive activity is a frequent
modulating effects like rainfall (Figure 2).
 occurrence in volcanic systems with viscous magmas and have drawn significant scientific interest
 due to their persistent medium- to long-term hazards. These hazards are greatest when the domes
 are perched at elevation on unstable slopes of a volcanic edifice such as at volcanoes like Soufriere
 Hills, Montserrat [17]; Redoubt, Alaska [18]; or Merapi, Indonesia [19]. Domes may also form within
positions of lower relief (e.g., Mt. St. Helens [20–22]), and in such cases, the eruptions can be emplaced
 through well-developed hydrothermal systems.
      The hydrothermal system at White Island results from the interaction between magmatic heat
 and juvenile fluids with water from meteoric and oceanic sources that percolates into the crust [16].
 Heat and fluids from the magma drive convective circulation that establish fluid phase transitions
 below the surface and a hydrostatically controlled phase equilibrium with its enclosing hydrothermal
 brine. In particular, at the magma-hydrothermal system interface, a single-phase gas enveloped by
 a two-phase fluid composed of liquid and gas bubbles dominates, whereas a single-phase liquid
will eventuate at shallow levels and within the crater lake. These conditions are generally stable but
 can evolve in different ways depending on the position of magma within the system and externally
 modulating effects like rainfall (Figure 2).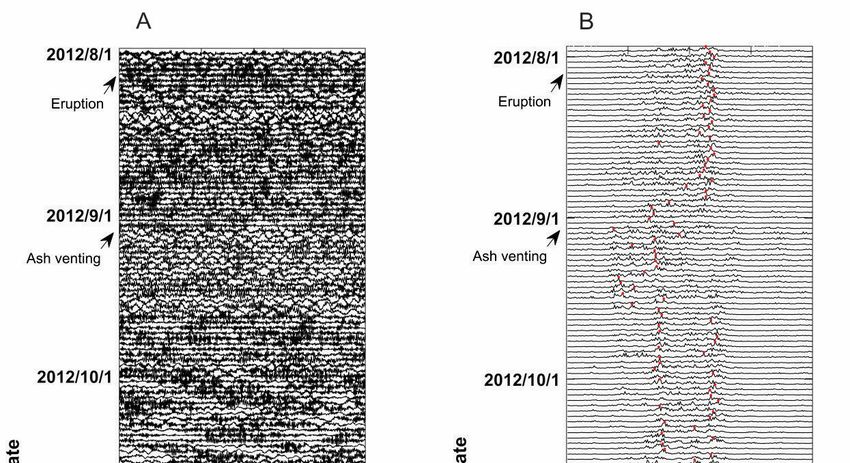
Geosciences 2020, 10, 142 3 of 13
Geosciences 2019, 9 FOR PEER REVIEW 3
Figure 2. Schematic
Figure 2. Schematiccross section
cross sectiondepicting
depicting(A) the pre-
(A) the pre-and
and(B)
(B) post-extrusion
post-extrusion scenarios
scenarios fordome.
for the the dome.
Acidic brinebrine
Acidic fluids underlie
fluids meteoric
underlie water/condensate
meteoric water/condensatelenses
lenses(both
(bothdepicted
depicted green) andencapsulate
green) and encapsulate the
the magmatic/fumarolic
magmatic/fumarolic vent (blue
vent system system (blue
and andMagma
grey). grey). Magma
ascendsascends
along thealong theconduit
main main conduit
(designated
(designated
by the red line byin the
(B),red line in B),by
preceded preceded by increased
increased heat and heat
gasand gas which
flow flow which evaporates
evaporates thethetwo-phase
two-
phase vapour-liquid
vapour-liquid region to region to single-phase
single-phase vaporits
vapor along along
wayits way (grey).
(grey). ThreeThree possible
possible resonant
resonant systems
systems are
are portrayed inportrayed
the inset in the inset(C).
diagram diagram (C). Thefilled
The bubble bubble filled (1).
cavity cavity
A (1). A clockwork
clockwork stick-slip
stick-slip rupture
rupture mechanism (2), or the frothed expanding boiling front (3 and its inset) may produce harmonic
mechanism (2), or the frothed expanding boiling front (3 and its inset) may produce harmonic signals
signals discussed. The arrows in B show the expanded two-phase system that results from the
discussed. The arrows in B show the expanded two-phase system that results from the propagating
propagating magma injection. See text.
magma injection. See text.
From a seismological perspective, the shallow hydrothermal system may produce the full range
From a seismological
of seismic observationsperspective,
seen at White theIsland
shallow
andhydrothermal systemlike
its global analogues may produce
Kawah Ijen the full range
volcano,
of seismic observations seen at White Island and its global analogues like
Indonesia [4,23]. Examples include discrete long-period (LP) [24], volcano-tectonic (VT) [2,25], very Kawah Ijen volcano,
Indonesia [4,23].(VLP)
long period Examples include
seismicity discrete
[2], and long-period
persistent (LP) [24],
volcanic tremor [1]. volcano-tectonic
Tremor is an important (VT) feature
[2,25], very
long of
period (VLP)
volcanic seismicity
seismicity [26]. It[2], and persistent
is characterised by avolcanic
continuous,tremor [1]. or
banded, Tremor
spasmodicis ansignal,
important
whichfeature
is
detectable
of volcanic only when
seismicity [26].exceeding the background
It is characterised by a seismic energybanded,
continuous, level [26].
orSeveral
spasmodic data reduction
signal, which
methods only
is detectable [27] have
when been proposed
exceeding theto background
characterize its short- energy
seismic and long-term time Several
level [26]. evolution,
datathatreduction
can
lead to the identification of significant transitions between volcanic processes
methods [27] have been proposed to characterize its short- and long-term time evolution, that can lead [28], sometimes
triggered by external or internal events such as tectonic or volcano-tectonic (VT) seismic events [29].
to the identification of significant transitions between volcanic processes [28], sometimes triggered
Volcanic tremor can also occur precursory to an eruption [30−33]. However, the origins of tremor
by external or internal events such as tectonic or volcano-tectonic (VT) seismic events [29]. Volcanic
may vary at different volcanoes, and are often poorly understood; moreover, many different seismic
tremor can also
sources occur
can act precursory
at the same timeto andancombine
eruption to [30–33].
produce theHowever,
signal ofthe origins
interest of tremor may vary at
[27].
different volcanoes, and areconsisting
Harmonic tremor, often poorly of aunderstood;
fundamentalmoreover,
frequency many different
and evenly spacedseismic sourcesis can
overtones, a act
at thecommon
same time and combine
occurrence to produce
at volcanic systemsthe signal of [34,35],
worldwide interestand[27].is important both to determine
Harmonic
possible sourcetremor, consisting
processes and as aofmonitoring
a fundamental frequency
tool. Changing and patterns
spectral evenly spaced overtones,
in harmonic tremor is a
(e.g., migration of the spectral lines, i.e., so-called gliding) is increasingly
common occurrence at volcanic systems worldwide [34,35], and is important both to determine recognised at volcanoes
[36−38]
possible sourceas an important
processes andshort-term
as a monitoringprecursortool.that may occur
Changing several
spectral minutes
patterns in prior to explosive
harmonic tremor (e.g.,
migration of the spectral lines, i.e., so-called gliding) is increasingly recognised at volcanoes [36–38]
as an important short-term precursor that may occur several minutes prior to explosive activity.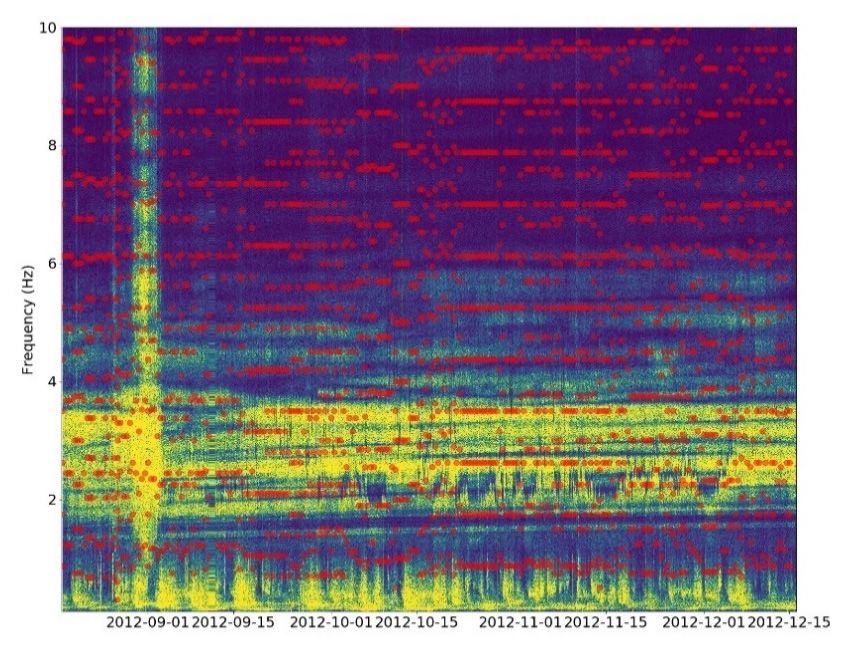
Geosciences 2020, 10, 142                                                                                             4 of 13

Systematic evolution of spectra over longer time periods are less common; however, an assessment of
such slowly evolving systems may also be important from a process and hazard standpoint [39].
     It is surmised that movement of magma below or within a hydrothermal system should produce
significant changes in seismic observations [40–42] (Figure 2). Hence, the extrusion of magma through
a well-established hydrothermal system and onto the surface provides an excellent opportunity to
re-examine remote monitoring data for hazards implications. The dome forming eruption at White
Island is interesting in this context because its discovery was truly enigmatic. It was first documented
by GeoNet on 11 December 2012 but was observed by White Island tour operators possibly a
fortnight earlier (Volcanic Alert Bulletin WI-2012/16; https://www.geonet.org.nz). Surprisingly, its
emplacement occurred without dramatic seismicity revealed on the permanent White Island seismic
station (Figure 1A). Likewise, an evaluation of the White Island web camera system did not reveal
the appearance of the small dome, mostly due to persistent obscuring steam plumes for the period
from the initial onset of eruption activity on 5 August 2012 [1]. It also appeared to have been quite
effusive, based on the smooth lumpy texture of the surface (Figure 1C). The dome, with an extent of
20–30 m in diameter and a height of 10–15 m, has a volume on the order of 1−7 × 10³ m3 . Below, we
retrospectively document the pre-eruption seismicity from the onset of eruptive activity from August
to the observation of the dome in December 2012.

2. Seismic Data and Results
     White Island seismic monitoring was composed of a single broadband seismic sensor at site
WIZ (Figure 1A), which is comprised of a Guralp 3ESP seismometer and a Quanterra Q330 digitiser,
sampling at 100 Hz and telemetering data in real time to the GeoNet data center. The archived seismic
data were processed in two ways: (1) calculation of the real-time seismic amplitude measurement value
(RSAM) by taking the time-series data from the vertical component sensor, correcting it to velocity, and
computing the root mean square (RMS) amplitude within one minute long, non-overlapping windows
(Figure 3A); and (2) computing the spectra via the fast-Fourier transform (FFT) for each one-minute
window (Figure 3B). For the latter, we visualised the data by picking the peak amplitude from the
spectra and monitoring that over the period of interest (before the first eruption to the end of the dome
     Geosciences 2019, 9 FOR PEER REVIEW                                                             5
forming  phase).

      Figure  3. Real-time
            Figure         seismic
                    3. Real-time     amplitude
                                  seismic         measure
                                            amplitude       (RSAM)
                                                        measure        computed
                                                                   (RSAM)         from one-minute
                                                                             computed                  moving
                                                                                         from one-minute       windows
                                                                                                            moving
      (A) and  the maximum    spectral   peak  amplitude  (B)  from   Fast Fourier Transform    of the same
            windows (A) and the maximum spectral peak amplitude (B) from Fast Fourier Transform of the same  one-minute
      window.   The 6 August
            one-minute  window.6 eruption   and 26September
                                  The 6 August     eruption and ash2 venting
                                                                     Septemberepisode  and the
                                                                                ash venting     domeand
                                                                                             episode   emplacement
                                                                                                          the dome are
      marked   (A) and theare
            emplacement    inferred
                              marked injection
                                        (A) andofthe
                                                  magma    intoinjection
                                                     inferred    the deeper   hydrothermal
                                                                         of magma    into the system
                                                                                              deeper and   emplacement
                                                                                                       hydrothermal
      of thesystem
             dome and   emplacement
                    are shown   in (B).of the dome are shown in (B).

            To aid in interpreting the seismic observations, example waveforms (Figure 4A) and spectra
       (Figure 4B) are plotted from the first minute of each day for the period 1 July to 31 December 2012
       (Figures 3 and 4 are presented in UTC). Although we realize that this procedure potentially produces
       an aliasing effect, the individual sample waveforms and spectra match closely a denser spectral
       analysis and confirm the observations in Figure 3. Hence, we regard the observations in Figures 3
Geosciences 2020, 10, 142                                                                                                          5 of 13

     The one-minute RSAM observations (Figure 3A) show the first eruption on 5 August 2012
(RSAM~2800 nm/s), as well as a persistent high amplitude signal in early September (~2100 nm/s),
followed by sustained moderate level tremor (500–1000 nm/s) through the time of the dome observation
in late November 2012. The spectral analysis (Figure 3B) shows that the peak frequency of tremor
is generally focused within the ~1.0–4.0 Hz band, with specific and persistent peaks and notable
evolutionary patterns. We note with particular interest the spectral changes associated with high
amplitude tremor periods, including (1) a shift from broader spectrum tremor to 2.5–3.5 Hz in mid-June
2012; (2) the onset of a migration of the spectral peaks (termed gliding spectral lines in the literature [36])
in mid-July; (3) the onset of broader spectra tremor with slowly gliding spectral lines in early September;
and (4) establishment of stable (non-gliding) persistent spectral peaks in late December (see red dots in
Figure 4). These spectral changes of tremor are linked in time to specific aspects of volcanic activity,
including: (A) Rapid volcanic lake fluctuations of about 4 m and minor geysering (observed in
June/July); (B) the onset of the first strong eruption on 5 August; (C) persistent ash venting in early
September;    and (D)
            Geosciences 2019,the  first
                              9 FOR PEERobservation
                                         REVIEW     of the dome in late November.                  6

                  Figure 4. Example waveforms (A) and spectra (B) for a subset of the seven-month period of interest.
      Figure 4. Example
                 The examples waveforms      (A)
                                 are extracted    and
                                               from  thespectra   (B)seismic
                                                         continuous     for a data
                                                                              subset
                                                                                   andof   the seven-month
                                                                                        include one minute fromperiod
                                                                                                                the startof interest.
      The examples     areJulian
                 of each    extracted
                                 day (UTfrom
                                           HH:MM the 00:00
                                                      continuous
                                                           to 00:01). seismic
                                                                      The initialdata and occurred
                                                                                  eruption   includeonone  minute
                                                                                                        5 August    from
                                                                                                                 2012  at the start
                 NZSTday
      of each Julian    04:55,(UT
                               and HH:MM
                                    the waveforms   are to
                                                00:00   not00:01).
                                                            shown. Note
                                                                      Thethe   change
                                                                            initial    in peak frequency
                                                                                     eruption    occurredaround
                                                                                                            on 5the time
                                                                                                                  August     2012 at
                 of the secondary ashing on 2 September 2012 NZST. Also note the slow migration of peak frequencies
      NZST 04:55, and the waveforms are not shown. Note the change in peak frequency around the time of
                 until the observation of the dome (note red marks for peak spectral frequency). The crater was largely
      the secondary     ashing on 2 September 2012 NZST. Also note the slow migration of peak frequencies
                 obscured by steam from the period of ashing to the observation of the dome.
      until the observation of the dome (note red marks for peak spectral frequency). The crater was largely
      obscured byTo steam
                      assess from
                               possible
                                     the harmonic
                                          period of patterns,
                                                       ashing towe thecomputed
                                                                         observationspectrograms    using two-minute-long
                                                                                         of the dome.
             windows. Each time window is detrended with a mean and a linear function before tapering using a
             Hanning window (10% on each side). The frequency resolution is 0.0083 Hz. For each column of the
             spectrogram the resulting FFT amplitudes are color-coded and shown in Figure 5. After smoothing
             the results with a median of five days, we picked the central frequencies of continuous spectral lines:
             1.4, 1.6, 1.8, 2.0, 2.2, 2.3, 2.7, 2.9, 3.2, 3.5, 4.9 Hz. We note that 2.2 Hz and 2.3 Hz seem to merge in
             September.
                   We then assess if the data were consistent with a harmonic tremor source. In fact, although peaks
             often appear to be equally spaced in frequency, the dominant frequency is rarely seen. We therefore
             developed an algorithm to automatically compute this possibly buried dominant frequency.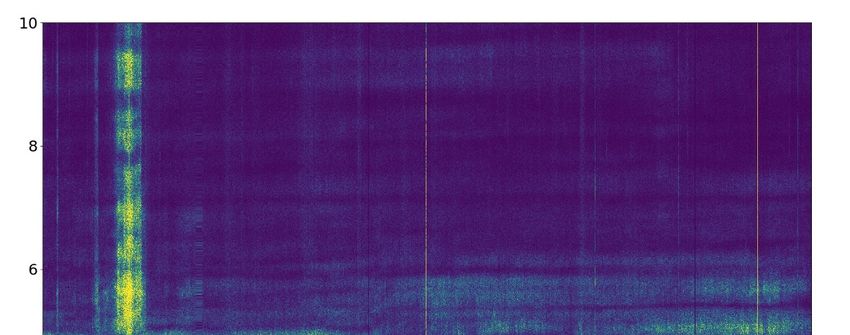
Geosciences 2020, 10, 142                                                                             6 of 13

       To aid in interpreting the seismic observations, example waveforms (Figure 4A) and spectra
 (Figure 4B) are plotted from the first minute of each day for the period 1 July to 31 December 2012
 (Figures 3 and 4 are presented in UTC). Although we realize that this procedure potentially produces an
 aliasing effect, the individual sample waveforms and spectra match closely a denser spectral analysis
 and confirm the observations in Figure 3. Hence, we regard the observations in Figures 3 and 4 as
 robust, illustrating both the longer-term features of the tremor and the slowly evolving migration from
 lower to higher spectral frequencies.
       Specific spectral peaks become well established in late August 2012, which then perceptibly
 migrate towards higher frequencies over a three-month period. On ~ 29 August 2012, the specific peaks
 of interest are at 2.1 Hz (Figure 4B). These peaks shift to a stable frequency of 2.3 Hz by 30 November
 2012 (Figure 4B), about the same period that the dome must have been emplaced based on the tremor
 and the first observation of the dome. A subsidiary peak is also observed, which weakly emerges at
~2.9 Hz after the ashing episode and persists after the first dome observation at a modestly higher
 frequency of ~ 3.2 Hz. There are also stationary spectral peaks observed at other specific frequencies
 (Figures 3 and 4B) as part of a possible harmonic pattern which began in early September and evolved
 until the dome was observed.
Geosciences 2019, 9 FOR PEER REVIEW                                                                      7
       To assess possible harmonic patterns, we computed spectrograms using two-minute-long windows.
 Each time window is detrended with a mean and a linear function before tapering using a Hanning
window (e.g., 4 h or 12 h) by counting for each frequency how many times a peak is detected. Finally,
 window (10% on each side). The frequency resolution is 0.0083 Hz. For each column of the spectrogram
we search for our dominant frequency in the 0.3−1.3 Hz range, and cumulate histogram values not
 the resulting FFT amplitudes are color-coded and shown in Figure 5. After smoothing the results with
only for that candidate dominant frequency but also for its potential harmonics. The cumulated value
 a median of five days, we picked the central frequencies of continuous spectral lines: 1.4, 1.6, 1.8, 2.0,
is then normalized (i.e. divided by the number of harmonics) because lower frequencies may yield
 2.2, 2.3, 2.7, 2.9, 3.2, 3.5, 4.9 Hz. We note that 2.2 Hz and 2.3 Hz seem to merge in September.
higher numbers of harmonics and higher cumulated values.

      Figure 5. Spectrogram computed using two-minute-long windows after removing the mean, the trend
     Figure 5. Spectrogram computed using two-minute-long windows after removing the mean, the trend
      and applying a cosine taper in each window. Yellow colours correspond to high amplitudes, whereas
     and applying a cosine taper in each window. Yellow colours correspond to high amplitudes, whereas
      blue colours correspond to low amplitudes.
     blue colours correspond to low amplitudes.

     For each column, we determine the potential dominant frequency, and we superimpose it,
together with all its harmonics, on the spectrogram to assess its coherency with time. The results
(Figure 6 for time windows of 4 h, and in Figure 7 for time windows of 12 h) are consistent with a
harmonic oscillation over a narrow frequency band, hence confirming that the tremor could originate
from a harmonic process. We must acknowledge that the observation is based on the sole single
station observation and hence may include other influences such as path and structural effects in this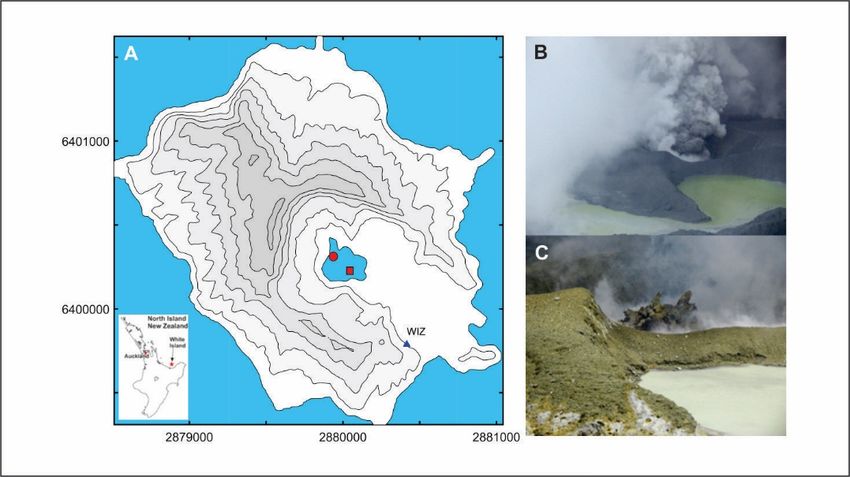
Geosciences 2020, 10, 142                                                                                          7 of 13

      We then assess if the data were consistent with a harmonic tremor source. In fact, although peaks
often appear to be equally spaced in frequency, the dominant frequency is rarely seen. We therefore
developed an algorithm to automatically compute this possibly buried dominant frequency.
      For each column of the spectrogram (i.e., 2 min), the algorithm determines all the peaks by looking
for local maxima in the column. An histogram of these peaks is then built over a wider time window
(e.g., 4 h or 12 h) by counting for each frequency how many times a peak is detected. Finally, we
search for our dominant frequency in the 0.3–1.3 Hz range, and cumulate histogram values not only for
that candidate dominant frequency but also for its potential harmonics. The cumulated value is then
normalized (i.e. divided by the number of harmonics) because lower frequencies may yield higher
numbers of harmonics and higher cumulated values.
      For each column, we determine the potential dominant frequency, and we superimpose it, together
with all its harmonics, on the spectrogram to assess its coherency with time. The results (Figure 6
for time windows of 4 h, and in Figure 7 for time windows of 12 h) are consistent with a harmonic
oscillation over a narrow frequency band, hence confirming that the tremor could originate from a
harmonic process. We must acknowledge that the observation is based on the sole single station
      Geosciencesand
observation       2019,hence
                        9 FOR PEER
                               mayREVIEW                                                                   8
                                    include other influences such as path and structural effects in this complex
      Geosciences
volcanic edifice. 2019, 9 FOR PEER REVIEW                                                                  8

           Figure 6. Same as Figure 5, but with potential dominant frequency and corresponding harmonics
      Figure 6. Same
          overlaid
          Figure  6.(red
                     Sameas Figure
                         dots
                            as in 4-hr5,time
                                Figure   5,but with
                                                withpotential
                                              windows).
                                            but                dominantfrequency
                                                     potential dominant  frequency and
                                                                                 and    corresponding
                                                                                     corresponding     harmonics
                                                                                                   harmonics
      overlaid (red  dots  in 4-hr  time    windows).
          overlaid (red dots in 4-hr time windows).

      Figure 7. Same as Figure 6, but with potential dominant frequency and corresponding harmonics
          Figure 7. Same as Figure 6, but with potential dominant frequency and corresponding harmonics
      overlaid (12-hr time windows).
           overlaid7.(12-hr
           Figure     Same time windows).
                            as Figure 6, but with potential dominant frequency and corresponding harmonics
           overlaid (12-hr time windows).
      3. Discussion
      3. Discussion
            Whilst the migration in spectral peaks is very small compared to other well-known examples
      like Soufriere
           Whilst theHills [36] andinRedoubt
                        migration     spectral [38],
                                                peakstheisspectral gliding
                                                           very small      observed
                                                                       compared  to for White
                                                                                    other     Island occurs
                                                                                          well-known        over
                                                                                                       examples
      a much
      like    longerHills
           Soufriere  time[36]
                            period
                                andofRedoubt
                                      ~3–4 months.    This
                                              [38], the     timescale
                                                          spectral     is more
                                                                   gliding     comparable
                                                                           observed       to the
                                                                                    for White    one occurs
                                                                                              Island observed at
                                                                                                            over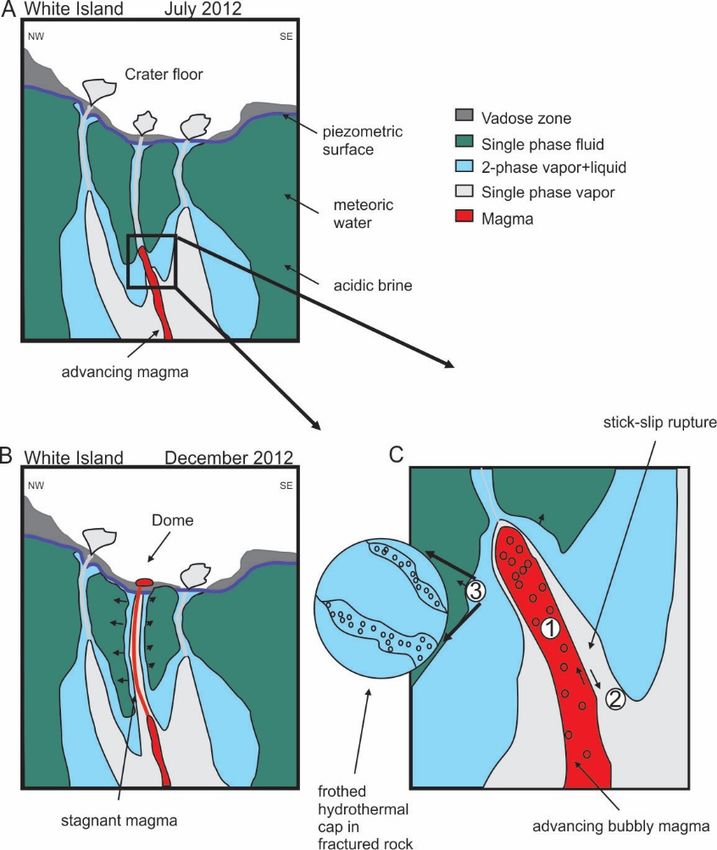
Geosciences 2020, 10, 142                                                                            8 of 13

3. Discussion
       Whilst the migration in spectral peaks is very small compared to other well-known examples like
Soufriere Hills [36] and Redoubt [38], the spectral gliding observed for White Island occurs over a much
longer time period of ~3–4 months. This timescale is more comparable to the one observed at Villarrica
volcano [43], although in that case the frequency changes were more abrupt. In all of these cases, the
spectral changes can be linked to eruptive activity at the volcano. The gliding frequencies at White
Island are unusual in two respects. First, they persisted over several months, starting with the onset
of low-level ash eruptions in early September 2012, and the observation of a dome over 2.5 months
later in late November. Second, while the gliding spectral lines observed prior to large eruptive events
(e.g., Soufriere Hills [36]; Redoubt [38]) seem to have persistent monotonically increasing frequencies
(concave upward trending spectral peaks) for fundamental frequencies and overtones, the observations
here include increasing spectral peak-lines with a reduced rate of change over time (i.e., a concave
downward increase in frequency). This observation might suggest a different mechanism for the two
processes (Figures 3B and 5).
       Harmonic features in seismic data are often regarded as part of three potential processes, including
fluid-elastic [39,40,44–54], frictional-induced [38,41], and permeable flow-controlled resonance [42,46].
In the first source process (see Figure 2C label (1)), fluid-elastic resonance involves the vibrations of
cavities as a result of the motion of fluids in response to short-term perturbations (e.g., possibly the
superposition of hybrid earthquakes thought to occur as magma proceeds through the glass transition
at shallow depth [55]. In such a case, the different modes of vibration vary with the impedance contrast
(i.e., with the properties of the fluid filling the cavity) and geometry [35,56–58]. In the second source
process (Figure 2C label (2)), a frictional mechanism involves the generation of harmonic tremor by the
superposition of highly regular repetition of mostly identical stick-slip earthquakes [41]. In such a case,
the dominant frequencies vary with the elastic properties of the medium, stressing rates, and geometry,
whereas overtones are the result of a Dirac comb effect. In the third source process (see Figure 2C label
(3)), a permeable flow-controlled mechanism involves the spontaneous vibration of cavities while gas
escapes toward the surface and is the result of the transient porous flow of magmatic/hydrothermal
gases through the permeable medium that caps the cavity. In such a case, the pressure inside the
cavity is governed by the equation of a non-linear oscillator, which reduces to a linear first-order
harmonic oscillator for highly-fractured and thin (.100 m) caps [42]; hence, the specific frequencies
depend on the permeability and porosity of the cap, gas properties, supply, and geometry of the cavity.
In particular, a harmonic tremor may emerge through a Dirac comb effect when gas feeds the cavity
regularly (e.g., through bubble clouds or foam collapse, [59–61]. Alternatively, a harmonic tremor may
arise as a non-linear effect [46] or for thick (& 100 m) caps as result of the high-order terms controlling
the pressure oscillations of the cavities [42].
       At White Island, the observation of the dome in late November 2012 and the lack of strong
seismicity associated with its appearance is enigmatic and can provide some constraints regarding the
governing tremor mechanism. Persistent steam obscured the back of the crater lake and this might
imply that the dome had been emplaced much earlier, possibly around the 2 September ash venting
period shown in Figure 4. If this did mark the dome emplacement, then the slow cooling of the dome
and conduit may have contributed to the spectral gliding within the tremor. For example, the slow
progressive cooling and degassing might provide both the required seismic trigger mechanism and
the higher impedance contrast cavity to produce harmonic tremor through fluid-elastic resonance.
If a magmatic root remained beneath the dome, such a feature could hold exsolved gases within a
bubble-rich root structure; Neuberg and O’Gorman [58] have shown how such a conduit could produce
resonant tremor. If this conduit became progressively further degassed or if progressive top down
solidification occurred, this could produce a smaller conduit with time. The slowly evolving changes
in tremor might then reflect variations of the resonant root structure.
       As an alternative, the slowly evolving spectral features could be regarded as a feature of the
emplacement process if the dome were emplaced shortly before its observation in late November.
Geosciences 2020, 10, 142 9 of 13
The 2–5 Hz tremor source process at White Island, thought to be dominantly within the hydrothermal
system, is a long-term feature of the shallow volcanic system [1]. In this case, the modulation of the
shallow seismicity might reflect a longer-term intrusion process at depth. If the sub-surface magma
began its interaction with the shallow hydrothermal system about 2.5 months before the dome’s
observation, then the ascent rate of intrusion would have been very slow. We regard this alternative
as less likely due to the apparent fluidity of the dome features, however it might be relevant to the
spectral observations occurring prior to the 5 August explosive eruption (see Figure 3B).
Regarding the second source process (Figure 2), in order to produce clear overtones in the
spectrogram, the repetition interval of seismic events must be very precise. However, we do not
observe clear discrete earthquakes in the sequence (Figure 4A), so the application of a repeating
clockwork pattern, and thus frictional-induced resonance, is not easy to invoke for White Island in
this period. In any case, it might be possible for interactions of hydrothermal system fluids with
the conduit walls to act as a source of persistent micro-seismicity. Whilst the occurrence of a regular
clockwork pattern is not apparent in the waveform data (Figure 4A), it could still be part of the
underlying tremor excitation process. This process might also be only weakly periodic but still
interact with a nearby resonant cavity [62]. If, on the other hand, the dome was extruded immediately
prior to its first observation in November, it is plausible that the tremor observed over the period
September to November could be the result of interaction between the ascending magma column and
the hydrothermal system through which it is moving. In Figure 2C labeled (3), we illustrate this process
with the front of the ascending plug intruding into the overlying two-phase vapor–liquid region extant
at the time. This process could explain the earlier June to September spectral features. Temperature
gradients above the ascending magma are very high, ranging from an assumed sub-liquidus intrusion
temperature of ~ 900 ◦ C to the temperature of the vapour–liquid saturation curve. The overlying
conduit, assumed to be a porous fractured medium, is two-phase over its entire length to the surface
(see Figure 2C). This conduit could deliver non-condensable gas to an overlying compressible “gas
pocket” created beneath a partial mineralogic seal. Such a seal system is argued to be present based on
C/S ratios of vent emissions at the time [16].
Gas pockets trapped beneath permeable media or embedded in cracks within the dome may
lead to spontaneous vibrations while gas escapes toward the surface [42] but also through thermal
instabilities [54]. In these resonant gas pockets, gliding spectral behaviour results from changing
lengths of the cavity, with shorter lengths generating progressively higher frequencies over the spectral
range of 0.1 Hz to 15 Hz. It is possible that this could result from shortening of the conduit cavity
during magma ascent, although this process cannot be definitively confirmed by the existing data.
Whereas spectral gliding would be complete when the magma reaches the surface, a tremor would be
ongoing during cooling and the ongoing interaction between the plug/dome with the hydrothermal
system, as portrayed in Figure 2C.
We regard propagation and emplacement of the dome in early September as more likely due
to the strong tremor and the relatively abrupt change of the spectral patterns (Figure 3). If so, then
the perturbation of the hydrothermal system led to high levels of gas and steam discharge, which
obscured the dome, and caused the observed spectral gliding. It also may have promoted the slow
evaporation of the crater lake system, which was a central feature of the White Island crater vent for
more than 10 years before the 2012–2016 eruption episode. Regardless of the timing and mechanism
of emplacement and stabilisation, it is remarkable for a dome to be emplaced into an active wet
hydrothermal system with such subtle changes of the observed tremor patterns.
4. Conclusions
We describe the visual and seismic observations related to the onset of eruptive activity at White
Island, New Zealand, for the period June to December 2012. The period included an explosive
eruption, ash venting, and a dome emplacement episode through a ‘wet’ volcano hydrothermal system.
The period was marked by persistent elevated tremor amplitudes and slowly evolving gliding spectralGeosciences 2020, 10, 142 10 of 13
lines. At the same time, the crater lake system progressively evaporated, which encompassed the full
crater floor in June 2012 and progressed to isolated pools by the end of December 2012. Interestingly, this
progressive lake loss promoted the next phase of mud/sulphur eruptions which began in mid-January
2013 [13–16] through the pre-existent Southeast vent system (Figure 2).
We regard the injection of magma into the shallow hydrothermal system as the key driver of the
lake loss and shifts in tremor patterns in mid to late 2012. We interpret that the magmatic intrusion into
the hydrothermal system began in early September and promoted the range of seismic observations
documented here. Future work will be needed to examine the plausibility of the models outlined here
with a rigorous analytical and numerical approach.
As a final note, the 9 December 2019 White Island eruption occurred within the timeframe of the
development of this research and post-eruption unrest associated with that eruption is ongoing at
the time of writing. Hence, this work does not include new insights from this most recent eruptive
activity. At the conclusion of the present unrest period, a detailed retrospective assessment of the
progression of unrest will be critical to determine similarities and differences for the two time periods.
It is hoped that such an analysis will lead to ever-improving outcomes at difficult to monitor volcanoes
like White Island. The present work illustrates how persistent shallow magma and well-developed
hydrothermal systems may produce observations that may fit many possible conceptual models and
produce challenging monitoring conditions. It is a central goal of the volcano science community to
document such events and hence to improve monitoring outcomes for similar volcanic systems both in
New Zealand and around the globe. This work will help to assess the viability of the various models
within the context of the limited available data.
Author Contributions: Conceptualization, A.J., C.C., T.G.; B.C., and R.C.; Data curation, A.J.; Formal analysis,
A.J., C.C., T.G., and R.C.; Investigation, A.J., C.C., T.G., B.C., and R.C.; Methodology, A.J., C.C., T.G. and
R.C.; Visualization, A.J., C.C., T.G., B.C., and R.C.; Writing—original draft, A.J., C.C., T.G., B.C., and R.C.;
Writing—review and editing, A.J., C.C., T.G., B.C., and R.C. All authors have read and agreed to the published
version of the manuscript.
Funding: This research received no external funding.
Acknowledgments: This work used GeoNet seismic data which is freely available. All of the authors contributed
toward manuscript and figure production as well as the data analysis and interpretation. Photos used in this study
are from the GNS volcano database (VolcDB) and reflects the effort of the GeoNet team. A. Jolly and B. Christenson
are supported by the Ministry of Business, Innovation and Employment (MBIE) Strategic Science Investment
Fund (SSIF). T. Girona is supported by an appointment to the NASA Postdoctoral Program at the Jet Propulsion
Laboratory, California Institute of Technology, administered by Universities Space Research Association under
contract with the National Aeronautics and Space Administration. Chris Van Houtte and Tony Hurst reviewed an
earlier version of the manuscript. We thank Alicia Hotovec-Ellis, William Chadwick, and a third reviewer for their
useful comments which improved the manuscript.
Conflicts of Interest: The authors declare no conflict of interest.
References
1. Chardot, L.; Jolly, A.D.; Kennedy, B.; Fournier, N.; Sherburn, S. Using volcanic tremor for eruption forecasting
at White Island volcano (Whakaari), New Zealand. J. Volcanol. Geotherm. Res. 2015, 302, 11–23. [CrossRef]
2. Jolly, A.D.; Lokmer, I.; Thun, J.; Salichon, J.; Fry, B.; Chardot, L. Insights into fluid transport mechanisms at
White Island from analysis of coupled very long-period (VLP), long-period (LP) and high-frequency (HF)
earthquakes. J. Volcanol. Geotherm. Res. 2017, 343, 75–94. [CrossRef]
3. Jolly, A.; Lokmer, I.; Christenson, B.; Thun, J. Relating gas ascent to eruption triggering for the April 27, 2016,
White Island (Whakaari), New Zealand eruption sequence. Earth Planets Space 2018, 70, 177. [CrossRef]
4. Caudron, C.; Taisne, B.; Neuberg, J.; Jolly, A.D.; Christenson, B.W.; Lecocq, T.; Suparjanh; Syahbana, D.;
Suantika, G. Anatomy of phreatic eruptions. Earth Planets Space 2018, 70, 168. [CrossRef]
5. Walsh, B.; Procter, J.; Lokmer, I.; Thun, J.; Hurst, A.W.; Christenson, B.W.; Jolly, A.D. Geophysical
examination of the 27 April 2016 Whakaari/White Island, New Zealand, eruption and its implications
for vent physiognomies and eruptive dynamics. Earth Planets Space 2019, 71. [CrossRef]Geosciences 2020, 10, 142 11 of 13
6. Kilgour, G.N.; Gates, S.; Kennedy, B.M.; Farquhar, A.; McSporran, A.; Asher, C. Phreatic eruption dynamics
derived from deposit analysis: A case study from a small phreatic eruption from Whakaari/White Island,
New Zealand. Earth Planets Space 2019. [CrossRef]
7. Werner, C.A.; Hurst, A.W.; Scott, B.J.; Sherburn, S.; Christenson, B.W.; Britten, K.; Cole-Baker, J.; Mullan, B.
Variability of passive gas emissions, seismicity, and deformation during crater lake growth at White Island
Volcano, New Zealand, 2002–2006. J. Geophys. Res. 2008, 113, 15. [CrossRef]
8. Kazahaya, K.; Shinohara, H.; Saito, G. Excessive degassing of Izu-Oshima volcano: Magma convection in a
conduit. Bull. Volcanol. 1994, 56, 207–216. [CrossRef]
9. Stevenson, D.S.; Blake, S. Modelling the dynamics and thermodynamics of volcanic degassing. Bull. Volcanol.
1998, 60, 307–317. [CrossRef]
10. Harris, A.; Carniel, R.; Jones, J. Identification of variable convective regimes at Erta Ale Lava Lake. J. Volcanol.
Geotherm. Res. 2005, 142, 207–223. [CrossRef]
11. Cole, J.W.; Thordarson, T.; Burt, R.M. Magma Origin and Evolution of White Island (Whakaari) Volcano, Bay
of Plenty, New Zealand. J. Pet. 2005, 41, 867–895. [CrossRef]
12. Girona, T.; Costa, F.; Schubert, G. Degassing during quiescence as a trigger of magma ascent and volcanic
eruptions. Sci. Rep. 2015, 5, 18212. [CrossRef] [PubMed]
13. Jolly, A.D.; Kennedy, B.; Edwards, M.; Jousset, P.; Scheu, B. Infrasound tremor from bubble burst eruptions in
the viscous shallow crater lake of White Island, New Zealand, and its implications for interpreting volcanic
source processes. J. Volcanol. Geotherm. Res. 2016, 327, 585–603. [CrossRef]
14. Edwards, M.J.; Kennedy, B.M.; Jolly, A.D.; Scheu, B.; Jousset, P. Evolution of a small hydrothermal eruption
episode through a mud pool of varying depth and rheology, White Island, NZ. Bull. Volcanol. 2017, 79.
[CrossRef]
15. Schmid, D.; Scheu, B.; Wadsworth, F.B.; Kennedy, B.M.; Jolly, A.D.; Dingwell, D.B. A viscous-to-brittle
transition in eruptions through clay suspensions. Geophys. Res. Letts. 2017, 44, 4806–4813. [CrossRef]
16. Christenson, B.W.; White, S.; Britten, K.; Scott, B.J. Hydrological evolution and chemical structure of a
hyper-acidic spring-lake system on Whakaari/White Island. New Zealand. J. Volcanol. Geotherm. Res. 2017,
346, 180–211. [CrossRef]
17. Watts, R.B.; Herd, R.A.; Sparks, R.S.J.; Young, S.R. Growth Patterns and Emplacement of Andesitic Lava
Dome at Soufriere, Hills, Volcano, Montserrat. In The Eruption of Soufriere Hills Volcano, Montserrat, from 1995
to 1999; Druitt, T.H., Kokelaar, B.P., Eds.; The Geological Society of London: London, UK, 2002; Volume 21.
18. Bull, K.F.; Anderson, S.W.; Diefenbach, A.K.; Wessels, R.L.; Henton, S.M. Emplacement of the final lava dome
of the 2009 eruption of Redoubt Volcano, Alaska. J. Volcanol. Geotherm. Res. 2013, 259, 334–348. [CrossRef]
19. Hammer, J.E.; Cashman, K.V.; Voight, B. Magmatic processes revealed by textural and compositional trends
in Merapi dome lavas. J. Volcanol. Geotherm. Res. 2000, 100, 165–192. [CrossRef]
20. Moore, J.G.; Lipman, P.W.; Swanson, D.; Alpha, T.R. Growth of lava domes in the crater, June 1980-January
1981. In The 1980 Eruptions of Mt St. Helens; Lipman, P.W., Mullineaux, D.R., Eds.; Geological Survey research
Professor Paper; USGS: Washington, DC, USA, 1981; Volume 1250.
21. Swanson, D.A.; Dzurisin, D.; Holcomb, R.T.; Iwatsubo, E.Y.; Chadwick, W.W.; Casadevall, T.J.; Ewert, J.W.;
Heliker, C.C. Growth of the lava dome at Mount St. Helens, Washington, 1981–1983. In The Emplacement
of Silicic Domes and Lava Flows; Fink, J., Ed.; The Geological Society of America Special Paper; Geological
Society of America: Boulder, CO, USA, 1987; Volume 212, pp. 1–16.
22. Vallance, J.W.; Schneider, D.J.; Schilling, S.P. Growth of the 2004–2006 Lava-Dome Complex at Mount St.
Helens, Washington. USGS Prof. Pap. 2008, 1750, 169–208.
23. Caudron, C.; Syahbana, D.K.; Lecocq, T.; Van Hinsberg, V.; McCausland, W.; Triantafyllou, A.; Camelbeeck, T.;
Bernard, A. Kawah Ijen volcanic activity: A review. Bull. Volcanol. 2015, 77, 16. [CrossRef]
24. Sherburn, S.; Scott, B.J.; Nishi, Y.; Sugihara, M. Seismicity at White Island volcano, New Zealand: A revised
classification and inferences about source mechanism. J. Volcanol. Geotherm. Res. 1998, 83, 287–312. [CrossRef]
25. Carniel, R. Comments on the paper "Automatic detection and discrimination of volcanic tremors and tectonic
earthquakes: An application to Ambrym volcano, Vanuatu" by Daniel Rouland; Denis Legrand; Mikhail
Zhizhin; Sylvie Vergniolle. J. Volcanol. Geotherm. Res. 2010, 194, 61–62. [CrossRef]
26. Konstantinou, K.; Schlindwein, V. Nature, wavefield properties and source mechanism of volcanic tremor: A
review. J. Volcanol. Geotherm. Res. 2003, 119, 161–187. [CrossRef]Geosciences 2020, 10, 142 12 of 13
27. Carniel, R. Characterization of volcanic regimes and identification of significant transitions using geophysical
data: A review. Bull. Volcanol. 2014, 76, 848. [CrossRef]
28. Tárraga, M.; Martí, J.; Abella, R.; Carniel, R.; López, C. Volcanic tremors: Good indicators of change in
plumbing systems during volcanic eruptions. J. Volcanol. Geotherm. Res. 2014, 273, 33–40. [CrossRef]
29. Carniel, R.; Tárraga, M. Can tectonic events change volcanic tremor at Stromboli? Geophys. Res. Lett. 2006,
33, 4–6. [CrossRef]
30. Chouet, B.A.; Matoza, R.S. A multi-decadal view of seismic methods for detecting precursors of magma
movement and eruption. J. Volcanol. Geotherm. Res. 2013, 252, 108–175. [CrossRef]
31. Girona, T.; Huber, C.; Caudron, C. Sensitivity to lunar cycles prior to the 2018 eruption of Ruapehu volcano.
Sci. Rep. 2018, 8, 1476. [CrossRef]
32. Ortiz, R.; García, A.; Marrero, J.M.; De la Cruz-Reyna, S.; Carniel, R.; Vila, J. Volcanic and volcano-tectonic
activity forecasting: A review on seismic approaches. Ann. Geophys. 2019, 62. [CrossRef]
33. Caudron, C.; Girona, T.; Taisne, B.; Suparjan; Gunawan, H.; Kasbani; Kristianto. Change in seismic
attenuation as a long-term precursor of gas-driven eruptions. Geology 2019, 47, 632–636. [CrossRef]
34. Sherburn, S.; Scott, B.J.; Hurst, A.W. Volcanic tremor and activity at White Island, New Zealand,
July–September 1991. N. Z. J. Geol. Geophys. 1996, 39, 329–332. [CrossRef]
35. Neuberg, J. Characteristics and causes of shallow seismicity in andesite volcanoes. Philos. Trans. R. Soc. Lond.
A 2000, 358, 1533–1546. [CrossRef]
36. Powell, T.W.; Neuberg, J. Time dependent features in tremor spectra. J. Volcanol. Geotherm. Res. 2003, 128,
177–185. [CrossRef]
37. Lesage, P.; Mora, M.M.; Alvarado, G.E.; Pacheco, J.; Métaxian, J. Complex behavior and source model of the
tremor at Arenal volcano, Costa Rica. J. Volcanol. Geotherm. Res. 2006, 157, 49–59. [CrossRef]
38. Hotovec, A.J.; Prejean, S.G.; Vidale, J.E.; Gomberg, J. Strongly gliding harmonic tremor during the 2009
eruption of Redoubt Volcano. J. Volcanol. Geotherm. Res. 2013, 259, 89–99. [CrossRef]
39. Ripepe, M.; Gordeev, E. Gas bubble dynamics model for shallow volcanic tremor at Stromboli. J. Geophys.
Res. 1999, 104, 10639–10654. [CrossRef]
40. Julian, B.R. Volcanic tremor: Nonlinear excitation by fluid flow. J. Geophys. Res. 1994, 99, 11859–11877.
[CrossRef]
41. Dmitrieva, K.; Hotovec-Ellis, A.J.; Prejean, S.; Dunham, E.M. Frictional-faulting model for harmonic tremor
before Redoubt Volcano eruptions. Nat. Geosci. 2013, 6, 652–656. [CrossRef]
42. Girona, T.; Caudron, C.; Huber, C. Origin of shallow volcanic tremor: The dynamics of gas pockets trapped
beneath thin permeable media. J. Geophys. Res. 2019. [CrossRef]
43. Ortiz, R.; Moreno, H.; Garcia, A.; Fuentealba, G.; Astiz, M.; Pena, P.; Sanchez, N.; Tarraga, M. Villarrica
Volcano (Chile): Characteristics of the volcanic tremor and forecasting of small explosions by means of
materials failure method. J. Volcanol. Geotherm. Res. 2003, 128, 247–259. [CrossRef]
44. Chouet, B. Excitation of a buried magmatic pipe: A seismic source model for volcanic tremor. J. Geophys. Res.
1985, 90, 1881–1893. [CrossRef]
45. Chouet, B. Long-period volcano seismicity: Its source and use in eruption forecasting. Nature 1996, 380,
309–316. [CrossRef]
46. Hellweg, M. Physical models for the source of Lascar0 s harmonic tremor. J. Volcanol. Geotherm. Res. 2000,
101, 183–198. [CrossRef]
47. Johnson, J.B.; Lees, J.M. Plugs and chugs—Seismic and acoustic observations of degassing explosions at
Karymsky, Russia and Sangay, Ecuador. J. Volcanol. Geotherm. Res. 2000, 101, 67–82. [CrossRef]
48. Lane, S.J.; Chouet, B.A.; Phillips, J.C.; Dawson, P.; Ryan, G.A.; Hurst, E. Experimental observations of
pressure oscillations and flow regimes in an analogue volcanic system. J. Geophys. Res. 2001, 106, 6461–6476.
[CrossRef]
49. Balmforth, N.J.; Craster, R.V.; Rust, A.C. Instability in flow through elastic conduits and volcanic tremor. J.
Fluid Mech. 2005, 527, 353–377. [CrossRef]
50. Fujita, E.; Araki, K.; Nagano, K. Volcanic tremor induced by gas-liquid two-phase flow: Implications of
density wave oscillation. J. Geophys. Res. 2011, 116, B09201. [CrossRef]
51. Jellinek, A.M.; Bercovici, D. Seismic tremors and magma wagging during explosive volcanism. Nature 2011,
470, 522–526. [CrossRef]Geosciences 2020, 10, 142 13 of 13
52. Bercovici, D.; Jellinek, A.M.; Michaut, C.; Roman, D.C.; Morse, R. Volcanic tremors and magma wagging:
Gas flux interactions and forcing mechanism. Geophys. J. Int. 2013, 195, 1001–1022. [CrossRef]
53. Lipovsky, B.P.; Dunham, E.M. Vibrational modes of hydraulic fractures: Inference of fracture geometry from
resonant frequencies and attenuation. J. Geophys. Res. Solid Earth 2015, 120, 1080–1107. [CrossRef]
54. Montegrossi, G.; Farina, A.; Fusi, L.; de Biase, A. Mathematical model for volcanic harmonic tremors. Sci.
Rep. 2019, 9, 14417. [CrossRef] [PubMed]
55. Neuberg, J.; Tuffen, H.; Collier, L.; Green, D.; Powell, T.W.; Dingwell, D. The trigger mechanism of
low-frequency earthquakes on Montserrat. J. Volcanol. Geotherm. Res. 2006, 153, 37–50. [CrossRef]
56. Chouet, B. Resonance of a fluid-driven crack: Radiation properties and implications for the source of
long-period events and harmonic tremor. J. Geophys. Res. 1988, 93, 4375–4400. [CrossRef]
57. Kumagai, H.; Chouet, B. Acoustic properties of a crack containing magmatic or hydrothermal fluids. J.
Geophys. Res. 2000, 105, 25493–25512. [CrossRef]
58. Neuberg, J.; O0 Gorman, C. A Model of the Seismic Wavefield in Gas-Charged Magma: Application to
Soufrière Hills Volcano, Montserrat. In The Eruption of Soufrière Hills Volcano, Montserrat, from 1995 to 1999;
Druitt, T.H., Kokelaar, B.P., Eds.; Geological Society of London: London, UK, 2002; Volume 21, pp. 603–609.
59. Manga, M. Waves of bubbles in basaltic magmas and lavas. J. Geophys. Res. 1996, 101, 17457–17466.
[CrossRef]
60. Michaut, C.; Ricard, Y.; Bercovici, D.; Sparks, R.S.J. Eruption cyclicity at silicic volcanoes potentially caused
by magmatic gas waves. Nat. Geosci. 2013, 6, 856–860. [CrossRef]
61. Spina, L.; Cimarelli, C.; Scheu, B.; Di Genova, D.; Dingwell, D.B. On the slow decompressive response of
volatile- and crystal- bearing magmas: An analogue experimental investigation. Earth Planet. Sci. Lett. 2016,
433, 44–53. [CrossRef]
62. Jousset, P.; Neuberg, J.; Sturton, S. Modelling the time-dependent frequency content of low-frequency
volcanic earthquakes. J. Volcanol. Geotherm. Res. 2003, 128, 201–223. [CrossRef]
© 2020 by the authors. Licensee MDPI, Basel, Switzerland. This article is an open access
article distributed under the terms and conditions of the Creative Commons Attribution
(CC BY) license (http://creativecommons.org/licenses/by/4.0/).You can also read