Hydrophobic multiscale cavities for high-performance and self-cleaning surface-enhanced Raman spectroscopy (SERS) sensing - De Gruyter
←
→
Page content transcription
If your browser does not render page correctly, please read the page content below
Nanophotonics 2020; 9(16): 4761–4773

Research article

Xiaofei Zhao, Chundong Liu, Jing Yu, Zhen Li, Lu Liu, Chonghui Li, Shicai Xu, Weifeng Li,
Baoyuan Man* and Chao Zhang*

Hydrophobic multiscale cavities for high-
performance and self-cleaning surface-enhanced
Raman spectroscopy (SERS) sensing
https://doi.org/10.1515/nanoph-2020-0454                                  PSi/MoS2/Au MSCs can serve as highly sensitive, uniform,
Received August 6, 2020; accepted October 6, 2020;                        and stable SERS substrates for rhodamine 6G (R6G), crystal
published online October 26, 2020                                         violet, and adenosine triphosphate detection, benefiting
                                                                          from the synergistic effect of the enhanced light trapping
Abstract: Cavity array, with excellent optical capture
                                                                          and the effective plasmonic couple. The couple of the
capability, has received increasing attention for the
                                                                          plasmon in the MSCs is evidently proved by finite-
surface-enhanced Raman spectroscopy (SERS)-active
                                                                          difference time domain simulation, showing the strong
substrates. Here, we proposed molybdenum disulfide
                                                                          electromagnetic field is located around the cavity wall.
(MoS2) nanocavities growing on pyramid Si (PSi) composed
                                                                          Moreover, the excellent hydrophobicity of the PSi/MoS2/
of in situ reduced Au nanoparticles (AuNPs), which can
                                                                          AuNPs substrate endows it with the ability for the direc-
form the multiscale cavities (MSCs), and is facile for
                                                                          tional monitoring of organic pollutant in a mixture of oil
the couple of the plasmon. We demonstrated that the
                                                                          and water. Finally, we demonstrated the MSCs with
                                                                          outstanding photocatalytic performance could achieve the
                                                                          renewable utilization by self-cleaning, which was attrib-
*Corresponding authors: Baoyuan Man, Collaborative Innovation             uted to the fast electron transfer and effective light ab-
Center of Light Manipulations and Applications in Universities of
                                                                          sorption. The proposed PSi/MoS2/AuNPs MSC represents a
Shandong School of Physics and Electronics, School of Physics and
                                                                          robust mean using the plasmonic metal/semiconductor
Electronics, Shandong Normal University, Jinan 250014, P.R. China,
E-mail: byman@sdnu.edu.cn; and Chao Zhang, Collaborative                  heterostructure for high-performance SERS sensors and
Innovation Center of Light Manipulations and Applications in              photodegradation.
Universities of Shandong School of Physics and Electronics, School of
Physics and Electronics, Shandong Normal University, Jinan 250014,        Keywords: hydrophobic; multiscale cavities; self-cleaning;
P.R. China; and Institute of Materials and Clean Energy, Shandong         SERS sensing.
Normal University, Jinan 250014, P.R. China,
E-mail: czsdnu@126.com. https://orcid.org/0000-0002-3295-8980
Xiaofei Zhao, Chundong Liu and Lu Liu, Collaborative Innovation           1 Introduction
Center of Light Manipulations and Applications in Universities of
Shandong School of Physics and Electronics, School of Physics and
Electronics, Shandong Normal University, Jinan 250014, P.R. China
                                                                          Raman spectroscopy can give molecule-specific informa-
Jing Yu and Zhen Li, Collaborative Innovation Center of Light             tion about the chemical compound as nondestructive
Manipulations and Applications in Universities of Shandong School of      analysis tool. However, it is difficult to detect molecules at
Physics and Electronics, School of Physics and Electronics, Shandong      low concentration because of poor Raman cross-section
Normal University, Jinan 250014, P.R. China; and Institute of Materials   area [1, 2]. To increase the sensitivity of Raman spectros-
and Clean Energy, Shandong Normal University, Jinan 250014, P.R.
                                                                          copy, various enhancement techniques such as resonance
China
Chonghui Li, Collaborative Innovation Center of Light Manipulations       Raman spectroscopy [3], tip-enhanced Raman spectros-
and Applications in Universities of Shandong School of Physics and        copy [4], and surface-enhanced Raman spectroscopy
Electronics, School of Physics and Electronics, Shandong Normal           (SERS) [5–7] have been researched in the last few decades.
University, Jinan 250014, P.R. China; and Institute for Integrative       Among them, SERS has been intensively considered as a
Nanosciences, IFW Dresden, Dresden, 01069, Germany
                                                                          powerful analysis technique for molecule detection at
Shicai Xu, College of Physics and Electronic Information, Dezhou
University, Dezhou 253023, P.R. China
                                                                          super-low concentration, even down to single molecule
Weifeng Li, School of Physics and State Key Laboratory of Crystal         level, because the rational design of SERS substrates can be
Materials, Shandong University, Jinan, Shandong, 250100, P.R. China       made to form abundant hot spots [8–10]. It is generally
  Open Access. © 2020 Xiaofei Zhao et al., published by De Gruyter.        This work is licensed under the Creative Commons Attribution 4.0
International License.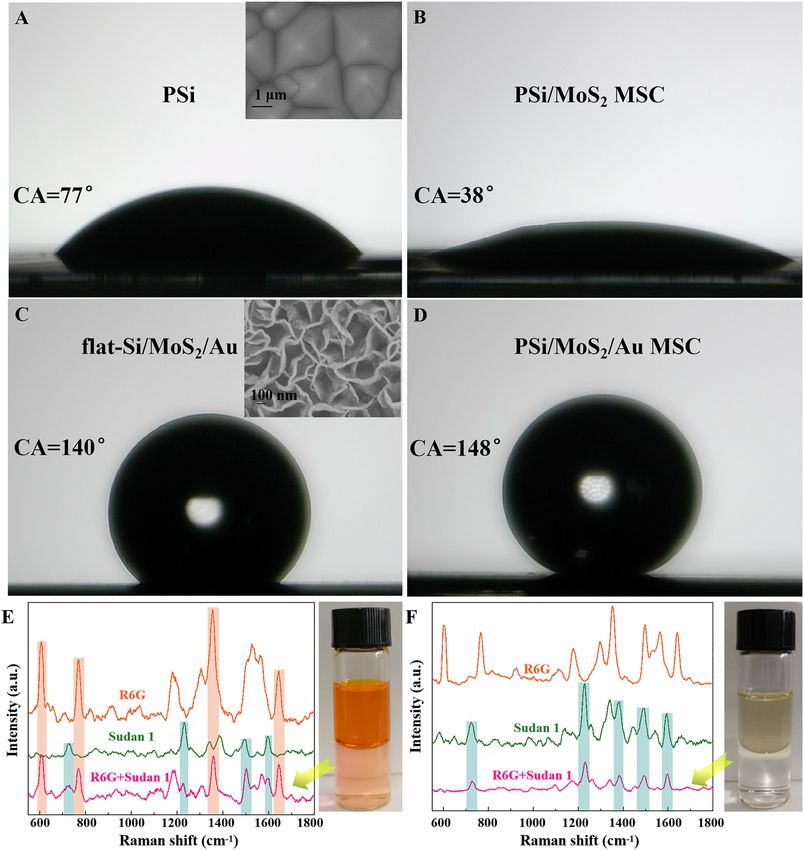
4762         X. Zhao et al.: Hydrophobic multiscale cavities

accepted that the SERS effect for amplifying Raman signal         enhancement. It is found that the as-fabricated substrate
arises from two mechanisms: localized electromagnetic             is highly efficient to detect rhodamine 6G (R6G), crystal
field (electromagnetic mechanism with an enhancement               violet (CV), and adenosine triphosphate (ATP) molecules
factor [EF] of ∼106–108) and charge-transfer complexes            at low concentration because of the light trapping of MSC
(chemical mechanism with an EF of ∼102–104) [11, 12].             structure and formation of denser “hot spots”. In addi-
     To greatly enhance the SERS performance, cavity              tion, the as-prepared MSCs possess excellent hydropho-
structures have attracted increasing attention in the last few    bicity after decoration with AuNPs, which can realize
years, which can trap the laser, increase the light path, and     directional monitoring in oil-water-mixed solution. The
further promote the interactions between photons and              excellent photocatalysis of the prepared substrate can
absorbed molecules [13]. Tian et al. prepared the bottom          effectively degrade organic pollutants, which makes it
bowl-shaped silver cavity thin film layer by electrodeposi-        possible to achieve the renewable utilization by self-
tion using polystyrene spheres as a template for SERS             cleaning feature attributed to effective absorption of
detection [14]. Hyungsoon et al. form self-assembled plas-        visible light, abundant exposed catalytic active sites, and
monic nanoring cavity arrays alongside the curvature of           fast electron transfer. This hybrid sensor that uses the
highly packed metallic nanosphere gratings for SERS               combination of MoS2 and AuNPs will expand the appli-
detection of the biological analyte and adenine [15]. Zuo         cation of the semiconductor and gain a better under-
et al. fabricated the conical silver nanocavity by depositing     standing of their basic properties.
Ag with different thickness on porous alumina templates
with V-shaped nanopores [16]. However, these methods
commonly require complex fabrication processes with all
                                                                  2 Experimental section
kinds of templates, which has greatly limited the practical
application for high-performance and reliable SERS sub-
                                                                  2.1 Preparation of PSi/MoS2 MSCs
strates. As we all know, semiconductor-based SERS sub-
                                                                  A PSi substrate with a size of 1 × 1 cm2 was fabricated by the
strates have been one of the most popular materials because
                                                                  wet texturing technology with the aid of the anisotropic
of their novel optoelectronic and nanoelectronic properties
                                                                  etching property, which was described in our early work
[17]. Especially, molybdenum disulfide (MoS2) possesses
                                                                  [23]. The PSi samples with the same size were cleaned by
catalytic activity at edge sites with the inert characteristic,
                                                                  acetone, alcohol, and deionized water (DI water) for 20 min
which is considered as a catalyst and a promising sup-
                                                                  in sequence in an ultrasonic cleaner. The 3D MoS2 nano-
porting material [18]. Various techniques have been
                                                                  sheets were synthetized on the PSi substrate by a facile one-
adopted to fabricate MoS2 by lithium intercalation [19],
                                                                  step hydrothermal method. Briefly, Na2MoO4·2H2O (1.69 g)
mechanical exfoliation [20], or thermal decomposition [21].
                                                                  and CH4N2S (2.28 g) were dissolved in a mixed solution of DI
Most of these programs are complicated and dangerous and
                                                                  water (15 mL) and ethanol (15 mL) under vigorous stirring,
hard to control the size, shape, and dimension.
                                                                  and then the mixed solution was transferred into a 50-mL
     In the light of the aforementioned problems, we
                                                                  Teflon-lined stainless steel autoclave. The PSi substrate was
directly grow 3D MoS2 nanocavity over pyramid Si micro-
                                                                  gently placed in the autoclave, which was heated at 180 °C
structure by hydrothermal synthesis to form the multiscale
                                                                  for 7 h after sealed with a lid and then cooled to room
cavities (MSCs) and increase the number of exposed active
                                                                  temperature naturally. The resultant PSi/MoS2 MSCs were
edge sites for compositing with Au nanoparticles (AuNPs)
                                                                  washed with DI water continuously and then dried under
to further enhance the SERS sensor signal (named as pyr-
                                                                  vacuum at room temperature.
amid Si [PSi]/MoS2/Au MSCs). The hydrothermal method
could control over the morphology effectively and exempt
from the high temperature and toxic gases [22]. Here, the         2.2 Decoration of AuNPs in the PSi/MoS2
green and convenient method has been developed to                     MSCs
fabricate the MoS2 cavities with appropriate surface
roughness and active sites, which can promote in situ             The AuNPs were decorated on the MoS2 nanosheets to form
growth of AuNPs on MoS2 nanosheets’ surface. The pro-             PSi/MoS2/Au hybrid MSCs by in situ reduction reaction of
posed MSC structure possesses excellent optical capture           HAuCl4. In this process, the prepared PSi/MoS2 substrates
capability and can further facilitate the interactions            were immersed in 1-mM HAuCl4 with different reaction
between photons and absorbed molecules. The SERS ca-              times of 1, 2, 3, 4, and 5 min to generate AuNPs and then
pabilities can be optimized by tailoring the particle density     transferred into DI water to remove residual HAuCl4. At
and size in the MoS2 cavity configurations introducing             last, the PSi/MoS2/AuNPs MSC substrates were dried at
extra “hot spots” to generate strong electromagnetic field         room temperature.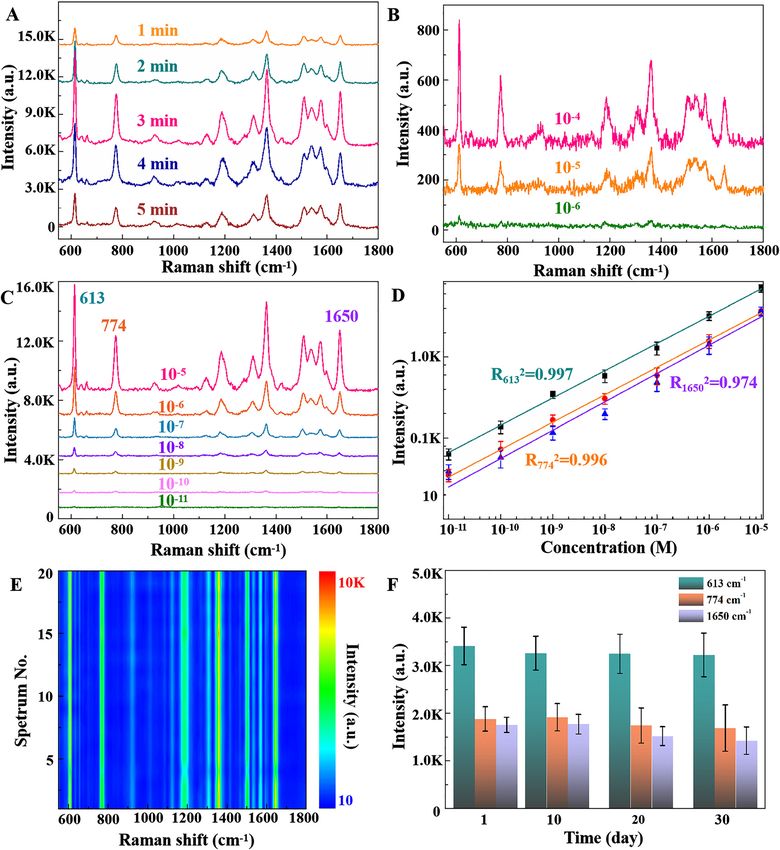
X. Zhao et al.: Hydrophobic multiscale cavities    4763

2.3 Apparatus and characterization                              2.6 FDTD simulations

The structure and morphologies of the prepared samples          The reflection spectra and the electromagnetic field distribu-
were studied by the scanning electron microscope (SEM)          tions were simulated with finite-difference time domain
(ZEISS Sigma500 at 5.0 kV) with energy-dispersive               (FDTD) simulation. In theoretical simulations, the absorption
spectrometer (EDS) (at 20 kV operated at 200 kV). The           boundary condition is the perfect matching layer. A linearly
more detailed morphology and composition were char-             polarized monochromatic plane wave with 532-nm wave-
acterized by transmission electron microscope (TEM,             length was irradiated onto the sample with the polarization
JEM-2100F) and a high-resolution TEM (HRTEM) equip-             along the x-direction. The geometrical parameters of the
ped with selected area electron diffraction (SAED). X-ray       structures were obtained from the SEM measurements with an
diffraction (XRD) (SmartLab9) pattern was recorded to           average 12-nm wall thickness, 150-nm length, and 100-nm
identify the crystal phase with Cu-Kɑ radiation. X-ray          pore calibre of MoS2 nanocavity and an average diameter of
photoelectron spectroscopy (XPS) (Thermo Fisher Sci-            8 nm and interparticle gap of 3 nm for AuNPs. The average
entific 250Xi) was carried out to analyze surface chem-          height and average space for PSi are 3 and 4 μm, respectively.
icals, composition, and the valence state of prepared           A mesh size of 0.8 nm for all axes was used. The refractive
substrate.                                                      index data of MoS2 were obtained from Beal and Huges [24].
                                                                The dielectric data of Au and Si were from the studies by Babar
                                                                and Weaver and Schinke et al. respectively [25, 26].
2.4 SERS spectrum measurement

R6G and CV molecules were successively diluted with
alcohol solution from the concentration of 10−3 to 10−11 M by   3 Results and discussion
factors of 10, and 4 μL of the molecule solution was drop-
ped on the surface of the substrate and dried up naturally      The morphology of the as-grown MoS2 nanosheets on PSi
before SERS detection. The average intensities of the           was characterized with SEM, where we can observe the
Raman signal at random six positions on the substrate were      MSCs clearly (PSi microcavity and MoS2 nanocavity), as
used to reduce measurement errors. SERS spectra were            shown in Figure 1A. After hydrothermal treatment for 7 h,
performed on a Raman spectrometer (Horiba HR Evolution          the vertical MoS2 exhibits closely aligned flake-like struc-
800) at a laser wavelength of 532 nm. To reduce the pho-        ture with an average 12-nm wall thickness and 100-nm pore
tocatalytic and photochemical degradation caused by laser       calibre, which is tightly attached on the PSi surface and
illumination, the laser power was set as 0.48 mW with an        forms the nanocavities. After the MoS2 nanosheets react
integration time of 4 s and diffraction grid of 600 g/nm. A     with HAuCl4, denser AuNPs were decorated on the surface
50× objective was used to focus the laser beam on the           of MoS2 nanosheets with an average diameter of 8 nm and
substrate.                                                      an interparticle gap of 3 nm as presented in Figure 1B. The
                                                                vertically growing MoS2 nanosheets decorated with AuNPs
                                                                on the PSi presents a MSC, which can effectively trap light
2.5 Recyclable SERS detection                                   and improve the utilization of light. To further validate the
                                                                combination of the metallic particle and semiconductor
First, we dropped 10−7M R6G on the PSi/MoS2/AuNPs               materials, TEM is performed as shown in Figure 1C, where
MSC samples and collected the SERS signal. After that,          the AuNPs and MoS2 can be clearly observed, indicating
we immersed MSC samples in the DI water and irradiated          that the MoS2 nanosheets can act as an efficient substrate
it with a 300-W xenon lamp with a cut-off filter                 for the nucleation and growth of AuNPs. Moreover, the
(λ > 420 nm) as a visible light source. The distance be-        HRTEM in Figure 1D was measured to further analyze detail
tween the sample and the light was 20 cm. The sample            structures, where the size of AuNPs is consistent well with
was taken out from the DI water every 15 min and rinsed         that in SEM. The two distinct interlayer spacing with values
with the clean DI water several times to remove residual        of 0.62 and 0.23 nm is in agreement with the (002) plane of
molecules and dried at room temperature. The degra-             MoS2 nanosheets and the main (111) plane of AuNPs,
dation of R6G was monitored by measuring its SERS               respectively. The SAED pattern of the hybrid is shown in
spectra until no SERS signal was detected. The substrate        Figure 1E, in which the diffraction rings of MoS2 (002) and
was reused for detection and photocatalysis of R6G              Au (111) are well indexed to that observed in HRTEM, and
molecules three times.                                          the 004 and 106 planes of MoS2 can also been identified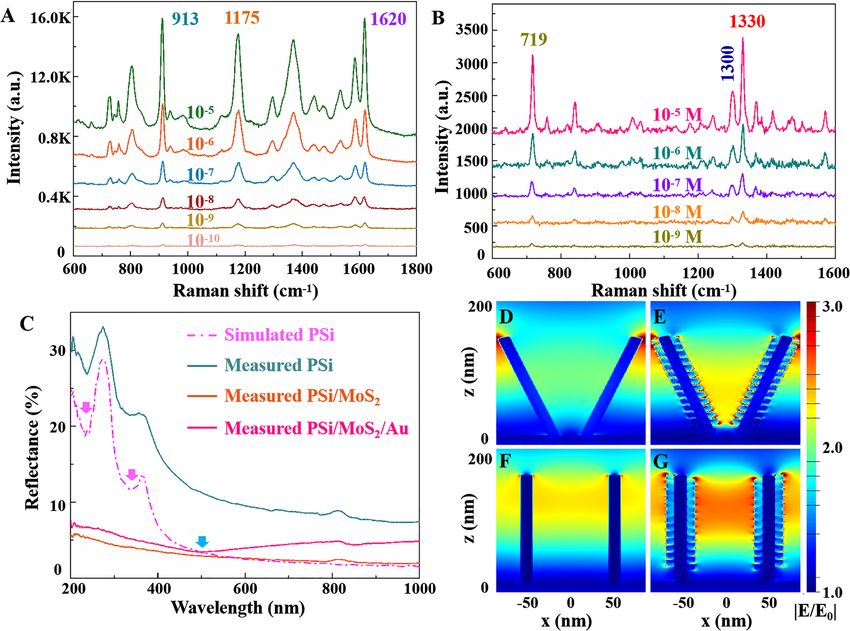
4764          X. Zhao et al.: Hydrophobic multiscale cavities

Figure 1: Structural characterization of molybdenum disulfide (MoS2)-based substrates.
Scanning electron microscope (SEM) morphology characterization of (A) pyramid Si (PSi)/MoS2 and (B) PSi/MoS2/Au multiscale cavity (MSC)
substrate. (C) Transmission electron microscope (TEM) image of Au nanoparticles (AuNPs) decorated on the MoS2 nanosheets. (D) High-
resolution transmission electron microscope (HRTEM) image of AuNPs decorated on the MoS2 nanosheets. (E) The selected area electron
diffraction (SAED) pattern of MoS2/Au. (F) The corresponding energy-dispersive spectrometer (EDS) spectrum. (G) EDS elemental maps from
Mo, S, and Au on the PSi/MoS2/Au MSC sample.

from Figure 1E with lattice spacing of 0.31 and 0.16 nm.             orbital, which suggests that the IV oxidation state of Mo4+
Furthermore, the corresponding EDS spectra of TEM in                 plays a dominant role in the MoS2 matrix [27]. Besides, the S
Figure 1F prove the distribution and coexistence of S, Mo, and       2s peak corresponds to 226.34 eV, and Mo6+ peak at
Au elements, and the atomic contents are 65.5, 30.6, and 3.9%        236.08 eV (caused by the oxidation of the MoS2 surface)
of Mo, S, and Au, respectively. The local composition of the         was also obvious [28]. Meanwhile, in the high-resolution S
sample is also measured with EDS elemental mappings of               2p spectrum of Figure 2C, there are two separated peaks at
SEM shown in Figure 1G, which clearly reveals the presence of        163.19 and 162.09 eV, respectively, assigned to the S 2p1/2
Mo (blue), S (yellow), and Au (orange) in the substrate. All the     and S 2p3/2 orbital of divalent sulfide ions (S2−) derived from
characteristics strongly demonstrate the heterostructure of          MoS2 [21]. In Figure 2D, the two peaks of Au 4f5/2 and Au 4f7/2
MoS2 and Au is successfully synthesized.                             at 88.27 and 84.57 eV supported the insertion of crystallized
     XPS spectra were carried out to analyze the elemental           Au [29]. Furthermore, the XRD patterns of PSi/MoS2 and PSi/
composition and chemical states of the PSi/MoS2/Au MSC               MoS2/Au MSC in Figure 2E are presented to better under-
substrates quantitatively and qualitatively. Figure 2A               stand the structural information and element composition,
depicts the XPS survey spectrum of the substrate, where              in which both samples possess the almost same diffraction
besides the C 1s (285.0 eV) and O 1s (532.5 eV), the Mo, S,          peaks (marked by blue pentagram) at 35.84° and 58.11°,
and Au elements are all presented among the spectra.                 corresponding to the 102 and 110 planes of MoS2. There is a
Figure 2B–D presents the high-resolution spectra of the Mo           significant peak of PSi/MoS2 XRD spectra at 29.20° corre-
3d, S 2p, and Au 4f regions of PSi/MoS2/Au MSC substrates,           sponding to MoS2 (004) planes, which is also obvious in
respectively. As shown in Figure 2B, the high-resolution             SAED (Figure 1E). The three characteristic peaks of PSi/
XPS scan of Mo 3d identified the two characteristic peaks at          MoS2/Au MSC (marked by orange shuriken) at 38.26°,
229.14 and 232.36 eV arising from the Mo 3d5/2 and Mo 3d3/2          44.40°, and 64.75° are clearly noticed, corresponding to the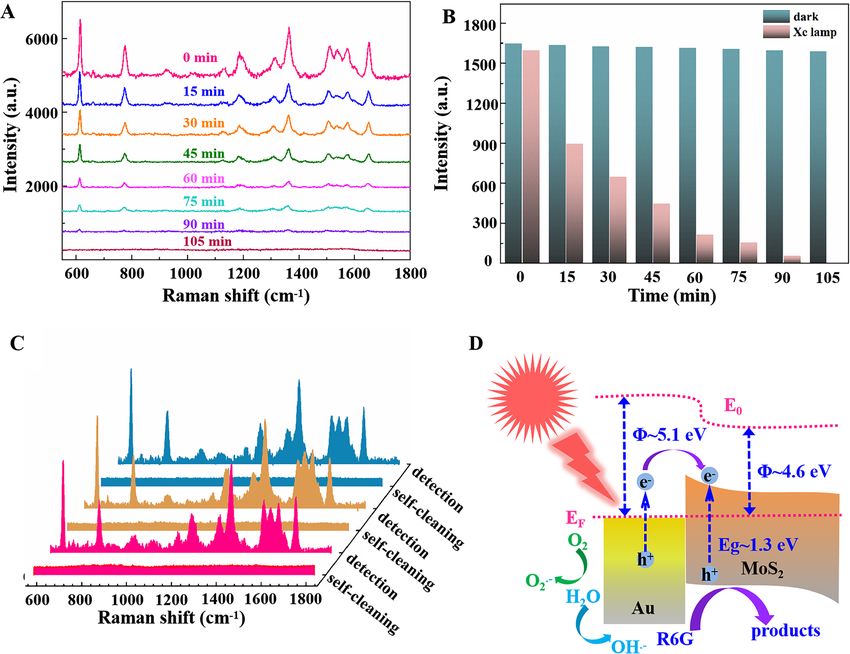
X. Zhao et al.: Hydrophobic multiscale cavities        4765

Figure 2: X-ray photoelectron spectroscopy (XPS), X-ray diffraction (XRD), and correspondingly surface-enhanced Raman spectroscopy (SERS)
comparison.
XPS spectra in (A) survey, (B) Mo 3d, (C) S 2p, and (D) Au 4f regions of pyramid Si (PSi)/ molybdenum disulfide (MoS2)/Au multiscale cavity
(MSC) substrates. (E) XRD patterns of different samples: PSi/MoS2, and PSi/MoS2/Au. (F) SERS spectra of MoS2 on PSi/MoS2 MSC and PSi/
MoS2/Au MSC substrate.

111, 200, and 220 planes of Au, indicating the formation of            time up to 2 min, the AuNPs become bigger than that of
AuNPs. A comparison of Raman spectra from 200 to                       1 min but still sparse around MoS2 nanosheets as shown in
1600 cm−1 of the MoS2 from PSi/MoS2 and PSi/MoS2/Au MSC                Figure 3C. Further increasing the time to 3 min, the vertical
substrate is displayed in Figure 2F. The pristine PSi/MoS2             MoS2 nanosheets were evenly covered by dense AuNPs
MSC exhibits two representative vibration peaks at around              (Figure 3D), and the space between AuNPs was quite nar-
378 and 406 cm−1, assigned to the in-plane vibrations of Mo            row, forming MoS2-AuNPs composite cavities. With the
and S atoms (E 12g ) and the out-of-plane lattice vibration of S       further increase of the reaction time to 4 min, the MoS2
atoms (A1g), respectively [30], where no other background              nanosheets are all hid under the Au film but still retained
Raman signal is detected except for Si at 521 cm−1. From the           sheet structure as shown in Figure 3E. When the reaction time
detailed inset of Figure 2F, it can be clearly observed the            was up to 5 min, the structure of MoS2 cavities is not obvious,
Raman modes of the pristine sample suffers a red shift by              which is filled with the thick Au (Figure 3F). Based on the
about 2 cm−1 after introduction of AuNPs on the MoS2                   aforementioned experiment, it is clear that the MoS2 cavities
nanosheets, indicating a strong interaction between the                were gradually covered by more and more Au with the in-
AuNPs and the MoS2 nanosheets [31]. Furthermore, the in-               crease of the reaction time, which is a key factor that affects
tensity of the two characteristic peaks has enhanced after             the morphology and performance of the composite substrate.
decoration with AuNPs, which can be ascribed to the strong                  Figure 4A shows the change of the Raman signal in-
electromagnetic field and denser “hot spots” arising from               tensity for R6G alcoholic solution (10−5M) detected on the
AuNPs. In brief, the aforementioned characterizations                  PSi/MoS2/Au MSC with increasing the reaction time from 1 to
demonstrated the success of the MoS2/Au hybrid structure,              5 min. The reason to choose the R6G alcoholic solution is
which could be used in the following SERS detection.                   that the excellent hydrophobicity of the proposed MSC
     To explore the optimized SERS effect of PSi/MoS2/Au               structure makes the water solution hardly load in the cavity,
MSC, MoS2 nanosheets were reacted with HAuCl4 at                       which will be further discussed in the following section. It is
different times, as characterized in Figure 3. When the re-            apparent the SERS activity enhances with an increasing
action time is 1 min, there are only patchy AuNPs loaded on            reaction time from 1 to 3 min because of the formation of
the MoS2 nanosheets (Figure 3B) compared with pristine                 more and more AuNPs around MoS2 cavities and decreases
PSi/MoS2 (Figure 3A), and the size of AuNPs is not uniform,            with further increasing the time from 3 to 5 min probably
which is in the early stages of nucleation. With the reaction          because of excessive aggregation of AuNPs, which will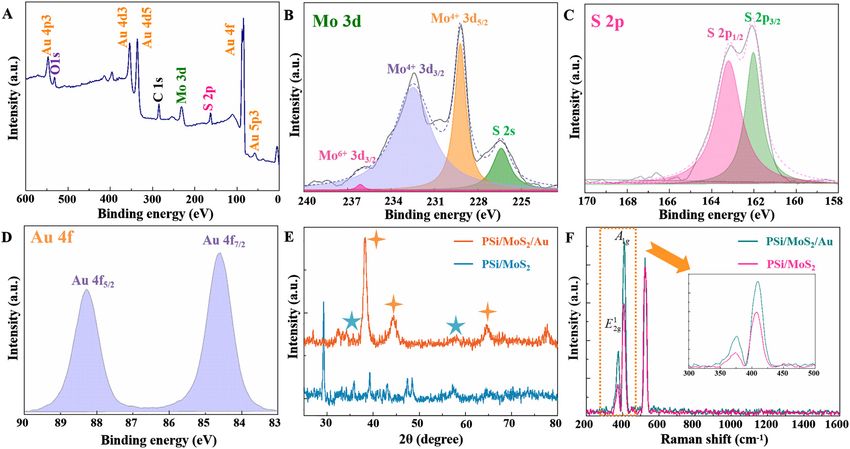
4766          X. Zhao et al.: Hydrophobic multiscale cavities

Figure 3: Scanning electron microscope (SEM) images of molybdenum disulfide (MoS2)-based substrate.
SEM images of (A) pyramid Si (PSi)/molybdenum disulfide (MoS2) multiscale cavity (MSC) with magnification; (B–F) PSi/MoS2/Au MSC with
different reaction times of HAuCl4 at 1, 2, 3, 4, and 5 min.

weaken the plasmonic couple. Therefore, it can conclude            MSC (Figure S1B), suggesting MoS2 nanocavities play an
the optimal SERS performance is obtained at a reaction time        important role in SERS detection, which can form a focusing
of 3 min, which is maintained to further research throughout       field for light trapping and further improve the SERS sensi-
the following experiments. As a contrast, Raman spectra of         tivity. In addition, the SERS performance of PSi/MoS2 and
R6G absorbed on pristine PSi/MoS2 MSC in Figure 4B were            PSi/MoS2/Au MSC is compared more intuitively in
detected with the limit of detection (LOD) of 10−6M, which         Figure S1B; it can be observed that the intensity of
can be ascribed to the weak charge-transfer mechanism [32].        10−5 M R6G on PSi/MoS2/Au MSC has much enhanced than
After loading AuNPs inside the MoS2 cavities at a reaction         PSi/MoS2 because of the localized surface plasmon reso-
time of 3 min, the baseline-corrected Raman peak of R6G            nance (LSPR) of AuNPs.
with different concentrations from 10−5 to 10−11M is drawn,             To quantize the SERS performances of the PSi/MoS2/
Figure 4C, in which the main characteristic peaks at 613, 774,     Au MSC, the EF was evaluated using the formula [35]:
and 1650 cm−1 are assigned to the C–C–C deformation
                                                                                                  I SERS N SERS
in-plane vibration, out-of-plane bending, and aromatic C–C                                 EF
                                                                                                     I RS N RS
stretching, respectively [33, 34]. Although the Raman in-
tensity of R6G is reduced with the decrease in R6G concen-         where ISERS and IRS represent the intensity of SERS
tration, the characteristic peaks can still be observed at         spectra and normal Raman and NSERS and NRS refer to the
concentrations as low as 10−11M, and the LOD is five orders of      average number of molecules within the laser spot
magnitude lower than that of pristine PSi/MoS2 MSC.                excited by SERS and normal Raman, respectively. Here,
Figure 4D presents the intensity with error bar (from same         the value of NRS/NSERS was estimated with the ratio of the
sample but different positions) at 613, 774, and 1650 cm−1 as      respective molecule concentrations [36]. The minimum
a function of the R6G concentrations under the log scale,          detection concentration is 10−11M and the intensity of the
which, respectively, fits the linearity well with correlation       SERS peak at 613 cm−1 is 64, whereas for normal Raman,
coefficient (R 2) values of 0.997, 0.996, and 0.974, thus           the intensity of 10−3M R6G on SiO2 flake is 98. Conse-
having a great potential for sensitive and quantitative            quently, the EF of the PSi/MoS2/Au MSC is calculated as
detection of the dye. To evaluate the role of MoS2 nano-           6.5 × 10⁷. Compared with other MoS2/Au substrates in
cavity, the SERS performance of PSi/Au substrate was               Table 1, PSi/MoS2/Au MSC possesses a higher EF and
compared with PSi/MoS2/Au MSC. Here, we use the thermal            sensitivity by virtue of the MSC structure. The excellent
evaporation method to deposit the same-size AuNPs on PSi           sensitivity of the prepared substrate can be attributed to
with a diameter of 8 nm (Figure S1A), the SERS intensity of        ultranarrow nanogaps between AuNPs and a strong
10−5 M R6G on PSi/Au is much weaker than PSi/MoS2/Au               focusing field within the MSCs.
X. Zhao et al.: Hydrophobic multiscale cavities 4767
Figure 4: Surface-enhanced Raman spectroscopy (SERS) performance of R6G on different substrates.
(A) Raman spectra of R6G alcoholic solution (10−5 M) detected on the pyramid Si (PSi)/molybdenum disulfide (MoS2)/Au multiscale cavity
(MSC) with different reaction time. (B) Raman spectra of R6G alcoholic solution from 10−4 to 10−6M on the PSi/MoS2 MSC substrate. (C) Raman
spectra of R6G (the concentration from 10−5 to 10−11M) on the PSi/MoS2/Au MSC SERS substrate. (D) Linear relationships: Raman intensities at
613, 774, and 1650 cm−1 as a function of the concentrations of R6G molecules. (E) The contour image of R6G (10−5M) detected at 20 random
positions on PSi/MoS2/Au MSC SERS sample. (F) The stability: The intensity of three main characteristic peaks (10−6M) detected on the PSi/
MoS2/Au MSC SERS substrate per 10 day.
The homogeneity is an important index for SERS sub- 13.24%, respectively, shown in Figure S2A. Moreover, we
strate apart from sensitivity, which was proved by the have randomly selected a region of 20 × 20 μm2 to measure
contour in Figure 4E. This graph is made up of the intensity the mapping at 613 cm−1 of 10−5M R6G molecules dispensed
of 10−5M R6G detected from 20 positions at the PSi/MoS2/ on the PSi/MoS2/Au MSC substrates, which shows a small
Au MSC, where the same colour presents the same in- fluctuation in Figure S2B. It can be concluded the SERS
tensity. To better illustrate the uniformity, the relative substrate possesses outstanding homogeneity, ascribing to
standard deviation of the intensity at 613, 774, and the uniform distribution of AuNPs. Furthermore, we also
1650 cm−1 was calculated with value of 4.15, 9.76, and verify the stability of the PSi/MoS2/Au MSC for SERS4768 X. Zhao et al.: Hydrophobic multiscale cavities
Table : The sensitivity of different MoS/Au SERS substrates. wavelength region, implying more intense light utilization
in the MSCs. Especially, there is a plasmon resonance of
Substrate Analytes EF References PSi/MoS2/Au MSCs at about 500 nm (indicated by the blue
AuNPs@MoS- nanocomposite RG . × [] arrows) corresponding to the Raman excitation wave-
T-H MoS/Au heterostructure RG . × [] length of 532 nm because of the decoration of denser
D glass fiber-MoS@AuNP CV . × []
AuNPs.
MoS nanoflowers/AuNPs RG . × []
To better understand the enhancement mechanism of
PSi/MoS/Au MSC RG . × This work
this PSi/MoS2/Au MSC SERS-active substrate, the local
AuNPs, Au nanoparticles; CV, crystal violet; MoS, molybdenum
electric field distributions at x-z cross-section of the struc-
disulfide; MSC, multiscale cavity; PSi, pyramid Si; SERS, surface-
tures were analyzed by the FDTD simulations. The ability of
enhanced Raman spectroscopy.
micron-size pyramidal cavity for light trapping has been
explored and demonstrated in our previous work [21, 23].
detection in Figure 4F. The intensity of three main R6G Consequently, here we only research the electric field dis-
characteristic peaks with error bar (from the same sample tributions of the nanocavities with trumpet-like shape and
but a different position) at 613, 774, and 1650 cm−1 is pre- rectangular shape, which represents the multiform nano-
sented with placement time per 10 days, which is almost no structure according to the SEM morphology. The local
change by the virtue of the outstanding inertia of AuNPs. In electric field distributions of the pristine MoS2 cavity are
general, the PSi/MoS2/Au MSC has great promise in SERS illustrated in Figure 5D and F, where the electric field is
application for low-concentration molecular detection. concentrated within the cavities because of the aggrega-
To illustrate the practicability of the PSi/MoS2/Au MSC, tion of incident light. The MoS2/Au cavities in Figure 5E and
the CV alcoholic solution was detected on the SERS sub- G present a similar focusing field as the pristine MoS2
strate with different concentrations from 10−5 to 10−10M, cavity, although with the relatively strong field strength.
and the corresponding SERS spectra are shown in Interestingly, the higher near-field enhancements exists at
Figure 5A. It can be observed that the Raman signal grad- tip in Figure 5E because the field is transformed into a
ually diminishes when the CV concentration decreases propagating plasmon and transported from the apex along
from 10−5 to 10−10M, and the main characteristic peaks can the taper in the reverse direction with excellent nano-
still be clearly identified even when the concentration focusing ability [39–41]. Furthermore, the maximum in-
reaches 10−10M. As shown in Figure S3, a well-defined tensity of the focusing field is located around the AuNPs
linear relationship can be obtained with a R2 values of and between the adjacent gaps in cavity, which can attri-
0.997, 0.998, and 0.995 corresponding to 913, 1175, and bute to the strong coupling between the cavity mode and
1620 cm−1, respectively. In addition, the Raman spectra of the localized surface plasmons of the AuNPs. Therefore,
ATP from 10−5 to 10−9M were also measured in Figure 5B, abundant hot spots are generated on the sidewalls of cavity
which play important roles in energy storage and signaling where the probe molecules are adsorbed, contributing to
of biological information. The characteristic peaks of ATP the excellent SERS activity of the PSi/MoS2/Au MSC array.
at 719, 1300, and 1330 cm−1 are clearly observed even down Furthermore, except for the excellent light capture
to 10−9M. These results assure that the PSi/MoS2/Au MSC capability of MSCs, the MSC structure endows it with ver-
hybrid substrate can be a potential SERS matrix in practical satile hydrophobic performance, which was investigated
applications with excellent sensitivity because of the on the PSi, PSi/MoS2 MSC, flat-Si/MoS2/Au, and PSi/MoS2/
multiple reflection and scattering of electromagnetic Au MSC substrate. As shown in Figure 6A, the water contact
waves. angle on PSi is about 77°, which demonstrates its hydro-
The MSC structure can effectively trap incident light, philic substrate due to the fairly smooth surface of the PSi
improve the utilization of light, and couple with the plas- (the morphology of the PSi is in the inset of Figure 6A).
mon across a wide spectral range, which is revealed by the However, after the MoS2 cavities covered on PSi, the water
reflectance spectrum in Figure 5C. The PSi substrate pre- contact angle decreases to 38°, which was in the Wenzel
sents the highest reflectance relative compared with state (Figure 6B). Even more striking, the angle reaches to
PSi/MoS2 MSCs and PSi/MoS2/Au MSCs. And, simulated 148° (in Cassie state) with excellent hydrophobicity after
PSi reflection spectrum (dashed line) by an FDTD method is modified by denser AuNPs (Figure 6D). That is a significant
calculated, where the two resonances, located at 234 and difference between them, which can be verified from the
338 nm indicated by the pink arrows, fairly agree with the morphology of the two substrates. The pristine MoS2 cav-
measured result. The measured PSi/MoS2 and PSi/MoS2/ ities are composed of very thin nanosheets (shown in
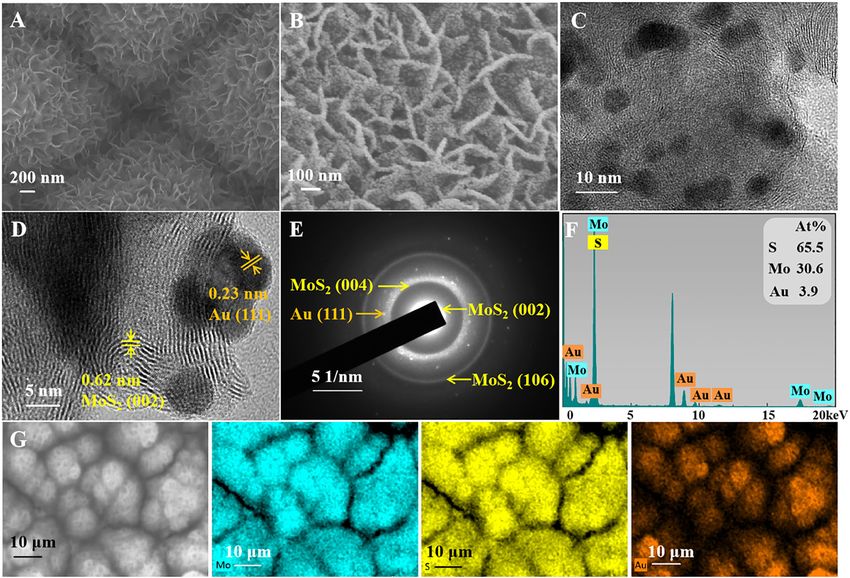
Au MSCs all have the low reflectance in the whole Figure 3A), where the structure is like soft villus unable toX. Zhao et al.: Hydrophobic multiscale cavities 4769 Figure 5: Surface-enhanced Raman spectroscopy (SERS) performance of crystal violet (CV) and electric field distribution. Raman spectra of (A) CV alcoholic solution (B) adenosine triphosphate on the pyramid Si (PSi)/ molybdenum disulfide (MoS2)/Au multiscale cavity (MSC). (C) Reflectance spectrum of simulated PSi, measured PSi, PSi/MoS2 MSC, and PSi/MoS2/Au MSC. Simulated vertical electric field distribution of (D) banked MoS2 cavity, (E) banked MoS2/Au cavity, (F) vertical MoS2 cavity, and (G) vertical MoS2/Au cavity. support the water droplet, promoting the extension of the PSi/MoS2 MSC, which is labeled by the corresponding water droplet instead. For PSi/MoS2/Au MSCs, the vertical frame, proving the hydrophilic and oil-wet properties. As a nanosheets become much stronger with the assistance of contrast, the PSi/MoS2/Au MSC was used for measuring the abundant AuNPs (shown in Figure 3D), which can make R6G aqueous solution (10−9M), Sudan 1 toluene solution the water droplet keep on it. Furthermore, the hydropho- (10−5M), and their mixture as shown in Figure 6F (R6G bicity of the flat-Si/MoS2/Au single-scale cavities was aqueous solution and Sudan 1 toluene solution are drop- measured as a contrast shown in Figure 6C, where the ped on substrate, and the mixture is immersed by the water contact angle is about 140°, slightly smaller than that sample). Unsurprisingly, the peaks of individual R6G and of PSi/MoS2/Au MSC, which manifested the MSCs are the Sudan 1 dropped on it can all be detected on the hybrid most pre-eminent hydrophobic sample. To further explore sample, and there is only the Sudan 1 in the mixture that the characteristic in the SERS field, we mix the R6G can be detected, which showed favourable hydrophobici- aqueous solution and Sudan 1 toluene solution for detec- ty, which is the reason why we choose an alcoholic solution tion. The PSi/MoS2 MSC could detect R6G aqueous solution to dilute R6G and CV molecule for SERS detection. Above (10−5M) and Sudan 1 toluene solution (10−3M), which was all, the PSi/MoS2/Au MSC has a great potential for direc- dropped on the substrate, and their Raman spectra can be tional SERS detection in a complex mixture of oil and clearly observed in Figure 6E. To measure the hydropho- water. bicity, the PSi/MoS2 MSC was rapidly immersed in the Except for the hydrophobic properties, photocatalytic mixture of the two molecules after vigorously shaking to degradation of R6G was carried out to investigate perfor- make it contact fully with the oil/water solution because of mance of a recyclable SERS substrate. Figure 7A shows the the oil-water separation under its natural state. The char- SERS spectra of R6G (10−7M) on the PSi/MoS2/Au MSC acteristic peak of R6G and Sudan 1 can be detected from the irradiated by visible light with an interval of 15 min. The
4770           X. Zhao et al.: Hydrophobic multiscale cavities

Figure 6: Hydrophobicity study of different samples.
The images about hydrophobicity of (A) pyramid Si (PSi) sample (the inset shows the corresponding scanning electron microscope [SEM] image of
PSi), (B) PSi/molybdenum disulfide (MoS2) multiscale cavity (MSC), (C) flat-Si/MoS2/Au (the inset shows the corresponding SEM image), and (D)
PSi/MoS2/Au MSC. (E) The surface-enhanced Raman spectroscopy (SERS) spectra of R6G aqueous solution (10−5M), Sudan 1 toluene solution
(10−3M) and their mixture detected from PSi/MoS2 MSC. (F) The SERS spectra of R6G aqueous solution (10−9M), Sudan 1 toluene solution (10−5M),
and their mixture detected from PSi/MoS2/Au MSC. The two photos at right are the mixture of R6G aqueous solution and Sudan 1 toluene solution.

intensity of R6G peaks gradually decreased with the in-                  shows the results for R6G collected at the initial SERS
crease of irradiation times and completely disappeared                   detection and after self-cleaning treatment. After visible
after 105 min of photodegradation. The intensity of the                  light exposure at 120 min, no characteristic peaks of R6G
Raman peak at 613 cm−1 is shown in Figure 7B, which was                  were observed, which can be ascribed to effective absorp-
used as an indicator of the self-cleaning ability with                   tion of visible light, abundant exposed catalytic active
different irradiation times from 0 to 105 min. And, the same             sites, and suppression of recombination with the assis-
peak was also counted under dark condition, which almost                 tance of AuNPs. When the same substrate repeats such
has no change over time, proving the attenuation of in-                  detection and photocatalytic process twice, the results are
tensity is caused by photodegradation. Moreover, Figure 7C               similar at per-recyclable detection, indicating that the
X. Zhao et al.: Hydrophobic multiscale cavities                4771

Figure 7: Photodegradation and self-cleaning property.
(A) Surface-enhanced Raman spectroscopy (SERS) spectra of R6G for the pyramid Si (PSi)/ molybdenum disulfide (MoS2)/Au multiscale cavity (MSC)
irradiated by visible light with an interval of 15 min. (B) The intensity of 613 cm−1 from the substrate under irradiation and dark with an interval of 15 min.
(C) Recycle detection of R6G on the PSi/MoS2/Au MSC. (D) Illustration of the mechanism of photocatalytic degradation of R6G over PSi/MoS2/Au MSC.

PSi/MoS2/Au MSC is feasible as an in situ recyclable SERS                         further exciting the multiple cavity plasmon modes. The
substrate.                                                                        combined effect of MoS2 nanosheets via strong multiple
     Based on the aforementioned experiment, the pro-                             plasmonic coupling of AuNPs on the active edge sites en-
posed mechanisms of photocatalytic degradation are                                hances the visible light photoactivity, which makes recycle
summarized in Figure 7D. The plasmonic Au and semi-                               utilization come true with a synergistic effect between
conductor MoS2 act as light absorber under irradiation and                        AuNPs and ultrathin MoS2 nanosheets.
the Schottky barrier forms in close contact between them.
The hot electrons, induced by plasmon with enough high
energies, can overcome the Schottky barrier and transfer                          4 Conclusion
from the Au to the MoS2 conduction band [42]. In addition,
the Schottky barrier at the interface of Au and MoS2 can                          In summary, we have developed a robust PSi/MoS2/Au
efficiently prevent the injected hot electrons getting back.                       MSC hybrid structure leading to the both enhancement of
During the photocatalytic process, the efficient separation                        SERS performance and photocatalytic degradation.
of electron hole pairs has been achieved because of                               Through effective coupling of the MoS2 nanocavity mode
Schottky barrier at the metal/semiconductor interface.                            on PSi microcavity with the surface plasmons of the
Moreover, the vertical-grown MoS2 nanosheets have plen-                           AuNPs, the electric field near the cavity walls is greatly
tiful exposed active edge sites for catalytic activity, which                     enhanced, which was proved by FDTD simulation, and
offers a large surface area for electron transportation and                       thus a high SERS activity with the EF of ∼6.5 × 10⁷ was
adsorption. The structure of MSCs can confine the light in                         achieved because of the excellent optical capture capa-
the dielectric cavity and improve the utilization of light,                       bility and abundant electromagnetic “hot spots”.
4772 X. Zhao et al.: Hydrophobic multiscale cavities
Meanwhile, the homogeneity and stability were also [7] J. Jeong, M. Arnob, K. Baek, S. Lee, W. Shih, and Y. Jung, “3D
measured from the hybrid SERS substrate. Through cross-point plasmonic nanoarchitectures containing dense and
regular hot spots for surface-enhanced Raman spectroscopy
comparing the hydrophobic properties with PSi/MoS2 MSC
analysis,” Adv. Mater., vol. 28, pp. 8695–8704, 2016.
and flat-Si/MoS2/Au, the PSi/MoS2/Au MSC can realize the [8] H. Liu, Z. Yang, L. Meng, et al., “Three-dimensional and time-
directional monitoring of organic pollutant. Furthermore, the ordered surface-enhanced Raman scattering hot spot matrix,” J.
PSi/MoS2/Au MSC, as a visible light self-cleaning SERS sub- Am. Chem. Soc., vol. 136, pp. 5332–5341, 2014.
strate, possesses intriguing recycling properties attributed to [9] X. Zhang, X. Zhang, C. Luo, et al., “Volume-enhanced Raman
scattering detection of viruses,” Small, vol. 15, p. 1805516, 2019.
effective absorption of visible light, plentiful exposed cata-
[10] J. Xu, C. Li, H. Si, et al., “3D SERS substrate based on Au-Ag bi-
lytic active sites, and fast charge transfer with the assistance
metal nanoparticles/MoS2 hybrid with pyramid structure,” Opt.
of AuNPs. The proposed strategy for direct growth of Express, vol. 26, pp. 21546–21557, 2018.
hybrid MSCs can pave the way towards SERS- and [11] Z. Li, S. Jiang, Y. Huo, et al., “3D silver nanoparticles with
photodegradation-based applications, holding a great po- multilayer graphene oxide as a spacer for surface enhanced
tential in the field of biochemistry for sensing and monitoring. Raman spectroscopy analysis,” Nanoscale, vol. 10,
pp. 5897–5905, 2018.
[12] Z. Dai, X. Xiao, W. Wu, et al., “Plasmon-driven reaction controlled
Author contribution: All the authors have accepted by the number of graphene layers and localized surface plasmon
responsibility for the entire content of this submitted distribution during optical excitation,” Light Sci. Appl., vol. 4,
manuscript and approved submission. p. e342, 2015.
Research funding: The authors are grateful for financial [13] Z. Yang, Q. Li, B. Ren, and Z. Tian, “Tunable SERS from aluminum
nanohole arrays in the ultraviolet region,” Chem. Commun.,
support from the National Natural Science Foundation of
vol. 47, pp. 3909–3911, 2011.
China (11804200, 11974222, 11904214, 11774208), Taishan
[14] S. Tian, Q. Zhou, Z. Gu, X. Gu, and J. Zheng, “Fabrication of a
Scholars Program of Shandong Province (tsqn201812104), bowl-shaped silver cavity substrate for SERS-based
Qingchuang Science and Technology Plan of Shandon immunoassay,” Analyst, vol. 138, pp. 2604–2612, 2013.
Qingchuang Science and Technology Plan of Shandong [15] H. Im, K. Bantz, S. Lee, T. Johnson, C. Haynes, and S. Oh,
Province (2019KJJ014, 2019KJJ017), a Project of Shandong “Self‐assembled plasmonic nanoring cavity arrays for SERS
and LSPR biosensing,” Adv. Mater., vol. 25, pp. 2678–2685,
Province Higher Educational Science and Technology
2013.
Program (J18KZ011) and China Postdoctoral Science [16] Z. Zuo, S. Zhang, Y. Wang, et al., “Effective plasmon coupling in
Foundation (2019M662423). conical cavity for sensitive surface enhanced Raman scattering
Conflict of interest statement: The authors declare no with quantitative analysis ability,” Nanoscale, vol. 11,
conflicts of interest regarding this article. pp. 17913–17919, 2019.
[17] J. Yu, Y. Guo, H. Wang, et al., “Quasi optical cavity of hierarchical
ZnO nanosheets@Ag nanoravines with synergy of near-and far-
field effects for in situ Raman detection,” J. Phys. Chem. Lett.,
References vol. 10, pp. 3676–3680, 2019.
[18] S. Su, C. Zhang, L. Yuwen, et al., “Creating SERS hot spots on
[1] Q. Ding, J. Wang, X. Chen, et al., “Quantitative and sensitive SERS MoS2 nanosheets with in-situ grown gold nanoparticles,” ACS
platform with analyte enrichment and filtration function,” Nano Appl. Mater. Interfaces, vol. 6, pp. 18735–18741, 2014.
Lett., 2020; vol. 20, pp. 7304–7312, 2020. [19] Z. Zeng, Z. Yin, X. Huang, et al., “Single-layer semiconducting
[2] W. Yan, L. Yang, J. Chen, Y. Wu, P. Wang, and Z. Li, “In situ two‐step nanosheets: high-yield preparation and device fabrication,”
photoreduced SERS materials for on‐chip single‐molecule Angew. Chem. Int. Ed., vol. 123, pp. 11289–11293, 2011.
spectroscopy with high reproducibility,” Adv. Mater., vol. 29, [20] E. Er, H. Hou, A. Criado, et al., “High-yield preparation of
p. 1702893, 2017. exfoliated 1T-MoS2 with SERS activity,” Chem. Mater., vol. 31,
[3] S. Asher, “UV resonance Raman spectroscopy for analytical, pp. 5725–5734, 2019.
physical, and biophysical chemistry,” Anal. Chem., vol. 65, [21] X. Zhao, J. Yu, Z. Zhang, et al., “Heterogeneous and cross-
pp. 59–65, 1993. distributed metal structure hybridized with MoS2 as high
[4] Z. Schultz, J. Marr, and H. Wang, “Tip enhanced Raman scattering: performance flexible SERS substrate,” Opt. Express, vol. 26,
plasmonic enhancements for nanoscale chemical analysis,” p. 23831, 2018.
Nanophotonics, vol. 3, pp. 91–104, 2014. [22] F. Xu, B. Zhu, B. Cheng, J. Yu, and J. Xu, “1D/2D TiO2/MoS2 hybrid
[5] J. Yu, Y. Wei, H. Wang, et al., “In situ detection of trace pollutants: a nanostructures for enhanced photocatalytic CO2 reduction,”
cost-effective SERS substrate of blackberry-like silver/graphene Adv. Opt. Mater., vol. 6, p. 1800911, 2018.
oxide nanoparticle cluster based on quick self-assembly [23] C. Zhang, S. Jiang, Y. Huo, et al., “SERS detection of R6G based
technology,” Opt. Express, vol. 27, pp. 9879–9894, 2019. on a novel graphene oxide/silver nanoparticles/silicon pyramid
[6] K. Xu, R. Zhou, K. Takei, and M. Hong, “Toward flexible surface- arrays structure,” Opt. Express, vol. 23, pp. 24811–24821, 2015.
enhanced Raman scattering (SERS) sensors for point-of-care [24] A. Beal and H. Huges, “Kramers-Kronig analysis of the reflectivity
diagnostics,” Adv. Sci., p. 1900925, 2019, https://doi.org/10. spectra of 2H-MoS2, 2H-MoSe2, and 2H-MoTe2,” J. Phys. C,
1002/advs.201900925. vol. 12, p. 881, 1979.X. Zhao et al.: Hydrophobic multiscale cavities 4773
[25] S. Babar and J. Weaver, “Optical constants of Cu, Ag, and Au [34] C. Zhang, C. Li, J. Yu, et al., “SERS activated platform with three-
revisited,” Appl. Opt., vol. 54, pp. 477–481, 2015. dimensional hot spots and tunable nanometer gap,” Sens.
[26] C. Schinke, P. Peest, J. Schmidt, et al., “Uncertainty analysis for Actuators B Chem., vol. 258, pp. 163–171, 2018.
the coefficient of band-to-band absorption of crystalline [35] S. Nie and S. Emory, “Probing single molecules and single
silicon,” AIP Adv., vol. 5, p. 67168, 2015. nanoparticles by surface-enhanced Raman scattering,” Science,
[27] Y. Chen, H. Liu, Y. Tian, et al., “In situ recyclable surface- vol. 275, pp. 1102–1106, 1997.
enhanced Raman scattering-based detection of multicomponent [36] X. Zhao, C. Li, Z. Li, et al., “In-situ electrospun aligned and maize-
pesticide residues on fruits and vegetables by the flower-like like AgNPs/PVA@Ag nanofibers for surface-enhanced Raman
MoS2@Ag hybrid substrate,” ACS Appl. Mater. Interfaces, vol. 12, scattering on arbitrary surface,” Nanophotonics, vol. 8,
pp. 14386–14399, 2020. pp. 1719–1729, 2019.
[28] J. Dong, J. Huang, A. Wang, et al., “Vertically-aligned Pt- [37] Y. Zhao, X. Pan, L. Zhang, et al., “Dense AuNP/MoS2 hybrid
decorated MoS2 nanosheets coated on TiO2 nanotube arrays fabrication on fiber membranes for molecule separation and
enable high-efficiency solar-light energy utilization for SERS detection,” RSC Adv., vol. 7, p. 36516, 2017.
photocatalysis and self-cleaning SERS devices,” Nano Energy, [38] H. Sun, M. Yao, Y. Song, et al., “Pressure-induced SERS
vol. 71, p. 104579, 2020. enhancement in a MoS2/Au/R6G system by a two-step charge
[29] Y. Shi, J. Wang, C. Wang, et al., “Hot electron of Au nanorods transfer process,” Nanoscale, vol. 11, p. 21493, 2019.
activates the electrocatalysis of hydrogen evolution on MoS2 [39] G. Petra, E. Martin, F. B. Simon, V. Jan, T. Nahid, and L. Christoph,
Nanosheets,” J. Am. Chem. Soc., vol. 137, pp. 7365–7370, 2015. “Plasmonic nanofocusing- grey holes for light,” Adv. Phys. X,
[30] T. Sreeprasad, P. Nguyen, N. Kim, and V. Berry, “Controlled, vol. 1, pp. 297–330, 2016.
defect-guided, metal-nanoparticle incorporation onto MoS2 [40] P. Li, D. Pan, L. Yang, et al., “Silver nano-needles: focused optical
via chemical and microwave routes: electrical, thermal, and field induced solution synthesis and application in remote
structural properties,” Nano Lett., vol. 13, pp. 4434–4441, excitation nanofocusing SERS,” Nanoscale, vol. 11,
2013. pp. 2153–2161, 2019.
[31] X. Zheng, Z. Guo, G. Zhang, H. Li, J. Zhang, and Q. Xu, “Building a [41] I. S. Mark, “Nanofocusing of optical energy in tapered plasmonic
lateral/vertical 1T-2H MoS2/Au heterostructure for enhanced waveguides,” Phys. Rev. Lett., vol. 93, p. 137404, 2004.
photoelectrocatalysis and surface enhanced Raman scattering,” [42] B. Shang, X. Cui, L. Jiao, et al., “Lattice-mismatch-induced
J. Mater. Chem., vol. 7, pp. 19922–19928, 2019. ultrastable 1T-phase MoS2-Pd/Au for plasmon-enhanced
[32] X. Mu and M. Sun, “Interfacial charge transfer exciton enhanced hydrogen evolution,” Nano Lett., vol. 19, p. 2758, 2019.
by plasmon in 2D in-plane lateral and van der Waals
heterostructures,” Appl. Phys. Lett., vol. 117, p. 091601, 2020.
[33] Y. Guo, J. Yu, C. Li, et al., “SERS substrate based on the flexible Supplementary Material: The online version of this article offers
hybrid of polydimethylsiloxane and silver colloid decorated with supplementary material (https://doi.org/10.1515/nanoph-2020-
silver nanoparticles,” Opt. Express, vol. 26, pp. 21784–21796, 2018. 0454).You can also read