N25 Waterford to Glenmore Scheme - Option Selection Report Kilkenny County Council
←
→
Page content transcription
If your browser does not render page correctly, please read the page content below
N25 Waterford to Glenmore
Scheme
Option Selection Report
Kilkenny County Council
25 March 2021
Contents
Chapter                                                                                       Page
Executive Summary                                                                                9
1.      Introduction and Description                                                            33
1.1.    Introduction                                                                            33
1.2.    Project Description                                                                     33
1.3.    Overview of the Proposed Project                                                        35
1.4.    Existing Conditions                                                                     37
1.5.    Purpose of the Option Selection Report                                                  37
1.6.    Project Operational Goals and Design Strategies                                         38
2.      Project Need, Strategic Fit and Priority                                                43
2.1.    Strategic Fit and        Priority   of   Project   within   Sanctioning   Authority
        Programme/Policy                                                                        43
2.2.    Project Specific Need                                                                   61
3.      Traffic Assessment and Option Cross Section                                             74
3.1.    Description of Traffic Modelling Report                                                 74
3.2.    Incremental Analysis                                                                    79
4.      Constraints Study                                                                       83
4.1.    Approach and Methodology                                                                83
4.2.    Description of Natural Constraints                                                      83
4.3.    Description of Artificial Constraints                                                   85
4.4.    Description of External Parameters                                                      88
4.5.    Summary of Constraints                                                                  89
5.      Consideration of Alternatives & Options                                                 90
5.1.    Overview                                                                                90
5.2.    Pre-Constraints Study Alternatives                                                      90
5.3.    Road Based Options                                                                      98
6.      Phase 2 Stage 1 – Preliminary Options Assessment                                       107
6.1.    Identification of Route Options                                                        107
6.2.    Option Description                                                                     109
6.3.    Engineering Assessment                                                                 111
6.4.    Environmental Assessment                                                               114
6.5.    Economic Assessment                                                                    116
6.6.    Summary of Phase 2 Stage 1 Preliminary Option Assessment                               118
6.7.    Recommendation on Number of Alternative Options for Stage 2 – Assessment               120
7.      Stage 2 – Project Appraisal Matrix                                                     121
7.1.    Description of Phase 2 – Stage 2 Alternative Options                                   121

5190130-ATK-ZZ-ZZ-RE-RP-0008 25th March 2021
Atkins | 5190130-ATK-ZZ-ZZ-RE-RP-0008_Rev 12.docx                                                    Page 3 of 182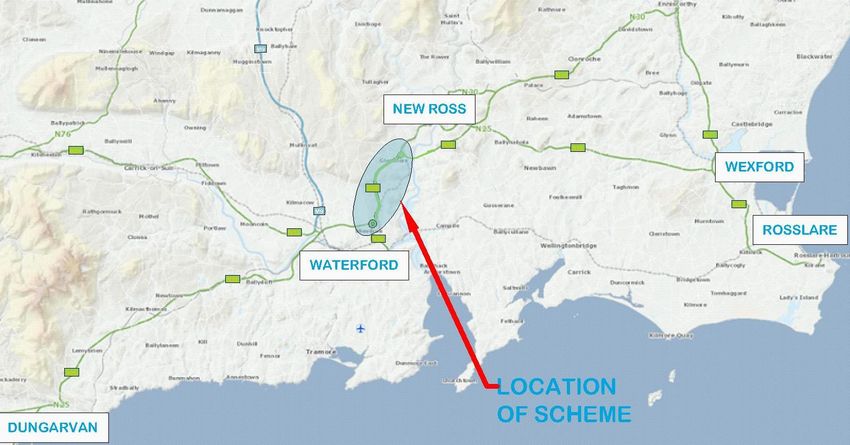
7.2.     Findings from First Public Consultation                                       125
7.3.     Multi Criteria Analysis                                                       126
7.4.     Summary of Economy Appraisal                                                  127
7.5.     Summary of Safety Appraisal                                                   130
7.6.     Summary of Environmental Appraisal                                            134
7.7.     Summary of Accessibility & Social Inclusion Appraisal                         151
7.8.     Summary of Integration Appraisal                                              152
7.9.     Summary of Physical Activity Appraisals                                       154
7.10.    Scheme Objectives-based Appraisal                                             156
7.11.    Phase 2 - Stage 2 Project Appraisal Matrix and Assessment.                    157
7.12.    Synopsis of Multi-Criteria Analysis Scoring                                   159
7.13.    Conclusion                                                                    161
8.       Phase 2 Stage 3 Preferred Route Corridor Project Appraisal Balance Sheet      163
8.1.     Preferred Route Corridor Option Project Appraisal Balance Sheet (PABS)        163
8.2.     Summary of Road Safety Audit Stage F (Part 2)                                 163
8.3.     Recommendation                                                                163

Appendices                                                                             164
Appendix A.        Map of Trans European Network (TEN-T)                               165
Appendix B.        Cost Benefit Analysis Report & Traffic Modelling Report             168
Appendix C.        Junction Strategy Assessment                                        169
Appendix D.        Environmental Constraints Report                                    170
Appendix E.        Feasible Options for the Phase 2 Stage 1 Assessment                 171
Appendix F.        Phase 2 – Stage 1 Assessment Matrix                                 172
Appendix G.        Phase 2 Stage 2 Route Options                                       173
Appendix H.        Public Consultation Report                                          174
Appendix I.        Phase 2 – Environmental Route Options Report - Stage 2 – (Project
                   Assessment Matrix)                                                  175
Appendix J.        Road Safety Audit - Stage F1                                        176
Appendix K.        Road Safety Impact Assessment                                       177
Appendix L.        Phase 2 – Option Selection Report - Stage 2 – Overall Project
                   Assessment Matrix                                                   178
Appendix M.        Option Cost Estimates                                               179
Appendix N.        Project Appraisal Balance Sheet (PABS)                              180
Appendix O.        Stage F (Part 2) Road Safety Audit                                  181

Tables
Table 2-1 - Summary of Two-Way AADT on the Existing N25                                 64
Table 2-2 - Total Number of Collisions on the Existing N25 from 2005 – 2020             66
Table 2-3 - Total Number of Casualties on the Existing N25 from 2005 – 2020             68

5190130-ATK-ZZ-ZZ-RE-RP-0008 25th March 2021
Atkins | 5190130-ATK-ZZ-ZZ-RE-RP-0008_Rev 12.docx                                            Page 4 of 182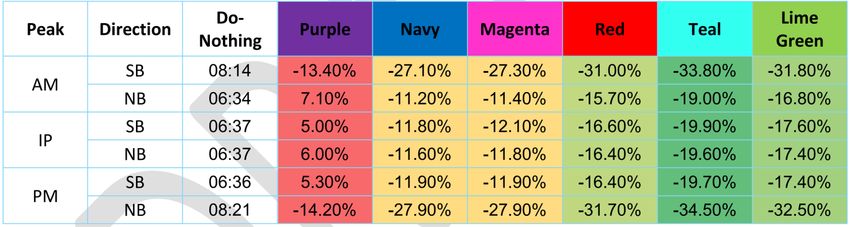
Table 2-4 - Breakdown of Network Safety Ranking Data 2016 - 2018                          71
Table 3-1 - Traffic Surveys                                                               76
Table 3-2 - 2045 Time Savings by Route Option & Time Period                               77
Table 3-3 - 2045 N25 Journey Time Savings by Route Option & Time Period                   78
Table 3-4 - 2045 AADT & Transference by Route Option                                      78
Table 3-5 – Dual Carriageway Types                                                        80
Table 5-1 - Waterford to New Ross Timetable for Glenmore Stop                             96
Table 6-1 – Phase 2 Stage 1 - Engineering Assessment Matrix Summary                      113
Table 6-2 – Phase 2 Stage 1 - Environmental Assessment Matrix Summary                    115
Table 6-3 – Phase 2 Stage 1 - Economic Assessment Matrix Summary                         117
Table 6-4 - Summary Matrix for Phase 2 – Stage 1 Preliminary Options Assessment          120
Table 7-1 – Percentage of Responders with Land/Property adjacent to a Route and Types of Properties Impacted
                                                                                          125
Table 7-2 - Responses to Question 4 (Part 1)                                             125
Table 7-3 - List of Synopsised Additional Information Received for Question 5            126
Table 7-4 - MCA Score System                                                             126
Table 7-5 - Option Comparison Estimate (OCE)                                             128
Table 7-6 - Cost Benefit Analysis (Economy) Results                                      129
Table 7-7 - Discounted Safety Benefits (2011 Values)                                     129
Table 7-8 - Economy Assessment Ranking                                                   130
Table 7-9 - Road Safety Audit Stage F1 - Route Comparison Table                          131
Table 7-10 - Assessment of RSIA Safety Issues                                            133
Table 7-11 - RSAI Ranking of Options                                                     133
Table 7-12 - Safety Appraisal Summary                                                    133
Table 7-13 - Overall Safety Ranking (MCA Scoring)                                        134
Table 7-14 - Overall Safety Ranking (Preferences)                                        134
Table 7-15 - Summary of Route Scoring - Air Quality                                      135
Table 7-16 - Summary of Route Scoring - Climate                                          136
Table 7-17 - Summary of Route Scoring - Noise                                            138
Table 7-18 - Summary of Route Scoring - Landscape and Visual                             139
Table 7-19 - Summary of Scoring - Biodiversity                                           141
Table 7-20 - Route Comparison: Quantitative Waste Measures                               141
Table 7-21 - Summary of Scoring - Waste                                                  142
Table 7-22 - Summary of Route Scoring- Soils and Geology                                 142
Table 7-23 - Summary of Route Scoring - Hydrology                                        143
Table 7-24 - Summary of Route Scoring- Hydrogeology                                      143
Table 7-25 - Summary of Route Scoring- Architectural Heritage                            144
Table 7-26 - Summary of Route Scoring- Archaeology and Cultural Heritage                 145
Table 7-27 - Summary of Route Scoring - Non-Agricultural Properties                      145

5190130-ATK-ZZ-ZZ-RE-RP-0008 25th March 2021
Atkins | 5190130-ATK-ZZ-ZZ-RE-RP-0008_Rev 12.docx                                              Page 5 of 182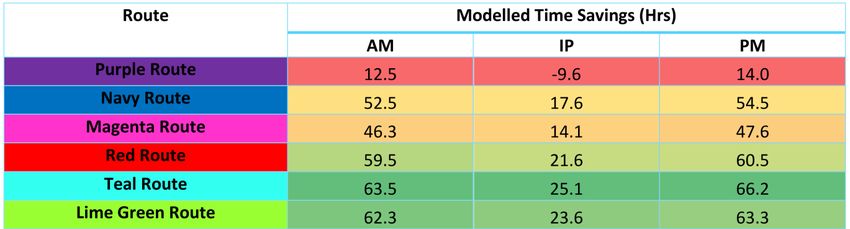
Table 7-28 - Summary of Route Scoring - Agriculture                                          146
Table 7-29 - Summary of Route Scoring - Planning / Human Beings                              149
Table 7-30 - Summary of Route Scoring - Human Health                                         150
Table 7-31 - Environmental Assessment Matrix Summary                                         151
Table 7-32 - Overall Integration Preferences                                                 154
Table 7-33 - Overall Physical Activity Preferences                                           155
Table 7-34 – Scheme Objective Based Appraisal                                                157
Table 7-35 - Phase 2 Stage 2 Assessment                                                      160
Table 7-36 – Overall Project Appraisal Assessment                                            162

Figures
Figure 1-1 - Scheme Location                                                                     33
Figure 1-2 - N25 Waterford to Glenmore - Study Area                                              34
Figure 1-3 - TEN-T Core & Comprehensive Network & Location of Ports of National & Regional
Significance as Identified in the National Ports Policy                                    36
Figure 2-1 – TEN-T Core and Comprehensive Networks in the Southeast                              44
Figure 2-2 - Type 1 Service Area Locations on the Motorway Network                               52
Figure 2-3 - Locations of Existing Service Stations on the N25                                   53
Figure 2-4 – RSES – Strategy Map                                                                 56
Figure 2-5 - Regional Planning Guideline - South East Region - Spatial Infrastructure Strategy
                                                                                                 57
Figure 2-6 - Kilkenny County Development Plan - 2011 N25 Waterford to Glenmore Scheme
Corridor                                                                              58
Figure 2-7 - Kilkenny City and County Draft Development Plan, 2021-2027 - Study Area for
the proposed N25 Waterford to Glenmore Scheme                                            59
Figure 2-8 - CLÁR Areas and Population Centres in County Kilkenny                                60
Figure 2-9 - Typical Existing N25 Wide Single Carriageway Cross Section                          61
Figure 2-10 – Existing N25 with Varying Cross Section & Junction Treatment                       62
Figure 2-11 - Side Road with Acute Angle & Steep Approach and Typical Local Road Cross
Section                                                                                62
Figure 2-12 - Example of Single Direct Access Located along the Existing N25                     62
Figure 2-13 – Varying Road Marking Layouts & HGV Traffic                                         63
Figure 2-14 - Journey Times on the N25 Waterford to Glenmore - Southbound & Northbound 64
Figure 2-15 - Speeds on the N25 Waterford to Glenmore - Southbound & Northbound                  65
Figure 2-16 - RSA Collision Datal (2005 – 2016) along the N25 Waterford to Glenmore Scheme
                                                                                                 67
Figure 2-17 - TII Collision Data 2017 - 2020                                                     69
Figure 2-18 - TII Network Safety Ranking 2016-2018                                               71
Figure 2-19 - Extract from TII Draft Collision Risk Level 2018 - 2020                            72
Figure 2-20 - EuroRAP Risk Map                                                                   73

5190130-ATK-ZZ-ZZ-RE-RP-0008 25th March 2021
Atkins | 5190130-ATK-ZZ-ZZ-RE-RP-0008_Rev 12.docx                                                     Page 6 of 182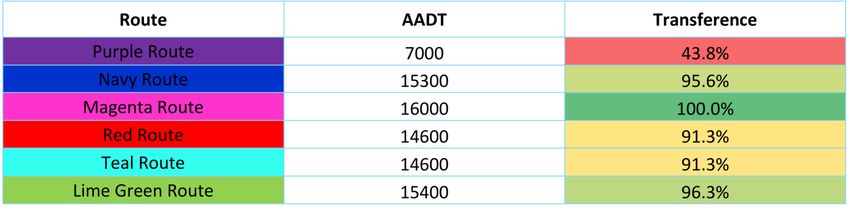
Figure 3-1 - Traffic Model Study Area                                                     75
Figure 5-1 – Preliminary Shared Surface Proposal Connecting the South-East Greenway to
the Village of Glenmore                                                                93
Figure 5-2 – Continuation of Preliminary Shared Surface Proposals Connecting the South-
East Greenway to the Village of Glenmore                                                94
Figure 5-3 - Preliminary Layout of the Relocated Glenmore Hill Bus Stop with Set-Down Area
and Parking Facilities for Vehicles and Cyclists.                                          96
Figure 5-4 - Locations of Properties along the N25 with limited Access to the Local Road
Network.                                                                                103
Figure 5-5 - Location of One-Off Properties and Field Accesses Fronting onto the N25     104
Figure 6-1 - Feasibility Options for the Phase 2 - Stage 1 Assessment                    108
Figure 7-1 - Phase 2 - Stage 2 Route Options                                             124
Figure 7-2 - Breakdown of Embodied Carbon for each Route Option.                         136
Figure A-1 - Overall Map of Trans European Map for Ireland                               166
Figure A-2 - N25 Comprehensive Route                                                     167

5190130-ATK-ZZ-ZZ-RE-RP-0008 25th March 2021
Atkins | 5190130-ATK-ZZ-ZZ-RE-RP-0008_Rev 12.docx                                               Page 7 of 182
N25 Waterford to Glenmore Scheme
Option Selection Report

5190130-ATK-ZZ-ZZ-RE-RP-0008 25th March 2021
Atkins | 5190130-ATK-ZZ-ZZ-RE-RP-0008_Rev 12.docx   Page 8 of 182
Executive Summary
Introduction and Description
Introduction
This Option Selection Report has been prepared on behalf of Kilkenny County Council and in accordance with
the Transport Infrastructure Ireland (TII) Project Management Guidelines (PMG), (PE-PMG-02041), January
2019, the TII Project Manager’s Manual for Major National Road Projects, (PE-PMG-02042), February 2019 and
the TII Project Appraisal Guidelines (PAG), (PE-PAG-02009 to 02039), October 2016.
This Option Selection Report presents in detail the different stages of the process, which inform the selection of
the Emerging Preferred Route Corridor option for the project.
Kilkenny County Council (KCC), in association with Transport Infrastructure Ireland (TII), are proposing to
develop a scheme to improve approximately 9.5 km of the existing N25 between Waterford and Glenmore. This
proposed scheme is called the N25 Waterford to Glenmore Road Scheme. The scheme will link the N25 New
Ross Bypass (opened in January 2020) and the N25 Waterford City Bypass (opened in October 2009) and is
expected to consist of approximately 9.5km of dual carriageway providing continuity of cross section and
alignment for approximately 35km.
The N25 Waterford to Glenmore Road Scheme is of particular importance as it forms part of the following policies:
    •        The Trans- European Transport Networks (TEN-T);
    •        Project Ireland 2040, incorporating The National Planning Framework (NPF), National Development
             Plan (2018-2027) (NDP) and the Regional Planning Guidelines for the South-East Region 2010 –
             2022;
    •        Strategic Investment Framework for Land Transport (SIFLT);’
    •        Smarter Travel – A Sustainable Transport Future (2009-2020);’
    •        Road Safety Strategy (2013-2020);’
    •        Regional Planning Guidelines for the South-East Region (2010-2022);
    •        Kilkenny City & County Draft Development Plan 2021 - 2027.
On a European and National level, the N25 forms part of the TEN-T, which is a network of strategic transport
corridors throughout the European Union (EU) that play a key role in the transportation of goods and passengers.
The N25 TEN-T strategic route is a vital link in the national road network for the south of the country and is
approximately 185km in length. The route connects the city of Cork in the west to the port of Rosslare in the east,
with connections to New Ross, Waterford city and Waterford Port (Belview) between these locations. In addition,
the N25 route links the towns and villages of Carrigtwohill, Midleton, Castlemartyr, Killeagh, Dungarvan,
Kilmacthomas, Kilmeaden and Wexford.
The N25 route provides access to three of the five ports of national significance as identified in the National Ports
Policy, these are the ports of Cork, Rosslare, and Waterford and also to the port of New Ross which is identified
as a port of regional importance. As part of the TEN-T network, three of these ports are identified as strategic
ports, Cork as a Tier 1 port and Waterford and Rosslare as Tier 2 ports. In addition, the N25 provides access to
the TEN-T core and comprehensive airports of Cork and Waterford.
From a more regional and local perspective the N25 connects the employment hubs of Waterford City and New
Ross and the village of Glenmore. The infrastructure supports local employment facilitating agricultural operations
and local industries, most notably Glanbia Agribusiness which is a key local employer and source of supplies for
farmers and agri-contractors in the study area. Glanbia Agribusiness is located at Glenmore village and largely
accessed by staff, suppliers and customers from the N25 via the L7510.

5190130-ATK-ZZ-ZZ-RE-RP-0008 25th March 2021
Atkins | 5190130-ATK-ZZ-ZZ-RE-RP-0008_Rev 12.docx                                                    Page 9 of 182
Project Description
The section of the N25 under consideration is located between two major bypass schemes, Waterford City
Bypass, completed in 2009, and New Ross Bypass, completed in 2020. In Q2 2019, Kilkenny County Council
appointed Atkins Ireland to advance the scheme through the planning and design processes in accordance with
Phases 1 - 4 of the TII Project Management Guidelines.
The proposed study area for the scheme is rural in nature and is located in the south east of county Kilkenny,
close to the Waterford border between the townland of Luffany in the south and Jamestown in the north. The
section of the N25 under consideration is a legacy single carriageway substandard stretch of the N25, which has
been the subject of on-line upgrades and localised junction safety schemes with no future planned works
identified.
Refer to the scheme location plan in Figure 0-1 below.
Figure 0-1 - Scheme Location
Existing Conditions
The section of the N25 under consideration between Luffany roundabout and the newly constructed Glenmore
roundabout is a national primary route, which has evolved over the ages and thus fits within the existing
landscape. The alignment is below current standards with inherent safety issues and limited capacity for
expanding transportation demands as it traverses the hilly terrain.
The village of Glenmore to the north represents the most built up area along the existing route within the study
area. The N25 is a single carriageway road, rural in nature with the existing topography classified as hilly. The
existing alignment reflects this with a long section of climbing lane provided for southbound vehicles. The national
route is a strategic traffic route in the southeast and caters for a significant percentage of HGV’s. The rural nature,
coupled with the numerous field access, private property entrances, and local road junctions contribute to a large
mix of local and slow-moving agricultural traffic, which results in unreliable journey times, particularly at peak
periods.
5190130-ATK-ZZ-ZZ-RE-RP-0008 25th March 2021
Atkins | 5190130-ATK-ZZ-ZZ-RE-RP-0008_Rev 12.docx Page 10 of 182Purpose of the Option Selection Report
The purpose of this Option Selection Report is to identify a Preferred Option for the improvement and upgrade of
the existing N25 between Waterford and Glenmore. The option selection process commenced with the
identification of a defined Study Area appropriate to the scale of the proposed scheme and the subsequent
identification of significant constraints, their nature and extent, within the Study Area. The constraints that have
been identified were divided into three principal categories as follows:
• Natural Constraints, which include natural landscapes and natural features.
• Artificial Constraints, which include the built environment.
• External Parameters, which include design standards, policy, procedural and legal issues.
This Option Selection Report represents the main deliverable for Phase 2 of the PMGs. The purpose of the Option
Selection Report is to present the project constraints and the assessments that have been undertaken in order
to identify the Emerging Preferred Route Corridor for the project. The detailed technical and scientific information
is included in the accompanying appendices to this report.
The main elements of assessment in Phase 2 are:
• Stage 1 – Preliminary Options Assessment
• Stage 2 – Project Appraisal Matrix
• Stage 3 – Preferred Option
On completion of the Phase 2 process this preferred option will be progressed to Phase 3 - Design and
Environmental Evaluation and subsequently Phase 4 - Statutory Processes in accordance with TII’s PMG (PE-
PMG-02041), January 2019.
Project Operational Goals and Design Strategies
Overview
The specific objectives of the proposed road development are outlined in the Project Brief. These objectives are
assessed based on multi-criteria headings outlined by the Department of Transport in their document ‘Common
Appraisal Framework for Transport Projects and Programmes (March 2019)’ and also in TII’s Project Appraisal
Guidelines – PAG Unit 3.0 Project Brief and Unit 7.0 Multi Criteria Analysis. The objectives are as follows:
Economy
The key economic objectives of the scheme are as follows:
• To improve the capacity and efficiency of the road network in the southeast;
• To improve cross-border connectivity from the southeast to Europe via the N25 route and the ports
by completing the TEN-T Comprehensive road network between the Waterford City bypass and the
New Ross bypass;
• To maintain or reduce journey times and improve journey time reliability, which will in turn reduce
transport costs and environmental impacts;
• To improve the economic out-look and encourage business growth in the areas served by the route
by providing a reliable and efficient transport link;
• To support the future development and expansion of Cork, Waterford, Rosslare and New Ross ports
by providing a high-quality route for freight traffic;
• To stimulate expansion of tourism in the areas served by the route by maintaining/reducing journey
times, making these areas more accessible and attractive to visit.
• To deliver a value for money solution that ensures a lasting residual value.
5190130-ATK-ZZ-ZZ-RE-RP-0008 25th March 2021
Atkins | 5190130-ATK-ZZ-ZZ-RE-RP-0008_Rev 12.docx Page 11 of 182Safety
The key safety objectives of the scheme are as follows:
• To reduce the occurrences of road collisions on the N25 by minimising road side hazards and
reducing the requirements for cross-over and right turn manoeuvres;
• To provide a consistent cross section and treatment of junctions and direct access in keeping with
that of the adjoining Waterford City and New Ross Bypass schemes.
• To separate vulnerable road users from high speed, strategic traffic, including freight;
• To provide increased safer overtaking opportunities;
• To adequately cater for the projected increase in traffic volumes;
• To improve and increase the capacity of the N25 and provide minimum LOS D.
Physical Activity
The key physical activity objectives of the scheme are as follows:
• To maintain/improve the connectivity to the Southeast greenway pedestrian and cycle facility and
the nearby village of Glenmore;
• To improve the ambience and safety of the existing N25 and to facilitate increased usage of the
existing N25 by pedestrians and cyclists.
Environment
The key environmental objectives of the scheme are as follows:
• To provide a sustainable long-term solution in line with the 2019 Climate Action Plan;
• To ensure alignment with sustainable development principles and measures to minimise effects on
the environment to support the Government's policy on climate action;
• To maintain or reduce journey times and encourage free flow traffic, with the aim of reducing
greenhouse gas emissions and impacts on climate;
• To construct a scheme that is suitably integrated into the surroundings both visually and from a noise
impact point of view;
• To manage surface run-off both during and after construction of the scheme so as not to negatively
impact on local water resources.
Accessibility and Social Inclusion
The key accessibility and social inclusion objectives of the scheme are as follows:
• To connect to other similar schemes enhancing the connectivity of the regional and national road
network;
• To improve road based public transport by maintaining or reducing journey times and journey time
reliability;
• To provide safer and more convenient access to public transport for residents in Glenmore Village
and its immediate environs;
• To align with the accessibility and social cohesion objectives as outlined in the Kilkenny County
Development Plan 2014- 2020 and Kilkenny City and Council Draft Development Plan 2021 - 2027.
Integration
The key integration objectives of the scheme are as follows:
• To connect to other similar schemes, enhancing the connectivity of the regional and national road
network;
5190130-ATK-ZZ-ZZ-RE-RP-0008 25th March 2021
Atkins | 5190130-ATK-ZZ-ZZ-RE-RP-0008_Rev 12.docx Page 12 of 182• To improve access between the ports of Cork, Waterford, Rosslare and New Ross and the
comprehensive and core road networks;
• To improve transport links within the EU and beyond;
• To be consistent with the Kilkenny County Development Plan 2014 – 2020 and the Kilkenny City and
County Draft Development Plan 2021 - 2027 in terms of land use and planning objectives;
• To maintain/improve the connectivity to the Southeast Greenway pedestrian and cycle facility;
• To compliment and support European, National, Regional and Local Government policies.
Performance Targets
The performance targets for the scheme are as follows:
• To provide a consistent cross section and treatment of junctions and direct accesses in keeping with
that of the adjoining Waterford City and New Ross bypasses;
• To provide a sustainable long-term solution in line with the 2019 Climate Action Plan;
• To reduce journey times and improve journey time reliability;
• To improve safety;
• To separate vulnerable road users from high speed, strategic traffic, including freight.
Design Standards
The design of the scheme shall be in accordance with the requirements in the TII Publications (Technical). In
particular, junctions incorporated into the Scheme shall be designed in accordance with the requirements outlined
in DN-GEO-03060 (April 2017) Geometric Design of Junctions (priority junctions, direct accesses, roundabouts,
grade separated and compact grade separated junctions). Should provisions for vulnerable road users be
included as part of the scheme, they shall be designed in accordance with DN-GEO-03047 (April 2017) Rural
Cycleway Design (Offline).
5190130-ATK-ZZ-ZZ-RE-RP-0008 25th March 2021
Atkins | 5190130-ATK-ZZ-ZZ-RE-RP-0008_Rev 12.docx Page 13 of 182Strategic Fit and Priority of Project within
Sanctioning Authority Programme/Policy
Policy Background
The N25 Waterford to Glenmore Scheme is consistent and compatible with the following European, National,
Regional and Local policy documents:
European Policy:
• Trans-European Transport Network (TEN-T), Regulation (EU) No. 1315/2013.
o TEN-T Road Network
o TEN-T Ports
❖ Ports 2030 – Gateway for the Trans European Transport Network
o TEN-T Rest Areas
❖ Driving Time and Rest Periods Regulation (EU) No. 561/2006,
❖ Road Infrastructure Safety Management Directive 2008/96/EC
❖ Intelligent Transport Systems (ITS) Directive 2010/40/EC.
National Policy:
• Project Ireland 2040
o National Planning Framework
o National Development Plan 2018 - 2027;
• Strategic Framework for Investment in Land Transport;
• Smarter Travel: A Sustainable Transport Future 2009 - 2020;
• Road Safety Authority Road Safety Strategy 2013 – 2020.
• Spatial Planning & National Roads 2012 – Rest Areas
• Climate Action Plan – 2019
• National Roads Authority (NRA) Service Area Policy 2014 and
• National Policy Framework Alternative Fuels Infrastructure for Transport in Ireland 2017 to 2030
Regional Policy:
• Regional Spatial & Economic Strategy - Project Ireland 2040;
• Port of Waterford Master Plan 2020 – 2044;
• Regional Planning Guidelines for the South-East Region 2010 – 2022.
Local Policy
• Kilkenny County Development Plan 2014 – 2020;
• Kilkenny City and County Draft Development Plan 2021 – 2027;
• Kilkenny Local Economic and Community Plan 2016-2021 (LECP).
5190130-ATK-ZZ-ZZ-RE-RP-0008 25th March 2021
Atkins | 5190130-ATK-ZZ-ZZ-RE-RP-0008_Rev 12.docx Page 14 of 182The objectives of the project are consistent with, and support the relevant policies at European, National,
Regional and Local levels. The proposed project will improve the national road network and enhance accessibility
in the southeast Region.
Project Specific Need.
Overview
This section of the report outlines and discusses the condition of the existing sections of the national road network
under consideration and identifies the project specific needs, such as any network deficiencies and problems.
These deficiencies combined with the European, National, Regional and Local policy discussed in Section 2 of
this report constitute the ‘Need for the Scheme’. The following areas are assessed in terms of network
deficiencies:
• Existing Road Network;
• Existing Traffic Levels;
• Existing Journey Times;
• Existing Level of Service; and
• Existing Road Safety Issues.
Existing Road Network
The section of the N25 under consideration is a rural single carriageway road with varying or inconsistent cross
section widths in terms of carriageway, hard-shoulders / hard-strips and verges. The existing N25 verge is
substandard in width and is lined with unprotected hazards, such as boundary walls, concrete post and rail
fencing, trees, substandard vehicle restraint systems etc. along the entire route. The vertical profile is largely
compliant with one substandard crest curve, but the horizontal alignment has a number of substandard radii and
is made up of sections of back to back curves or successive curves all connected with short lengths resulting in
poor forward visibility for mainline traffic. In addition, the existing junction layouts and direct access layouts do
not conform to standard with excessive dwell areas, acute angle approaches and poor visibility.
There are sixteen local/national road priority junctions along the route and eight of these have a right turn pocket
provided. In addition, there is considerable existing road frontage development spread along the route with
approximately 57 no. direct accesses.
Existing Traffic Levels
Traffic data on the N25 was collected from the existing TII Permanent Traffic Counter located between Glenmore
Village and the Waterford Bypass roundabout i.e. TMU N25 120.0 W, Site ID 000000020253. A summary of the
Average Annual Daily Traffic (AADT) and percentage Heavy Goods Vehicles (HGV) is provided in Table 0-1. The
table indicates that traffic volumes have increased by 8.1% between 2015 and 2019.
*2021 *2020 2019 2018 2017 2016 2015
AADT 7252 10333 12340 12307 12220 11792 11414
% HGV 14.6% 10.5% 8.6% 8.9% 8.5% 8.2% 8.1%
Annual Coverage 14.2% 100% 93.8% 99.7% 99.7% 99.7% 99.7%
Table 0-1 - Summary of Two-Way AADT on the Existing N25
*AADT figures are impacted by the COVID-19 public health restrictions being in place from March 2020 through to 21 st
February 2021 when the 2021 figures were taken.
5190130-ATK-ZZ-ZZ-RE-RP-0008 25th March 2021
Atkins | 5190130-ATK-ZZ-ZZ-RE-RP-0008_Rev 12.docx Page 15 of 182Existing Journey Times
Figure 0-2 provides a summary of the average journey times in seconds, whilst Figure 0-3 provides a summary
of the resultant average speeds on the N25.
Figure 0-2 - Journey Times on the N25 Waterford to Glenmore - Southbound & Northbound
Figure 0-3 - Speeds on the N25 Waterford to Glenmore - Southbound & Northbound
Overall the average daily speeds are 81kph in the northbound direction and 84kph in the southbound direction.
It is noted that lower speeds are typically being recorded in the northbound direction with a noticeable reduction
in the period from 4pm to 8pm.
Existing Level of Service
Table 2-1 above indicates that the existing N25 in 2019 (prior to COVID-19 restrictions being imposed from March
2020) has an AADT of over 12,000 with a steadily increasing trend prior to 2019. The AADT of 12340 is over 6%
in excess of the LOS D capacity of 11,600 AADT for a standard Type 1 single carriageway and over 40% in
excess of the LOS D capacity of 8,600 AADT for a standard Type 2 single carriageway. The current AADT is at
5190130-ATK-ZZ-ZZ-RE-RP-0008 25th March 2021
Atkins | 5190130-ATK-ZZ-ZZ-RE-RP-0008_Rev 12.docx Page 16 of 182the lower limit for the provision of Type 3 dual carriageway road indicating that the existing road is operating at below LOS D. This indicates that traffic flows and operations along this section of the N25 are currently below LOS D and are volatile and vulnerable to instability when subject to minor disruptions or incidents. It is also considered that this vulnerability will increase with prevailing traffic growth rates in the long term with further growth likely into the future based on Travel Demand Projections for the South-East region contained within Unit 5.3 – Travel Demand Projections of the PAG. These factors pose a very significant risk to the future operational performance of the existing road. Traffic volumes along the existing N25 section are above the indicative capacity range for LOS D for a Type 1 or Type 2 single carriageway and it is noted that the proportion of HGV’s along this section are more elevated. As the traffic volumes continue to increase, without intervention the existing LOS will decrease. Existing Road Safety Issues Current available data for a 16 year period from 2005-2020 along the existing N25 study corridor indicates that there have been a total of 37 reported accidents on the N25 between Luffany roundabout and Glenmore roundabout. Of the 37 collisions identified, fourteen involved single vehicle loss of control, five were rear end collisions, seven involved head-on collisions, two were side-on/angle and one pedestrian/vehicle type collision. No incidences involved a vehicle colliding with a cyclist and eight collisions were classified as “other” or “unknown”. Of these collisions there were 10 Fatal, 9 Serious and 31 minor injury injury collisions, resulting in a total of 53 casualties (10 fatalities, 12 serious injury and 18 minor). Based on the RSA Personal Injury Collision (PIC) data for the period 2005-2020 relating to Fatal, Serious and Minor collisions and a comparative assessment with the national average, shows that single vehicle collisions, involving two or more vehicles and side-on/angle type collisions are lower than the national average but that there is a significant safety issue involving head-on and rear-end type collisions compared to the national average. Summary of Project Specific Need The objectives of the project are consistent with, and support the relevant policies at European, National, Regional and Local levels. The Project Specific Need has identified the existing network deficiencies with the section of road operating at a LOS of less than D and inherent road safety issues. This is clearly demonstrated by the worsening collision risk level indicated between Ballinclare and Ballynaraha in the TII 2018 – 2020 network safety ranking. It is noted that in the last sixteen years the highest number of fatal (2) and serious (1) collisions were recorded on the N25 in 2019 and this deteriorating trend can be expected to continue as the AADT increases as there are no planned improvement projects identified for the existing N25. Combined with this is the fact that this section of road is now adjoined at either end by high-quality dual carriageway, creating an inconsistent environment for the road user, further contributing to this deteriorating trend. The key objective of the scheme is to improve the TEN-T network and strategic transport network in County Kilkenny and the south-east region. Furthermore, it is an objective of the project to provide a long-term sustainable solution to improve accessibility to employment in regional and national centres, including the towns of Waterford and New Ross and to maintain/reduce journey times and improve journey time reliability. The project is required to address the sub-standard infrastructure provision and improve the road safety performance of the network. This objective is supported by EU legislation, the NPF, the RPG, the RSES and the Kilkenny City & County Draft Development Plan. Fundamentally, this project addresses these objectives and recognises the importance of interconnectivity across the strategic transport network and towns with the need to protect the N25 as a “Strategic Linking Corridor” / “Strategic National Corridor” suitably upgraded to preserve and continue its strategic functionality. 5190130-ATK-ZZ-ZZ-RE-RP-0008 25th March 2021 Atkins | 5190130-ATK-ZZ-ZZ-RE-RP-0008_Rev 12.docx Page 17 of 182
Traffic Assessment and Option Cross Section
Traffic Modelling Report / Outputs
The Traffic Modelling Report is an appendix to the Cost Benefit Analysis Report in Appendix B of this report. The
Traffic Modelling Report summarises the strategic modelling approach and assumptions made for the
assessment of all Phase 2 Options considered and details of all outputs.
Fifteen feasible options were developed and assessed during the Phase 2 Stage 1 appraisal (refer to Section 6
for details). Of these fifteen options, six options have been brought forward to the Phase 2 Stage 2 appraisal
(refer to Section 7 for details).
These six options have been assessed against the Do-Nothing Scenario using the Future Year Local Area
Models. The following indicators have been used to assess the performance of each option:
    •        Network Performance Statistics;
    •        Journey Times; and
    •        Traffic Volumes.
The Network Performance Statistics indicate that all options, with the exception of the Purple Route, reduce the
total travel time throughout the study area relative to the Do-Nothing Scenario. The performance of each route
in terms of time savings is outlined in Table 0-2.

                        Table 0-2 – 2045 Time Savings by Route Option & Time Period
The journey time analysis shows that the Teal route performs best in terms of journey time saving along the route
compared to the Do-Nothing with a 19% - 34.5% reduction in the northbound direction and a 19.7% - 33.8%
reduction in the southbound direction across all time periods. The Lime Green and Red routes perform similarly
well, with reduction in journey times of 16% - 32% approximately, with marginally quicker journey times modelled
along the Lime Green Route. The Navy and Magenta routes also perform similarly with only very marginal
differences in journey times along these routes. Overall, the reduction on the Navy and Magenta Routes is
between 11% - 28% approximately. The Purple is the worst performing route comparatively and only provides
journey time savings in the southbound direction during the AM peak and the northbound direction in the PM
period. A summary of the percentage reduction in journey times along each route option compared to the Do-
Nothing Scenario is presented in Table 0-3.

5190130-ATK-ZZ-ZZ-RE-RP-0008 25th March 2021
Atkins | 5190130-ATK-ZZ-ZZ-RE-RP-0008_Rev 12.docx                                                Page 18 of 182
Table 0-3 - 2045 N25 Journey Time Savings by Route Option & Time Period
In terms of Route Option AADT and transference of traffic from the existing N25, the highest AADTs are modelled
along the Magenta Route, the partially (65%) online option. The highest AADT along an offline route option is
15,400, which is along the Lime Green route, followed by 15,300 along the Navy Route. Both the Red and Teal
Route carry approximately 14,600 AADT in the design year. The Lime Green Route and Navy Route will
experience higher levels of AADT as there is an intermediate junction and some traffic travelling to or from
locations along the route utilise the new road. The Red and Teal have slightly lower levels of AADT as there is
no intermediate junction assumed given these options are further removed from the existing carriageway. The
Purple route has an AADT of 7,000 as traffic, particularly HGV and car traffic in the IP, fails to transfer due to the
higher journey times. The AADT for each route option and the level of transference from the existing N25 are
outlined in Table 0-4.
Table 0-4 - 2045 AADT & Transference by Route Option
5190130-ATK-ZZ-ZZ-RE-RP-0008 25th March 2021
Atkins | 5190130-ATK-ZZ-ZZ-RE-RP-0008_Rev 12.docx Page 19 of 182Consideration of Alternatives & Options
The following alternatives were assessed in Phase 0 Scope and Appraisal:
• Pre-Constraints Study Alternatives:
o Improved Broadband to facilitate home working and reduce commuter travel demand;
o Vulnerable Road Users (VRU) _ Cycling & Walking
o Public Transport - Rail
o Public Transport – Bus
o Demand Management Proposals
• Road Based Options.
o Do-Nothing
Improved Broadband
For Kilkenny County, the 2016 census shows a higher than average percentage of workers as skilled manual,
16% compared to the national average 14%. A total of 8% of the workforce are categorised as professional and
30% un-skilled, semi-skilled and skilled. Therefore, improvement in broadband alone is unlikely to result in
increased working from home or have any notable impact on traffic levels on the road network. As such,
improvement in broadband was not identified as a suitable alternative to meet the project objectives and was
therefore discounted during Phase 1.
Vulnerable Road Users
An infrastructure solution focused on active modes would only improve access to nearby urban centres over
short distances. Given the longer distances involved in most of the trips that take place on the N25 it is considered
that active travel will not provide a viable alternative to motorised forms of transport for the majority of users and
fail to address several key project objectives.
As such, the implementation of an active-travel based solution, in isolation, is not considered a viable alternative
and the alternative was discounted during Phase 1
Public Transport Alternatives
This section of the existing N25 under consideration generates limited local traffic with the majority of demand
travelling the scheme from end to end and with most traffic travelling between New Ross, Wexford, Enniscorthy
and Waterford. In addition, there is long distance traffic travelling between the larger settlements of Cork,
Dungarvan, Waterford and Rosslare, as well as the HGV traffic between the ports of Cork and Rosslare.
As a strategic section of the network, the N25 facilitates the operations of long-distance public transport provided
by Bus Eireann connecting the counties of Kerry and Cork to Waterford and Wexford and in particular to ports
and airports in the southern half of the country.
Rail Alternative
The nearest operational rail network is the Waterford to Dublin line. There is currently no rail line serving this area
and no plans to open new services, a Rail Alternative is not considered to be feasible, in addition a rail alternative
in isolation would fail to address key objectives and therefore was discounted at Phase 1.
Bus Alternative
There is one local bus route which travels regularly on the N25 and services the surrounding area of Glenmore
between Waterford and New Ross, this service is provided by a combination of the 370 and 372 buses.
Analysis of design year traffic forecasts, as outlined in Chapter 3 of this report, revealed that AADTs will be over
16,000 along this section of the N25 in 2045. This is significantly over the 11,600 AADT required for a Level of
Service D and indicates that a viable public transport alternative would be required to result in over a 30%
5190130-ATK-ZZ-ZZ-RE-RP-0008 25th March 2021
Atkins | 5190130-ATK-ZZ-ZZ-RE-RP-0008_Rev 12.docx Page 20 of 182reduction in vehicular travel to result in a suitable Level of Service on this section of the N25. Additionally, a bus
based public transport alternative in isolation would fail to address several key objectives
As such, the implementation of a bus based public transport solution, in isolation, is not considered a viable
alternative and this alternative was discounted during Phase 1.
Demand Management Option
Given the rural nature of the project location and in the context of the key objectives identified it is
anticipated that Demand Management Proposals will have a limited impact and may not be appropriate.
For example, the implementation of a reduced speed limit could reduce the number and severity of
collisions but would increase journey times and reduce average speeds along the route. Similarly, the
implementation of a toll could result in re-routing onto less suitable local roads resulting in longer journey times
and potentially more collisions. Tolls would also be an additional cost to business and freight users.
A Demand Management Option will fail to address the key project objectives and the implementation of a Demand
Management solution is not considered a viable alternative and this alternative was discounted during Phase 1.
Road Based Options
As part of the TEN-T comprehensive network and as identified in the Regional Spatial & Economic Strategy and
National Planning Framework – Project 2040 a road-based option is considered viable based on the direction of
specific policy (TEN-T EU Regulation No. 1315/201 under Article 17(3) and references in regional and national
transport strategies (NPF/RSES – Project Ireland 2040).
Although the consideration of options is determined largely by local conditions, there are a number
of specific options which should be considered, and they are:
• Do-Nothing
• Do-Minimum (The Base Case) - the Do-Minimum is considered the same as the Do-Nothing scenario
• Do-Something
• Management Option
Do-Nothing
In the “Do-Nothing” scenario, users of the N25 will be subjected to the sub-standard alignment with insufficient
sightlines and restricted road cross-section and retains the mixture of local traffic with the long-distance high-
speed and freight traffic.
The option of “Do-Nothing’ would not realise the route’s strategic function in terms of future traffic demands, nor
address the current safety concerns associated with the road in terms of collisions and risk rating. This is in direct
conflict with the European, National, Regional and Local planning policies. As such, the alternative of a ‘Do-
Nothing’ solution, was not considered a viable alternative and this alternative was discounted during Phase 1.
Do-Minimum
For the N25 Waterford to Glenmore scheme there are no committed projects or policies in the study corridor that
have successfully completed their environmental review and as such the Do-Minimum is considered the same
as the Do-Nothing scenario. Like the ‘Do-Nothing’ the ‘Do-Minimum’ would not realise the strategic function in
terms of future traffic demands, nor address the current safety concerns nor meet the TEN-T requirements which
is in conflict with Local, National, Regional and European planning policies. As such, the alternative of a ‘Do-
Minimum’ solution, was not considered a viable alternative and is used solely as the Base Case for the purpose
of assessments and comparison with viable alternatives.
5190130-ATK-ZZ-ZZ-RE-RP-0008 25th March 2021
Atkins | 5190130-ATK-ZZ-ZZ-RE-RP-0008_Rev 12.docx Page 21 of 182Do-Something At the highest level, a corridor improvement can be delivered through a major investment to widen an existing road, or to develop a new alignment. Typically, a number of physical options are possible at this level of investment. A ‘Do-Something’ road-based solution has the potential to meet key project objectives and is therefore considered viable. Management Option The Management Option is a Do-Something Option utilising the existing asset where feasible through on-line improvements, bottleneck removals and road safety works, traffic management measures or Intelligent Transport Systems are considered. This optimum Management Option (Magenta Option) with limited collector roads is considered a feasible alternative as it meets the key objectives to provide a high-quality road, albeit to a lesser degree compared to the partial Management options or fully off-line options. The proposal will improve safety through the removal of cross-over movements and the provision of safe overtaking opportunities associated with a dual carriageway. Based on this the management option (Magenta Option) utilising 65% on-line with limited collector roads and 35% off-line improvement, has been included in the Phase 2 Stage 2 assessment. It is noted that two of the remaining five ‘Do-Something’ options, the Navy and Lime Green Options, utilise approximately 30% and 25% of the existing N25 alignment. These options do not require collector roads and can accommodate the reduction of junctions and the removal of direct accesses and are considered partial management options. 5190130-ATK-ZZ-ZZ-RE-RP-0008 25th March 2021 Atkins | 5190130-ATK-ZZ-ZZ-RE-RP-0008_Rev 12.docx Page 22 of 182
Stage 1 – Preliminary Options Assessment
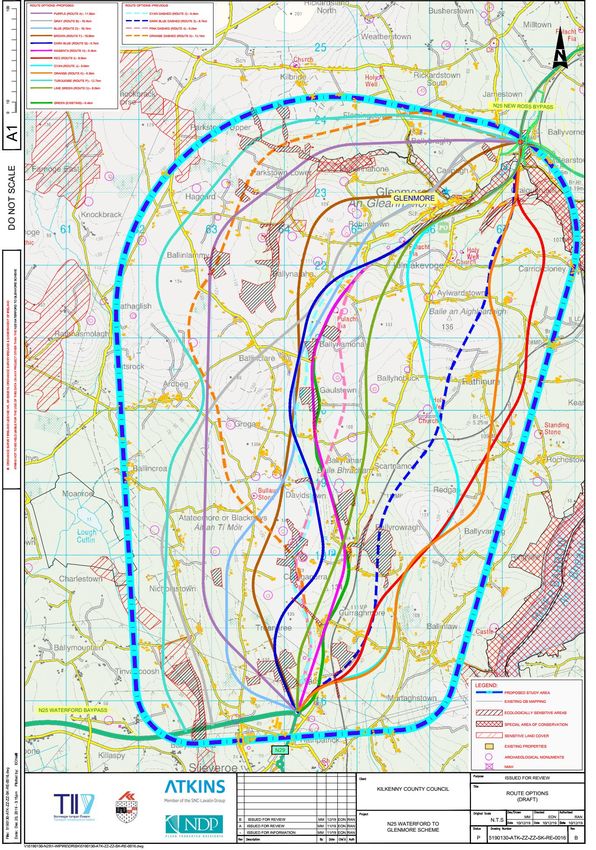
Identification of Route Options
Fifteen feasible options were developed having regard to the Constraints Study prepared for the N25 Waterford
to Glenmore Scheme Study Area. The fifteen feasible options identified within the Study Area for the Phase 2
Stage 1 Preliminary Options Assessment are listed as follows and shown in Figure 0-4 below:
• Do-Nothing/Do-Minimum
• Route A – (Purple
• Route B – (Grey)
• Route D – (Blue)
• Route F – (Brown)
• Route F – (Brown)
• Route G – (Dark Blue)
• Route H – (Magenta)
• Route I – (Red)
• Route J – (Cyan)
• Route K – (Orange)
• Route P – (Turquoise)
• Route Q – (Lime Green)
• Route 2 – (Cyan Dashed)
• Route 3 – (Dark Blue Dashed)
• Route 4 – (Pink Dashed)
• Route 6 – (Orange Dashed
A Phase 2-Stage 1 Preliminary Options Assessment in accordance with the TII Publication Project Management
Guidelines was carried out for each of the feasible options under the assessment criteria headings of Engineering,
Economy and Environment.
5190130-ATK-ZZ-ZZ-RE-RP-0008 25th March 2021
Atkins | 5190130-ATK-ZZ-ZZ-RE-RP-0008_Rev 12.docx Page 23 of 182`
Figure 0-4 – Feasibility Options for the Phase 2 Stage 1 Assessment
5190130-ATK-ZZ-ZZ-RE-RP-0008 25th March 2021
Atkins | 5190130-ATK-ZZ-ZZ-RE-RP-0008_Rev 12.docx Page 24 of 182Summary Matrix for Phase 2 – Stage 1 Preliminary Options Assessment
Table 0-5 below identifies the assessment findings of the Phase 2 – Stage 1 Preliminary Options Assessment.
Preferences are colour coded to show the High (green), Medium (amber) and Low (red) preferences listed for
each preliminary route option under each of the three main criteria of Engineering, Environment and Economy.
Route Options Engineering Environment Economy Progress to Stage 2
Do-Nothing / Do Low Preference Med Preference Low Preference Yes (for comparison
Minimum purposes only)
Purple (A) High Preference High Preference Low Preference Yes
Grey (B) Low Preference Med Preference Low Preference No
Blue (D) High Preference Med Preference Med Preference No
Brown (F) High Preference Low Preference Med Preference No
Dark Blue (G) Med Preference High Preference Med Preference No
Magenta (H) Low Preference High Preference High Preference Yes
Red (I) High Preference Low Preference High Preference Yes
Cyan (J) Low Preference Low Preference High Preference No
Orange (K) Med Preference Low Preference High Preference No
Turquoise (P) Med Preference Med Preference Low Preference No
Lime Green (Q) High Preference High Preference High Preference Yes
Cyan Dashed (2) Low Preference High Preference High Preference Yes
Dark Blue Dashed (3) Med Preference Med Preference High Preference Yes
Pink Dashed (4) Low Preference Med Preference High Preference No
Orange Dashed (6) Med Preference Med Preference Low Preference No
Table 0-5 - Summary Matrix for Phase 2 – Stage 1 Preliminary Options Assessment
5190130-ATK-ZZ-ZZ-RE-RP-0008 25th March 2021
Atkins | 5190130-ATK-ZZ-ZZ-RE-RP-0008_Rev 12.docx Page 25 of 182Stage 2 – Project Appraisal Matrix
Description of Phase 2 – Stage 2 Alternative Options
The Engineering, Economic and Environmental assessment for the Phase 2 Stage 1 Preliminary Options
recommended the following ‘Do-Something’ feasible options to be brought forward to the next stage (Phase 2
Stage 2: Project Appraisal Matrix). These options are the Phase 2 Stage 1 Route Options with the revised option
name used for Phase 2 - Stage 2 assessment:
• Route A (Purple) Purple
• Route H (Magenta) Magenta
• Route I (Red) Red
• Route Q (Lime Green) Lime Green
• Route 2 (Cyan Dashed) Navy
• Route 3 (Dark Blue Dashed) Teal
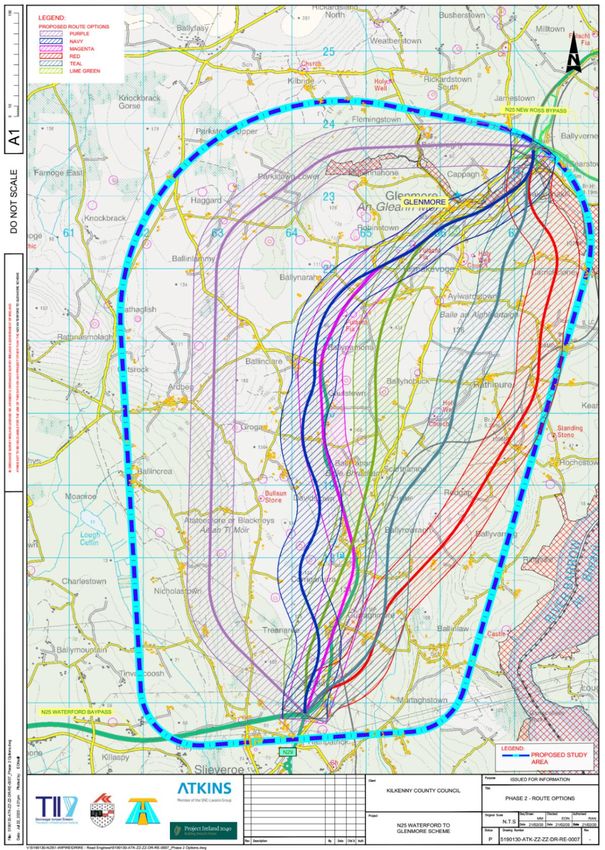
A Phase 2-Stage 2 Project Appraisal was carried out for each of the six route options identified above, each with
a 600m wide corridor, refer to Figure 0-5 below. The appraisal was undertaken in accordance with TII’s Project
Management Guidelines by Atkins project team comprising engineering, economic and environmental
consultants.
(Please note that the ‘Route 2 (Cyan Dashed) and Route 3 (Dark Blue Dashed) route options were renamed
‘Navy’ and ‘Teal’ respectively and the route letters and numbers omitted from all options. This was done
to provide clarity in further analysis of the route options.
5190130-ATK-ZZ-ZZ-RE-RP-0008 25th March 2021
Atkins | 5190130-ATK-ZZ-ZZ-RE-RP-0008_Rev 12.docx Page 26 of 182Figure 0-5 – Phase 2 Stage 2 Route Options 5190130-ATK-ZZ-ZZ-RE-RP-0008 25th March 2021 Atkins | 5190130-ATK-ZZ-ZZ-RE-RP-0008_Rev 12.docx Page 27 of 182
Multi Criteria Analysis
For this scheme both a Cost Benefit Analysis, and a Multi Criteria Analysis for each of the route options have
been completed. The Multi Criteria Analysis for this scheme has been carried out with reference to the Project
Appraisal Guidelines for National Roads Unit 7.0-Multi Criteria Analysis (PE-PAG-02031). Each impact was
attributed a score based on its level of impact using the seven-point scale referenced below in Table 0-6.
                                        Score       Impact Level
                                           7        Major or highly positive
                                           6        Moderately positive
                                           5        Minor or slightly positive
                                           4        Not significant or neutral
                                           3        Minor or slightly negative
                                           2        Moderately negative
                                           1        Major or highly negative

                                           Table 0-6 - MCA Score System
The Project Appraisal Matrix (in Appendix L) consists of an appraisal of each route option for the Phase 2 Stage
2 Option Selection process under the following main criteria:
      •      Economy
      •      Safety
      •      Environment
      •      Accessibility and Social Inclusion
      •      Integration
      •      Physical Activity

Overall Summary of the Economy Appraisal
Table 0-7 gives the overall summary of Economy assessment taken from the Cost Benefit Analysis Report
(Appendix B).

Route Option        Transport Quality        Efficiency &        Wider Economic     Funding          Overall
                       & Reliability        Effectiveness           Impacts         Impacts          Ranking
Purple                 Intermediate         Lest Preferred          Intermediate   Intermediate   Lest Preferred
Navy                    Preferred                Preferred          Intermediate   Intermediate      Preferred
Magenta                 Preferred               Intermediate        Intermediate   Intermediate    Intermediate
Teal                    Preferred               Intermediate        Intermediate   Intermediate    Intermediate
Lime Green              Preferred                Preferred          Intermediate   Intermediate      Preferred
Red                     Preferred           Lest Preferred          Intermediate   Intermediate   Lest Preferred

                                      Table 0-7 - Economy Assessment Ranking

5190130-ATK-ZZ-ZZ-RE-RP-0008 25th March 2021
Atkins | 5190130-ATK-ZZ-ZZ-RE-RP-0008_Rev 12.docx                                                 Page 28 of 182
Overall Summery of the Safety Appraisal
Table 0-8 gives the overall summary of Safety and the preferences assigned by the assessors following the in-
depth analysis of the strengths and weaknesses of each option as detailed in the Stage F (Part 1) Road Safety
Audit, the Road Safety Impact Assessment and the Safety Assessment as outlined in the Phase 2 – Stage 2
Assessment Matrix.
Route RSA Stage F1 RSIA Overall Ranking Phase 2 – Stage 2 - Overall Safety
Option Safety Criteria Ranking
Purple Preferred Least Preferred Least Preferred Least Preferred
Navy Intermediate Preferred Preferred Preferred
Magenta Less Preferred Intermediate Intermediate Intermediate
Lime Green Intermediate Preferred Preferred Preferred
Teal Preferred Intermediate Preferred Preferred
Red Preferred Intermediate Preferred Preferred
Table 0-8 - Overall Safety Ranking (Preferences)
Overall Summary of Environmental Appraisal
The following Table 0-9 Stage 2 - Environmental Assessment Matrix Summary provides the summary scores of
the environmental matrix utilised within this assessment. The full matrix is located in Appendix I.
Environmental Sub-criteria Purple Navy Magenta Red Teal Lime Green
Air Quality 5 6 4 6 7 6
Climate 3 3 3 3 3 3
Noise 2 3 3 3 3 3
Landscape and Visual (including light) 1 3 3 1 1 1
Biodiversity- Flora and Fauna 1 1 1 1 1 1
Waste 2 3 3 1 1 2
Soils and Geology 3 2 1 3 3 2
Hydrology 4 3 3 3 3 3
Hydrogeology 2 3 3 4 4 3
Architectural Heritage 4 3 3 3 2 1
Archaeological and Cultural Heritage 2 1 2 2 2 1
Non-agricultural properties 2 1 1 2 3 1
Agriculture 1 2 2 1 2 2
Human Beings 3 3 1 2 3 2
Human Health 3 3 3 3 3 3
Total 38 40 36 38 41 34
Table 0-9 - Environmental Assessment Matrix Summary
Overall Summary of Accessibility & Social Inclusion Appraisal
In the context of Accessibility and Social Inclusion all options are considered to be of similar preference in this
regard, which is neutral. The full matrix is located within Appendix L.
5190130-ATK-ZZ-ZZ-RE-RP-0008 25th March 2021
Atkins | 5190130-ATK-ZZ-ZZ-RE-RP-0008_Rev 12.docx Page 29 of 182Overall Summary of Integration Appraisal
The overall integration assessment for each route options has resulted in varying preferences, these are
summarised in Table 0-10.
Route Transport Land Use Geographical Other Overall Safety
Option Integration Integration Integration Government Ranking
Policy
Integration
Purple Least Preferred Intermediate Preferred Preferred Least Preferred
Navy Preferred Intermediate Preferred Preferred Preferred
Magenta Least Preferred Intermediate Preferred Preferred Least Preferred
Lime Green Preferred Intermediate Preferred Preferred Preferred
Teal Intermediate Intermediate Preferred Preferred Intermediate
Red Intermediate Intermediate Preferred Preferred Intermediate
Table 0-10 - Overall Integration Preferences
Overall Ranking of Physical Activity
The overall Physical Activity assessment for each route options has resulted in varying preferences, these are
summarised in Table 0-11.
Route Option Ambience Absenteeism Reduced Health Risks Overall Safety Ranking
Purple Least Preferred Intermediate Intermediate Least Preferred
Navy Preferred Intermediate Intermediate Preferred
Magenta Least Preferred Intermediate Intermediate Least Preferred
Lime Green Preferred Intermediate Intermediate Preferred
Teal Intermediate Intermediate Intermediate Intermediate
Red Intermediate Intermediate Intermediate Intermediate
Table 0-11 - Overall Physical Activity Preferences
Conclusion
Based on the multi-criteria analysis, the RSA Stage F1, the RSIA assessments detailed in Table 0-8 – Phase 2
Stage 2 Assessment and taking into account the key objectives set for the scheme, it is recommended that the
Navy Route Corridor is progressed through to Phase 3 Design and Environmental Evaluation and Phase 4
Statutory Processes stages for the N25 Waterford to Glenmore Scheme.
Table 0-13 shows the overall scoring for all six routes with the Navy scoring the highest points. While these points
are a guide, the Emerging Preferred Route Corridor is discussed further based on how it compares to the other
options.
ROUTE OPTIONS Purple Navy Magenta Red Teal Lime Green
ENVIRONMENTAL SUB TOTAL 38 40 36 38 41 34
SAFETY SUB TOTAL 13 20 15 20 21 22
PHYSICAL ACTIVITY SUB TOTAL 10 14 10 13 13 14
ACCESSIBILITY & INCLUSION SUB TOTAL 8 8 8 8 8 8
INTEGRATION SUB TOTAL 20 26 22 24 24 26
ECONOMY SUB TOTAL 13 18 16 16 17 19
OVERALL TOTAL 102 126 107 119 124 123
Table 0-13 - Phase 2 Stage 2 Assessment
5190130-ATK-ZZ-ZZ-RE-RP-0008 25th March 2021
Atkins | 5190130-ATK-ZZ-ZZ-RE-RP-0008_Rev 12.docx Page 30 of 182You can also read