Fire and Collapse, Faculty of Architecture Building, Delft University of Technology: Data Collection and Preliminary Analyses
←
→
Page content transcription
If your browser does not render page correctly, please read the page content below
Fire and Collapse, Faculty of Architecture Building, Delft University of
             Technology: Data Collection and Preliminary Analyses
            Brian Meacham1 and Haejun Park, Worcester Polytechnic Institute, USA
           Michael Engelhardt and Adam Kirk, The University of Texas at Austin, USA
                       Venkatesh Kodur, Michigan State University, USA
                IJsbrand van Straalen and Johan Maljaars, TNO, the Netherlands
               Kees van Weeren, Delft University of Technology, the Netherlands
                     René de Feijter and Kees Both, Efectis, the Netherlands

ABSTRACT

On the morning of May 13, 2008, a fire that started in a coffee vending machine on the 6th floor
of the 13-story Faculty of Architecture Building at the Delft University of Technology (TUD),
Delft, the Netherlands, quickly developed into an extreme loading event. Although all building
occupants evacuated safely, the rapid fire spread severely impacted fire department operations,
allowing the fire to burn uncontrolled for several hours, eventually resulting in the structural
collapse of a major portion of the building. With the fire continuing to burn after collapse,
damage was ultimately significant enough that the building had to be demolished. Collecting and
archiving data from this fire is extremely important because structural collapse of high-rise
buildings due to fire has historically been quite rare. There are several reasons for this, from the
overall infrequency of fire ignition in high-rise buildings, to the combination of structural fire
resistance of the frame, fire-rated compartment barriers, automatic fire suppression systems, and
fire department suppression activities generally associated with the fire protection strategy for
high-rise buildings. This event offers a unique opportunity to study the performance of a code-
compliant high-rise building in a major fire wherein the outcome was different than might
typically be expected. In order to facilitate analyses of this event, researchers in the United States,
under a Small Grant for Exploratory Research (SGER) from the National Science Foundation
(NSF award 0840601), teamed up with researchers from TNO and Efectis in the Netherlands,
along with Prof. Kees van Weeren of the TUD Faculty of Architecture, to collect data on the fire
and collapse. A summary of data collected and outcomes of preliminary analyses are presented.

BACKGROUND AND INTRODUCTION

Fire in high-rise buildings is rare: structural collapse due to fire even more so. When the fire and
partial collapse of the Faculty of Architecture Building at TUD occurred, it was recognized that
this event provided an opportunity to form a multi-disciplinary, multi-national team to collect
data that could be helpful to researchers, engineers and building regulatory officials understand
the combination of building and fire characteristics which combined to result in this loss and to
develop recommendations aimed at helping to prevent such events in the future. The team was
soon formed, consisting largely of the authors, and a plan was developed for collecting and
archiving data and information about the building and the event [1].

1
 Author for correspondence. Department of Fire Protection Engineering, WPI, 100 Institute Road, Worcester, MA
01609, USA, +1 508 831 6778, bmeacham@wpi.edu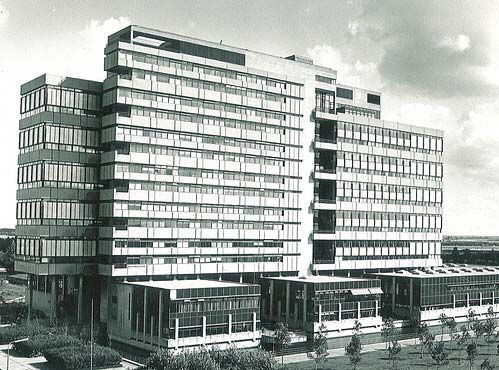
Information and Data Needs

In order to facilitate reconstruction and analysis of a fire event, it is necessary to gather sufficient
data and information to (a) develop a time history of the incident, (b) determine the location of
fire origin, and (c) establish factors contributing to the fire growth, including successes against
the fire and critical failures contributing to its spread [2]. This data subsequently supports failure
analysis, which focuses on building performance during the incident, given the building,
occupant and fire characteristics. Successful fire reconstruction and analysis therefore requires
obtaining pre-fire history and trans-fire information [2,3,4].

Pre-fire data and information establishes the condition of the building, training of the occupants,
and emergency response procedures in place prior to the fire event, and includes architectural,
structural, mechanical, electrical, plumbing and fire protection features of building as built and at
the time of fire, information on the building uses, contents, and facility and emergency
management procedures and protocols. Trans-fire events are those events from the point of
established burning to extinguishment. Data regarding trans-fire events can be obtained from still
photographs and action recordings (digital movies, video, etc) at all stages of the fire, interviews
with first responders to determine their response, set up, actions on scene, including fire-fighting
and rescue operations, interviews with building occupants, and maps, diagrams, weather data,
and other such information helpful to understanding the situation of the day. Collection of these
types of data and information are consistent with other major fire investigations, including those
with significant structural collapse such as World Trade Center towers 1, 2 and 7 [5,6].

Data Collection

Over the course of several months, including three team meetings held in the Netherlands,
specific data and information needs were identified and agreed, and a significant amount of data
and information was gathered. The data and information was collected from a number of sources,
including:

 x   TUD Faculty of Architecture documents, publications, photographs and videos.
 x   TUD students, faculty and staff.
 x   Members of the Delft Fire Department and Building Department who were at the fire.
 x   Reports of investigations carried out by others.
 x   Photograph and video sharing websites, including general sites such as www.flickr.com
     and http://picasa.google.com, as well as a dedicated site set up at TUD for students and
     others to post, http://gallery.tudelft.nl, and the video posting site www.youtube.com.
 x   Professional photographers and videographers.

The data and information collected was extensive, and included:

 x   Architectural drawings, including location of fire barriers and fire equipment.
 x   Complete structural drawings and original structural calculations .
 x   More than 3000 photographs of the building, pre-, trans- and post fire, with pre-fire photos
     showing layout, contents of spaces, interior partitions and finishes, trans-fire photographs
     showing the fire progression, and post-fire photographs showing structural damage.
x From interviews we conducted, eyewitness accounts from: a student who was involved in
initial fire extinguishment activity, a Faculty of Architecture staff member who was part of
building’s emergency response team and who observed the early stages of the fire and
activated manual alarm, a facilities management person who was in the building at the time
of the fire, four fire service personnel intimately involved in fire extinguishment activity,
including first responding fire team, second responding team, and command officers, and
members of the inspectional services of the local government, who provided photographs
taken during and after the fire, as well as plans and documents associated with the building.
x From interviews we conducted, information from facilities management staff, including
descriptions of building construction details, layout, modifications underway, material in
vicinity of fire ignition, fire barrier construction, ceiling void arrangement, building
systems, and related information specific to the Faculty of Architecture Building.
Data Storage
To archive the data, an internet-based multi-user document storage and retrieval site has been set
up using the SharePoint package from Microsoft. The intent of the data archiving is twofold: to
provide a central storage area for data to be used by the project team and others in forensic
analyses related to the fire and structural response, and to provide a template for a data repository
for information about significant fires and collapses world-wide. At present, access to data for
analyses by others can be obtained by contacting the authors. In the future, it is envisioned to
modify the database such that can be added to as events occur, by those with access to the data,
creating a common resource for international research and analyses of such events.
Initial Analyses
Given the large amount of data, it has been possible to undertake some preliminary analyses
related to reconstructing the fire event and subsequent structural collapse. This includes piecing
together a timeline of the fire from photographs, videos and eyewitness accounts, undertaking a
preliminary reconstruction of the first 40 minutes of the fire, estimating fire spread and resulting
compartment temperatures, and conducting preliminary structural response to the fire event. The
following sections provide an overview of the building, the timeline of the event, the initial fire
in the compartment of origin, and preliminary structural response calculations.
THE BUILDING
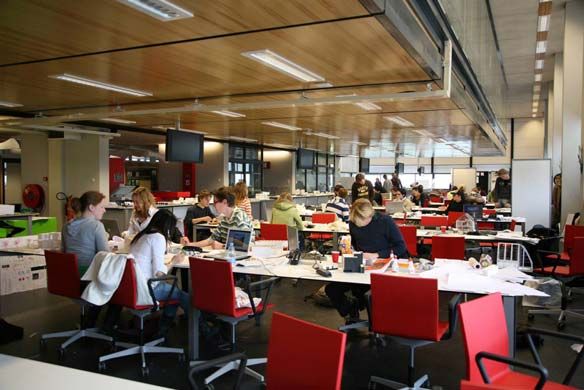
Completed in 1970, the Faculty of Architecture (FOA) building was a reinforced concrete and
steel structure consisting of a combination of six, 3-story structures, which effectively served as a
podium, with a 13-story tower located above (see Fig. 1). The 3-story structures included
basement, ground floor and 1st floor. These structures were characterized by public use space,
including an architectural library, an auditorium, exhibition halls, and a cafeteria. The tower
served primarily as academic space, featuring lecture halls, offices, and design studios. Floors 2-
12 were characterized by a combination of 1- and 2-story interior spaces (see Fig. 2). The 2-story
spaces were design studios, characterized by large windows to allow significant natural lighting.
Even- and odd-numbered floors were linked in such a way that the studio space carried the floor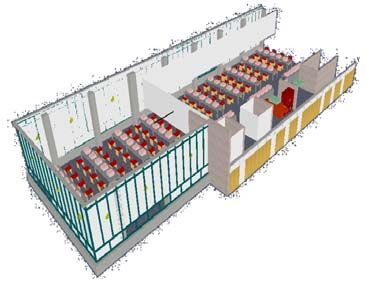
designation of the even number (e.g., floors 2 and 3 were linked such that the studio space was
designated as floor 2, with the ceiling of that space being the floor 3 ceiling).

  N

                                                       76m
                                                 22m
               108m

                      140m

                             Fig. 1 Satellite top view and bird eye view [7]

Given the nature of the structural design, there was a different floor-slab, joist and beam
configuration on even-numbered versus odd-numbered floors. As such, although the ceiling
height was nominally 2.7 m for both even and odd floors, spaces above ceilings were
approximately 0.3 m and 1m for even floors and odd floors, respectively, excluding approximate
slab thickness of 0.15m. This arrangement resulted in 5.85 m ceiling height for the studio spaces.

                                                                        The rectangular floor plan
                                                                        of the tower, approximately
                                                                        108 m long by 22 m wide,
                                                                        could be largely divided
                                                                        into three sections: North,
                                                                        South and Center (or Core).
                                                                        The North and South
                                                                        sections      had      almost
                                                   8                    identical floor plans with
                7
                                                                        approximately 5 offices, a
                                                   6                    glass-enclosed      stairwell,
                5
                                                   4                    and  an  architectural design
                3                                                       studio or lecture hall. The
                                                   2                    South section also had a
                                                                        glass-enclosed       elevator.
                                                                        The North and South
                                                                        sections can be largely
                                                                        divided into two parts:
       Fig. 2. Faculty of Architecture Building Elevation [8]           studio area and office area.
Floors 6 and 7 are illustrated in Fig 3, with the studio area represented by the large open space on
the 6th floor. The outlined space over the studio on the 7th floor reflects the mezzanine area
offices. The Center section featured the main stairs, elevators, and restrooms, along with some
offices, meeting rooms and storage spaces.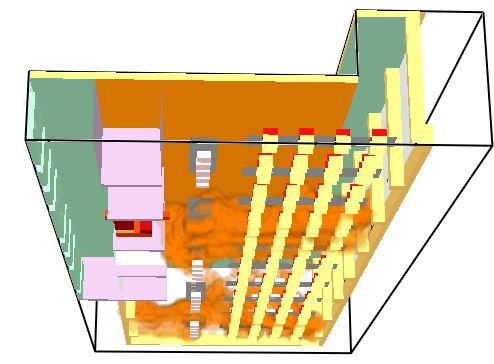
5.4m                                                                       N

                                                                        5.4m

                                                                                13.5m
                                                       Fire origin                      6th Fl.

                    29.7m             27m                    40.5m

                                                                                        7th Fl.

          Fig. 3 Floor plans of 6th (upper) and 7th(lower) floors and their dimensions [8]

As noted above, the North and South sections of even-numbered floors had a larger floor area
than did odd-numbered floors. This is a function of the design studios, whose floors were located
at even levels, resulting in a mezzanine floor on odd levels, which overlooked the design studios.
This is illustrated in Fig. 4. The floor area of the design studios at even floors was approximately
14 m wide and 40 m long, and the
space underneath mezzanine or odd
floor was largely 14 m wide and 27
m long floor area. The arrangement
repeated itself 5 times from floors
2-11 (office areas only on floors
12-13). Note from Fig. 2 that the
columns were located slightly
inside of the boundary of the
exterior walls. This allowed
horizontally continuous exterior
windows. For the tower section, the
height of the exterior window sill
was 0.9m and the window heights
were 1.8 m for the 1-story ceiling Fig. 4. Photograph of double-height studio with
height and 4.95 m for the 2-story mezzanine floor, furniture and materials typical of
ceiling height. In both cases, the Faculty of Architecture building at time of fire [9].
top of the exterior windows reached the ceiling of each space. Exterior windows horizontally
continued for 40.5 m and 67.5 m for office areas and design studio areas, respectively, which
indicates that about 225 m out of 250 m of the tower perimeter was enclosed by windows whose
height were either 1.8m or 4.95m. The combination of large open studio spaces and large
window openings are of interest with respect to fire spread beyond the compartment of origin
(design studio, 6th floor, South section) vertically up the South section and horizontally through
the Center and to the North, where the collapse occurred.
EVENT TIMELINE
Using photographs, video and witness statements, a comprehensive timeline was developed. The
timeline includes all reported activities starting with a water leak, which was discovered and
repaired in the building early in the morning, until the fire was extinguished. The timeline
includes data for which times are known or reported, as well as statements for which times are
not known but estimated based on collaborating statements and evidence. The excerpt below
focuses on the period from just before the fire until initial compartment full involvement.
References to sources in the table below include reports (COT [10]), witness statements
(Interseco [11] alphabetical references) and photographs.
Time Report - Time Known/Reported Source
08:15 - People recognize smell from coffee vending machine. Plugs are being pulled out of the COT,
08:30 sockets on the fifth and sixth floor. The coffee machine is not touched. No visible smoke. F, G, J
Smoke coming out of the coffee vending machine. Smoke seems to come out of a gap
8:55 L
between the top of the machine and the red pantry unit. The smoke is light-grey.
White smoke coming out of a slot above the coffee vending machine. A BHV-employee gets a COT,
9:00 call about the fire and is asked to take a look at the sixth floor. A gets a message (pager) A, H,
concerning something like ‘brandcentrale’. Starting fire on the sixth floor. K, N, Q
Smoke coming out of the machine ‘in a stripe’ (from small slot at top front). J describes as COT,
9:10
‘filthy black smoke’. “Fire balls” (likely burning cups) observed coming out of machine. H, J, Q
H and J are extinguishing a starting fire using a hand-extinguisher. Smell of an 'unpleasant'
9:15 F
fire stink. Big flames coming out of the coffee machine. F sends H and J away.
9:16 The FD gets call for help from a TU Delft project manager. Fire alarm push button activated. COT
9:18 The Regional Alarm Centre gets an automatic fire alarm from the Faculty of Architecture. COT
The first fire brigade arrives at the building and notices smoke on the outside, but no fire.
9:27 COT
BHV-workers have evacuated the people in the building.
The second fire officer reports a ‘middelbrand’ (medium fire). The first fire officer sends four
9:32 people with ‘flatkratjes’ to the sixth floor. The people on the sixth floor are trying to COT
extinguish the fire by using the fire hose, there’s almost no pressure, so it’s useless.
The second fire officer reports a ‘grote brand’ (large fire). The heat is intense and a thick layer
9:33 of smoke fills the space. Soon flames are starting on the ceiling and they retreat. Just before COT
they want to leave through the door, there is a flashover which puts the whole area on fire.
9:50 Conflagration on 6 & 7 South, both sides (E & W) and extending very quickly via the façade. COT
11:30 Floors 6-11 on fire (South section) COT
12:15 All fire fighters now outside of the building. Fire spread into Center section. COT
12:55 Fire spreads to North section (10th floor) Photos
13:39 Fire observed on North section, Floors 7-11 Photos
16:40 Part of North section collapses COT
INITIAL RECONSTRUCTION OF FIRST MATERIALS BURNING
Based on data and information collected, a model of the compartment of origin, the South
section of the 6th floor, was created using Fire Dynamics Simulator (FDS), a field fire modeling
software developed by the U.S. National Institute of Standards and Technology [12]. Since
knowledge of the materials involved in the fire is incomplete, and given a large compartment
size, it was deemed reasonable to use the prescribed heat release rate (HRR) approach. In this
approach, if the surface temperature of a material reaches its ignition surface temperature, the
material burns with a prescribed HRR, which is approximated from fire test data. Glass breakageis an important factor in this simulation. Based on Manzello et al. [13] it is assumed that once
exposed glass surface temperature reaches 400oC glass will break. Dimensions of the space were
taken from drawings. Contents were arranged based on photographs of the studio space prior to
the fire. A representation of the FDS geometry is provided in Fig. 5 and 6.
Fig. 5. Geometry showing mezzanine area Fig. 6. Floor area under mezzanine floor
Building features, materials and material properties were estimated, and HRR curves were
developed. Representative material properties and HRR curves are illustrated below.
Table 2. Materials and Properties used in FDS Simulation
Thermal Specific Ignition
Model Description Density Thickness
Cond. heat Temp.
W/m-K kJ/kg-K Kg/m3 m o
C
Coffee Machine 5mm thick MDF covered with
0.15 [14] 2.8 [14] 640 [14] 0.005 350 [15]
Enclosure a polyester material
Student study
Polystyrene foam 0.03[16] 1.5[16] 20[16] 0.01 350[15]
model works
10 student work tables, 5
Tables presentation tables, approx. 0.15[14] 2.8 [14] 640 [14] 0.02 350 [15]
5.4m(W)*1.2(m)
Chairs Polyurethane chair 0.02[16] 1.3[16] 32[16] 0.02 280[16]
About 8 units in total,
Corridor Cabinet 0.15 [14] 2.8 [14] 640 [14] 0.005 350 [15]
2.1(H)*(1.8~4.5(W))*0.3m(D)
Coffee machine Burner Coffee Enclosure
450 350
400
300
350
250
300
HRR (kW/m2)
HRR (kW/m2)
200
250
200 150
150
100
100
50
50
0
0 0 100 200 300 400 500 600 700 800 900
0 100 200 300 400 500 600 700 800 900 time(s)
time(s)
Fig. 7. Coffee Machine Burner HRRPUA [17] Fig. 8. Coffee Machine Enclosure (wood) [17]Several simulations were run, and as appropriate, modifications were made to correspond with
witness observations. Key assumptions and modifications include:
x To provide initial ventilation, three windows are opened.
x At about 240s (09:34AM) the corridor cabinet is ignited. The ceiling of mezzanine floor
is ignited and flame spreads on the ceiling to the studio area.
x At about 300s (09:35AM) the corridor is fully involved. About half of the ceiling under
the mezzanine catches on fire. Some student models (polystyrene foam) are ignited.
x At about 360s (09:36AM) fire reaches steady state due to lack of oxygen.
x At about 830s (09:44AM) a window is broken on the east side.
The HRR history of the simulation is shown in Fig. 9. Fig. 10 provides a snapshot of the FDS at
360 s into the simulation. Based on the level of data and information available, it is concluded
that it possible to simulate the initial fire conditions with a reasonable degree of confidence.
Fig 9. HRR History for Initial Fire Fig 10. FDS Snapshot at 360 s
PRELIMINARY ANALYSIS AND OBSERVATIONS OF STRUCTURAL RESPONSE
Collapse of a major reinforced concrete structure in fire, as occurred with this building, is a rare
event. Consequently, it is important to understand the factors that led to the collapse, and the
implications these factors have on our understanding and practices for assessing the structural
fire resistance of reinforced concrete structures. As a first step, it was necessary to obtain a clear
description and understanding of the structural system of the building. Fortunately, excellent
records were kept from the original design and construction, and a nearly complete set of
structural design drawings and calculations were available. Based on the available information,
following is a brief description of the structural system for the tower portion of the building.
The FOA Building was a reinforced concrete structure that used mild (non-prestressed) steel
reinforcement. The specified cube compressive strength of the concrete was 300 kg/cm2. For the
tower, some basic elements of the structural system can be seen in Fig 3. A more detailed
drawing of the north portion of a typical floor in the tower is shown in Fig. 11, which was re-
drafted from the original design drawings. The layout of structural members at the south end of
the floor is essentially identical to the north, reversed in the east-west direction. Square columns
ran along the outer perimeter of the tower, spaced at 540 cm in the north-south direction.The columns were
50cm x 50cm over the
full height of the
building, with the
amount of
reinforcement
decreasing with height.
Within the middle
portion of the tower
were a series of walls,
also spaced at 540 cm
in the north south
direction. Girders
running in the north-
Fig. 11. Structural Elements, Tower, North End, Typical Floor
south direction
connected the columns. Girders also connected the walls in the north-south direction. Both sets
of girders were wide and shallow sections.
The floor system consisted of a series of reinforced concrete joists running in the east-west
direction between girders. Typical details are shown in Fig. 12. Depending on their location, the
joists were either 25 cm or 40 cm in depth. The joist floor system consisted of a series of precast
inverted U-shaped sections as shown in Fig. 12. The remaining portions of the floor slab between
precast elements were cast-in-place. These cast-in-place portions of the floor were formed with
timber. These timber forms were reportedly left in-place after construction was completed, as
they were hidden behind a drop ceiling system. One item of particular interest in examining the
joist details was the concrete cover, which varied from 15 to 20 mm; somewhat smaller than
might be expected
based on current
code requirements.
As described
earlier some
portions of the
double height
floors had
mezzanine levels
Fig. 12. Typical Floor Joist Details (dimensions in cm) that were hung
from the floors above (Fig. 4). These mezzanines were constructed with a structural steel floor
system, and were hung from the reinforced concrete joists using steel rods.
In evaluating possible causes of collapse, several contributing factors must be examined. These
include the effects of thermally induced forces and deformations of the structural system, the
effects of material strength and member capacity degradation at elevated temperature, and the
effects of spalling. At this stage of the investigation, several preliminary analyses have been
conducted to gain insight into the impact of the fire on the capacity of key structural members.
This includes a simplified compartment fire analysis, heat transfer analysis for selected structural
members, and cross-section capacity calculations for the heated members.To estimate temperatures to which the structural members were exposed, simplified
compartment fire analyses were conducted for a typical office in the northwest portion of the
building. A single-zone approximation was used to characterize post-flashover conditions. A
series of analyses were conducted using the computer programs OZone [18] and BRANZFIRE
[19]. Published compartment time-temperature curves were also evaluated [20]. Parametric
studies were conducted to consider a reasonable range of fire loads, ventilation conditions, and
compartment boundary thermal properties. A typical result of such an analysis obtained from
OZone is plotted in Fig. 13. Also shown for comparison is the ASTM E119 [21] time-
temperature curve. Although the parametric study showed a range of time-temperature curves,
the curve plotted in Fig. 13 was 1200
representative of the general trends of
predicted peak temperatures and 1000
duration, and was used for subsequent ASTM E119
heat transfer and structural analysis. 800
GasTemperature,°C
The predicted peak temperature was on
600
the order of 950°C, and the predicted
duration of high temperatures, say 400
CompartmentFireAnalysis (OZone)
greater than about 300°C, was on the
order of 30 to 45 minutes. The time 200
frame for which severe burning was
observed in any given location on the 0
northwest wing from photo and video 0.0 0.2 0.4 0.6 0.8 1.0 1.2 1.4 1.6 1.8 2.0
Time,hours
evidence seems to suggest these
predicted durations are reasonable. Fig. 13. Typical Result of Compartment Fire Analysis
Results of the compartment fire analysis were then used to conduct two-dimensional heat
transfer analyses for selected column, girder and joist cross-sections. The heat transfer analyses
provided data on the temperatures throughout the cross-sections as a function of time. The heat
transfer analyses were conducted using the computer program SAFIR2007 [22] together with the
preprocessor UTFIRE [23]. Thermal material properties were taken from Eurocode 2 [24].
Finally, using the cross-section temperature distributions predicted from the heat transfer
analysis, member cross-section flexural and axial capacities were computed as a function of time.
Elevated temperature mechanical properties for concrete and reinforcing steel were also based on
Eurocode 2. Member cross-section capacities were computed using a computer program that was
custom developed for this project.
Representative results of member cross-section capacity analyses are shown in Fig. 14. This
figure plots cross-section capacity as a function of time for three cases: joist flexural capacity for
positive bending (tension on bottom), joist flexural capacity for negative bending, and column
axial capacity. The gas temperature versus time curve that was used for this analysis is the
OZone generated curve shown in Fig. 13. Note that the gas temperature-time curve is also
plotted in Fig. 14. In Fig. 14, all quantities are normalized to their peak values. Gas temperatures
are normalized to the peak gas temperature, which occurs approximately 30 minutes into the
analysis. Member cross-section capacities are normalized to the capacities at 20°C. Thus, for
example, a normalized capacity of 0.80 indicates that the cross-section retains 80-percent of its
capacity at normal temperature.1.0
The member capacity
plots in Fig. 14 show that
0.9
Column AxialCapacity
as gas temperature
0.8 increases, member
Joist FlexuralCapacity
0.7
(PositiveBending) capacity decreases.
Similarly, as the gas
0.6
temperature decreases, the
R(t)/Rmax
Joist FlexuralCapacity
0.5
(NegativeBending)
members begin to regain
0.4
capacity. The analysis
predicts that the members
0.3
GasTemperature
reach their minimum
0.2 capacity about 45 minutes
0.1
into the analysis. At this
point, the gas temperature
0.0
is well past its peak
0.0 0.2 0.4 0.6 0.8 1.0 1.2 1.4 1.6 1.8 2.0
Time,hours
(which occurs at 30
minutes) and has already
Fig. 14. Normalized Cross-Section Capacities of Joist and Column cooled substantially. Thus,
the members are at their weakest condition well into the cooling phase of the fire. This plot also
shows that the most significant loss of capacity occurs for flexure in the joists. This significant
loss of flexural capacity may be the result, in part, to the rather small concrete cover in these
members. Note that the loss of axial capacity in the columns is rather small. The columns always
retained more than 80-percent of their normal axial capacity throughout the analysis.
The analyses described above are continuing by the investigators. Considerable additional
analysis will be needed before potential triggers for the structural collapse can be hypothesized
with some reasonable degree of confidence. The member capacity analyses described above all
assume that the member cross-section remains intact during the fire. That is, these analyses
assume that no significant fire induced spalling has occurred in the reinforced concrete members.
The occurrence of such spalling can rapidly and dramatically reduce member capacities, and is
also being considered by the investigators as a key cause of the collapse.
Spalling is defined as the breaking-off of chunks of concrete from the surface of a concrete
member when exposed to high and rapidly rising temperature. The spalling in concrete is
primarily dependant on the rate of temperature rise (fire scenario), permeability (typically related
to strength and presence of silica fume) and exposure (relative humidity) and other conditions
(geometry, aggregate type). Though spalling is often an issue in higher strength concretes, it can
occur in other concrete types under the above specified conditions. Spalling occurs when the
pore pressure in a concrete member, generated due to evaporation of moisture, exceeds the
tensile strength of concrete. At present, there is very limited information on ways to incorporate
spalling into fire resistance calculations. This is mainly due to lack of calculations methodologies
and reliable high-temperature material properties for predicting spalling in concrete.
Recently a spalling model has been developed at Michigan State University [25] for evaluating
fire-induced spalling in concrete structures. This spalling sub-model has been incorporated into a
fire resistance model for evaluating fire response of concrete structures [26]. The spallinganalysis utilizes principles of mechanics and thermodynamics, including the conservation of
mass of liquid water and water vapor, to compute pore pressure in the concrete resulting from
fire exposure. The computed pore pressure is checked against the temperature dependent tensile
strength to determine if spalling has occurred. The spalling and fire resistance models have been
validated by comparing predictions with test data for temperature, pore pressure, extent of
spalling, strength, deflections and fire resistance [25,26].
A review of post-fire photographs of the FOA building indicates loss of cross-sections in certain
parts of the buildings. This was postulated to be due to fire induced spalling. As a preliminary
analysis, the above MSU model was applied to analyze a typical reinforced concrete (RC)
column from the TUD building to predict the extent of spalling and fire resistance. The selected
column is of 500 mm square cross-section and of 3 m length. The RC column was assumed to
have a reinforcement comprising of 4-32 mm bars. The column was assumed to carry a load of
400 KN (40% of its load carrying capacity at room temperature) at the time of fire incident. The
column was made of concrete of cube strength of 300 kg/cm2 (cylinder strength of 25 MPa) and
the reinforcement having a yield strength of 400 MPa. Also, the column is said to have bent ties
(135° bent to the concrete core). The compartment fire shown in Fig. 13 was used as the fire
scenario in the analysis. Since the permeability of concrete in the column is not known, fire
resistance analysis was carried out by assuming three different orders of permeability (10-17, 10-18,
10-19).
0.35
Results from the analysis indicate that
when a permeability of 10-17 is 0.3
assumed, no spalling occurs and the 0.25
RC column survives burn-out
Spalled area (%)
condition. When the permeability is 0.2
-18
changed to 10 spalling is predicted 0.15
to start in the 22nd minute of fire perm -19
0.1
exposure and stops at about 40 perm -18
perm -17
minutes into the fire. At this time most 0.05
of the cover concrete is lost, but the
0
column in this case also did not fail.
0 30 60 90 120
About 28.5% of the column cross- Time (mins)
section was predicted to have spalled
Fig. 15 Progression of spalling
off. The survival of the column can be
attributed to the fact that by the time the column lost enough mass due to spalling and lost
strength due to degradation of material properties, the fire was in the decay phase and the column
could regain its strength. This column could be said to have just marginally survived the fire.
With a permeability of 10-19 spalling starts a bit early at 21 minutes in the fire exposure and stops
in 35 minutes. This column fails in 43 minutes into fire exposure. As stated, spalling progressed
faster in this column and thus when the cover of concrete was lost the fire temperature were at its
peak and thus the column could not sustain the applied load. Figure 15 shows the progression of
spalling for the three permeability values. Figure 16 shows the area of cross-section lost in the
column at 30 minutes (temperature peak) of exposure and 50 minutes (burnout) of exposure.The above analysis illustrates
the possibility of fire induced
spalling in RC columns
leading to structural collapse.
However, it should be noted
that fire response modeling of
Perm: 10-17 Exposure: 30 mins Perm: 10-18 Exposure: 30 mins Perm: 10-19 Exposure: 30 mins
concrete structures, as well as
prediction of spalling, is very
complex and is highly
dependent on the input
parameters (high temperature
properties, fire temperatures
etc). For this a detailed
Perm: 10-17 Exposure: 50 mins Perm: 10-18 Exposure: 50 mins Perm: 10-19 Exposure: 50 mins
analysis is required and efforts
in that direction are currently
Fig. 16 Loss of cross-section due to fire induced spalling underway by the authors.
SUMMARY AND CONCLUSIONS
A large amount of data and information has been collected regarding the fire and partial
structural collapse of the Faculty of Architecture Building at the Delft University of Technology.
The ability to collect this data was facilitated by an international cooperative effort aimed not
only at understanding this event, but at establishing a mechanism for data collection and
archiving for future fires of significance. Using the data collected, preliminary analyses of the
initial fire situation and of the fire impact on the structure have been undertaken, with the results
showing promise for helping to understand the specifics of the fire and building design which led
to the collapse. Going forward, attention will be given to fire spread beyond the compartment of
origin, including building features that contributed to the spread (e.g., window breakage, barrier
performance), development of time-temperature histories, and analysis of the structure under the
fire conditions, including assessment of the impact of fire induced spalling of the columns.
ACKNOWLEDGMENTS
The authors would like to acknowledge support from WPI students William Wong and David
Tucholski, and WPI professor Nicholas Dembsey. The authors would also like to acknowledge
the NSF for their support research team travel to Delft to collect data on the building and fire
under grant award 0840601. Any opinions, findings, conclusions or recommendations expressed
in this paper are those of the authors and do not necessarily reflect the views of the sponsors.
REFERENCES
[1] Meacham, B.J., Engelhardt, M. and Kodur, V. (2009). “Collection of Data on Fire and
Collapse, Faculty of Architecture Building, Delft University of Technology,” National
Science Foundation, CMMI, Research and Innovation Conference 2009, 22-25 June 2009.
[2] Custer, R.L.P and Sheppard, D.T. (2008). “Fire Loss Investigation,” Section 3, Chapter 2.
Fire Protection Handbook, 20th ed., Vol. 1. Quincy MA: NFPA[3] Custer, R.L.P. (2003). “Fire Loss Investigation,” Section 3, Chapter 1, Fire Protection
Handbook, 19th ed., Volume 1. Quincy, MA: NFPA.
[4] NFPA 921 (2008), Fire and Explosion Investigation, NFPA, Quincy, MA.
[5] NIST (2005). Final Report on the Collapse of World Trade Center Towers, NIST
NCSTAR 1, National Institute of Standards and Technology, Gaithersburg, MD.
[6] NIST (2008). Final Report on the Collapse of World Trade Center Building 7, NIST
NCSTAR 1A, National Institute of Standards and Technology, Gaithersburg, MD.
[7] http://earth.google.com and http://www.flickr.com/photos/stylos/2958066460/ .
[8] TUD – Faculty of Architecture Building - design drawings
[9] Photos compiled from TUD photographer (Foto's Berlageweg 1 bouwen gebruik TUD).
[10] COT (2008). Fire at Architecture: Evaluation of the crisis management and permits
concerning the devastating fire at the Faculty of Architecture of the Delft University of
Technology, COT Institute for Safety, Security and Crisis Management, Den Haag
[11] Interseco (2009). Research facts fire Faculty of Architecture Delft University of
Technology, Feitenonderzoek brand faculteit bouwkunde TU Delft, Interseco, Den Haag.
[12] McGrattan, K.B., Hostikka, S., Floyd, J.E., Fire Dynamic Simulator User’s Guide(2007),
NIST Special Publication 1019-5, NIST, Gaithersburg, MD.
[13] Manzello, S.L. et al. (2007). “An experimental determination of a real fire performance of a
non-load bearing glass wall assembly,” Fire Technology, Vol. 43, p.77~89.
[14] DiNenno, P. (2002). SFPE Handbook of Fire Protection Engineering, NFPA, Quincy, MA.
[15] Babrauskas, V. (2003), Ignition Handbook, Fire Science Publishers/Society of Fire
Protection Engineers, Issaquah WA.
[16] Quintiere J.G.(2006), Fundamentals of Fire Phenomena, John Wiley & Sons, Chichester.
[17] Babrauskas, V. et. al. “The effects of specimen edge conditions on heat release rate,” Fire
and Materials, Vol 17, Issue 2, p.51~63
[18] Cadorin, J.F., Pintea, D. and Franssen, J.M. (2001). “The Design Fire Tool Ozone V2.0 –
Theoretical Description and Validation on Experimental Fire Tests.” U. of Liege, Belgium.
[19] Wade, C. (2004). “BRANZFIRE Technical Reference Guide,” Branz Study Report No. 92,
Building Research Association, Judgeford, New Zealand.
[20] Pettersson, O., Magnusson, S.E. and Thor, J. (1976). “Fire Engineering Design of Steel
Structures.” Swedish Institute of Steel Construction, Publication No. 50, Stockholm.
[21] ASTM (2008) “Standard Test Methods for Fire Tests of Building Construction and
Materials,” Standard No. E119-00a, ASTM, West Conshohocken, PA.
[22] Franssen, J.M. (2007). “SAFIR2007. A Thermal/Structural Program Modeling Structures
Under Fire, Ver 2007, University of Liege, Belgium.
[23] Jennings, T. (2009). “UTFIRE, a Preprocessor for SAFIR2007, for Analysis of Heat
Transfer for Structural Members Exposed to Fire.” MS Thesis, Department of Civil,
Architectural and Environmental Engineering, University of Texas at Austin.
[24] Eurocode 2 (2004). “Eurocode 2: Design of Concrete Structures – Part 1-2: General Rules
– Structural Fire Design.” BS EN 1992-1-2:2004, British Standards Institute.
[25] Dwaikat M.B. and Kodur V.K.R. (2009), “Hydrothermal Model for Predicting Fire Induced
Spalling in Concrete Structural Systems,” Fire Safety Journal, 44, 425-434.
[26] Kodur V.R., Dwaikat M.B. and Raut N. (2009). “Macroscopic FE Models for Tracing the
Fire Response of Reinforced Concrete Members,” Engineering Structures Journal, V.31
No.10, pp. 2368-2379.You can also read