Measuring Vulnerability of Typhoon in Residential Facilities: Focusing on Typhoon Maemi in South Korea - MDPI
←
→
Page content transcription
If your browser does not render page correctly, please read the page content below
sustainability

Article
Measuring Vulnerability of Typhoon in Residential
Facilities: Focusing on Typhoon Maemi in
South Korea
Ji-Myong Kim 1 , Taehui Kim 1 , Kiyoung Son 2 , Sang-Guk Yum 3 and Sungjin Ahn 1, *
 1    Department of Architectural Engineering, Mokpo National University, Mokpo 58554, Korea;
      jimy@mokpo.ac.kr (J.-M.K.); thkim@mokpo.ac.kr (T.K.)
 2    School of Architectural Engineering, University of Ulsan, Ulsan 44610, Korea; sky9852111@ulsan.ac.kr
 3    Department of Civil Engineering and Engineering Mechanics, Columbia University,
      New York, NY 10027, USA; sy2509@columbia.edu
 *    Correspondence: sunahn@mokpo.ac.kr; Tel.: +82-61-450-2457

 Received: 20 March 2019; Accepted: 13 May 2019; Published: 15 May 2019

 Abstract: Typhoons cause severe monetary damage globally. Many global insurance companies and
 public agencies are currently developing and utilizing windstorm risk estimation models to calculate
 the level of risk and set up strategies for avoiding, mitigating, and relocating those economic risks.
 Hence, the usage and accuracy of the windstorm risk estimation model is becoming increasingly
 significant, and reflecting local vulnerabilities is essential for refined risk assessment. While key risk
 indicators have been recognized in practical studies of economic losses associated with windstorms,
 there remains a lack of comprehensive research addressing the relationship between economic losses
 of residential buildings for South Korea and vulnerability. This research investigates the real damage
 record of Typhoon Maemi from an insurance company in order to bridge this gap. The aim of
 this study is to define the damage indicators of typhoons and create a framework for typhoon
 damage function, using the damage caused by Typhoon Maemi as a representative paradigm. Basic
 building information and natural disaster indicators are adopted to develop the damage function.
 The results and metric of this research provide a pragmatic approach that helps create damage
 functions for insurance companies and contingency planners, reflecting the actual financial losses and
 local vulnerabilities of buildings. The framework and results of this study will provide a practical
 way to manage extreme cases of natural disasters, develop a damage function for insurers and public
 authorities, and reveal the real economic damage and local vulnerability of residential buildings in
 South Korea.

 Keywords: typhoon Maemi; typhoon vulnerability; residential facility; damage function

1. Introduction
     The rate of occurrence of extreme windstorms is increasing rapidly, and the associated losses
are growing rapidly as well [1]. Hurricane Katrina, which hit the southern US in 2005, generated an
economic loss of about $ 81 billion, making it the costliest natural catastrophe in the United States to
date [2]. Due to the direct and indirect impacts of Hurricane Katrina, states in the US Gulf Coast suffered
for a long period after the hurricane. Hurricane Sandy and Hurricane Ike followed; Hurricane Sandy
reached the eastern coast of the US in 2012 and led to losses of $ 71.4 billion, while Hurricane Ike hit the
southern coast of the United States in 2008 and led to losses of $ 29.5 billion [2,3]. European windstorms
Anatol, Lothar, and Martin, which smashed Central Europe and Western Europe in succession with
heavy winds and heavy rain in December 1999, led to losses totaling about 13 billion euros [4]. In 2013,
Typhoon Haiyan blasted many countries in its path and was recorded as the most powerful typhoon

Sustainability 2019, 11, 2768; doi:10.3390/su11102768                        www.mdpi.com/journal/sustainability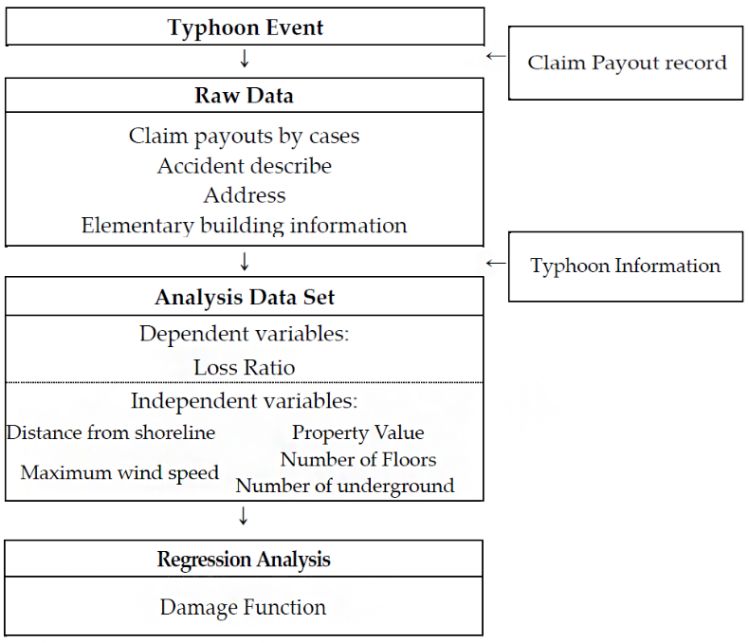
Sustainability 2019, 11, 2768                                                                          2 of 11

among those that landed; it was called Super Typhoon Haiyan. The typhoon caused storm surges and
strong winds over South Asian countries, and overall losses were valued at $ 2.88 billion [5].
      Many developed countries are choosing insurance to actively reduce and transfer the financial
losses of these windstorms. Therefore, it is imperative to accurately and objectively predict financial
loss. Insurers use natural catastrophe models and chronological damage records to predict the economic
losses of various scopes (some individual buildings, provinces, or countries) and to manage cumulative
risks. Natural catastrophe models comprise four basic modules, i.e., hazard, exposure, financial, and
vulnerability modules. More specifically, these modules consist of Touchstone/Clasic of AIR, RiskLink
of RMS, and Risk Quantification & Engineering (RQE) of EQECAT. The hazards regulate typhoon
information, e.g., the frequency and intensity of typhoons, the central pressure, precipitation, and
storm surges, and the regeneration of typhoons in specific regions and periods. The financial module
appraises economic losses based on insurance information, e.g., catastrophic excess loss, excess loss
risk, liability limit, etc.). The vulnerability module uses the damage function, which explains the
relationship between the vulnerability of the building and risk indicators, in order to calculate damage
based on building vulnerability [6]. The damage function is developed or verified based on analysis of
past windstorm damages. Consequently, the accuracy of the damage function is substantially affected
by the presence and quality of the past damage data.
      However, due to the lack of detailed loss records in the real world, it is difficult to generate a
damage function. The claim payment record of the insurance company contains detailed and accurate
loss information related to the damages. The records are reliable in relation to the damage, since the
payment is made according to the results of the objective inspections of the engineer and the claim
adjuster. The attributes of the data are used to create a damage function that evaluates the vulnerability
of an individual building. Nonetheless, insurance companies hesitate to document detailed building
information, e.g., building type, age, height and materials [7]. This is because it takes a lot of effort and
time to create a database. It is a burden not only for small businesses, but also for large companies. This
phenomenon is more pronounced in developing countries such as South Korea. The low resolution
data available for currently-developing countries does not meet the level of the catastrophic model of
vendors that requires detailed input information. When a vendor’s catastrophic model simulation
is performed, over- or under- estimation phenomena may lead to predictions that differ from the
actual potential risks, thus failing to demonstrate the model’s capacities. Therefore, for a sophisticated
evaluation in a developing country, it should be possible to evaluate using minimum information
in consideration of the low data quality. Furthermore, in developing countries with low insurance
penetration rates, it is principally necessary to produce and validate damage functions through the use
of historical loss records. The lack of and low quality of such data make it challenging to label the
correlation between the potential risk and loss of the country as a result. Therefore, in these countries
and circumstances, indicators and models are needed to easily or directly calculate the vulnerability of
a building.
      The aim of this research is to provide the development of a damage function for sophisticated
damage assessment in cases of insufficient building information. The study also provides damage
indicators with which to assess the damage triggered by typhoons.

1.1. Meaning of Extreme Natural Disaster
     When a record hurricane, such as Hurricane Ike, Katrina, or Sandy occurs, the resulting unexpected
massive losses can cause insurance companies to go bankrupt or change their coverage and charges
quickly [8]. Typhoon Maemi was recorded as the typhoon that caused the most damage in South
Korea. Typhoon Maemi is the largest typhoon ever in South Korea in terms of size and strength. It is
also called Super Typhoon Maemi, due to its strength, and it can be categorized as an extreme disaster.
Typhoon Maemi generated a tropical cyclone in the sea near Guam on September 4, 2003 and landed on
the southern coast of the Korean peninsula on September 11 after passing through Okinawa Prefecture,
Japan. After subsequently landing in the southeastern part of the Korean peninsula, it left the East
Sustainability 2019, 11, x FOR PEER REVIEW 3 of 11
Sustainability 2019, 11, 2768 3 of 11
through Okinawa Prefecture, Japan. After subsequently landing in the southeastern part of the
Korean peninsula, it
Sea on September 12left
andthe East into
faded Sea on
theSeptember 12 anditfaded
East Sea. When intoitthe
landed, wasEast
theSea. When
most it landed,
robust typhoon it
was the most robust typhoon among the typhoons that have historically affected
among the typhoons that have historically affected the Korean peninsula. For example, the typhoon the Korean
peninsula. For typhoons
broke historic example, the
suchtyphoon broke historic
as a maximum typhoons
wind speed of 54such
m/s,ascenter
a maximum
pressurewind speed
of 910 hPa,ofand
54
m/s, center pressure of 910 hPa, and maximum size of 460 km (radius). The typhoon's
maximum size of 460 km (radius). The typhoon’s extreme precipitation, wind speed, and storm surge extreme
precipitation, wind affected
led to 61,000 being speed, and andstorm
to 135surge led The
deaths. to 61,000 beingofaffected
total cost the damageand to 135about
was deaths. The
$ 4.3 total
billion
cost of the
(Nation damage
Typhoon was about
Center) $ 4.3
[9]. The billion
World (Nation Typhoon
Meteorological Center)removed
Organization [9]. The World Meteorological
the name Maemi from
Organization removed the name Maemi from circulation due to the extreme
circulation due to the extreme damage caused by the typhoon and replaced it with Mujigae damage caused(Nation
by the
typhoon and replaced
Typhoon Center) [9]. it with Mujigae (Nation Typhoon Center) [9].
1.2.
1.2. Quantification
Quantification of
of Natural
Natural Disaster
Disaster Risks
Risks
Several
Several state
state agencies
agencies and
and international
international organizations
organizations are are currently
currently investing
investing aa lotlot of
of resources
resources
into
into developing natural catastrophe models to predict, to react to, and to diminish the risk of natural
developing natural catastrophe models to predict, to react to, and to diminish the risk of natural
disasters. Forexample,
disasters. For example, thethe
newnew Multi-Risk
Multi-Risk and Multi-Risk
and Multi-Risk Assessment Assessment
Method in Method
Europe,inRiskScape
Europe,
RiskScape in NewCentral
in New Zealand, Zealand, Central American
American Probability Probability Risk Assessment,
Risk Assessment, HAZUS Multi HAZUS Multi(MH)
Hazard Hazardin
(MH) in the Unites States, and the Florida Public Hurricane Loss Model, are
the Unites States, and the Florida Public Hurricane Loss Model, are representative. These models representative. These
models
measuremeasure indirect
indirect and and
direct direct
losses on losses on the nationwide
the nationwide or province-wide
or province-wide scale that mayscalearise
thatfrom
mayflood,
arise
from flood, earthquakes,
windstorm, windstorm, earthquakes, and storm
and storm surges. Evensurges. Even
so, since suchso,models
since such
measure models measure the
the vulnerability
vulnerability of the region to natural disasters, it is difficult to assess the risks
of the region to natural disasters, it is difficult to assess the risks outside the covered areas outside the covered
where
areas where the vulnerabilities
the vulnerabilities differ. Baseddiffer. Based onhazard
on Crichton’s Crichton's hazard
triangle [10],triangle [10], this
this research research
adopts adopts
a variety of
aindicators
variety ofthat
indicators that everyone could easily calculate and certainly obtain.
everyone could easily calculate and certainly obtain. Consequently, the results and Consequently, the
results
methods and
of methods
this studyofwill
thisbe
study will be
a worthy a worthyfor
guideline guideline
generatingfor agenerating
typhoon riska typhoon risk model
assessment assessment
with
model to
which with whichfinancial
compute to compute financial
risks. risks. agencies
Government Government agencies
and the and the
insurance insurance
industry industry
will also be ablewill
to
also be able to model their own risk modeling and risk management
model their own risk modeling and risk management from the fatal typhoon risk. from the fatal typhoon risk.
2. Methodology
Methodology of Research
2.1. Damage
Damage Records
The goals of this research
research are to establish
establish a systematic
systematic way
way to
to determine
determine thethe relationship
relationship between
typhoon damage, natural disaster indicators, and basic building information indicators, and to
determine thetheweights
weightsofofkey
keyindicators to compute
indicators to compute damages reproducing
damages local local
reproducing vulnerability. In order
vulnerability. In
to achieve these goals, this study incorporates the damage records from Typhoon Maemi
order to achieve these goals, this study incorporates the damage records from Typhoon Maemi from from a major
ainsurance companycompany
major insurance in Southin Korea.
SouthThe scope
Korea. Theof scope
the research is limitedistolimited
of the research South toKorea.
SouthFigure
Korea.1
shows the outline of the data collection and analysis process for this study.
Figure 1 shows the outline of the data collection and analysis process for this study.
Figure1.1. Research
Figure procedure.
Research procedure.Sustainability 2019, 11, 2768 4 of 11
The amount of damage is the net damage paid by the insurance company on damages caused by
Typhoon Maemi without any insurance conditions. As shown in Figure 2, Typhoon Maemi hit the
southern coast of South Korea on September 12, 2003, and escaped through the East Sea, causing severe
financial losses in its path. Most of the damage occurred on the day of September 12th. The claim
payout record collected from the insurance companies included the information as following: accident
date, address, occupancy, property value, amount of loss, number of floor, number of underground, and
so on. In this study, vulnerability indicator consisted of two factors, building indicators and typhoon
indicators. For building factors, the authors collected such information as Property Value, Number
of Floors, Number of underground from each claim case. For typhoon factors, such information as
the wind speeds of the individual buildings where the damage occurred were collected based on the
date of the accident and the address information in the loss records utilizing Geographic Information
System (GIS). In addition, the distance from the property centroid to the coastline is also estimated
based on the address information using the GIS. After collecting the data, a multiple regression was
used to analyze the data, from which the damage function was derived that delineated the relationship
between the dependent and independent variables. The collected data were analyzed by a statistical
package (SPSS, Statistical Package for the Social Sciences). The following Table 1 includes the details of
the adapted variables in this study.
Table 1. Data collection.
Classification Indicators Explanation Measure Data Source
Korea
Distance from Hydrographic and
Distance from shoreline Km
shoreline Oceanographic
Typhoon
Agency
information
Japan
Maximum wind Sustained maximum
m/s Meteorological
speed wind speed over 10 min
Agency
Property Value Total value of property $
Claim payout
Total number of
Building Number of Floors Number record
buildings’ floors
Information
Number of Total number of
Number
underground buildings’ underground
In this study, the dependent variable representing the quantitative damage in the model is
expressed as the ratio of the compensation amount to the property value as shown in Equation (1),
which is referred to as Damage Ratio.
Claim payout
Damage Ratio = (1)
Property Value
Table 2 displays the regional loss distributions collected from the insurance claim records from
Typhoon Maemi. In particular, the southern part of the Korean Peninsula, Gyeongnam and Busan
specifically, was devastated by the typhoon. Due to the typhoon, Busan represented as much as 47.0%
of total claim payouts and 38.6% of number of claim payouts. Gyeongnam also suffered inordinate
damage, accounting for 43.0% of total claim payouts and 22.2% of number of claim payouts. Both
provinces were located in the typhoon landing area, and more damage occurred in areas located to the
east of the typhoon path.Sustainability 2019, 11, 2768 5 of 11
Sustainability 2019, 11, x FOR PEER REVIEW 5 of 11
Figure 2. Damage
Figure distribution.
2. Damage distribution.
TableTable 2. Damage
2. Damage record
record of Typhoon
of Typhoon Maemi
Maemi by province.
by province.
Province NameProvince Name Number
Number of ClaimofPayouts
Claim Payouts Total Claim
Total ClaimPayouts
Payouts(1000 USD)
(1000 USD)
Busan Busan 127 127 4,643,478
4,643,478
Gyongnam Gyongnam 73 73 4,256,039
4,256,039
Gyongbuk 48 414,493
Gyongbuk 48 414,493
Ulsan 46 495,652
Ulsan Daegu 46 35 495,652
78,261
Daegu 35 78,261
Sum 329 9,887,923
Sum 329 9,887,923
2.2. Section
2.2. The The Section of Variables
of Variables
The The damage
damage record
record comprisestwo
comprises twocategories:
categories: thethe first
first isisthe
thedamage
damage detail, including
detail, the amount,
including the
date and description of the damage, and the location where the damage
amount, date and description of the damage, and the location where the damage occurred; the second occurred; the second is basic
building
is basic buildinginformation,
information, which
which includes
includes thethe
building
buildingvalue
valueand andclassification,
classification,number
numberof of floors,
floors, and
number of basement floors. The records did not include detailed building
and number of basement floors. The records did not include detailed building inventory information. inventory information.
Various
Various characteristics
characteristics of the
of the indicatorsdirectly
indicators directlyor orindirectly
indirectly affect
affect the
thetyphoon
typhoondamagedamage [11]. Using
[11].
Using the recorded location information, the indicators for each damage were gathered andusing
the recorded location information, the indicators for each damage were gathered and calculated
the Geographic
calculated using theInformation
Geographic System. The distance
Information System. between the building
The distance and shoreline
between the buildingis alsoanda main
factorisfor
shoreline alsothea vulnerability
main factor for ofthe
thevulnerability
building to typhoons. Highfield
of the building et al. (2010)
to typhoons. [12] demonstrated
Highfield et al. (2010) the
relationship between the distance to the shoreline and the vulnerability
[12] demonstrated the relationship between the distance to the shoreline and the vulnerability of the building by analyzing
of the the
damage caused by Hurricane Ike in Bolivar Peninsula and Galveston
building by analyzing the damage caused by Hurricane Ike in Bolivar Peninsula and Galveston Island. They reported that as the
distance
Island. They from the shoreline
reported that as rises, the damage
the distance from is reduced.
the shorelineThis indicates
rises, thethat buildings
damage near the shoreline
is reduced. This
indicates that buildings near the shoreline are more exposed to typhoons than buildingsessential
are more exposed to typhoons than buildings far from the shoreline. Wind speed is an far frommeter
the of
the typhoon’s
shoreline. Wind speed strength
is anand triggersmeter
essential several ofdamages e.g., missile
the typhoon’s strength impact,
and storm
triggerssurge, anddamages
several flood [13–15].
The wind speed of the damaged building was measured using
e.g., missile impact, storm surge, and flood [13–15]. The wind speed of the damaged building was the Geographic Information System
based on the maximum wind speed of the accident date. The
measured using the Geographic Information System based on the maximum wind speed of the wind speed information consisted of the
accident date. The wind speed information consisted of the 10 minutes’ maximum sustained wind
speed of the Japan Meteorological Administration, which are the Regional Specialized Meteorology
Centers (RSMC) for Northwest Pacific region.Sustainability 2019, 11, 2768 6 of 11
10 minutes’ maximum sustained wind speed of the Japan Meteorological Administration, which are
the Regional Specialized Meteorology Centers (RSMC) for Northwest Pacific region.
The basic features of the building are well-known indicators of typhoon vulnerability depending
on building inventory. The property value of the building has a statistically significant relationship
with the damage of the typhoon. Kim et al. (2017) proved that the correlation between the property
value and damage is negative [7]. This means that typhoon damage increases as the building value
decreases. Building heights are also a vital indicator of vulnerability to storms [6,16]. This is attributed
to the fact that the building height has a statistically significant relationship with the degree of financial
damage and can be used as a vulnerability indicator to compute a building’s vulnerability to typhoons.
For example, building height and hurricane damage are positively correlated. This indicates that
typhoon damage increases as building height increases [17,18]. Table 3 presents the descriptive statistics
of the dependent variable and independent variables.
Table 3. Descriptive statistics.
N Minimum Maximum Mean Std. Deviation
Dependent Variable
Damage ratio (%) 329 0.0 0.2 0.0 0.0
Independent Variables
Distance from shoreline (km) 329 1.3 117.9 27.1 19.8
Wind speed (m/s) 329 31.2 38.2 37.2 1.3
Property Value (1000 USD) 329 96 152,044 30,117 27,306
Number of Floor (number) 329 1.0 28.0 20.4 4.1
Number of Underground (number) 329 - 5.0 0.6 0.9
3. Results
Statistical Analysis
Table 4 displays the results of the multiple regression model analysis of damage in residential
buildings and variables, i.e., the basic features of building and typhoon information, caused by
Typhoon Maemi. The adjusted R2 value is 0.534, which indicates that 53.4% of the variation of the
damage ratio can be described by the regression model. Five significant variables, i.e., property
value, number of floors, number of underground floors, distance from the coast, and wind speed, are
defined as indicators of the severity of typhoon loss. The values of the variance inflation coefficient
(VIF) ranged from 1.034 to 1.098. This range explains that there is no considerable multicollinearity
between variables. Therefore, through the VIF test results, it can be said that there is no significant
relationship between the variables. The significant variables can be ranked in descendant order of
their beta coefficients. According to the number of the coefficient, the indicators are (1) wind speed
(beta coefficient = −0.509), (2) property value (beta coefficient = −0.317), (3) distance from shoreline
(beta coefficient = −0.248), (4) number of underground floors (beta coefficient = 0.113), and (5) number
of floors (beta coefficient = 0.093).Sustainability 2019, 11, 2768 7 of 11
Table 4. Regression analyses results.
Variables Coef. Beta Coef. p >|z| VIF
Basic Features of Building
Property Value −1.422E-005 −0.317 0.000 1.034
Number of Floor 0.039 0.093 0.015 1.051
Number of Underground 0.029 0.113 0.023 1.044
Typhoon Information
Distance from shoreline −0.013 −0.248 0.000 1.059
Wind speed 0.479 0.509 0.000 1.098
Number of Observations 329
F 46.789
Adj-R 2 0.534
“Coef.” labels the non-standardized coefficients that reproduce the unit scale of the independent variable. “Beta
Coef.” describes standardized coefficients that neglect the unit scale of independent variable, which aids to contrasts
among the independent variables. The higher value of the Beta Coef stands for the more substantial influence on
the dependent variable.
4. Discussion
Due to the demand for sophisticated natural disaster risk modeling raises, numerous vendors
are conducting professional modeling, such as Risk Management Solution, EQECAT, and Applied
Insurance Research [19,20]. These companies have developed models to quantify the risks of natural
disasters, e.g., European windstorm, earthquake, flood, tornado, typhoon, hurricane, and tsunami that
are used by insurance and reinsurance companies around the world. This is now used as a standard
method for analyzing natural hazards. Nevertheless, high annual fees are an obstacle for any company
or organization to practice. Moreover, there are limited countries in which evaluation is possible.
For example, the United States, Japan and China have large insurance industries and are often hit by
natural disasters, so many vendor companies are currently developing models and doing business.
On the other hand, small and medium-sized companies or organizations that cannot afford the elevated
annual fees of aforementioned countries cannot be evaluated using the vendor model. There will be a
problem if an insurer attempts to assess the risk of an area not covered by a vendor’s model. Further,
the modeling firms also recommend that insurers and reinsurers use independent models to identify
and assess their portfolios and risks. The reason for this is that it is risky to determine the risk by using
only the existing standard models. This is because insurance companies may differ from the results of
standardized models due to different capital, business preferences, and portfolio. They should be able
to judge whether the results of the vendor model are optimistic or conservative in their circumstances.
Therefore, the insurers and reinsurers should have their own models or standards that can verify the
results of the standard model. Therefore, in order to satisfy the demand of the models, this study
statistically analyzed the damages of residential facilities caused by typhoon Maemi and identified the
features of typhoon damage according to the path of the typhoon by statistically analyzing the damage
caused by the typhoon.
Typhoon Maemi was considered the worst-case scenario, with the strongest intensity and causing
the most damage from a typhoon in South Korea, especially in the southern part of the Korean peninsula,
i.e., Busan and Gyeongnam. For these reasons, the typhoon has been referred to as Super Typhoon
Maemi and classified as an extreme disaster. Most damage occurred in Gyeongnam and Busan, which
are located on the right side of the typhoon path. The cause for this is that the typhoon landed on the
coast of Gyeongnam, causing direct damage to the area and, in particular, to the area to the right side
of the typhoon path due to the extremely strong winds and heavy rainfall [21]. In the right-sided area
of the expected path of the typhoon, more efforts are needed to mitigate typhoon damage.
This study used insurance claim payouts, typhoon information, and building information to
analyze Typhoon Maemi damage and to assess the risks. As the relationship between damage ratioSustainability 2019, 11, 2768 8 of 11
and the valid variables were identified as statistically significant in this study, this study confirms
that the damage function model is statistically significant. This finding reinforces the hypothesis
of previous studies, i.e., that the significant variables are worthy parameters to explain the damage
of natural disaster and are also important to quantify the damage amount. In addition, this study
also revealed that there is a significant relationship between the amounts of insurance loss caused by
natural disasters and adopted variables. This finding can make contributions to a variety of relevant
sectors, including government agencies, insurance and reinsurance companies, building construction
companies and homeowners.
First of all, government agencies and disaster officials in the public sector alike can utilize the
damage function model suggested in this study and predict the possible economic damages, which
can contribute to moderating the damages associated with a typhoon and to creating mitigation plans
for estimated damages in advance. In so doing, there is a need for the weight of each variable to
be adjusted through the use of a coefficient that replicates the vulnerability of the local buildings in
each region.
Second, the metrics set in this study can be applied to forecast economic damages in insurance
and reinsurance companies. That is, an insurance or reinsurance company can use the metric from
this study to reconstruct a business model along with the risk attitude. They can use this model to
estimate the maximum loss of an individual building or a group of buildings, to set an event limit,
and then to estimate the appropriate premium. Furthermore, the maximum losses can be used as a
basis for managing the cumulative risk of typhoons in specific regions. For example, an insurance
company could calculate the amount of damage that could be caused by typhoons whose scale and
intensity were similar to those of Typhoon Maemi by putting the damage function of this model and
the insurance policy currently held in vendor’s typhoon model. The result will be used to estimate
the maximum amount of loss that can be incurred from the insurance policy currently in operation
and for the accumulative risk management of the typhoon. Moreover, this model can be used to set
the appropriate premium. The risk of catastrophe is an important factor in determining premiums.
Premiums, in insurance business, are a combination of specific risks, uncertain risks, administrative
prices and catastrophe risks. The catastrophe risk is calculated on the basis of extreme disasters. By
using this model, it is possible to set a proper premium by estimating the amount of loss caused
by typhoons.
Third, building construction companies are able to improve design guidelines by designing
storm-resistant buildings and by assessing the building loss based on the predicted total value of
property, construction type, and the number of floors of the building. As such, of this study can
contribute to designing buildings that can withstand typhoons. By estimating the expected loss of the
building based on the expected value of the building, number of buildings, and number of basements,
damage to the typhoon in the future can be reflected in the life cycle cost of the building.
Furthermore, homeowners can use it as a decision for insurance and retrofit. Retrofitting and
insurance are methods for managing natural disaster risks for residential buildings. Insurance is a
risk management method that distributes risk, which is how the homeowner reduces the damage by
transferring the risk to the insurance company. Retrofitting, on the other hand, is a risk management
method that reduces physical damage to buildings. For example, an additional anchor can be added to
the roof sheath to reduce wind damage, or a brace can be installed on the opening shutter to prevent
hurricane damage. In particular, retrofitting is considered a way to effectively reduce risks and costs
for un-insured homeowners [22]. For homeowners, it is necessary to select insurance and retrofitting
by judging the economic feasibility according to the risk of the baseline, e.g., the insurance policy,
building inventory, location, and risk attitude [22–24]. For these questions, it is essential to quantify
the exact risks of natural disasters. Therefore, the results and framework of this study will help to
make this judgment.
Various studies have used real scenarios for disaster management and strategic foresight [25–27].
However, the scenario approach tends to be somewhat time-consuming, in the sense that data andSustainability 2019, 11, 2768 9 of 11
information from various sources need to be collected and analyzed over time [28]. The study is novel
because it can add an alternative option, as it provides realistic and quantified values in the analysis;
these provide a better understanding of the facts for more timely effective decision making [29]. Risk
cost has been considered the most common scale in risk analysis; various studies have used it [30–33].
Therefore, the use of actual cost, such as insurance claim payout, as an assessment scale will not only
improve the accuracy and validity of the analysis and decision making, but will also provide valuable
insight for public policy and the insurance industry
5. Conclusions
Typhoons are instigating noteworthy financial losses worldwide, and in response insurance
companies, municipalities, and governments are adopting typhoon risk assessment models to assess
levels of damage. The damage functions of the typhoon catastrophic models are produced and
confirmed based on the analysis of real damage, such as statistical records from governments and
insurance companies.
Nonetheless, shortages in comprehensive damage records are among the most common problems
in the development of the damage function, which are more of an issue in developing countries such
as South Korea. Hence, this study proposes a method with which to develop a damage function
based on damage records from Typhoon Maemi in South Korean insurance company. The results and
methodology of this study could be used as a guideline for the development of a damage function that
reflects the local vulnerability of typhoons in areas where data are rare.
However, this study only considers residential buildings in Korea that were damaged by Typhoon
Maemi; the results for commercial and industrial buildings may vary. The damage function in this
study is to find the mean damage ratio, resulted from Typhoon Maemi. However, by showing
the statistical significance of the function, this case study also lends credence to the possibility for
the function to be adopted and generalized to some cases of other typhoons in other regions. Yet,
admittedly, there is a degree of concern to use and adopt the damage function in this study for all
the typhoon cases, regardless of possible distinctiveness of each case. Future studies should include
commercial and industrial buildings in order to strengthen the results. The value of adjusted R2 is 0.534,
which designates that the remaining variability of the damage is described by the indefinite predictor.
Therefore, it is necessary to determine other potential predictive variables and add them to the model.
The data used in this study are only made up of the damage caused by Typhoon Maemi. For this
reason, we call for supplementary studies, especially dealing with various categories of typhoons and
the local vulnerability of the buildings.
Author Contributions: Conceptualization, J.-M.K.; Data curation, J.-M.K., K.S. and S.A.; Funding acquisition,
T.K.; Investigation, S.-G.Y.; Methodology, K.S.; Project administration, T.K.; Software, S.A.; Writing – original draft,
S.A.; Writing – review & editing, S.A.
Funding: This research was funded by Basic Science Research Program through the National Research Foundation
of Korea (NRF) funded by the Ministry of Education (NRF- 2016R1A2B4009909).
Conflicts of Interest: The authors declare no conflict of interest
References
1. Emmer, A. Geographies and scientometrics of research on natural hazards. Geosciences 2018, 8, 382. [CrossRef]
2. Blake, E.S.; Rappaport, E.N.; Landsea, C.W. The Deadliest, Costliest, and Most Intense United States Tropical
Cyclones from 1851 to 2006 (and Other Frequently Requested Hurricane Facts); NOAA/National Weather Service,
National Centers for Environmental Prediction, National Hurricane Center: Miami, FL, USA, 2007.
3. Blake, E.S.; Kimberlain, T.B.; Berg, R.J.; John, P.C.; Beven, J.L., II. Hurricane Sandy: October 22–29, 2012 (Tropical
Cyclone Report); United States National Oceanic and Atmospheric Administration’s National Weather Service:
Miami, FL, USA, 2013.
4. Ulbrich, U.; Fink, A.H.; Klawa, M.; Pinto, J.G. Three extreme storms over Europe in December 1999. Weather
2001, 56, 70–80. [CrossRef]Sustainability 2019, 11, 2768 10 of 11
5. Del Rosario; Eduardo, D. Final Report Effects of Typhoon YOLANDA (HAIYAN) (pdf)
(Report). National Disaster Risk Reduction and Management Council, 2014. Available
online: http://www.ndrrmc.gov.ph/attachments/article/1329/FINAL_REPORT_re_Effects_of_Typhoon_
YOLANDA_HAIYAN_06-09NOV2013.pdf (accessed on 20 April 2019).
6. Khanduri, A.C.; Morrow, G.C. Vulnerability of buildings to windstorms and insurance loss estimation.
J. Wind Eng. Ind. Aerod. 2003, 91, 455–467. [CrossRef]
7. Kim, J.M.; Kim, T.; Son, K. Revealing building vulnerability to windstorms through an insurance claim
payout prediction model: A case study in South Korea. Geomat. Nat. Hazards Risk 2017, 8, 1333–1341.
[CrossRef]
8. Watson, C.C.; Johnson, M.E.; Simons, M. Insurance rate filings and hurricane loss estimation models. J. Insur.
Regul. 2004, 22, 39–64.
9. National Typhoon Center. 2011 Typhoon White Book. Available online: http://typ.kma.go.kr/
TYPHOON/down/2011/%C0%CE%B8%ED%B9%D7%C0%E7%BB%EA%C7%C7%C7%D8.pdf (accessed on 3
January 2019).
10. Crichton, D. The risk triangle. In Natural Disaster Management; Ingleton, J., Ed.; Tudor Rose: London, UK,
1999; pp. 102–103.
11. Huang, Z.; Rosowsky, D.V.; Sparks, P.R. Hurricane simulation techniques for the evaluation of wind-speeds
and expected insurance losses. J. Wind Eng. Ind. Aerod. 2001, 89, 605–617. [CrossRef]
12. Highfield, W.E.; Peacock, W.G.; Van Zandt, S. Determinants & characteristics of damage in single-family
island households from Hurricane Ike1. In Proceedings of the Association of Collegiate Schools of Planning
Conference, Minneapolis, MN, USA, 7–10 October 2010.
13. Kim, J.M.; Woods, P.K.; Park, Y.J.; Son, K. Estimating the Texas Windstorm Insurance Association claim
payout of commercial buildings from Hurricane Ike. Nat. Hazards 2016, 84, 405–424. [CrossRef]
14. Burton, C.G. Social vulnerability and hurricane impact modeling. Nat. Hazards Rev. 2010, 11, 58–68.
[CrossRef]
15. Vickery, P.J.; Skerlj, P.F.; Lin, J.; Twisdale, L.A., Jr.; Young, M.A.; Lavelle, F.M. HAZUS-MH hurricane model
methodology. II: Damage and loss estimation. Nat. Hazards Rev. 2006, 7, 94–103. [CrossRef]
16. D’Ayala, D.; Copping, A.; Wang, H. A conceptual model for multi-hazard assessment of the vulnerability
of historic buildings. In Proceedings of the Fifth International Conference, New Delhi, India, 9–11
November 2006.
17. De Silva, D.G.; Kruse, J.B.; Wang, Y. Spatial dependencies in wind-related housing damage. Nat. Hazards
2008, 47, 317–330. [CrossRef]
18. Kim, J.M.; Son, K.; Yoo, Y.; Lee, D.; Kim, D. Identifying Risk Indicators of Building Damage Due to Typhoons:
Focusing on Cases of South Korea. Sustainability 2018, 10, 3947. [CrossRef]
19. Sanders, D.E.; Brix, A.; Duffy, P.; Forster, W.; Hartington, T.; Jones, G.; Levi, C.; Paddam, P.; Papachristou, D.;
Perry, G.; et al. The Management of Losses Arising from Extreme Events; Convention General Insurance Study
Group GIRO: London, UK, 2002.
20. Kunreuther, H.; Meyer, R.; Van den Bulte, C.; Chapman, R.E. Risk Analysis for Extreme Events: Economic
Incentives for Reducing Future Losses; US Department of Commerce, Technology Administration, National
Institute of Standards and Technology: Gaithersburg, MD, USA, 2004.
21. Kim, J.M.; Woods, P.K.; Park, Y.J.; Kim, T.; Son, K. Predicting hurricane wind damage by claim payout based
on Hurricane Ike in Texas. Geomat. Nat. Hazards Risk 2016, 7, 1513–1525. [CrossRef]
22. Shan, X.; Peng, J.; Kesete, Y.; Gao, Y.; Kruse, J.; Davidson, R.A.; Nozick, L.K. Market insurance and
self-insurance through retrofit: Analysis of hurricane risk in north carolina. ASCE-ASME J. Risk Uncertain.
Eng. Syst. Part A Civ. Eng. 2017, 3, 04016012. [CrossRef]
23. Kesete, Y.; Peng, J.; Gao, Y.; Shan, X.; Davidson, R.A.; Nozick, L.K.; Kruse, J. Modeling Insurer-Homeowner
Interactions in Managing Natural Disaster Risk. Risk Anal. 2014, 34, 1040–1055. [CrossRef]
24. Peng, J.; Shan, X.G.; Gao, Y.; Kesete, Y.; Davidson, R.A.; Nozick, L.K.; Kruse, J. Modeling the integrated roles
of insurance and retrofit in managing natural disaster risk: A multi-stakeholder perspective. Nat. Hazards
2014, 74, 1043–1068. [CrossRef]
25. Preston, B.L.; Brooke, C.; Smith, T.G.; Measham, T.F.; Gorddard, R. Igniting change in local government:
Lessons learned from a bushfire vulnerability assessment. Mitig. Adapt. Strateg. Glob. Chang. 2009, 14,
281–283. [CrossRef]Sustainability 2019, 11, 2768 11 of 11
26. Liu, Y.; Chen, Z.; Wang, J.; Hu, B.; Ye, M.; Xu, S. Large-scale natural disaster risk scenario analysis: A case
study of Wenzhou City, China. Nat. Hazards 2011, 60, 1287–1298. [CrossRef]
27. Birkmann, J.; Cutter, S.L.; Rothman, D.S.; Welle, T.; Garschagen, M.; Van Ruijven, B.; O’Neill, B.; Preston, B.L.;
Kienberger, S.; Cardona, O.D.; et al. Scenarios for vulnerability: Opportunities and constraints in the context
of climate change and disaster risk. Clim. Chang. 2015, 133, 53–68. [CrossRef]
28. Mietzner, D.; Reger, G. Advantages and disadvantages of scenario approaches for strategic foresight. Int. J.
Technol. Intell. Plan. 2005, 1, 220–239. [CrossRef]
29. Khan, F.; Rathnayaka, S.; Ahmed, S. Methods and models in process safety and risk management: Past,
present and future. Process Saf. Environ. 2015, 98, 116–147. [CrossRef]
30. Ben-David, I.; Raz, T. An integrated approach for risk response development in project planning. J. Oper. Res.
Soc. 2001, 51, 14–25. [CrossRef]
31. Fan, C.F.; Yu, Y.C. BBN-based software project risk management. J. Syst. Softw. 2004, 73, 193–203. [CrossRef]
32. Cagno, E.; Caron, F.; Mancini, M. A multi-dimensional analysis of major risks in complex projects. Risk Manag.
2007, 9, 1–18. [CrossRef]
33. Cioffi, D.F.; Khamooshi, H. A practical method of determining project risk contingency budgets. J. Oper. Res.
Soc. 2009, 60, 565–571. [CrossRef]
© 2019 by the authors. Licensee MDPI, Basel, Switzerland. This article is an open access
article distributed under the terms and conditions of the Creative Commons Attribution
(CC BY) license (http://creativecommons.org/licenses/by/4.0/).You can also read