2025 AIDS TARGETS MEETING REPORT - DRAFT - 12 Oct - UNAIDS
←
→
Page content transcription
If your browser does not render page correctly, please read the page content below
2025 AIDS TARGETS
Virtual technical consultation for the 2021-2030 resource needs estimates
                         28 and 30 September 2020

                          MEETING REPORT
                           DRAFT – 12 Oct

                                    0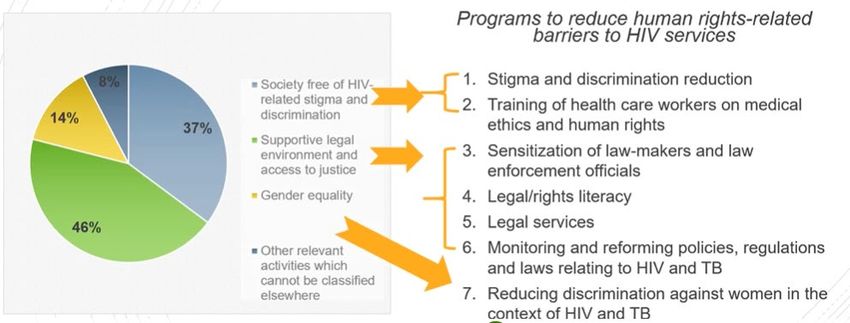
Introduction
Programmatic targets for 2025 and impact and resource needs estimates for 2021–2030 are being
developed by UNAIDS in close collaboration with its partners. The outputs are timed to serve as key
components of the next UNAIDS strategy, a possible future United Nations General Assembly High Level
Meeting on the global HIV response, Global Fund replenishments, World Health Organization health
sector targets, national target-setting and strategic planning and the decision-making of major global
partners.

A multi-stakeholder Steering Committee is tasked with guiding the process. Experts’ technical inputs are
being made within six consultative thematic groups: (1) testing and treatment; (2) primary prevention;
(3) social enablers; (4) elimination of mother to child transmission; (5) costs and resources; and (6)
integration. It was felt that innovations and new technologies would not have major impact on the 2025
targets.

A technical consultation on unit costs and resource needs estimates, held virtually via Zoom on 28 and
30 September 2020, focused on the mapping of baseline data, the methods and assumptions to
estimate missing unit cost data, and the projection of resource needs for the following programme
areas: HIV prevention, testing and treatment services; programme management and above-site
programme costs; and social enablers.

In the opening session, UNAIDS Deputy Executive Director Shannon Hader noted that the development
resource needs estimates for the global HIV response are both a technical and political exercise. During
the previous resource needs process conducted for the current UNAIDS strategy, civil society argued
that the estimated US$ 26.2 billion in domestic and donor resources needed for HIV responses in low-
and middle-income countries in 2020 was lowered to accommodate reductions in donor funding, while
other groups criticized the estimates as being extremely high, arguing that the 2020 targets could be
achieved with existing resource levels plus efficiency gains rather than large commitments of additional
resources. Hader noted that the set of targets being developed for 2025 place additional emphasis on
social enablers, an area that holds particular challenges for the development of resource needs
estimates. She called on the more than 50 technical experts attending the consultation (see participants
list in Annex A) to provide the key inputs needed to develop a price tag for the global AIDS response for
the period leading to 2030 in an environment of competing needs, including the new constraints and
opportunities related to the COVID-19 pandemic.

An extensive background paper was developed by the Avenir Health team, in collaboration with UNAIDS
staff. This was distributed to all participants of the consultation in advance so that they could review
the status of work thus far and prepare to address outstanding issues.

John Stover from Avenir Health outlined the scope of the resource needs estimates, which cover 119
low- and middle-income countries, 13 direct interventions plus programme management, social
enablers and above-site level costs, and 12 population groups over the period 2019–2030 (Table 1).

Table 1. Direct interventions and populations within the 2019–2030 resource needs estimate

 Interventions                                          Populations
 Outreach services                                      Sex workers
 Pre-exposure prophylaxis                               Gay men and other men who have sex with men

                                                    1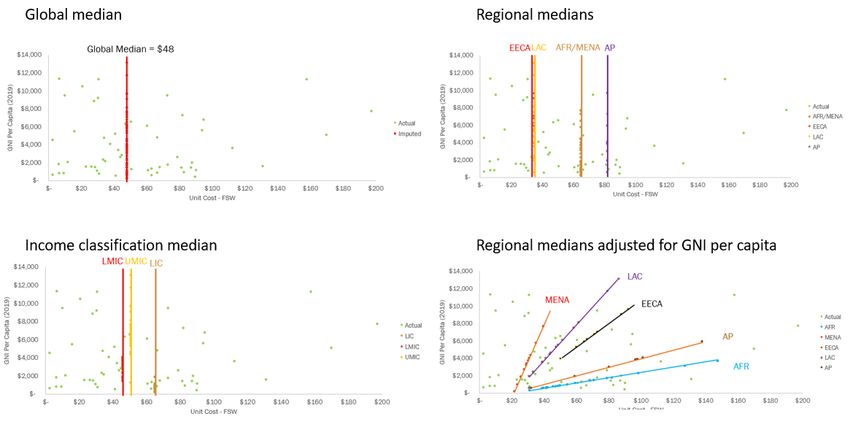
Testing and treatment of STIs                           Transgender people
    Needle–syringe programmes                               People who inject drugs
    Opioid substitution therapy                             People in prisons and other closed settings
    Condom and lubricant distribution                       Adolescent girls and young women
    Comprehensive sexuality education                       Adolescent boys and young men
    Economic empowerment                                    Adults (male and female)
    Voluntary medical male circumcision                     Children
    HIV testing                                             Pregnant women
    Antiretroviral therapy                                  People living with HIV
    Prevention of mother-to-child transmission
    Post-exposure prophylaxis

Intervention costs are calculated by multiplying the size of the population reached by the unit costs of
the service. Other costs—including programme management costs, above site level costs and social
enabler costs—are typically calculated as either lump sums or percentage add-ons to the direct
intervention costs (Figure 1).

Figure 1. Resource needs estimation methods

Resource needs for HIV services
To develop the unit costs for HIV testing services (HTS), prevention and treatment activities, Avenir
Health conducted a thorough review of a variety of available unit cost sources and collated the unit
costs. The sources include:

      1. Investment Cases 1

      2. Costed National Strategic Plans

1
 Benin, Cote d’Ivoire, Democratic Republic of the Congo, Eswatini, Ethiopia, Jamaica, Kenya, Malawi, Mauritius,
Namibia, Philippines, South Africa, Suriname, Tanzania, Togo, Uganda, Zambia, Zimbabwe

                                                        2
3. Global Health Cost Consortium Unit Cost Study Repository (GHCC UCSR) 2
4. Individual country unit cost databases 3
5. PEPFAR Unit Expenditure data (limited to HTS and VMMC)
6. Optima modelling unit cost data
7. Asian Epidemic Modelling (AEM) unit cost data
8. Other sources (including more recent costing studies that were not part of the GHCC UCSR)
Available unit costs were initially collated for all 119 low- and middle-income countries. However, a
more intensive review of data was conducted for the 20 countries 4 that represent 72% of all resource
needs estimated in 2018. 5
The Avenir team used the available data to develop one unit cost per service per country. If there was
multiple cost data for a country, the unit cost within the most recent national strategic plan or
investment case was usually used. If no unit cost was available for a service within a country, it will be
imputed based on selected criteria.
While PEPFAR unit expenditure (UE) data were collected, they were not used for developing
recommended unit costs, since UE data is limited to only those expenditures utilized by PEPFAR.
However, the median PEPFAR UE estimate will be presented for HTS and VMMC, for comparison
purposes.
During discussion it was noted that this resource needs estimate uses average costs rather than
marginal costs, and that the unit costs do not impose a minimum standard of either service quality,
comprehensiveness or efficiency. Thus, even country unit costs for the same stated service may not
always be comparable. This is a limitation of the methodology.
The final outputs of this process will be regional and global resource needs estimates. These estimates
will not include ranges. However, a sensitivity analysis will be undertaken, and the results of that
analysis will be available, but perhaps not published. Country resource needs estimates should be done
via in-country processes.
Prevention and testing services
Unit cost data availability for primary prevention services across the 119 countries ranged from 47% for
Gay/MSM services and 4% for prisoner services (Table 2). Unit cost data for sex worker services in 54
countries, gay/MSM services in 56 countries and VMMC services in 17 countries were presented in
detail to serve as illustrative examples. These details included mean, median and ranges globally,
regionally and by country income classification.
2
Available at: https://ghcosting.org/pages/data/ucsr/app/
3
Kenya, Malawi, Tanzania, Uganda and Zambia.
4
Angola, Brazil, China, DRC, Ethiopia, India, Indonesia, Kenya, Malawi, Mexico, Mozambique, Nigeria, Pakistan,
South Africa, Tanzania, Turkey, Uganda, Ukraine, Zambia and Zimbabwe.
5
UNAIDS 2019 resource availability and needs estimates.
3PrEP costs will be calculated using a tool called PrEP-it—a recently designed costing model that uses
PrEP implementation costs from Eswatini, Kenya, South Africa, Zambia and Zimbabwe.
For HIV testing, the costing team looked at the overall cost of testing, as well as specific costs for
provider-initiated testing and counselling, voluntary testing and counselling, HIV self-testing, index case
testing, universal testing and treatment and early infant diagnosis.
The unit costs of the majority of prevention and testing services are not expected to change much over
time, with the potential exception of self-testing.
It was noted during discussion that the median unit cost of some prevention services for low-income
countries (LICs) is higher than the median unit costs for lower middle-income countries (LMICs) and
upper middle-income countries (UMICs). Lower-income countries often produce lower output for the
same amount or resources. The fact that international NGOs often play a larger role in service delivery in
these countries can also raise unit costs.
Table 2. Percentage of countries with unit cost data for primary prevention services
Treatment and PMTCT services
The development of resource needs estimates for treatment services uses a partial ingredients-based
approach focused on the costs of first- and second-line antiretroviral medicines, laboratory testing and
service delivery. For each ingredient, baseline data are collected, extrapolation is done to impute unit
costs for missing data, and then assumptions are made to project the changes in unit costs over time.
Unit cost data was primarily collected from national strategic plans and investment cases, through the
UNAIDS Global AIDS Monitoring database, and then supplemented from other sources such as the
literature and conference abstracts.
For antiretrovirals, it was proposed to assume that all low-income and lower middle-income countries
will reach a unit cost of US$ 70 for a DTG-based first-line regimens by 2021 using a linear decline from
42019, while upper-middle-income countries will achieve a linear 50% decline in first-line unit costs
between 2019 and 2030, with a floor of US$ 70. Several participants felt that the 50% decline for UMICs
was too steep. It was also suggested during discussion to use a paediatric first-line baseline price of US$
147, although subsequently the recommendation was modified to apply to South Africa only, as they
use an atypical paediatric first-line regimen.
For second-line regimens, it was proposed that prices remain at 2019 levels through 2030 for all
countries.
For service delivery costs, a major issue to consider is the cost impact of countries transitioning to
differentiated service delivery (DSD) models, a transition that has accelerated due to the sudden
constraints placed on health systems by the COVID-19 pandemic. Most of the cost data available do not
include the use of DSD. The costing team proposes to infer a relative cost of the standard of care vs the
DSD model, using analyses of literature done by the AMBIT and EQUIP projects (see background paper
for more details). Initial results showed an average reduction of 6.5% in service delivery costs from
transitioning to DSD. It was proposed to assume that all countries make this transition by 2021. The
group was asked to consider whether the size of the reduction, the timeline and the scope of countries
it is applied to are reasonable. The same basic method used for service delivery costs was also used for
laboratory costs, assuming that 50% of lab cost is traded and 50% non-traded. A proposed future
assumption for lab costs is that the transition from the standard of care to DSD will result in an average
unit cost reduction of 3.3%, which would be applied to the nontraded portion (50%) of lab costs in all
countries by 2021.
Participants noted that the definition of DSD has evolved over time. Initially, DSD was defined primarily
as increasing the provision of multi-month antiretroviral therapy with a resulting decrease in the
number of facility visits. More recently, the definition of DSD has been expanded to other “patient-
friendly” services. Some felt that a 6.5% reduction for the service delivery component was too optimistic
and should be (a) lowered, and (b) incorporate a lag time on any unit cost reduction as it would only be
achieved through an increase in the number of people reached rather than a decrease in human
resource costs. Participants also felt that the median decline in lab costs from moving to DSD, 0.0%,
should be used.
For PMTCT, on a country by country basis, it is proposed to divide annual first-line antiretroviral
medicines costs in half, on the assumption that a pregnant woman identified by the PMTCT programme
will be on antiretroviral therapy within that programme for an average of six months (half a year), and
that after delivery of her baby her treatment costs will be charged to the treatment programme. For
service delivery, since pregnant women generally visit a health-care provider more frequently than
other people living with HIV, it is proposed use the same annual service delivery cost for each country as
is, which would provide resources for approximately twice as many visits as other ART clients.
Laboratory costs are proposed to be doubled to reflect that pregnant women require more tests than
the average ART client.
Imputation of missing unit cost data
A critical question for all HIV services is how to impute unit costs for countries where no data are
available. Several options exist (Figure 2):
5• The global median or mean, with the mean unit cost less preferred because it is more influenced
by outliers.
• The regional median.
• Income classification median (low-income countries, lower middle-income countries and upper
middle-income countries).
• Regional unit cost adjusted for GNI per capita.
• Income classification unit cost adjust for GNI per capita.
The impact of using each imputation method above was calculated for prevention and testing services,
using the global median as the comparator. For female sex workers each option produced a similar
result, with the total resources required changing by a range of +6% for the global mean and -2% for the
median from highest impact countries. For other services the results of different imputation methods
were more varied. For HIV testing, for example, the global median was $5, the global mean was $13
(influenced by a few very high country unit costs), and regional medians ranged from $3 in eastern
Europe and central Asia and $20 in Asia and the Pacific.
Figure 2. Imputing options for female sex worker service unit costs
For antiretroviral medicines, it is proposed to use income group classifications to calculate average
prices to be used for imputation. For treatment service delivery costs, it is proposed to use regional
averages or income-class averages after adjusting for relative GNI per capita for countries with missing
data. During discussion it was suggested that income classifications may make more sense for
imputation because drug prices are often negotiated based on the income level of a country.
Participants were also asked whether missing lab cost data should be imputed using regional or income
group averages, and whether GNI per capita or PPP-adjusted GNI per capita is more appropriate to use.
Participants appeared to prefer the use of GNI per capita for treatment costs.
6Participants were asked to consider the various imputation options for each service area, and whether
unit costs should sometimes change over time. During discussion, it was suggested that using just one
approach for imputation may not be desirable. A multivariate regression analysis could be done to
calculate which imputation method is most appropriate for each service delivery area. But there may
not be sufficient data available to do so. Service coverage and HIV prevalence are other variables that
could be to guide the imputation of missing unit costs using a multivariate regression analysis. This
method was tested between Day 1 and Day 2 of the consultation meeting, and it appeared to produce
superior results. The group recommended further exploration of the use of multivariate analysis to
impute missing data. This should be feasible for services with relatively large numbers of unit costs, but
may be limited for those interventions with fewer data points.
For prevention and testing services, participants were asked to identify areas where prices might either
increase or decrease over time. There was no consensus regarding trends in unit costs going forward
into the future.
Efficiencies
A key question to consider in the estimation of resource needs over a five- to ten-year period is whether
efficiencies can be gained and thus unit costs reduced over time. A presentation by Avenir Health
suggested that major domestic and donor programmes place a great deal of emphasis on efficiency and
focus on delivering services according to evidence-based WHO and UNAIDS guidance. Thus, many
programmes are already operating at increased efficiencies and there may not be the likelihood of
further reductions in cost.
Within the resource needs estimation exercise, efficiency is in part built in by limiting the costing to a set
of targets that only include interventions with proven effectiveness within a particular epidemic setting.
For example, the cost of VMMC services is calculated only for high HIV prevalence countries with low
male circumcision rates.
It is also important to note that the resource needs estimates being produced will not be optimized
because a resource constraint is not identified. It is simply a calculation of the amount of resources
required to meet all of the 2025 and 2030 targets, rather than asking, “if we had X amount of resources,
what are the best ways to use them?” However, the use of some services is prioritized: for example,
PrEP is focused on sub-populations and geographies where it would have the biggest preventative
impact.
There were no specific recommendations from participants on efficiency indicators.
Another issue is cost sharing. In 2016 it was assumed that HIV funds would support the scale up of some
programmes that have benefits far beyond HIV, such as opioid substitution therapy (OST) for drug
dependence and cash transfers for keeping girls in school. And then it was assumed that other
programmes would slowly pick up the costs of those programmes over time. In this round, it is
important to consider how to handle this issue for OST, economic empowerment, comprehensive
sexuality education, gender-based violence prevention, family planning and other services.
The future price of commodities such as antiretroviral medicines is important to consider. Global pricing
agreements have dramatically reduced the cost of these medicines in recent years, and additional cost
reductions may be possible in the future. Similarly, significant opportunities exist to reduce the cost of
7HIV testing by focusing on the most effective testing modalities and tailoring testing strategies to meet
the needs of at-risk populations and maximize yield of HIV-positive diagnoses. In particular, the
expansion of self-testing could result in considerable cost reductions. In addition, as knowledge of HIV
status increases over time, the number of people who need to be tested will decrease, leading to a
reduction in spending. However, it was noted during discussion that it may get more and more difficult
to find the few remaining undiagnosed people living with HIV, leading to a much higher unit cost.
Economies of scale are possible at the facility level for some interventions, such as the expansion of HIV
testing, PMTCT and VMMC. But it is unclear how this impacts the national programme over time. Some
facilities will have larger volumes of clients and lower unit costs, but as the programme expands new
facilities will be opened that will have low volumes of clients and higher unit costs. Because of this the
current thinking is that economies of scale should not be included in the new resource needs estimates.
COVID impact
Participants discussed the potential impact of COVID-19 on the resource needs estimates. UNAIDS is
currently collecting data from countries on COVID-related disruptions and innovations on a monthly
basis to determine the effect of COVID on service coverage in 2020. It is still unclear how to handle the
situation going forward. For example, will disruptions be short-lived followed by a rapid recovery? Will
some opportunities be simply lost during the COVID pandemic? It is likely that the Steering Committee
will need to consider multiple scenarios of the possible impact of the COVID-19 pandemic, including the
potential negative implications on HIV incidence and AIDS related mortality.
It was noted that India is being hit hard by the COVID-19 pandemic, and that could have an impact on
the production of generic antiretroviral medicines. It was also noted that COVID-19 has convinced some
countries to finally allow take-home doses of opioid substitution medications, such as methadone, for
people receiving treatment for opioid drug dependence. The reduction in clinic visits is reducing facility
costs, but it’s unclear whether this change is temporary or permanent.
Integration issues
The 2025 targets process has taken a much more detailed approach to the integration of HIV and non-
HIV services than previous rounds of target-setting. A systematic review of the scientific literature on
the integration of HIV and other services was conducted. The focus was of the review was on the
effectiveness of integration. Cost data were extracted on HIV service integration with tuberculosis,
family planning, maternal and child healthcare, sexual and reproductive health, HPV and cervical cancer,
primary healthcare, noncommunicable diseases, viral hepatitis and drug dependence treatment. These
costs were compared to stand-alone HIV service delivery. Integrated service delivery usually had a
higher cost than stand-alone HIV services, but this cost comparison does not take into consideration that
an individual accessing the integrated services is receiving the HIV service plus other services.
Participants suggested that a comparison should be done between the cost of the integrated service and
the sum of costs of the individual services delivered separately. It was also suggested that integrated
service delivery might be more expensive than delivering services individually, but that the integrated
approach could yield broader benefits. A general lack of data on the costing the integrated service
delivery was noted. More research is needed.
8Estimating programme management and above-site programme costs
Programme management (PM) and above-site programme (ASP) costs can make significant
contributions to total resources required. For this exercise, publicly available FY2018 data from two
types of PEPFAR country programmes—Long-Term Strategy (LTS) and Strategic and Technical Alignment
for Results (STAR) 6—has been triangulated with existing NASA data to calculate relative costs of PM and
the following ASP areas: HMIS, surveillance and research; human resources for health; institutional
prevention; laboratory systems strengthening; laws, regulations and policy environment; not
disaggregated; policy, planning, coordination and management; procurement and supply chain
management; and public financial management strengthening.
The results show that PM and ASP account for 24.6% of total costs, with PM as the largest category, at
11.3%, and HMIS, surveillance and research second at 5.4% (Figure 3). The PEPFAR PM data do not
include management and operation (M&O) expenses, which can be significant for PEPFAR. Regional and
income classification analyses showed that UMICs, countries with STAR programmes 7 and Asia-Pacific
countries (which are mostly STAR countries) have higher than average PM and ASP costs. It was
proposed to participants to use the income classification group averages for countries with no available
data. The group was also asked whether M&O should be included in the cost estimates.
Figure 3. Average programme management, indirect and above-site level expenditures, US FY2018
6
In past years, LTS and STAR OUs followed different planning and evaluation processes; see
https://srhrindex.srhrforall.org/uploads/2018/12/2017_PEPFAR-FY-2017-Country-Operational-Plan-Guidance.pdf
for further details.
7
Angola, Cambodia, Dominican Republic, India, Indonesia, Myanmar and Papua New Guinea. There are also
regional STAR programmes for Asia, Central America and Central Asia.
9Participants debated whether fixed percentages were the best way to estimate PM and ASP costs. For
example, if an ART programme doubled the number of people on treatment, would these cost
components also double? It was also noted that different donors have different ASP costs. However,
NASAs have ASP costs from a range of donors, and the triangulation has thus accounted for this
variation. It was also suggested that countries transitioning away from donor funding could have
reduced ASP costs over time, and that could be confirmed using time-trend data from the NASAs and
then potentially incorporated into the resource needs estimates. Procurement and supply chain
management costs in particular could potentially be adjusted to reflect the proportion of the response
funded by donors.
Others felt that proportions are the most practical way to estimate PM and ASP costs, and these could
ideally be adjusted to account for the scale of the programme, the level of donor dependence and other
key factors.
Resource needs for social enablers
The 2025 target-setting process is giving greater attention to social enablers, including the legal and
policy environments that HIV responses operate within and efforts to eliminate the stigma,
discrimination and gender inequality that disrupt access and uptake of services. The scope of the social
enablers included in the 2025 targets was guided by a technical consultation on the issue that focused
on enablers where there is sufficient evidence of an influence on HIV outcomes. An analysis by a group
of experts showed how an absence of social enablers equates to impediments to core HIV programmes’
ability to achieve the required reductions of HIV incidence and AIDS-related mortality. The set of social
enablers targets are nearly final, and how they modify HIV outcomes and impacts are being
incorporated into the targets model. This consultation has been asked to focus on how best to estimate
the resources needed for these social enablers, and how much of that cost should be included within
regional and global HIV response price tags.
Breaking Down Barriers initiative
An important input is the Global Fund’s Breaking Down Barriers initiative, which has guided a substantial
increase in the programming and expenditure of Global Fund resources on the reduction of human
rights barriers to health services. The initiative’s target is to increase the allocation of Global Fund
resources that were allocated to such efforts from a baseline of 0.7% to 3%. Matching funds totalling
US$ 45 million were provided to programmes to reduce human rights-related barriers to HIV, TB and
malaria services in the 2017–2019 allocation cycle, and so far US$ 41 million has been provided in the
2020–2022 allocation cycle. Costing guidance for the initiative was developed in consultation with
HEARD using the UNAIDS Human Rights Costing Tool.
A scorecard has been used to assess programme scale at baseline, mid-term and end term. The
scorecard showed that 16 countries were investing at baseline an average of US$ 640,000 per year in
the reduction of human rights-related carriers to HIV services. Most of this funding was spent on
supportive legal environments and access to justice (Figure 4). The experience of using the scorecard
showed that costs are not homogeneous, the range of investment was large, and that investment was
generally far below what was estimated to be needed to comprehensively address these barriers.
10Figure 4. Distribution of funding on social enablers, retrospective costing analysis, 16 Breaking Down
Barriers countries
The scale of the investment provides a unique opportunity to better define the costs of these
programmes, contribute to the UNAIDS resource estimates, and improve the imbedding of human rights
programmes within national diseases responses and national disease response plans.
GBV modelling, costs and impacts
UNFPA embarked on a major effort to cost its three transformative results—including family planning,
prevention of maternal deaths and prevention of gender-based violence (GBV)—as part of the Nairobi
ICPD celebrations. A literature review and modelling work by Avenir Health has been informed by a
global consultation. Global price tags have been developed, and a COVID-19 sensitivity analysis was
recently undertaken. The total cost estimate for GBV for 132 low- and middle-income countries from
2020 to 2030 is US$ 42 billion. The COVID-19 sensitivity analysis has projected an additional 15 million
cases of intimate partner violence in 2020 for an average lockdown duration of three months and 31
million cases for an average lockdown of six months. This analysis will be refined as more data become
available.
Discussion on integration and social enablers
Participants noted that the social enablers identified in the 2025 AIDS targets provide much greater
benefits than merely the removal of barriers to HIV service delivery—that they are part of a broader
social agenda. It was also noted that some countries invest heavily in the strengthening of human rights-
related barriers to HIV services, and that negative investment could perhaps be accounted for within
this process. Several participants expressed discomfort with the use of a percentage add-on to estimate
the resources needed for social enablers, and they called for a more rigorous approach using the data
from the Global Fund and other sources.
It will be important for the Steering Committee and UNAIDS to consider how to clarify potentially
overlapping concepts. Currently, some donors are including social enablers and integrated services into
their defined service packages for specific vulnerable and key populations. For example, the DREAMS
project under PEPFAR includes family planning and reduction of GBV in their services for adolescent girls
and young women.
11A question facing the resource needs estimate is whether the HIV response should be pick up a portion T
, and if so, how much. For example, family planning is an important service for women living with HIV
who are of reproductive age. Data suggest that women living with HIV account for about 1% of all
women aged 15–49 years within 120 low- and middle-income countries. If the family planning needs of
women living with HIV are similar to other women, then their portion of the total global resource needs
for family planning would be about US$ 70-110 million a year. Some participants questioned this
approach, as it would be difficult to know where to draw the line—the HIV response could be charged
for a wide range of services, resulting in an inflated global price tag.
There was general consensus that the programmes included in the costing should have strong evidence
of impact on HIV outcomes. There is a concern that some countries and donors believe that they waste
enormous amounts of resource on ancillary projects that have little impact on the access and uptake of
HIV services. On the other hand, it is important to recognize that human rights interventions are critical
elements of the HIV response as they enable programme effectiveness. The evidence presented during
the consultation showed how lack of investment on social enablers leads to inefficiencies in the HIV
response. It was underscored during discussion that the literature review conducted for the 2025 targets
process and previous consultation with experts in the field—including academics, civil society
organizations and advocates—concluded with a decision to include a robust sub-set of targets for social
enablers within the total set of 2025 targets. This final set of targets should send the message to
countries that investment in social enablers needs to be included as specific components of a national
strategic plan that is costed, properly implemented and fully funded.
Next steps
The organizers of the consultation thanked participants for providing feedback on the majority of
questions that were raised. These new inputs will be incorporated into the background paper and the
resource needs estimation. Some specific actions to be pursued include:
• Collection of additional cost data on social enablers from the Global Fund.
• Additional research on defining efficiencies and the impact of these efficiencies on costing.
• Further exploration of how to best incorporate integrated approaches into the costing
equations.
• An expanded definition of DSD that goes beyond multi-month dispensing of antiretroviral
medicines and reducing the number of outpatient visits per year.
A draft resource needs estimate will be presented to the steering committee of the 2025 AIDS targets
process in a few weeks’ time.
12Annex A. Virtual Consultation on the estimation of the 2021-2030 resource needs)
28 and 30 September 2020
List of Participants
NAME Email Affiliation
1 BLECHER, Mark Mark.Blecher@treasury.gov.za SA-Treasury
2 FORSYTHE, Steven sforsythe@avenirhealth.org Avenir Health
3 BOLLINGER, Lori LBollinger@avenirhealth.org Avenir Health
4 DE LAY, Paul pkdelay11@me.com SC-Cochair
5 HADER, Shannon haders@unaids.org UNAIDS DXD-
Programme
6 IZAZOLA, Jose A Izazolaj@unaids.org UNAIDS
7 STOVER, John jstover@avenirhealth.org Avenir Health
8 FONTAINE, Christopher fontainec@unaids.org UNAIDS
9 GHYS, Peter ghysp@unaids.org UNAIDS
10 GODFREY-FAUSSETT, Peter faussettp@unaids.org UNAIDS
11 LAMONTAGNE, Erik lamontagnee@unaids.org UNAIDS
12 MATTUR, Deepak matturd@unaids.org UNAIDS
13 SEMINI, Iris seminii@unaids.org UNAIDS
14 ARUSTAMYAN, Gayane Gayane.Arustamyan@theglobalfund.org GFATM
15 AVILA, Carlos carlos.avila@thepalladiumgroup.com Palladium
16 BAKER, Susanna sbaker@usaid.gov USAID
17 BAERNIGHAUSEN, Till till.baernighausen@uni-heidelberg.de Heidelberg
18 BAUTISTA, Sergio sbautista@insp.mx INSP
19 BOHDAN, Nosyk bnosyk@bccfe.ca BC Centre for
Excellence in
HIV/AIDS
20 BROWN, Tim tim@hawaii.edu AEM Team
21 CHALKIDOU, Kalipso k.chalkidou@imperial.ac.uk SC Member
22 CIUPAGEA, Monica monica.ciupagea@un.org UNODC. HIV/AIDS
Section
23 COHEN, Steve stevec@genesis-analytics.com Genesis analytics
24 DONGMO NGUIMFACK, dongmonguimfackb@who.int WHO for ARV/lab
Boniface prices
25 FRIEDMAN, Howard friedman@unfpa.org UNFPA
26 GORGENS, Marelize mgorgens@worldbank.org SC Member
27 GUTHRIE, Teresa guthriehealthfinancingconsult@gmail.com SA consultant
28 HARRIS, Kate kate.harris@gatesfoundation.org BMGF
29 HIJAZI, Mai mhijazi@usaid.gov USAID
30 HUNGER, Johannes johannes.hunger@theglobalfund.org GFATM
31 IOVITA, Alexandrina Alexandrina.Iovita@theglobalfund.org GFATM
32 JURGENS, Ralf ralf.jurgens@theglobalfund.org GFATM
1333 KABERIA, Josephine jkarambu@nacc.or.ke Head of Costing and
Expenditure
Analysis-Kenya NCC
34 KELLY, Sherrie sherrie.kelly@burnet.edu.au Optima
35 LARSON, Bruce blarson@bu.edu BU
36 MANN, Carlyn cmann@usaid.gov USAID
37 MEYER-RATH, Gesine gesine@bu.edu SA consultant
38 MUNTHALI, Spy smunthali@cc.ac.mw Consultant Malawi
39 BURKE-SHYNE, Naomi Naomi.BurkeShyne@hri.global Harm Reduction
International
40 NICHOLS, Brooke brooken@bu.edu HE2RO ---DSD
41 PATOUILLARD, Edith patouillarde@who.int WHO
42 REVILL, Paul paul.revill@york.ac.uk Liverpool U
43 RESCH, Stephen steve.resch@gmail.com Harvard School of
Public Health
44 REUBEN, Elan ereuben@usaid.gov PEPFAR/USAID
45 ROSEN, Sidney sbrosen@bu.edu BU
46 RUFFNER, Mike RuffnerME@state.gov OGAC
47 SANGRUJEE, Nalinee nks9@cdc.gov (CDC)
48 SAVEEEDRA, Jorge Jorge.Saavedra@aidshealth.org SC Member
49 SCHUTTE, Carl carls@genesis-analytics.com consultant SA
50 SHARAPKA, Katerina k.sharapka@gmail.com EECA consultant
51 STENBERG, Karin stenbergk@who.int WHO
52 SYARIF, Omar Osyarif@gnpplus.net GNP+
53 SZABO, Tunde t.szabo@eib.org European
Investment Bank
54 TERRIS PRESTHOLT, Fern Fern.Terris-Prestholt@lshtm.ac.uk LSHTM
55 TORRES RUEDA, Sergio Sergio.TorresRueda@lshtm.ac.uk LSHTM
56 VALLADARES, Ricardo ricardo.valladares.consulting@gmail.com consultant LA
57 WARD, Katherine kward1@worldbank.org World Bank
58 WEBB, Douglas douglas.webb@undp.org UNDP
59 WILKINSON, Thomas David twilkinson1@worldbank.org World Bank
60 ZHANG, Shufang Shufang.Zhang@theglobalfund.org GFATM
* Not all connected on both days
14You can also read