Impact of PET data driven respiratory motion correction and BSREM reconstruction of 68Ga DOTATATE PET/CT for differentiating neuroendocrine tumors ...
←
→
Page content transcription
If your browser does not render page correctly, please read the page content below
www.nature.com/scientificreports
OPEN Impact of PET data driven
respiratory motion correction
and BSREM reconstruction
of 68Ga‑DOTATATE PET/CT
for differentiating neuroendocrine
tumors (NET) and intrapancreatic
accessory spleens (IPAS)
Virginia Liberini 1,3,5*, Fotis Kotasidis2, Valerie Treyer3, Michael Messerli3, Erika Orita3,
Ivette Engel‑Bicik3, Alexander Siebenhüner4 & Martin W. Huellner3
To evaluate whether quantitative PET parameters of motion-corrected 68Ga-DOTATATE PET/CT
can differentiate between intrapancreatic accessory spleens (IPAS) and pancreatic neuroendocrine
tumor (pNET). A total of 498 consecutive patients with neuroendocrine tumors (NET) who underwent
68
Ga-DOTATATE PET/CT between March 2017 and July 2019 were retrospectively analyzed. Subjects
with accessory spleens (n = 43, thereof 7 IPAS) and pNET (n = 9) were included, resulting in a total of
45 scans. PET images were reconstructed using ordered-subsets expectation maximization (OSEM)
and a fully convergent iterative image reconstruction algorithm with β-values of 1000 (BSREM1000). A
data-driven gating (DDG) technique (MOTIONFREE, GE Healthcare) was applied to extract respiratory
triggers and use them for PET motion correction within both reconstructions. PET parameters among
different samples were compared using non-parametric tests. Receiver operating characteristics
(ROC) analyzed the ability of PET parameters to differentiate IPAS and pNETs. SUVmax was able to
distinguish pNET from accessory spleens and IPAs in BSREM1000 reconstructions (p < 0.05). This result
was more reliable using DDG-based motion correction (p < 0.003) and was achieved in both OSEM and
BSREM1000 reconstructions. For differentiating accessory spleens and pNETs with specificity 100%,
the ROC analysis yielded an AUC of 0.742 (sensitivity 56%)/0.765 (sensitivity 56%)/0.846 (sensitivity
62%)/0.840 (sensitivity 63%) for SUVmax 36.7/41.9/36.9/41.7 in OSEM/BSREM1000/OSEM + DDG/
BSREM1000 + DDG, respectively. BSREM1000 + DDG can accurately differentiate pNET from accessory
spleen. Both BSREM1000 and DDG lead to a significant SUV increase compared to OSEM and non-
motion-corrected data.
Abbreviations
AUC Area under the curve
BMI Body mass index
BPL Bayesian penalized likelihood
BSREM Block sequential regularized expectation maximization
CT Computed tomography
1
Nuclear Medicine Unit, Department of Medical Sciences, University of Turin, Turin, Italy. 2GE Healthcare,
Waukesha, WI, USA. 3Department of Nuclear Medicine, University Hospital Zürich, University of Zürich,
Rämistrasse 100, 8091 Zurich, Switzerland. 4Department of Hematology and Medical Oncology, University
Hospital Zürich, University of Zürich, Zurich, Switzerland. 5ENETS CoE Training Fellowship Grant 2019, Berlin,
Germany. *email: virginia.liberini@usz.ch
Scientific Reports | (2021) 11:2273 | https://doi.org/10.1038/s41598-020-80855-4 1
Vol.:(0123456789)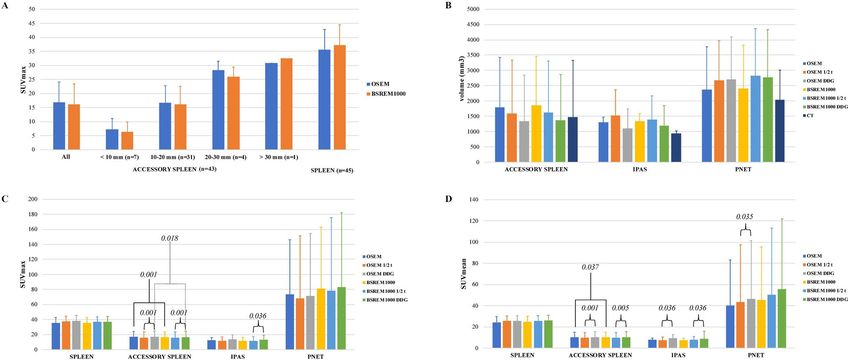
www.nature.com/scientificreports/
CECT Contrast-enhanced computed tomography
DDG Data-driven gating
IPAS Intrapancreatic accessory spleen
MIP Maximum intensity projection
MR Magnetic resonance
NET Neuroendocrine tumor
OSEM Ordered subset expectation maximization
PCA Principal component analysis
PET Positron emission tomography
ROC Receiver operating characteristic
SiPM Silicon photomultiplier
SSTR Somatostatin receptor
SUVmax Maximum standardized uptake value
TOF Time of flight
VOI Volume of interest
Accessory spleens are congenital foci of healthy splenic tissue that are separate from the main body of the
spleen1,2. Accessory spleens are relatively common, mostly solitary and have no gender predilection. Their pres-
ence was reported to be as high as 10–30% in postmortem s tudies3 and in 45–65% of subjects after s plenectomy4.
On CT, accessory spleens are seen in approximately 15% of p atients5. Accessory spleens are typically located in
the splenic hilum (80%) and in the tail of the pancreas (17%), but are also found in other locations, such as the
greater omentum, the splenic ligament, the small and large intestinal mesentery, the wall of the small intestine,
the female annex and the scrotum3,6.
Intrapancreatic accessory spleens (IPAS) appear as a solid contrast-enhancing mass, usually smaller than
3 cm, located within the tail of the p ancreas7–9. Owing to their morphology and contrast characteristics, they
may be mistaken for pancreatic tumors, in particular neuroendocrine tumors10. Both CT and MR imaging have
limited ability to discriminate pancreatic NET and IPAS because they typically share similar morphology and
contrast enhancement characteristics. Hence, an accurate diagnosis may avoid unnecessary surgery or biopsy.
Accessory spleens can be diagnosed with Tc-99m-labelled colloids. These colloids are taken up into splenic
tissue due to phagocytosis in the reticulum-endothelial cells and, therefore, can also identify functioning ectopic
splenic tissue11. Tc-99m-labelled heat-damaged red blood cell scintigraphy (Tc-99m-HDRBC) also utilizes retic-
ulum-endothelial cells that decompose damaged red blood cells12,13. However, the sensitivity of these exams is
hampered by the small size of most IPAS and by the comparably low resolution of conventional scintigraphy,
limiting a more widespread use of these techniques.
68
Ga-labeled somatostatin analogue such as 68Ga-DOTA-TOC, 68Ga-DOTA-TATE and 68Ga-DOTA-NOC
PET is the mainstay for the evaluation of the somatostatin receptor (SSTR) status of neuroendocrine neoplasms.
The biodistribution of somatostatin analogs is characterized by a physiological uptake in several organs, includ-
ing spleen14 and ectopic splenic tissue. Hence, IPAS may mimic pancreatic neuroendocrine tumors (pNET) and
cause a false positive finding.
Several retrospective studies assessed radiological imaging characteristics of accessory s pleens15,16. Specific
reports on 68Ga-DOTA-peptide PET in the literature are limited to individual c ases17–19.
The aim of our study was to evaluate whether quantitative parameters of 68Ga-DOTATATE PET/CT can
differentiate pNET from accessory spleens, including IPAS. For this purpose, the impact of novel Bayesian
penalized likelihood reconstruction and respiratory data-driven motion correction of PET on quantitation were
investigated20.
Materials and methods
Patient selection. We retrospectively analyzed a cohort of 498 consecutive patients, who underwent a
clinically indicated PET/CT with 68Ga-DOTATATE for staging/restaging neuroendocrine tumors (NET) at the
University Hospital of Zurich between March 2017 and July 2019. Only patients with documented willingness to
the use of their medical data for research were included in this retrospective, observational study. Our study was
approved by the local ethics committee and was conducted in compliance with ICH-GCP rules and the Decla-
ration of Helsinki. First, all PET/CT scans were reviewed by one nuclear medicine physician. All subjects with
accessory spleens (28 patients and 38 list mode scans with a total of 43 accessory spleens) were included into the
study. Intrapancreatic lesions were considered accessory spleens (IPAS) if lesions had been stable for at least two
years, and in the absence of any abdominal neuroendocrine tumor history (n = 7). CT characteristics of lesions
were reviewed by one double board-certified radiologist/nuclear medicine physician (Fig. 1). Subjects with pan-
creatic neuroendocrine tumors (pNET), either primary or metastatic, were included only if histopathology was
available (7 patients and 9 list mode scans with a total of 9 pNET; 2 scans with 1 accessory spleen and 1 pNET
already included in the accessory spleens cohort and 7 scans with 1 pNET) (Fig. 2).
PET/CT acquisition. All patients underwent an exam on a PET/CT scanner with digital detector read-
out technology equipped with silicon photomultipliers (SiPM) (GE Discovery Molecular Insights—DMI PET/
CT, GE Healthcare, Waukesha, WI). In accordance with the EANM procedure guidelines for PET imaging, the
injected tracer activity was 132.7 ± 20.9 MBq of 68Ga-DOTATATE (range 81–164 MBq).
After an uptake time of 60 min (range 52–79) and following CT acquisition for attenuation correction (from
the vertex of the skull to the mid-thighs), PET data were acquired in time-of-flight (TOF) mode, covering the
same anatomical region of the CT, with 2–3 min/bed position and 6–8 bed positions per patient (23% overlap).
Scientific Reports | (2021) 11:2273 | https://doi.org/10.1038/s41598-020-80855-4 2
Vol:.(1234567890)
www.nature.com/scientificreports/
Figure 1. 68Ga-DOTATOC PET/CT showing an intrapancreatic accessory spleen mimicking a pancreatic
neuroendocrine tumor. Contrast-enhanced CT image in portal-venous phase showing the lesion in the
pancreatic tail (a). Contrast-enhanced CT image in arterial phase showing the enhancing lesion in the
pancreatic tail. The lesion is characterized by mild 68Ga-DOTATATE uptake, more evident in OSEM-DDG (d)
and BSREM-DDG (f) images (SUVmax 8.6 and 7.6, respectively) compared with OSEM (c) and BSREM (e)
images without DDG (SUVmax 6.4 and 6.2, respectively). The PET volume of the accessory spleen is smaller
in OSEM-DDG and BSREM-DDG images (980 mm3 and 814 mm3, respectively) compared with OSEM and
BSREM images without DDG (1400 mm3 and 1520 mm3, respectively).
After that, following in-house rules for 68Ga-DOTATATE-PET, a contrast-enhanced CT (ceCT) scan was acquired
(in arterial and venous phase) after intravenous injection of 70 mL of iodinated contrast medium (Iodixanol
[VISIPAQUE 320]; GE Healthcare) in breath-hold, with tube voltage range 120–140 kV and automated dose
modulation (range 60–440 mA/slice).
Bayesian penalized likelihood (BPL) reconstruction algorithms. The use of absolute quantitative
methods for PET/CT requires a fundamental standardization and harmonization21,22. The precision of quanti-
tative PET metrics depends on the combination of several aspects, including homogeneity of reconstruction
protocols and data analysis m ethods23. Today, ordered subset expectation maximization (OSEM) is the most
widely used algorithm for clinical PET/CT image reconstruction24, as clinical standard-of-care method. How-
ever, it is known that the true SUV is consistently underestimated with OSEM owing to early iteration termina-
tion and subsequent under-convergence, which is traded-off against noise25,26. Bayesian penalized likelihood
(BPL) reconstruction algorithms, such as block sequential regularized expectation maximization (BSREM—
Q.Clear; GE Healthcare), are increasingly used in clinical routine. Indeed, BSREM increases the accuracy of
lesion quantitation compared to OSEM by maximizing signal–to-noise ratio (SNR) while achieving almost full
convergence27–29.
Scientific Reports | (2021) 11:2273 | https://doi.org/10.1038/s41598-020-80855-4 3
Vol.:(0123456789)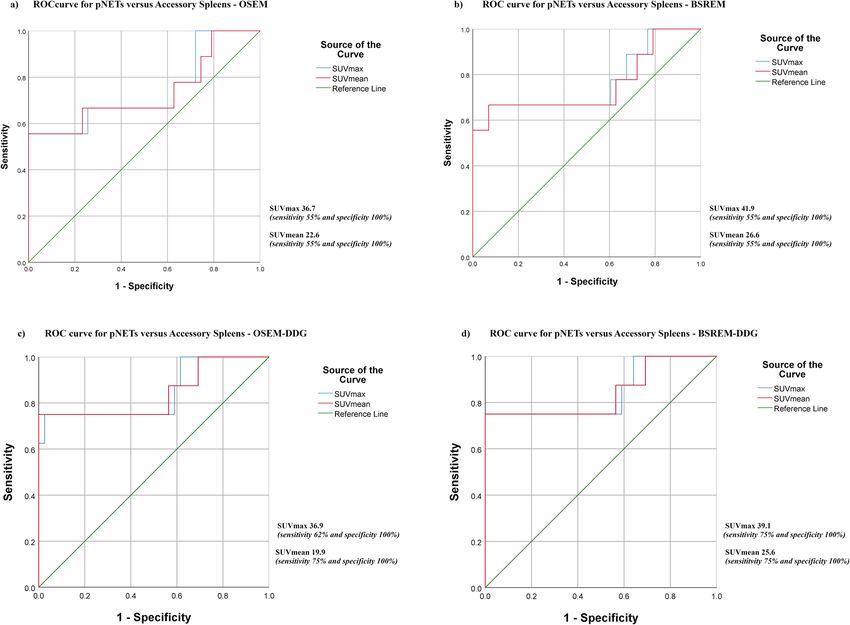
www.nature.com/scientificreports/
Figure 2. 68Ga-DOTATATE PET/CT with a pancreatic neuroendocrine tumor seen on PET/CT image (a) and
on contrast-enhanced CT image (b), confirmed by biopsy. Transaxial PET/CT images illustrate the impact of
different reconstruction on morphology, volume and uptake of the neuroendocrine tumor. The lesion is better
defined and yields higher SUVmax on OSEM-DDG (d) and BSREM-DDG (f) images (SUVmax 13.0 and 12.1,
respectively) compared with OSEM (c) and BSREM (e) images (SUVmax 11.2 and 10.4, respectively). In this
case, PET volume of the lesion is increased by DDG reconstruction (2880 m m3 for OSEM-DDG and 3170 m m3
for BSREM-DDG, respectively), because the severe motion blurring present in the conventional reconstruction
(2650 mm3 for OSEM and 2920 m m3 for BSREM, respectively) is compensated by DDG, yielding improved
lesion conspicuity.
The global strength of the regularization in BSREM (β-value) can be choose and modulate according to the
dataset of patients being studied, allowing for optimal reconstruction depending on the specific characteristics
of the radiotracer (i.e.: images with low/high contrast or low/high noise, physiological distribution of the radi-
otracer). In this study, the β-value of 1000 was selected based on previous studies, analyzing the effect on image
quality and considering both radionuclide properties and scanner characteristics30–32. In a recent study focusing
on optimization of image reconstruction for 68Ga-PSMA-11, a similar β-value close to 900 provided an optimal
tradeoff between signal and noise33.
Respiratory tracking and correction. Respiratory motion may impact on quantification and qualitative
evaluation of lesions in the chest and upper abdomen. Since most accessory spleens are found in this region,
motion tracking and subsequent correction may alter quantitative indexes and hypothetical cut-off values
Scientific Reports | (2021) 11:2273 | https://doi.org/10.1038/s41598-020-80855-4 4
Vol:.(1234567890)www.nature.com/scientificreports/
between IPAS and pNETs. Traditionally, respiratory motion correction is performed using an external gating
device positioned on the patient’s abdomen/chest and prescribing a priori the number and location of bed posi-
tions to correct for motion.
Unlike externally driven gating, which usually relies on infrared camera tracking of patient motion, data-
driven gating methods use solely PET raw data in combination with dimensionality reduction techniques, in
order to extract the respiratory signal. In our study, we used a commercially available DDG algorithm (MOTION-
FREE, GE Healthcare), in combination with a motion correction algorithm (Q.STATIC, GE Healthcare) that
utilizes the quiescent phase of the respiratory cycle [quiescent period gating (QPG)]34–37.
This technique utilizes a principal component analysis (PCA) to compute the spatiotemporal variation of list
mode data. The algorithm provides a signal-to-noise measure of respiration-like frequencies within the data,
denoted as R-value, that is configurable (R-value threshold). The determination of the R-value has a function
of trigger: the R-value is measured at the end of base acquisition time for each bed position for which motion
screening was prescribed and is used to make an on-the-fly decision whether motion has been detected. This
then triggers the data acquisition to automatically be extended according to the prescribed acquisition time
and data binning scheme used for motion correction (MC)38. In the default protocol, the quiescent phase of the
respiratory cycle is set to 50% for motion correction, triggering an automatic data acquisition extension equaling
to double the base acquisition time in order to preserve total count statistics. If data are screened retrospectively
for motion, then using Q.STATIC with a 50% quiescent phase results in utilizing half the acquired data for MC
without the ability to extend the acquisition prospectively. Furthermore, as the majority of data included in this
work were analyzed retrospectively (42 scans for a total of 42 accessory spleens, 6 IPAS and 8 pNET) and not
acquired prospectively with data acquisition extension, comparisons to non-MC data were performed using half
the base scan time in order to have comparable datasets with similar count statistics. Scans acquired prospec-
tively (3 scans for a total of 1 accessory spleen, 1 IPA and 1 pNET) was not included in this sub-cohort analysis
to avoid bias in data analysis. The R-value for triggering motion correction used for this study was R = 10.037.
Image reconstruction. PET image datasets were reconstructed with different settings (all with a 256 × 256
pixel matrix):
1. OSEM: 3 iterations, 16 subsets, FWHMI of 6.3 mm, 1:4 Z-axis filter and 6.4 mm Gaussian filter with both
time-of-flight (TOF) and point spread function (PSF) modelling (OSEMPSF; VUE Point FX with SharpIR,
GE Healthcare).
2. BSREM (Q.Clear, GE Healthcare) with both TOF and PSF and a β-value of 1000.
For respiratory motion correction, we used the DDG algorithm (MOTIONFREE, GE Healthcare) in combi-
nation with a motion correction algorithm (Q.STATIC, GE Healthcare), using a phase offset of 30% and a phase
window width of 50%, which are the default parameters supplied by the vendor:
1. BSREM1000-DDG with R = 10.0 + Q.STATIC;
2. OSEM-DDG with R = 10.0 + Q.STATIC.
Quantitative imaging analysis. Quantitative analysis was performed by one reader and PET images were
segmented using a General Electric AW workstation running PET VCAR software (GE Healthcare, Waukesha,
WI, USA). The following indices were recorded for each lesion:
1. location,
2. maximum diameter in mm, measured on CT,
3. volume in mm3, measured both on CT and on PET (PET volume),
4. maximum standard uptake value (SUVmax) and mean standard uptake value (SUVmean).
The volume was measured on CT data with an automatic contouring tool, while on PET was calculated using
a volume of interest (VOI) including the whole lesion volume, outlined with a 3D semi-automatic contouring
tool, and applying a threshold set at 41% of SUVmax21. SUVmax and SUVmean were calculated from the same
VOIs. Thereby the VOI was automatically propagated and adjusted to cover the lesion volume in all different
reconstruction sets.
m3 along
For all patients, a VOI of the spleen was also outlined on PET data and its volume measured in m
with SUVmax and SUVmean. Furthermore, a reference liver ROI was used by drawing a 3 cm3 VOI in the right
lobe of the liver (parenchymal organ background).
Statistical analyses. All statistical analyses were performed using SPSS version 25.0 (IBM Corporation,
Armonk, NY, USA39) and Minitab version 19.0 (Minitab Inc., State College, PA, U SA40). Categorical variables are
expressed as proportions, and continuous variables are presented as mean ± standard deviation (sd) or median
(range), depending on the distribution of values. The Pearson correlation coefficient was used to assess the rela-
tionship between SUVmax and diameter (mm) of the accessory spleens. A linear regression equation of diameter
over SUVmax value was calculated for all accessory spleens. Quantitative PET data (SUVmax and SUVmean) of
the three samples (all accessory spleens, IPAS and pNETs) were compared in each reconstruction using Mann–
Whitney U-test. P-values were calculated for IPAS versus all accessory spleens, IPAS versus pNET, and pNET
versus all accessory spleens.
Scientific Reports | (2021) 11:2273 | https://doi.org/10.1038/s41598-020-80855-4 5
Vol.:(0123456789)www.nature.com/scientificreports/
Demographic data of subjects
BMI, kg/m2 (range) 26.8 ± 4.4 (20.1–36.6)
Injected tracer activity, MBq (range) 132.7 ± 20.9 (81.4–164.4)
Time per bed, s (range) 134.0 ± 21.7 (120.0–180.0)
Scan time post injection, min (range) 60.4 ± 6.2 (52.0–79.0)
Volume of the spleen, mL 174.9 ± 43.4 (81.0–296.0)
Lesion Number, n (%) Maximal diameter (mm)—CT Volume (mm3)—CT
Accessory spleen—total 43 (100%) 13.5 ± 4.7 (6–31) 1477.3 ± 1807.9 (151–11,200)
Perisplenic 34 (79%) 13.8 ± 5.2 (6–31) 1636.1 ± 2054.8 (151–11,200)
Superior 0 – –
Lateral 0 – –
Inferior 3 (6.9%) 16.7 ± 4.1 (12–20) 2173.4 ± 1684.3 (630–3970)
Posterior 2 (4.6%) 11.5 (11–12) 754.5 (720–789)
Anterior 5 (11.6%) 10.8 ± 5.0 (6–18) 851.8 ± 927.7 (151–2420)
Medial 24 (55.8%) 14.2 ± 5.4 (9—31) 1805.8 ± 2322.2 (333–11,200)
Ectopic 9 (21%) 11.4 ± 3.8 (8–17) 877.2 ± 207.7 (367—1120)
Intrapancreatic 7 (16.3%) 12.3 ± 0.5 (12–13) 932.6 ± 89.9 (859–1120)
Splenic vessels 1 (2.3%) 17.0 1000.0
Colon wall 1 (2.3%) 8.0 367.0
pNET—total 9 (100%) 18.5 ± 3.9 (12–24) 2030.8 ± 977.7 (654–3540)
Table 1. Demographic data of study subjects and morphological data of accessory spleens and pNETs (values
are given as mean ± standard deviation and range) for the entire cohort of patients (43 accessory spleens, 7
IPAS and 9 pNET).
Parameters (SUVmax, SUVmean and volume) of each sample (all accessory spleens, IPAS, pNETs, and all
lesions) were compared among different reconstructions using Wilcoxon signed ranks test. The different recon-
structions were compared as follows:
• BSREM1000 versus OSEM;
• BSREM1000-DDG with R = 10.0 + Q.STATIC versus BSREM1000 half time/bed position ( BSREM1000 1/2);
• OSEM-DDG with R = 10.0 + Q.STATIC versus OSEM half time/bed position (OSEM 1/2);
• BSREM1000-DDG with R = 10.0 + Q.STATIC versus OSEM-DDG with R = 10.0 + Q.STATIC.
A two-tailed p-value of < 0.05 was considered to indicate statistical significance.
The ability of quantitative PET parameters (SUVmax and SUVmean) to differentiate between IPAS and pNETs
was assessed using receiver operating characteristics (ROC) analysis. An area under the ROC curve (AUC) of
0.90–1 indicated excellent accuracy, 0.80 to < 0.90 good accuracy, 0.70 to < 0.80 fair accuracy, 0.60 to < 0.70 poor
accuracy, and AUC 0.50–0.60 failed accuracy. ROC results were considered only if AUC was > 0.7041.
Ethics approval. Our study was approved by the ethics committee of the University Hospital of Zurich and
was conducted in compliance with ICH-GCP rules and the Declaration of Helsinki.
Informed consent. Only patients with documented willingness to the use of their medical data for research
and written informed consent for the scientific use of medical data were included.
Results
Out of 498 cases, accessory spleens were detected in 63 PET/CT scans of 63 patients (12.2%). Of these, PET list
mode data was available in 38 scans (60.3%; mean age 56.4, range 33–83 years). A single accessory spleen was pre-
sent in 33 scans (31 scans with one accessory spleen and 2 scans with one accessory spleen and one pNET), two
accessory spleens were presents in 5 scans. The majority of accessory spleens (79.1%) were located perisplenic,
particularly medial to the spleen (55.8%; splenic hilum, gastrosplenic ligament, splenorenal ligament), followed
by an intrapancreatic location (16.3%; IPAS), and 4.6% were ectopic (splenic vessels and paracolic—Table 1).
68
Ga-DOTATATE uptake and size of accessory spleens were correlated, SUVmax of accessory spleens accord-
ing to size measured on OSEM and BSREM1000 reconstruction is shown in Fig. 3a.
Significant correlations were observed between diameter (mm) and SUVmax of accessory spleens:
• in OSEM reconstruction with r2 = 0.779, p = 0.001, 95% CI [0.515, 0.853] for Pearson correlation, and a coef-
ficient of 1.266, with standard error equal to 0.167, p = 0.001 and r2 = 57.21% for the linear regression equation;
Scientific Reports | (2021) 11:2273 | https://doi.org/10.1038/s41598-020-80855-4 6
Vol:.(1234567890)www.nature.com/scientificreports/
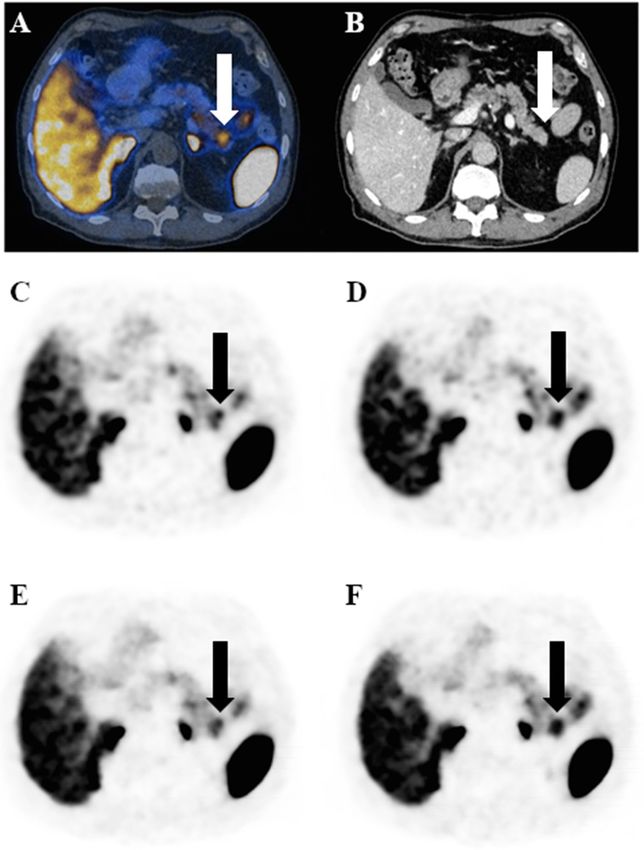
Figure 3. SUVmax of accessory spleens according to size (CT diameter of the lesions, mm) and spleen
measured on OSEM and B SREM1000 reconstruction (a). PET volume ( mm3) and CT volume (b), SUVmax (c)
and SUVmean (d) of spleen, accessory spleen, IPAS and pNET among different PET reconstructions in the
subcohort of exams acquired retrospectively (42 accessory spleens, 6 IPAS and 8 pNET). Significant P-values of
Wilcoxon signed-ranks test, performed for accessory spleens, IPAS and pNET among different reconstructions,
are reported in the SUVmax (c) and SUVmean panel (d). Note, for readability, only selected significant p-values
of relevant comparisons are shown, which support the results reported in the text.
• in BSREM reconstruction with r 2 = 0.725, p = 0.001, 95% CI [0.598, 0.885] for Pearson correlation, and a
coefficient of 1.246, with standard error equal to 0.178, p = 0.001 and r2 = 53.43% for the linear regression
equation.
Out of 498 cases, pNET lesions (primary and metastatic) were detected in 9 PET/CT scans (1.8%; mean age
64.2, range 44–74 years), 2 with 1 accessory spleen and 1 pNET already included in the accessory spleen cohort.
Regarding the sub-cohort of patients retrospectively acquired and analyzed for the DDG reconstructions,
results of lesion quantitation (42 accessory spleens, 6 IPAS and 8 pNET) with and without DDG (R > 10.0) are
shown in Fig. 3b–d. In all reconstructions, SUVmax and SUVmean were significantly lower in accessory spleens
compared to the spleen. P-values of Mann–Whitney U-test of PET/CT parameters (SUVmax and SUVmean)
among the three samples (all accessory spleens, IPAS and pNETs) in each reconstruction are shown in Fig. 3c,d.
P-values of Mann–Whitney U-test of PET/CT parameters (SUVmax and SUVmean) among all lesions (all acces-
sory spleens, IPAS and pNETs together) in each reconstruction are given in Table 2.
For the entire sub-cohort, SUVmax and SUVmean were able to distinguish pNET both from all accessory
spleens and from IPAS, both in OSEM and in BSREM reconstructions, with the only exception of SUVmax of
IPAS vs. pNET in OSEM. In particular, SUVmax can distinguish:
• Accessory spleens vs. pNET in OSEM (p = 0.024) and BSREM (p = 0.014);
• IPAS vs. pNET in BSREM (p = 0.034).
An even higher level of significance was achieved with DDG (R > 10.0), where SUVmax can distinguish:
• Accessory spleens vs. pNET in both OSEM-DDG and BSREM-DDG (p = 0.002 each);
• IPAS vs. pNET in both OSEM-DDG and BSREM-DDG (p = 0.033 each).
Table 2 shows p-values of PET/CT parameters tested against each other in different reconstructions. Wilcoxon
signed ranks test showed a significant difference of the following parameters:
• BSREM vs. OSEM: SUVmax (p = 0.001) and SUVmean (p = 0.037) of accessory spleens and SUVmax
(p = 0.010) of all lesions were higher on BSREM;
• OSEM-DDG (R > 10.0) vs. OSEM ½: SUVmax and SUVmean of both accessory spleens and all lesions were
higher on OSEM-DDG, while PET volume of both accessory spleens and all lesions (Fig. 4) was smaller on
OSEM-DDG (all p-values < 0.001);
• BSREM-DDG vs. BSREM ½: SUVmax and SUVmean were higher for accessory spleens (p-values < 0.001 and
0.005, respectively), IPAS (both p-values < 0.036) and all lesions (both p-values < 0.001) on BSREM-DDG;
• BSREM-DDG vs. OSEM-DDG (R > 10.0): SUVmax of accessory spleens (p < 0.018) and SUVmean of pNET
(p < 0.042) were higher on BSREM-DDG.
Scientific Reports | (2021) 11:2273 | https://doi.org/10.1038/s41598-020-80855-4 7
Vol.:(0123456789)www.nature.com/scientificreports/
BSREM1000 (DDG 10.0) vs. OSEM (DDG 10.0) vs. BSREM1000 (DDG 10.0) vs.
PET/CT parameters BSREM1000 vs. OSEM OSEM (DDG 10.0) OSEM (1/2) BSREM1000 (1/2)
SUVmax 0.010 0.126 0.001 0.001
All lesion* (accessory spleen,
SUVmean 0.297 0.482 0.001 0.001
IPAS and pNET)
PET volume 0.136 0.152 0.001 0.086
Intrapancreatic spleen vs all Intrapancreatic spleen vs
Reconstructions** PET parameters accessory spleen pNET pNET vs all accessory spleen
SUVmax 0.166 0.057 0.024
OSEM
SUVmean 0.121 0.044 0.029
SUVmax 0.117 0.034 0.014
BSREM1000
SUVmean 0.114 0.044 0.018
SUVmax 0.559 0.033 0.002
OSEM DDG 10.0
SUVmean 0.473 0.024 0.003
SUVmax 0.854 0.033 0.002
BSREM1000 DDG 10.0
SUVmean 0.676 0.033 0.003
Table 2. P-values of Mann–Whitney U-test of PET/CT parameters comparing the three samples (all
accessory spleens, IPAS and pNETs) in each reconstruction in the subcohort of exams acquired retrospectively
(42 accessory spleens, 6 IPAS and 8 pNET), as well as P-values of Wilcoxon signed-ranks test of PET/CT
parameters of all lesions (42 accessory spleens, 6 IPAS and 8 pNET) among different reconstructions in the
subcohort of exams acquired retrospectively. All lesion*: p-value was calculated with Wilcoxon signed-ranks
test. Reconstructions**: p-value was calculated with Mann–Whitney U-test.
Figure 4. 68Ga-DOTATATE PET/CT of a patient with an incidental accessory spleen, visible on contrast-
enhanced CT images (a,b). The accessory spleen is better defined with DDG and yields higher SUVmax (30.8
on OSEM (c), 35.1 on OSEM-DDG (d), 32.4 on BSREM (e) 37.0 on BSREM-DDG (f)) and lower PET volume
(10,750 mm3 on OSEM, 9320 m m3 on OSEM-DDG, 10,150 mm3 on BSREM 9130 mm3 on BSREM-DDG).
Furthermore, BSREM-DDG shows better noise characteristics compared to OSEM-DDG.
The relationship between SUVmax and PET volume for accessory spleen, IPAS and pNET separately in each
reconstruction (OSEM, OSEM-DDG, BSREM and BSREM-DDG) is shown in Fig. 5.
The ability of quantitative PET parameters of 68Ga-DOTATATE PET/CT to differentiate pNET and IPAS as
well as accessory spleens was assessed using a ROC analysis with and without DDG (Fig. 6).
NET are a heterogeneous group of tumors and the uptake of 68Ga-labeled somatostatin analogue is higher in
well-differentiated NET compared to poorly-differentiated NET, and correlates strongly with S STR2A receptor
expression42,43. As shown in Fig. 3a, uptake of accessory spleens was rather homogeneous and was associated
with the size of these organs. For this reason, we aimed to identify an SUVmax cut-off in each reconstruction
to discriminate pNET and IPAS with a specificity of 100%, in order to avoid false positives. ROC results were
considered only if AUC was > 0.70. OSEM-DDG and BSREM-DDG yielded good AUC (all > 0.84), while OSEM
and BSREM yielded at least fair AUC (all > 0.73).
Cut-offs of SUVmax that discriminate pNET and IPAS with 100% specificity were as follows:
• OSEM: SUVmax 19.7 (sensitivity 67%);
• BSREM: SUVmax 22.5 (sensitivity 67%);
• OSEM-DDG (R > 10.0): SUVmax 28.0 (sensitivity 75%);
Scientific Reports | (2021) 11:2273 | https://doi.org/10.1038/s41598-020-80855-4 8
Vol:.(1234567890)www.nature.com/scientificreports/
Figure 5. Scatter plots showing the relationship between SUVmax and PET volume of accessory spleens,
IPAS and pNETs in OSEM (a) and BSREM-DDG (b), respectively, in the sub-cohort of patients retrospectively
acquired (42 accessory spleens, 6 IPAS and 8 pNET).
Figure 6. ROC curve of SUVmax and SUVmean for discriminating pNET and accessory spleens with OSEM
(AUC = 0.742 and p = 0.024 of SUVmax; AUC = 0.734 and p = 0.029 of SUVmean (a)), BSREM (AUC = 0.765
and p = 0.013 of SUVmax; AUC = 0.755 and p = 0.017 of SUVmean (b)), OSEM-DDG (AUC = 0.846 and
p = 0.002 of SUVmax; AUC = 0.843 and p = 0.002 of SUVmean (c)) and BSREM-DDG (AUC = 0.846 and
p = 0.002 of SUVmax; AUC = 0.843 and p = 0.002 of SUVmean (d)) reconstructions in the sub-cohort of patients
retrospectively acquired (42 accessory spleens, 6 IPAS and 8 pNET).
Scientific Reports | (2021) 11:2273 | https://doi.org/10.1038/s41598-020-80855-4 9
Vol.:(0123456789)www.nature.com/scientificreports/
• BSREM-DDG (R > 10.0): SUVmax 25.0 (sensitivity 75%);
Cut-offs of SUVmax that discriminate pNET and accessory spleens with 100% specificity were as follows:
• OSEM: SUVmax 36.7 (sensitivity 55%);
• BSREM: SUVmax 41.9 (sensitivity 55%);
• OSEM-DDG (R > 10.0): SUVmax 36.9 (sensitivity 62%);
• BSREM-DDG (R > 10.0): SUVmax 39.1 (sensitivity 75%).
Discussion
Our study sought to investigate whether quantitative PET parameters of 68Ga-DOTATATE-PET/CT can dif-
ferentiate intrapancreatic accessory spleens and pancreatic neuroendocrine tumors.
The major findings of our study are as follows: (1) both SUVmax and SUVmean are able to distinguish pNET
from accessory spleens and IPAS, (2) SUVmax on the BSREM-DDG reconstruction yields the best results (p-value
≤ 0.002 for pNET vs. accessory spleens and ≤ 0.033 for pNET vs. IPAS), (3) different SUVmax cut-off between
pNET and accessory spleens/IPAS were found for each reconstruction, (4) and BSREM-DDG reconstruction
achieved the best ROC curve result [an SUVmax cut-off > 41.7 identifies a pNET with a specificity of 100% and
a sensitivity of 75% (AUC 0.840)], (5) SUVmax of accessory spleens is linearily correlated with their volume.
68
Ga-labeled somatostatin analogue PET/CT is the mainstay for the evaluation of the somatostatin receptor
(SSTR) status of neuroendocrine tumors. Our results suggest a possible new indication for the use of 68Ga-DOTA-
peptide PET/CT in clinical routine, confirming the ability of 68Ga-DOTATATE PET/CT to distinguish IPAS and
pNET. This finding may obviate additional imaging studies (as Tc-99m-labeled colloids or Tc-99m-HDRBC) in
some cases and prevent unnecessary biopsy and/or surgery in cases of intrapancreatic accessory spleens.
Moreover, the impact of reconstruction algorithms is one of the most relevant factors on the use of absolute
quantitative methods for PET/CT. In a recent phantom study, Lantos et al. find that BSREM can outperform
OSEM in terms of contrast recovery and organ uniformity for several PET tracers, included 18F-FDG and 68Ga-
DOTATATE44. Therefore, we evaluated both reconstruction algorithms (OSEM and BSREM with a default β-value
of 1000, selected based on previous studies) and assessed their impact on quantification.
Results of our study are in line with previously described findings, particularly with the phantom study by
Lantos et al.44. In our study, Bayesian penalized reconstruction data yielded slightly better results than OSEM dis-
tinguishing pNET from IPAS by SUVmax (p-value ≤ 0.034 for BSREM vs. ≤ 0.057 for OSEM) and for distinguish-
ing pNET from accessory spleens by SUVmax (p-value ≤ 0.014 for BSREM vs. ≤ 0.024 for OSEM). This finding
could be explained with the fact that the majority of well differentiated pNETs are characterized by significantly
higher somatostatin receptor expression compared to the physiological uptake in splenic tissue (ectopic or not).
Previous studies on BSREM reconstruction on lung c ancer31,45,46 showed that lesions with higher uptake tend to
converge faster than lesions with lower activity. The same holds true for our study, where BSREM reconstruction
lead to a greater difference between the SUVmax of pNET vs. accessory spleens and/or IPAS compared to OSEM.
Besides the image reconstruction algorithm, PET image quality may also be affected by respiratory motion,
leading to reduced quantitative accuracy and seemingly increased tumor/lesion volume (Fig. 4). This problem
affects particularly small lesions in the upper abdomen, such as accessory spleens, IPAS and p NET47–50.
In our study, DDG increased the ability of PET parameters (SUVmax and SUVmean) to discriminate pNET
from IPAS (SUVmax p-value ≤ 0.033) and/or accessory spleens (SUVmax p-value ≤ 0.002) both in BSREM and
OSEM reconstructions.
Furthermore, for all the lesions included in our study, DDG lead to a significant increase in SUVmax and
SUVmean, both with BSREM and OSEM reconstructions (all p-values ≤ 0.001), while a significant decrease in
PET volume was only found with OSEM reconstruction (p-value ≤ 0.001). These results are in line with a recent
study of Catalano et al.51. They stated that motion correction reconstructions reduce the effect of image blurring
that leads to an underestimation of radiotracer uptake and hence falsely low SUVmax and falsely increased PET
volume. This finding is important, because BSREM is still not widely available, and because DDG reconstruction
could be easily done off-line, also from raw data acquired on older systems. However, in other instances, where
motion blurring might be the dominant blurring factor, DDG might be more useful for BSREM compared to
OSEM.
These results outline the importance of using a motion correction method to optimize the outcome of PET
imaging. Besides DDG, other methods allow for motion correction, with the most common methods typically
relying on external devices for gating. However, their use is often hampered by a comparably complicated setup,
by technical problems and by time constraints.
The impact of different reconstruction algorithms with or without DDG is highlighted by the ROC results.
Our study has identified different SUVmax and SUVmean cut-off values for each reconstruction. Furthermore,
the benefits of both BSREM reconstruction (more accurate lesion quantitation and reduced background noise)
and motion-corrected data (reduced image blurring) yielded the best results in our study: The most accurate
SUVmax cut-off value (SUVmax 39.1, AUC 0.846, sensitivity 75% and specificity 100%) to discriminate pNET
vs. accessory spleens was achieved with BSREM-DDG.
Finally, our study reveals a positive linear correlation between SSTR2-positivity and the size of accessory
spleens, with larger accessory spleens exhibiting higher SUVmax. Even if this result was expected due to the
partial volume effect, the differences in SUVmax between different size of accessory spleens (diameter < 10 mm,
10–20 mm and > 20 mm respectively) highlighted in this study, has an important role to better distinguish IPAS
from pNET, according to the dimension of the pancreatic lesion under evaluation.
Scientific Reports | (2021) 11:2273 | https://doi.org/10.1038/s41598-020-80855-4 10
Vol:.(1234567890)www.nature.com/scientificreports/
In fact, IPAS are typically solid enhancing lesions of 1.1–2.5 cm in size, usually not exceeding 3 cm in size7–9.
In our study, the maximal diameter of IPAS on CT was 12.3 ± 0.5 mm, while the maximal diameter of accessory
spleens on CT was 13.5 ± 4.7 (6—31) mm (72% of accessory spleens were 10–20 mm in size). Therefore, the size
difference between IPAS and accessory spleens might partly explain the higher accuracy of SUVmax cut-offs for
discriminating pNET from accessory spleens compared to IPAS.
Although the SUVmax of larger IPAS may be in the range of the SUVmax of well differentiated pNETs, this
may not be so relevant in clinical routine, since IPAS-specific radiological characteristics are easily identified
in larger lesions (i.e. heterogeneous arterial contrast enhancement of the lesion at and same degree of venous
contrast enhancement of the s pleen52). On the other hand, the assessment of a pancreatic incidentaloma in the
pancreatic tail is more challenging with smaller lesions. Moreover, in the last years the incidental discovery of
pancreatic incidentalomas increased owing to technology advancement as outlined by Vagefi et al. (from 2002
to 2007, 60.4% vs. 40.3% in previous years; mean diameter 42 mm vs. 56 mm in previous y ears53).
In conclusion, an SUVmax > 42 identifies a lesion as pNET with a specificity of 100%, regardless of the recon-
struction technique used.
Some limitations of our study are acknowledged. First, the comparably small sample size may have affected
our results. Multicenter studies might contribute data from other PET/CT scanners, amplifying the sample size.
However, careful scanner harmonization is a prerequisite for this purpose. Second, owing to the retrospective
design and also owing to ethical considerations, there was no histological standard of reference for accessory
spleens. Instead, morphological imaging characteristics, stability over years and absence of abdominal neuroen-
docrine tumor history was used, which is a reasonable approach in our opinion. However, histopathology served
as standard of reference for all pNETs in our study. Our study used an R-value threshold of 10 for DDG, and a
β-value of 1000 for BSREM. Therefore, results of our study are limited to these parameter settings, and other
settings might yield slightly different results. However, the thrust of our finding (higher SUV with BSREM and
with DDG) is expected to be preserved.
Conclusion
An SUVmax > 42 identifies a pNET with a specificity of 100%, regardless of the reconstruction technique used.
DDG-based motion correction increases the ability of PET/CT parameters to discriminate IPAS/accessory
spleens from pNET. DDG-based motion correction is beneficial particularly for the assessment of small lesions
that are subject to respiratory motion, also in the upper abdomen. BSREM1000 leads to a significant increase of
SUV parameters compared to OSEM, while DDG leads to a significant increase of SUV parameters and reduced
PET volume compared to reconstructions without DDG. Hence, SUV cut-off values need to be adapted to dif-
ferent reconstruction settings.
Data availability
The datasets used and/or analyzed during the current study are available from the corresponding author on
reasonable request.
Received: 10 September 2020; Accepted: 29 December 2020
References
1. Freeman, J. L., Jafri, S. Z., Roberts, J. L., Mezwa, D. G. & Shirkhoda, A. CT of congenital and acquired abnormalities of the spleen.
Radiographics 13, 597–610 (1993).
2. Varga, I., Babala, J. & Kachlik, D. Anatomic variations of the spleen: Current state of terminology, classification, and embryological
background. Surg. Radiol. Anat. 40, 21–29 (2018).
3. Halpert, B. & Gyorkey, F. Lesions observed in accessory spleens of 311 patients. Am. J. Clin. Pathol. 32, 165–168 (1959).
4. Eraklis, A. J. & Filler, R. M. Splenectomy in childhood: A review of 1413 cases. J. Pediatr. Surg. 7, 382–388 (1972).
5. Mortelé, K. J., Mortelé, B. & Silverman, S. G. CT features of the accessory spleen. Am. J. Roentgenol. 183, 1653–1657 (2004).
6. Yildiz, A. E., Ariyurek, M. O. & Karcaaltincaba, M. Splenic anomalies of shape, size, and location: Pictorial essay. Sci. World J.
2013, 1–9 (2013).
7. Halpert, B. & Gyorkey, F. Accessory spleen in the tail of the pancreas. A. M. A. Arch. Pathol. 64, 266–269 (1957).
8. Kim, S. H. et al. MDCT and superparamagnetic iron oxide (SPIO)-enhanced MR findings of intrapancreatic accessory spleen in
seven patients. Eur. Radiol. 16, 1887–1897 (2006).
9. Kawamoto, S. et al. Intrapancreatic accessory spleen: CT appearance and differential diagnosis. Abdom. Imaging 37, 812–827
(2012).
10. Hamada, T. et al. Laparoscopic spleen-preserving pancreatic tail resection for an intrapancreatic accessory spleen mimicking a
nonfunctioning endocrine tumor: Report of a case. Surg. Today 34, 878–881 (2004).
11. Brasca, L. E. et al. Intrapancreatic accessory spleen mimicking a neuroendocrine tumor: Magnetic resonance findings and possible
diagnostic role of different nuclear medicine tests [3]. Eur. Radiol. 14, 1322–1323 (2004).
12. Ota, T. et al. Intrapancreatic accessory spleen diagnosed by technetium-99m heat-damaged red blood cell SPECT. J. Nucl. Med.
38, 494–495 (1997).
13. Lancellotti, F. et al. Intrapancreatic accessory spleen false positive to 68Ga-Dotatoc: Case report and literature review. World J.
Surg. Oncol. 17, 1–7 (2019).
14. Prasad, V. & Baum, R. P. Biodistribution of the Ga-68 labeled somatostatin analogue DOTA-NOC in patients with neuroendocrine
tumors: Characterization of uptake in normal organs and tumor lesions. Q. J. Nucl. Med. Mol. Imaging 54, 61–67 (2010).
15. Se, H. K. et al. Intrapancreatic accessory spleen: Findings on MR imaging, CT, US and scintigraphy, and the pathologic analysis.
Korean J. Radiol. 9, 162–174 (2008).
16. Rashid, S. A. Accessory spleen: Prevalence and multidetector CT appearance. Malaysian J. Med. Sci. 21, 18–23 (2014).
17. Takesh, M., Zechmann, C. M., Kratochwil, C., Sahli, H. & Zein, M. Positive somatostatin receptor scintigraphy in accessory spleen
mimicking recurrent neuroendocrine tumor. Radiol. Case Rep. 6, 513 (2011).
18. Bostanci, E. B. et al. Intra-pancreatic accessory spleen mimicking pancreatic neuroendocrine tumor on 68-ga-dotatate PET/CT.
Arch. Iran. Med. 19, 816–819 (2016).
Scientific Reports | (2021) 11:2273 | https://doi.org/10.1038/s41598-020-80855-4 11
Vol.:(0123456789)www.nature.com/scientificreports/
19. Barber, T. W., Dixon, A., Smith, M., Yap, K. S. K. & Kalff, V. Ga-68 octreotate PET/CT and Tc-99m heat-denatured red blood cell
SPECT/CT imaging of an intrapancreatic accessory spleen. J. Med. Imaging Radiat. Oncol. 60, 227–229 (2016).
20. Mansor, S. et al. Impact of PET/CT system, reconstruction protocol, data analysis method, and repositioning on PET/CT precision:
An experimental evaluation using an oncology and brain phantom: An. Med. Phys. 44, 6413–6424 (2017).
21. Boellaard, R. et al. FDG PET/CT: EANM procedure guidelines for tumour imaging: Version 2.0. Eur. J. Nucl. Med. Mol. Imaging
42, 328–354 (2015).
22. Rubello, D. & Colletti, P. M. SUV harmonization between different hybrid PET/CT systems. Clin. Nucl. Med. 43, 811–814 (2018).
23. Boellaard, R. Standards for PET image acquisition and quantitative data analysis. J. Nucl. Med. 50, 11S-20S (2009).
24. Tsoumpas, C., Turkheimer, F. E. & Thielemans, K. Study of direct and indirect parametric estimation methods of linear models in
dynamic positron emission tomography. Med. Phys. 35, 1299–1309 (2008).
25. Adams, M. C., Turkington, T. G., Wilson, J. M. & Wong, T. Z. A systematic review of the factors affecting accuracy of SUV meas-
urements. Am. J. Roentgenol. 195, 310–320 (2010).
26. Tong, S., Alessio, A. M. & Kinahan, P. E. Image reconstruction for PET/CT scanners: Past achievements and future challenges.
Imaging Med. 2, 529–545 (2010).
27. Ahn, S. & Fessler, J. A. Globally convergent image reconstruction for emission tomography using relaxed ordered subsets algo-
rithms. IEEE Trans. Med. Imaging 22, 613–626 (2003).
28. Schwyzer, M. et al. Automated detection of lung cancer at ultralow dose PET/CT by deep neural networks – Initial results. Lung
Cancer 126, 170–173 (2018).
29. Aljared, A., Alharbi, A. A. & Huellner, M. W. BSREM reconstruction for improved detection of in-transit metastases with digital
FDG-PET/CT in patients with malignant melanoma. Clin. Nucl. Med. 43, 370–371 (2018).
30. Sah, B. R. et al. Clinical evaluation of a block sequential regularized expectation maximization reconstruction algorithm in 18F-
FDG PET/CT studies. Nucl. Med. Commun. 38, 57–66 (2017).
31. Teoh, E. J. et al. Novel penalised likelihood reconstruction of PET in the assessment of histologically verified small pulmonary
nodules. Eur. Radiol. 26, 576–584 (2016).
32. Lindström, E. et al. Evaluation of penalized-likelihood estimation reconstruction on a digital time-of-flight PET/CT scanner for
18 F-FDG whole-body examinations. J. Nucl. Med. 59, 1152–1158 (2018).
33. Lindström, E. et al. Regularized reconstruction of digital time-of-flight 68Ga-PSMA-11 PET/CT for the detection of recurrent
disease in prostate cancer patients. Theranostics 9, 3476–3484 (2019).
34. Thielemans, K., Rathore, S., Engbrant, F. & Razifar, P. Device-less gating for PET/CT using PCA. In IEEE Nuclear Science Sympo-
sium Conference Record 3904–3910 (Institute of Electrical and Electronics Engineers Inc., 2011). https://doi.org/10.1109/NSSMI
C.2011.6153742.
35. Thielemans, K. et al. Comparison of different methods for data-driven respiratory gating of PET data. In IEEE Nuclear Sci-
ence Symposium Conference Record (Institute of Electrical and Electronics Engineers Inc., 2013). https://doi.org/10.1109/NSSMI
C.2013.6829055.
36. Walker, M. D., Bradley, K. M. & McGowan, D. R. Evaluation of principal component analysis-based data-driven respiratory gating
for positron emission tomography. Br. J. Radiol. 91, 20170793 (2018).
37. Walker, M. D., Morgan, A. J., Bradley, K. M. & McGowan, D. R. Evaluation of data-driven respiratory gating waveforms for clinical
PET imaging. EJNMMI Res. 9, 1 (2019).
38. Khamis H, W. S. MotionFree: Device-less digital respiratory gating technique, seamlessly integrated in PET imaging routine. Gen.
Electr. Co.
39. IBM Corp. Released 2017. IBM SPSS Statistics for Windows, Version 25.0. Armonk, NY: IBM Corp.
40. Minitab 19 Statistical Software (2018). [Computer software]. State Collage, PA; Minitab, Inc. (www.minitab.com). https://www.
minitab.com/en-us/.
41. Hanley, J. A. Receiver operating characteristic (ROC) methodology: The state of the art. Crit. Rev. Diagn. Imaging 29, 307–335
(1989).
42. Hofland, J., Zandee, W. T. & de Herder, W. W. Role of biomarker tests for diagnosis of neuroendocrine tumours. Nat. Rev. Endo-
crinol. 14, 656–669 (2018).
43. Chan, D. L. H. et al. Dual somatostatin receptor/FDG PET/CT imaging in metastatic neuroendocrine tumours: Proposal for a
novel grading scheme with prognostic significance. Theranostics 7, 1149–1158 (2017).
44. Lantos, J., Mittra, E. S., Levin, C. S. & Iagaru, A. Standard OSEM vs. regularized PET image reconstruction: Qualitative and quan-
titative comparison using phantom data and various clinical radiopharmaceuticals. Am. J. Nucl. Med. Mol. Imaging 8, 110–118
(2018).
45. Messerli, M. et al. Impact of different image reconstructions on PET quantification in non-small cell lung cancer: A comparison
of adenocarcinoma and squamous cell carcinoma. Br. J. Radiol. 92, 20180792 (2019).
46. Messerli, M. et al. Impact of a Bayesian penalized likelihood reconstruction algorithm on image quality in novel digital PET/CT:
Clinical implications for the assessment of lung tumors. EJNMMI Phys. 5, 27 (2018).
47. Brandner, E. D. et al. Abdominal organ motion measured using 4D CT. Int. J. Radiat. Oncol. Biol. Phys. 65, 554–560 (2006).
48. De Ponti, E. et al. Motion management in PET/CT: Technological solutions. Curr. Radiopharm. 11, 79–85 (2018).
49. Guerra, L., Ponti, E. De, Morzenti, S., Spadavecchia, C. & Crivellaro, C. Respiratory motion management in PET/CT: Applications
and clinical usefulness. Curr. Radiopharm. 10(2), 85–92 (2017).
50. Kesner, A., Schmidtlein, C. R. & Kuntner, C. Real-time data-driven motion correction in PET. EJNMMI Phys. 6, 3 (2019).
51. Catalano, O. A. et al. Comparison of the clinical performance of upper abdominal PET/DCE-MRI with and without concurrent
respiratory motion correction (MoCo). Eur. J. Nucl. Med. Mol. Imaging 45, 2147–2154 (2018).
52. Coquia, S. F. et al. Intrapancreatic accessory spleen: Possibilities of computed tomography in differentiation from nonfunctioning
pancreatic neuroendocrine tumor. J. Comput. Assist. Tomogr. 38, 874–878 (2014).
53. Vagefi, P. A. et al. Evolving patterns in the detection and outcomes of pancreatic neuroendocrine neoplasms: The Massachusetts
General Hospital experience from 1977 to 2005. Arch. Surg. 142, 347–353 (2007).
Acknowledgements
Virginia Liberini received a 3 months fellowship (“ENETS CoE Training Fellowship Grant”) in the Department
of Nuclear Medicine, University Hospital Zurich, University of Zurich, Switzerland, funded by the European
Neuroendocrine Tumor Society (ENETS). We thank Josephine Trinckauf for her excellent technical support.
Author contributions
M.W.H. designed the study, V.L. and M.W.H. reviewed the PET/CT scans, V.L. collected the data and conducted
the statistical analysis, M.W.H. and F.K. contributed in the reviewed the data and the statistical analysis, V.L.,
F.K. and M.W.H. wrote the manuscript, V.T., M.M., E.O., I.E. and A.S. discussed the results and commented on
the manuscript. All authors read and approved the final manuscript.
Scientific Reports | (2021) 11:2273 | https://doi.org/10.1038/s41598-020-80855-4 12
Vol:.(1234567890)www.nature.com/scientificreports/
Funding
The University Hospital Zurich holds a research agreement with GE Healthcare (unrelated to the current study).
MWH is a recipient of grants for translational and clinical cardiac and oncological research from the Alfred and
Annemarie von Sick Grant legacy, and grants from the Artificial Intelligence in oncological Imaging Network
by the University of Zurich. No further specific grants from funding agencies in the public, commercial, or not-
for-profit sectors were received for this study.
Competing interests
FK is an employee of GE Healthcare. MWH is a recipient of speaker’s fees and grants from GE Healthcare. Apart
from that, the other authors of this manuscript declare no relationship with any companies, whose products or
services may be related to the subject matter of the article. Only non-GE employees had control of inclusion
of data and information that might present a conflict of interest for those authors who are employees of GE
Healthcare.
Additional information
Correspondence and requests for materials should be addressed to V.L.
Reprints and permissions information is available at www.nature.com/reprints.
Publisher’s note Springer Nature remains neutral with regard to jurisdictional claims in published maps and
institutional affiliations.
Open Access This article is licensed under a Creative Commons Attribution 4.0 International
License, which permits use, sharing, adaptation, distribution and reproduction in any medium or
format, as long as you give appropriate credit to the original author(s) and the source, provide a link to the
Creative Commons licence, and indicate if changes were made. The images or other third party material in this
article are included in the article’s Creative Commons licence, unless indicated otherwise in a credit line to the
material. If material is not included in the article’s Creative Commons licence and your intended use is not
permitted by statutory regulation or exceeds the permitted use, you will need to obtain permission directly from
the copyright holder. To view a copy of this licence, visit http://creativecommons.org/licenses/by/4.0/.
© The Author(s) 2021
Scientific Reports | (2021) 11:2273 | https://doi.org/10.1038/s41598-020-80855-4 13
Vol.:(0123456789)You can also read