Changes on proteomic and metabolomic profile in serum of mice induced by chronic exposure to tramadol - Nature
←
→
Page content transcription
If your browser does not render page correctly, please read the page content below
www.nature.com/scientificreports
OPEN Changes on proteomic
and metabolomic profile in serum
of mice induced by chronic
exposure to tramadol
Shukun Jiang1,4, Guojie Liu2,4, Huiya Yuan1, Enyu Xu1, Wei Xia1, Xiaoyu Zhang3, Junting Liu1 &
Lina Gao1*
Tramadol is an opioid used as an analgesic for treating moderate or severe pain. The long-term use
of tramadol can induce several adverse effects. The toxicological mechanism of tramadol abuse is
unclear. Limited literature available indicates the change of proteomic profile after chronic exposure
to tramadol. In this study, we analyzed the proteomic and metabolomic profile by TMT-labeled
quantitative proteomics and untargeted metabolomics between the tramadol and the control group.
Proteomic analysis revealed 31 differential expressed serum proteins (9 increased and 22 decreased)
in tramadol-treated mice (oral, 50 mg/kg, 5 weeks) as compared with the control ones. Bioinformatics
analysis showed that the dysregulated proteins mainly included: enzyme inhibitor-associated proteins
(i.e. apolipoprotein C-III (Apoc-III), alpha-1-antitrypsin 1–2 (Serpina 1b), apolipoprotein C-II (Apoc-II),
plasma protease C1 inhibitor, inter-alpha-trypsin inhibitor heavy chain H3 (itih3)); mitochondria-
related proteins (i.e. 14-3-3 protein zeta/delta (YWHAZ)); cytoskeleton proteins (i.e. tubulin alpha-4A
chain (TUBA4A), vinculin (Vcl)). And we found that the differential expressed proteins mainly
involved in the pathway of the protein digestion and absorption. Metabolomics analysis revealed
that differential expressed metabolites mainly involved in protein ingestion and absorption, fatty
acid biosynthesis, steroid hormone biosynthesis and bile secretion. Our overall findings revealed that
chronic exposure to tramadol changed the proteomic and metabolomic profile of mice. Moreover,
integrated proteomic and metabolomic revealed that the protein digestion and absorption is the
common enrichment KEGG pathway. Thus, the combination of proteomics and metabolomics opens
new avenues for the research of the molecular mechanisms of tramadol toxicity.
Tramadol is a central analgesic drug and a low-affinity opioid receptor agonist, which is often used for the treat-
ment of moderate to severe pain1,2. Tramadol is metabolized into O-demethyltramadol and N-demethyltramadol,
of which O-demethyltramadol has stronger pharmacological activity than the original drug3. Tramadol has
analgesic and other functions by acting in two ways: O-demethylated metabolites with bio activity, and the
synergistic effects of opioid and non-opioid m echanisms4.
Although tramadol has been an effective and well-tolerated agent for the management of moderately several
acute or chronic pain3, its adverse effects have always been a concern for researchers. The untoward effects of
tramadol include confusion, dizziness, seizures, drowsiness, and respiratory depression4,5. Especially after a
long period of high doses of tramadol, more severe side effects include angioedema, the increased effect of anti-
coagulants, hypoglycemia6,7 and serotonin toxicity1. Some literature revealed that opioids abuse may result in
structural changes and apoptosis of neurons8,9. Zhou had pointed out that chronic exposure to tramadol could
induce toxic effect to the neurotransmitters of z ebrafish10. Mohamed reported that chronic exposure to tramadol
induced oxidative damage, inflammation, and apoptosis on the cerebrum of rats4. To the best of our knowledge,
some literature have revealed that chronic tramadol administration is related to the provoking production of
reactive oxygen species (ROS)11–13.
1
School of Forensic Medicine, China Medical University, No. 77, Puhe Road, Shenyang North New Area,
Shenyang 110122, Liaoning Province, People’s Republic of China. 2School of Fundamental Sciences, China Medical
University, Shenyang 110014, People’s Republic of China. 3Jacobs University, 28759 Bremen, Germany. 4These
authors contributed equally: Shukun Jiang and Guojie Liu. *email: lngao@cmu.edu.cn
Scientific Reports | (2021) 11:1454 | https://doi.org/10.1038/s41598-021-81109-7 1
Vol.:(0123456789)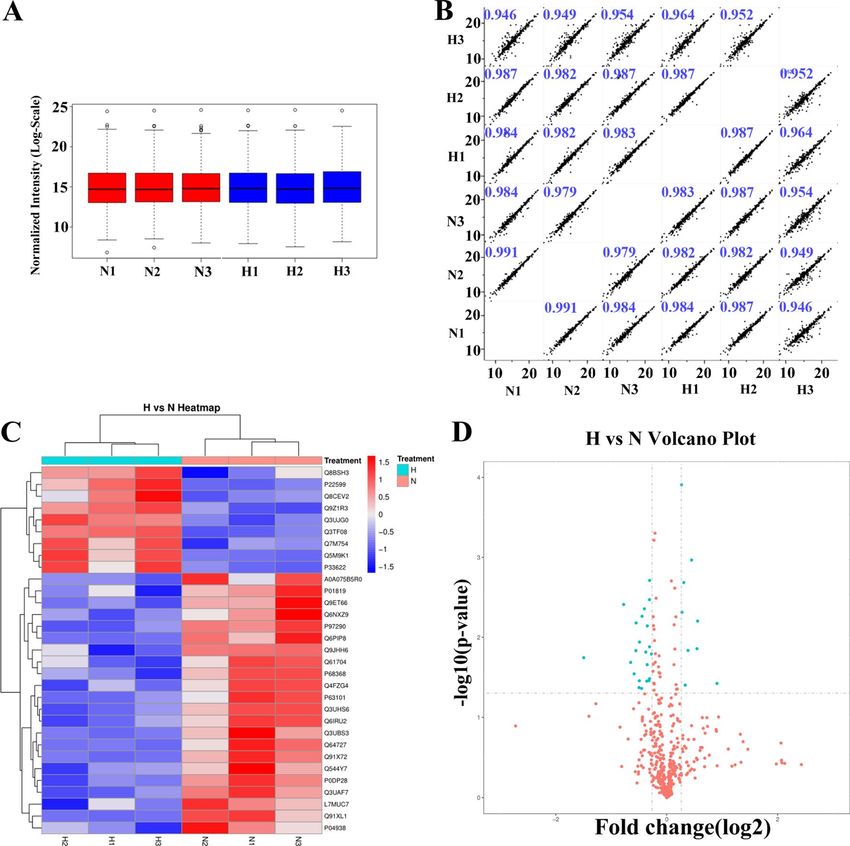
www.nature.com/scientificreports/
Metabolomics and proteomics, as components of systems biology, help to analyze the tramadol toxic mecha-
nism from the perspective of organism integrity14,15. Moreover, the advent of advanced quantitative proteom-
ics techniques allows the systematic study of changes in the expression profile of proteins that are static or
perturbed15,16.
Although brain tissues are the best samples for laboratory research on central nervous system disorders such
as addiction, blood can be collected much more easily and at much lower r isks17. Importantly, it contains nearly
the entire proteome of the human b ody17. Moreover, the effects of long term exposure to tramadol on protein
and metabolite in serum has not been known.To mimic the long exposure to tramadol, mice were exposed to
50 mg/kg level of tramadol for 35 days. Blood plasma was then used for tandem mass tags (TMT) quantitative
proteomics and untargeted metabolomics. In the present study, we aim to observe the proteomic and metabo-
lomic profile to provide the fundamental for the tramadol toxicity in serum.
Materials and methods
Chemical reagents. Tramadol was purchased from Shanghai Macklin Biotechnology Co., Ltd. (Shanghai,
China). LC–MS/MS testing was conducted by Shanghai Bioprofile Technology Co. Ltd. Mouse Tubulin Alpha
4A (TUBa4A) ELISA kit, mouse Vinculin (Vcl) ELISA kit, mouse Inter-alpha-trypsin inhibitor heavy chain H3
(itih3) ELISA kit, Mouse Alpha-1-antitrypsin 1–2 (Serpina1b) ELISA kit, Mouse Transthyretin (Ttr) ELISA kit,
Mouse Haptoglobin (Hp) ELISA kit, Mouse Retinol-binding protein 4 (RBP-4) ELISA kit, Mouse Apolipopro-
tein C-III (ApocIII) ELISA kit, Mouse Plasma protease C1 inhibitor (Serping) ELISA kit, Mouse Carboxypepti-
dase B2 (CPB2) ELISA kit, Mouse 14-3-3 protein zeta/delta (YWHAZ) ELISA kit, and Mouse Hemopexin (Hpx)
ELISA kits were purchased from Shanghai Enzyme-linked Biotechnology Co., Ltd. (Shanghai, China).
Animal treatment and sample collection. 16 km male mice (6 weeks old, 35 ± 5 g, Laboratory Animal
Centre of China Medical University) were used in the studies. The mice were randomly assigned to a tramadol
group (H group, 8 mice) or control group (N group, eight mice) and were housed in a controlled environment
(20–22 °C; 12-h light:dark on a reversed light cycle) for 1 week before the studies. Mice had unlimited access
to water and food in their home cages. Mice received physiological saline (20 mL/kg) or tramadol (2.5 mg/
mL) via oral gavage daily (50 mg/kg/day) for 35 days in group. Mice were fasted for 24 h and anesthetized by
intraperitoneal injection with pentobarbital prior to blood collection. Heart blood of each mouse was collected
and centrifuged at 3000 rpm for 15 min at 4 °C to obtain the serum, for proteomics and metabolomics analysis.
Serum proteomics analysis. Protein extraction. Approximately 100 μL of serum was taken from each
sample group (the tramadol group and the control group), which was then added into 600 μL 8 M urea. Subse-
quently, sonicated, and the supernatant was extracted after centrifugation at 20,000 × g for 15 min at 4 ℃. Protein
quantification was performed using the bicinchonic acid assay. About 15 μg of protein was obtained from the
two different groups for SDS-PAGE analysis to evaluate the quantitative accuracy and quantify protein extrac-
tion.
Protein digestion and peptide desalination. 300 μg of sample from each group was taken for protein digestion.
DTT was added into the protein sample, and the final concentration was 100 mM. Bathe in boiling water for
5 min and cool to room temperature. After adding 200 μL of urea (UA) buffer (8 M UA and 150 mM Tris–HCl,
pH 8.0), the samples were loaded on a 10 kDa ultra filtration centrifuge tube, followed by centrifugation at
12,000g for 15 min, and the filtrate was discarded (this step was repeated once). Subsequently, samples and
100 μL of iodoacetamide alkylation (IAA) (50 mm IAA in UA) were shaken for 1 min at 600 RPM, then were
placed in a centrifuge at 12,000g × 10 min after 30 min at room temperature in the dark. Next, another 100 μL
UA buffer was added, and the sample was centrifuged at 12,000g × 10 min. We repeated the process twice. This
was followed by a 100 μL 100 mm N H4HCO3 buffer (Sigma), which was centrifuged at 14,000g for 10 min. We
repeated the process twice. Next, 40 μL of trypsin buffer (6 µg trypsin in 40 µL NH4HCO3 buffer) were added
into the sample. The sample was shaken at 600 RPM for 1 min and incubated at 37 °C for 16–18 h. The collection
tube was replaced and then centrifuged for 10 min at 12,000g. The filtrate was collected and an amount of 0.1%
trifluoroacetic acid (TFA) solution was added, followed by desalination in a C18 Cartridge (Sigma-Aldrich) and
OD280 peptide quantification. Finally, approximately 150–180 µg peptides were collected.
TMT peptide labeling, fractionation and LC–MS/MS analysis. This part of the content was operated according
to the method reported by Zhang18, and the specific method parameters are shown in “Supplement file”. The
schematic for the TMT-labeling strategy used for the samples as shown in Supplementary Fig. 1.
Database search and protein quantification. Database search is similar with the method reported by Zhang18,
the specific method parameters are shown in “Supplement file”. False discovery rate (FDR) for peptide and pro-
tein identification was set to 1%. The TMT reporter ion intensity was applied for quantification. The relative
quantitative protein analysis of samples was performed using MaxQuant algorithms (http://www.maxquant.org,
VERSION 1.6.0.16)19. The mass spectrometry proteomics data have been deposited to the ProteomeXchange
Consortium (http://proteomecentral.proteomexchange.org) via the iProX partner repository with the dataset
identifier PXD01923320.
Bioinformatics analysis. Analyses of bioinformatics data were obtained by the Perseus software program21,
Microsoft Excel, and R statistical computing software. Differential expressed proteins (DEPs) were screened in
Scientific Reports | (2021) 11:1454 | https://doi.org/10.1038/s41598-021-81109-7 2
Vol:.(1234567890)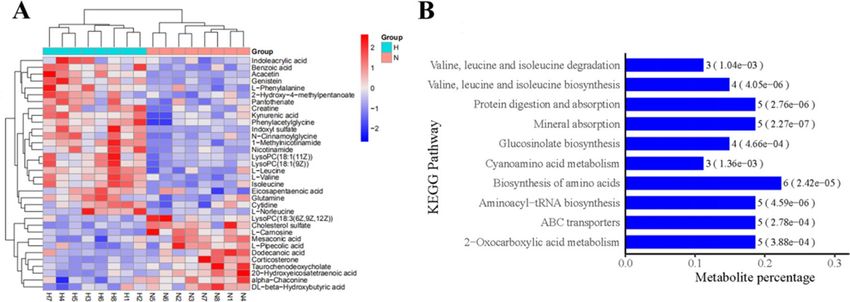
www.nature.com/scientificreports/
the tramadol group and the control group, with the cut-off of ratio fold change of > 1.20 or < 0.83 in expression
and P values < 0.05. In addition, DEPs in the tramadol group vs. the control groups were identified using stu-
dent’s T-Test. The proteins with significant difference (FDR q < 0.01) were clustered by Hierarchical cluster anal-
ysis (Euclidean distance). Information was extracted from UniProtKB/Swiss-Prot, Kyoto Encyclopedia of Genes
and genome (KEGG) and Gene Ontology (GO) for functional enrichment analysis of identified proteins22,23.
Fisher’s exact test was used for GO and KEGG enrichment analysis, and Benjamini–Hochberg false discovery
rate (BH-FDR) correction for multiple tests was obtained. The term GO could be divided into three categories:
biological process (BP), cellular component (CC), and molecular function (MF)24. The construction of PPI net-
works was also performed by the STRING database with the Cytoscape software p rogram25.
Untargeted metabolomics analysis. Metabolite extraction. 100 μL of water and 800 μL of methanol/
acetonitrile (1:1, v/v) were added for each sample (100 μL). Ultrasound was performed at low temperature for
30 min, twice, incubated at − 20 ℃ for 1 h, and centrifuged at 4 ℃ at 13,000 RPM for 15 min, the supernatant
was taken for freeze-drying and stored at − 80 ℃ for later use. During mass spectrometry, 100 μL acetonitrile
solution was added (acetonitrile: water = 1:1, v/v) was redissolved, vortex oscillated, centrifuged at 14,000g at 4 ℃
for 15 min, and the supernatant was injected into the LC–MS/MS system analysis.
Sample analysis and data preprocessing. This part was shown in “Supplement file”. The data preprocessing was
performed according to the method reported by G ao26. The resulting matrix was imported into SIMCA-P (ver-
sion 13.0, Umetrics, Sweden) for unsupervised principal component analysis (PCA) and orthogonal partial least
square discriminant analysis (OPLS-DA)after mean centering and unit variance scaling. We applied uni-variate
analysis (t-test) to calculate statistical significance (P-value). Metabolites with variable importance in the project
(VIP) > 1, P-value < 0.05 were considered differential metabolites. Metabolites of interest were filtered based on
values of VIP, |log2FC| > 1 (FC > 2 or FC < 0.5 and P-value < 0.05). Volcano plots were utilized to illustrate the
distribution of differential metabolites.For clustering heat maps, data were normalized using z-scores of the
intensity areas of differential metabolites and were plotted using the R package27 “pheatmap”.
Data quality evaluation in untargeted metabolomics analysis. Quality control samples (QCs) were obtained by
pooling equal aliquots of each serum sample. QC samples are used to balance the chromatography-mass spec-
trometry system, to determine the state of the instrument, and to evaluate the stability of the system throughout
the experiment. After mixing thoroughly, the QCs were analyzed consistently with real samples. Before the
batch analysis, five QCs were first tested to stabilize the analytical system, and the acquired data were removed
before data processing. All QCs were inserted randomly through the analytical batch to monitor the robustness
of sample preparation and the stability of instrument analysis.
Elisa. Carboxypeptidase B2 (CPB2), inter-alpha-trypsin inhibitor heavy chain H3 (Itih3), Alpha-1-anti-
trypsin1-2 (Serpina1b), plasma protease C1 inhibitor (serping), Tubulin alpha-4A chain (Tuba4a), Vinculin
(Vcl) and apolipoprotein c-III (ApocIII), haptoglobin (Hp), Transthyretin (Ttr), Retinol-binding protein 4(RBP-
4), 14-3-3 protein zeta/delta (YWHAZ), and Hemopexin (Hpx) Elisa kits were used to analyze the serum of
ApocIII, Ttr, RBP-4,TUBa4A, Serpina1b, Vcl, Hp,YWHAZ, Hpx, CPB2, Itih3 and serping level following the
manufacture’s instruction.
Statistical analysis. The levels of ApocIII, Ttr, RBP-4, TUBa4A, Serpina1b, Vcl, Hp, YWHAZ, Hpx, CPB2,
Itih3 and serping were present as mean ± standard deviation (SD) and analyzed by SPSS 26.0 (SPSS Inc., Chicago,
USA). The student’s T-test was used and P < 0.05 was considered statistically significant.
Ethics approval. All experimental procedures were conducted in accordance with the guidelines of the
animal care institution and approved by the laboratory animal management committee of China Medical Uni-
versity (2019288).
Results
Proteomics results. Information on proteome data was derived as follows: number of peptide-spectral
matches (i.e., several spectra hits for the same peptide), unique peptide number, protein groups, and quantified
proteins, which were 13,776, 2557, 469, and 443, respectively. All quantified proteins were shown in Table 1S. A
boxplot of normalized density is shown in Fig. 1A. In addition, pairwise Pearson’s correlation coefficients from
all six samples (3 replicates × 2 groups) were used to assess the relative quantitative reproducibility of the proteins
and the results showed high reproducibility (R > 0.94) (Fig. 1B).
Total of 31 differential expressed proteins (DEPs) were found, of which nine proteins were up-regulated and
22 proteins were down-regulated, as shown in Fig. 1C,D and Table 1.
All DEPs were classified into different Gene Ontology (GO) terms, biological process (BP), cell component
(CC) and molecular function (MF) (Fig. 2A).
The top GO terms for BP enriched by DEPs in H group vs. N group were the regulation of proteolysis. The
prominent GO CC categories that were enriched by these proteins included the extracellular region. The DEPs
were associated with structural constituents of the cytoskeleton, actin filament binding, enzyme regulator activ-
ity, and structural molecule activity. In the PPI network of the DEPs, proteins such as Cpb2 (down-regulated),
HpX (down-regulated), Itih3 (down-regulated), Serpina1b (up-regulated), serping1(down-regulated), Apom
(up-regulated), Tuba4a (down-regulated), Vcl (down-regulated) and ApocIII (up-regulated) were mainly take
Scientific Reports | (2021) 11:1454 | https://doi.org/10.1038/s41598-021-81109-7 3
Vol.:(0123456789)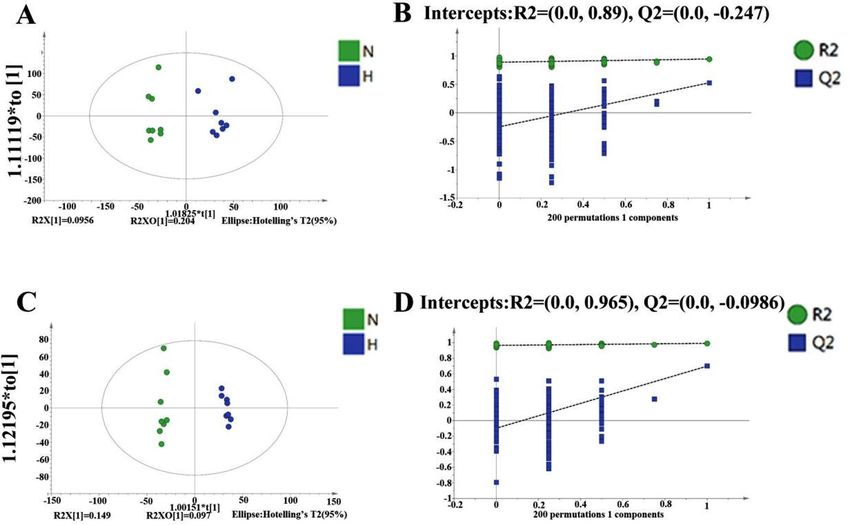
www.nature.com/scientificreports/
Figure 1. Volcano plots and heatmaps of proteins with differential expression between the tramadol group
and the control group. (A) Boxplot of normalized density. (B) Pearson’s correlation of normalized densities; (C)
Cluster analyses of the control group and the tramadol group (blue represents dysregulated, gray means that
there is no distinguished difference between the tramadol group and the control group); (D) Volcano plots and
heatmaps of proteins with differential expression (FC > 1.2or FC < 0.833, P value < 0.05).
part in the following KEGG pathways: protein digestion and absorption, the peroxisome proliferator-activated
receptor (PPAR) signaling pathway, cardiac muscle contraction and adherens junctions (Fig. 2).
Some feature of DEPs’ changes were similar to other toxicological studies of the substance subject to abuse
(Table 2)10,17,28–33.
While the expression level of ApocIII, Ttr, RBP-4 and TUBa4A was up-regulated, the expression level of
Serpina1b, Vcl, Hp, YWHAZ, Hpx, CPB2, Itih3 and serping were down-regulated by Elisa (Fig. 3).
Metabolomics results. The results of QC control data showed that the response strength and retention
time of each chromatographic peak overlapped basically. The Pearson’s correlation coefficient among QC sam-
ples was calculated based on the peak area value and showed that the variation caused by instrument error is
small and the data quality is reliable (Supplementary Fig. 3).
There are 29 differential expressed metabolites (DEMs) between the H and N group (Fig. 4 and Table 3).
The PCA results of all groups did not show a satisfactory separation of data between the tramadol exposure
group and the control group, that was shown in Supplementary Fig. 4. The variance ( R2) and model predictability
(Q2) for the OPLS-DA were calculated to be 0.992 and 0.699 under negative mode, and R 2 and Q2 for the OPLS-
DA were calculated to be 0.947 and 0.529 under positive mode. In conclusion, the model had good reliability
and predictability as shown in Fig. 5.
Scientific Reports | (2021) 11:1454 | https://doi.org/10.1038/s41598-021-81109-7 4
Vol:.(1234567890)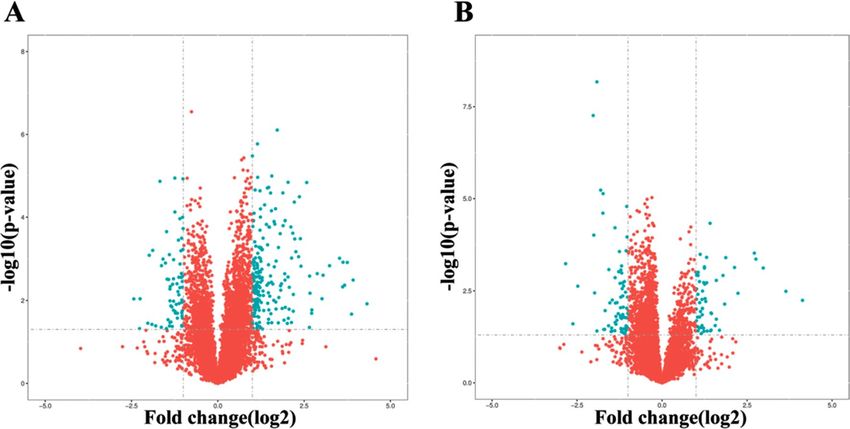
www.nature.com/scientificreports/

Identified protein names                                   Protein IDs    Score    FC            P            Molecular function
Glyceraldehyde-3-phosphate dehydrogenase                   Q8CEV2         13.161   1.873294763   0.03772571   Oxidative reductase activity
Apolipoprotein C-III                                       A0A0R4J1N3     323.31   1.305433615   0.01459075   Enzyme inhibitor activity
                                                                                                              Retinol transporter activity; lipid transporter activity; lipid
Retinol-binding protein 4                                  H7BWY6         323.31   1.202682984   0.00012348
                                                                                                              binding; retinol binding
Transthyretin                                              Q5M9K1         323.31   1.470107619   0.00626931   Thyroid hormone-binding protein
Alpha-1-antitrypsin 1-2                                    P22599         142      1.209979      0.00485745   Enzyme inhibitor activity; peptidase inhibitor activity
Tropomyosin alpha-1 chain                                  Q8BSH3         26.514   1.260379028   0.03965987   Structural constituent of cytoskeleton
                                                                                                              Enzyme activator activity; enzyme regulator activity;
Apolipoprotein C-II                                        Q3UJG0         7.7292   1.364705953   0.00107894
                                                                                                              molecular function regulator
Apolipoprotein M                                           Q9Z1R3         94.515   1.237485713   0.00206508   Antioxidant activity; anion binding
Tubulin alpha-4A chain                                     A0A0A0MQA5     7.6679   0.711702291   0.01147102   Structural constituent of cytoskeleton
                                                                                                              Cadherin binding; enzyme binding; ubiquitin protein ligase
14-3-3 protein zeta/delta                                  A0A2I3BQ03     33.122   0.637214709   0.02060388   binding; cell adhesion molecule binding; protein kinase
                                                                                                              binding
Cofilin-1; Cofilin-2                                       Q544Y7         24.855   0.801105533   0.03488061   Actin filament binding; cytoskeletal protein binding
                                                                                                              Transporter activity; transmembrane receptor protein tyros-
Major urinary protein 6; major urinary proteins 11 and 8   A2CEK7         20.781   0.710121107   0.03493991
                                                                                                              ine kinase activity; kinase activity
                                                                                                              Anion binding; carbohydrate derivative binding; purine
Actin, cytoplasmic 1                                       Q3UAF7         217.53   0.805697691   0.00338196
                                                                                                              ribonucleoside triphosphate binding; ATP binding
                                                                                                              Actin filament binding; actin binding; cytoskeletal protein
Filamin-A                                                  B7FAV1         90.22    0.783548733   0.02197410
                                                                                                              binding
Peptidase inhibitor 16                                     E9QNE5         115.97   0.8264383     0.01615836   Enzyme inhibitor activity; peptidase inhibitor activity
                                                                                                              Enzyme binding; phosphatidylinositol 3-kinase binding;
Calmodulin-like protein 3                                  P0DP28         217.53   0.583894819   0.00388330   glutamate receptor binding; calcium-dependent protein
                                                                                                              binding; G-protein coupled receptor binding
                                                                                                              Actin filament binding; structural constituent of cytoskel-
Talin-1                                                    Q3UHS6         54.399   0.734627417   0.00545763
                                                                                                              eton; cytoskeletal protein binding
Plasma protease C1 inhibitor                               P97290         103.99   0.807485012   0.00194138   Enzyme inhibitor activity; peptidase inhibitor activity
Haptoglobin                                                Q3UBS3         110.08   0.35444712    0.01797707   Hemoglobin binding; serine-type endopeptidase activity
Inter-alpha-trypsin inhibitor heavy chain H3               Q61704         183.26   0.806781264   0.03295815   Enzyme inhibitor activity; peptidase inhibitor activity
Vinculin                                                   Q64727         323.31   0.769615002   0.01528594   Actin filament binding; cytoskeletal protein binding
Tropomyosin alpha-4 chain                                  Q6IRU2         45.874   0.680481412   0.01468016   Actin filament binding; cytoskeletal protein binding
                                                                                                              Heme transporter activity; cofactor transporter activity;
Hemopexin                                                  Q91X72         323.31   0.756880662   0.00440384
                                                                                                              organic cyclic compound binding
                                                                                                              Zine ion binding; metallopeptidase activity; hydrolase
Carboxypeptidase B2                                        Q9JHH6         44.331   0.806708298   0.01316768
                                                                                                              activity

                                       Table 1.  The differential expression proteins in H vs N.

                                       Figure 2.  (A) Gene ontology (GO) term (including biological process, cellular component, and molecular
                                       function) enrichment for differential expressed proteins in the tramadol group and the control group. (B)
                                       Protein–protein interaction (PPI) networks of differential expressed proteins (DEPs) between the H and N
                                       group. Red nodes indicate up-regulated proteins and green nodes indicate down-regulated proteins. The
                                       rectangular node represents the KEGG pathway/biological process. The P-value is represented by a yellow-blue
                                       color gradient; the yellow color indicates a small P-value and the blue color indicates a large P-value.

Scientific Reports |        (2021) 11:1454 |                   https://doi.org/10.1038/s41598-021-81109-7                                                                       5

                                                                                                                                                                        Vol.:(0123456789)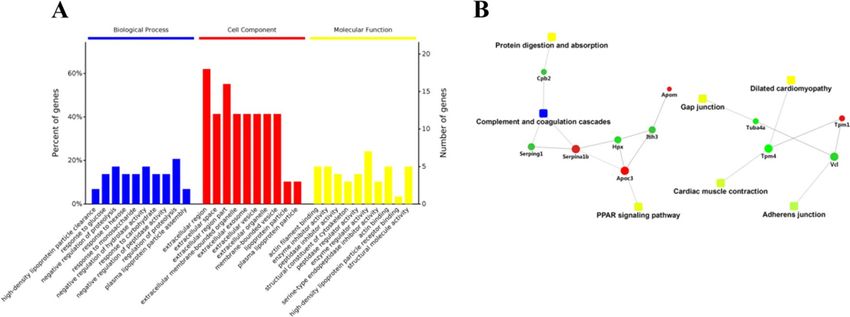
www.nature.com/scientificreports/
Protein Evidence from other drug researches
Enzyme inhibitor-associated proteins
Apolipoprotein C-III (Apoc-III) Alcohol28
Apolipoprotein CII (Apoc-II) Alcohol28
Inter-alpha-trypsin inhibitor heavy chain H3 (itih3) Alcohol29
Mitochondria-related proteins
14-3-3 protein zeta/delta (YWHAZ) Tramadol10
Cytoskeleton proteins
Vinculin (Vcl) Nictoine30,31
Hemopexin (Hpx) Nicotine32
Others
Haptoglobin (Hp) Amphetamine33, heroin17
Transthyretin (Ttr) Alcohol29, heroin17
Retinol-binding protein 4 (RBP-4) Alcohol29
Table 2. Summary of proteins modified by tramadol and one or more other substances of abuse.
The metabolomic profile of the H and N group is different (Fig. 6A).These DEMs were enriched for the
KEGG pathway “biosynthesis of amino acids”, “protein digestion and absorption”, “valine, leucine and isoleucine
biosynthesis” and “valine, leucine and isoleucine degradation” etc. (Fig. 6B).
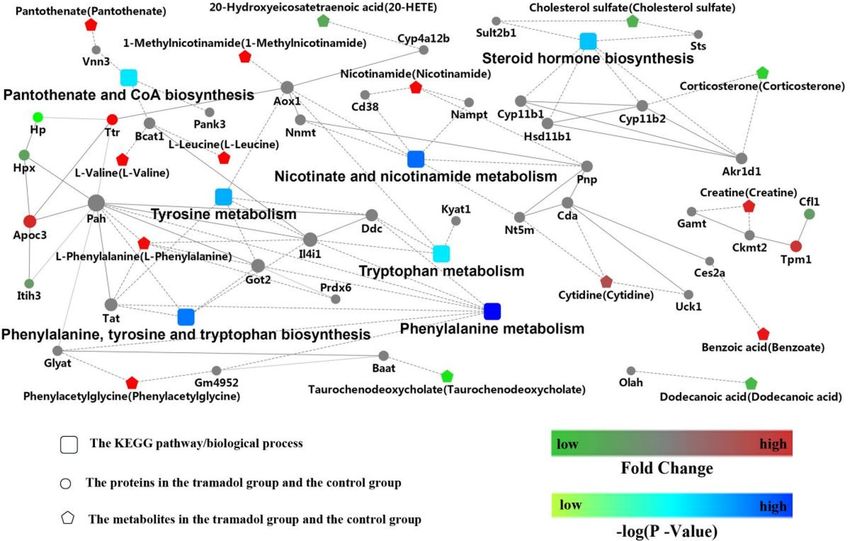
Integrated analysis of metabolomics and proteomics. The DEPs and DEMs in the H and N group
mainly were involved in nicotinate and nicotinamide metabolism, phenylalanine metabolism and the PPAR
signaling pathway as shown in Fig. 7. From the Fig. 2S, these DEMs and DEPs were enriched for the KEGG path-
way “biosynthesis of amino acids”, “steroid hormone biosynthesis”, “phenyalaine metabolism”, “tyrosine metabo-
lism”, “nicotinate and nicotinamide metabolism”, “focal adhesion”. Moreover, the common enrichment KEGG
pathway for DEPs and DEMs is “protein digestion and absorption” including the upregulation of l-isoleucine;
l-valine; l-leucine; l-phenylalanine; l-glutamine and down-regulated Cpb2 by integrated analysis of metabo-
lomics and proteomics.
Discussion
Although tramadol has become the most prescribed opioid worldwide, there are few assays validated the effect
of chronic exposure to tramadol. To obtain the comprehensive system biology profile, two ‘omics’ pipelines
utilizing LC–MS/MS instrumentation were developed and leveraged for this work. We found that 31 DEPs and
34 DEMs in the H and N groups. Moreover, KEGG pathway “protein digestion and absorption” was the key
pathway in the effects of tramadol.
Given the serum is obtained easily in the clinic practice, and few reports focused on the effects of tramadol
on proteins and metabolites in serum, so we chose the serum as the sample. In the present study, TMT-LC–MS/
MS-based quantitative proteome analysis showed protein changes in the metabolic process between the H and
N groups. By bioinformatics analysis,we found that these proteins were classified into different Gene Ontology
(GO) terms, biological process (BP), cell component (CC) and molecular function (MF) (Fig. 2A). The top
GO terms for BP enriched by DEPs in H (the tramadol group) vs. N (the control) group were the regulation of
proteolysis. The prominent GO CC categories that were enriched by these proteins included the extra-cellular
region. Bioinformatics analyses also indicated that these DEPs were associated with structural constituents of
the cytoskeleton, actin filament binding, enzyme regulator activity, and structural molecule activity.
To further investigate the functions of these DEPs, protein–protein interaction (PPI) networks were con-
structed for proteins with differential expression in the H and N group. As shown in Fig. 2B, these DEPs mainly
take part in the following KEGG pathways: protein digestion and absorption, the peroxisome proliferator-
activated receptor (PPAR) signaling pathway, cardiac muscle contraction and adherens junctions. The DEPs in
the PPI networks had a relatively high degree of connectivity, what’s more, we validated these differential proteins
by Elisa kit. The effect of long term exposure to tramadol was associate with protein digestion and absorption,
the PPAR signaling pathway, cardiac muscle contraction and adherens junctions.
By comparing our experimental results with similar toxicological studies of the substance subject to abuse, we
found similar DEPs shown in Table 3. Some DEPs (Apoc III, Apoc II, itih3, YWHAZ, Vcl, Hpx, Hp, Ttr, RBP-4) in
our study were compared with those differential proteins induced by other addiction drug i.g. nicotine, alcohol,
morphine, heroin, amphetamine, and tramadol in Table 3. Actin and Vcl were also down-regulated after nicotine
abuse. The down-regulated Hp and up-regulated Ttr were also reported after alcohol and heroin abuse, what’s
more, variation trend of Hp and Ttr induced by tramadol was coordinate with the heroin addicts. Hp is a highly
abundant plasma glycoprotein, its main function is to combine with free haemoglobin (Hb) to form stable Hp–Hb
complexes. The bioinformatics analysis of Hp showed that Hp is important in the molecular regulation of inflam-
mation, which also acts as an antioxidant, has antibacterial activity and plays a role in modulating many aspects
of the acute phase response34–36. The up-regulated RBP-4 was also found in the heroin addicts, suggested it may
be a potential bio-marker for opioid abuse. The down-regulated Hpx was observed in our study, and Cecconi D
reported similar results induced by nicotine a buse30. Hpx is a plasma protein belonging to positive acute-phase
Scientific Reports | (2021) 11:1454 | https://doi.org/10.1038/s41598-021-81109-7 6
Vol:.(1234567890)www.nature.com/scientificreports/
Figure 3. Elisa analyses of 12 differential expressed proteins. Changes in protein abundance shown by Elisa
analysis and quantification of the proteins were highly consistent with the proteomic data of mice in serum.
*P < 0.05, **P < 0.01.
proteins that binds and transports haeme, thus preventing oxidative d amage32. All the reports mentioned above,
integrated with our findings, suggesting tramadol and these drugs caused similar changes in cellular activities
and biological processes in the serum.
In order to obtain comprehensive profile change after exposure to tramadol, the changes in the metabolome
were also be investigated. The metabolomic pattern was distinguished differences between the H and N groups.
Creatine was suggested be correlated with kidney injury37. 1-Methylnicotinamide and nicotinamide are involved
in nicotinate and nicotinamide metabolism. Moreover, they were suggested to be correlated with inflammation
and oxidative damage3,26. Tryptophan can be transformed into 5-HT, which can also be transformed into indole
acrylic acid and kynurenic acid38. We speculated the balance between tryptophan and 5-HT is disrupted by
the up-regulation of indole acrylic acid and kynurenic acid. The branched-chain amino acids (BCAC, includ-
ing l-isoleucine, l-leucine and l-valine) can stimulate the proliferation of monocytes, to enhance immune
response. Rebholz suggested that an imbalance of BCAC may lead to immune damage, that is correlated with
inflammation to some e xtent39. In addition, hydroxybutyric acid, glutamine and phenylalanine were suggested
to be a correlation with neurotransmitter d isruption6. Taken together, the enrichment KEGG pathway showed
that these different metabolites take part in the biosynthesis of amino acids, protein digestion and absorption,
valine, leucine and isoleucine biosynthesis and valine, leucine and isoleucine degradation.
Scientific Reports | (2021) 11:1454 | https://doi.org/10.1038/s41598-021-81109-7 7
Vol.:(0123456789)www.nature.com/scientificreports/
Figure 4. Volcano plots of metabolites with differential expression between the tramadol group and the control
group (the (A) was obtained under negative ion mode; the (B) was obtained under positive ion mode, blue
represents the distinguished metabolites (FC > 2 or FC < 0.5 and P value < 0.05, P value is calculated by t-test
formula).
No. Metabolite VIP FC (H/N) P value Trend Metabolic pathway
1 1-Methylnicotinamide 1.43537 2.661641219 4.62E − 05 ↑ Nicotinate and nicotinamide metabolism
2 l-Valine 2.07855 1.599308079 0.000135188 ↑ Protein digestion and absorption; Valine, leucine and isoleucine biosynthesis
3 l-Leucine 1.98634 1.721599218 0.00056504 ↑ Protein digestion and absorption; Valine, leucine and isoleucine biosynthesis
4 Acacetin 1.31842 4.382382741 0.000732112 ↑ Flavone and flavonol biosynthesis
5 Isoleucine 4.60723 2.37196399 0.000764949 ↑ Protein digestion and absorption; Valine, leucine and isoleucine biosynthesis
6 l-Carnosine 1.40957 0.439065869 0.001036839 ↓ Histidine metabolism
7 Cholesterol sulfate 2.09954 0.67083571 0.001286897 ↓ Steroid hormone biosynthesis
8 Corticosterone 4.11877 0.517566612 0.001338819 ↓ Steroid hormone biosynthesis
9 N-Cinnamoylglycine 4.15159 3.106462903 0.001544527 ↑ The metabolites of glycine
10 Nicotinamide 3.96743 2.338651712 0.00188947 ↑ Nicotinate and nicotinamide metabolism; Vitamin digestion and absorption
11 Benzoic acid 1.80976 1.385671507 0.002237064 ↑ Degradation of aromatic compounds
12 20-Hydroxyeicosatetraenoic acid 7.79954 0.715070263 0.002618757 ↓ Vascular smooth muscle contraction
13 Kynurenic acid 2.21865 2.074864706 0.003409024 ↑ The catabolites of tryptophan
14 Phenylacetylglycine 4.07605 1.973829943 0.004025549 ↑ Phenylalanine metabolism
15 Mesaconic acid 2.02296 0.763354166 0.0055795 ↓ C5-Branched dibasic acid metabolism
16 dl-Beta-hydroxybutyric acid 6.80608 0.621292252 0.006004963 ↓ Synthesis and degradation of ketone bodies
17 l-Norleucine 1.7419 2.275386538 0.009433052 ↑ Protein digestion and absorption; Valine, leucine and isoleucine biosynthesis
18 Creatine 1.08606 1.333084778 0.009437955 ↑ Arginine and proline metabolism; Glycine, serine and threonine metabolism
19 l-Phenylalanine 1.77148 1.434736131 0.010075828 ↑ Protein digestion and absorption; Phenylalanine metabolism
20 Taurochenodeoxycholate 2.53522 0.434162682 0.012439044 ↓ Bile secretion; Secondary bile acid biosynthesis; Primary bile acid biosynthesis
21 Alpha-chaconine 1.92791 0.771722033 0.015423328 ↓ Glycerophospholipid metabolism
22 Pantothenate 1.3127 1.487048436 0.015648029 ↑ Vitamin digestion and absorption; Pantothenate and CoA biosynthesis
23 Eicosapentaenoic acid 3.8208 1.271415181 0.019745226 ↑ Fatty acid biosynthesis
24 l-Pipecolic acid 1.40422 0.6239531 0.022905318 ↓ Lysine degradation
GABAergic synapse; d-glutamine and d-glutamate metabolism; Glutamatergic
25 Glutamine 1.93396 1.300065997 0.023490107 ↑
synapse
26 Cytidine 1.49422 1.168843272 0.023943668 ↑ Pyrimidine metabolism
27 2-Hydroxy-4-methylpentanoate 5.51063 1.960514129 0.025465597 ↑ Organic acid
28 Indoleacrylic acid 1.10864 1.885752926 0.03537406 ↑ The metabolites of tryptophan
29 Dodecanoic acid 2.28455 0.628753946 0.049332248 ↓ Fatty acid biosynthesis
Table 3. The distinguished different metabolites in H vs N groups.
Scientific Reports | (2021) 11:1454 | https://doi.org/10.1038/s41598-021-81109-7 8
Vol:.(1234567890)www.nature.com/scientificreports/
Figure 5. OPLS-DA Score Results and OPLS-DA valid figure of Mouse Serum Samples (A, C) represent the
OPLS-DA score results; (A) was obtained under negative ion mode; (C) was obtained under positive ion mode;
(C, D) represent the OPLS-DA valid, (B) was obtained under negative ion mode, (D) was obtained under
2 and Q2 represent y-intercept of R2 and Q2 regression lines. N represents the
positive ion mode; intercepts: R
control group; H represents the tramadol group.
Figure 6. (A) Cluster analysis of the tramadol group and the control group (red represents up-regulated, blue
represents down-regulated). (B) Enrichment KEGG pathway (top 10 between the tramadol group and the
control group, H represents the tramadol group; N represents the control group).
In this context, the multi-omics was used to evaluate the effect of exposure to tramadol. In Fig. 7, we can
see that the Nicotinate and nicotinamide metabolism and phenylalanine, tyrosine and tryptophan metabolism
were affected after exposure to tramadol, that is coordinate with the relevance r eport2,4. Combination analyses
of proteomics and metabolomics showed that Cpb2 could be used to elucidate the effect of tramadol. Cpb2 is
a basic carboxypeptidase which can attenuate fibrinolysis and plays a role in regulating complement activation
in vivo40,41, also shows anti-inflammatory activity in the presence of thrombin in vitro42. Carboxypeptidase B
(CpB) which cleaves carboxy-terminal lysine residues, abolished reactive oxygen species induced by oxidative
stress43. The downregulation of Cpb2 was speculated to weaken the defense of organs during oxidative damage
caused by long-term exposure to tramadol.
Limitation are exist in the study, First, the serum proteome coverage reported is sub-optimum and we just
suggested that a few differential protein can be used as potential key proteins to elucidate the toxicity of chronic
exposure to tramadol, further investigations need to be performed for the identification of their modification
in proteins. Second, for the ethical purpose, only eight mice, which can meet the purpose of metabolomics
Scientific Reports | (2021) 11:1454 | https://doi.org/10.1038/s41598-021-81109-7 9
Vol.:(0123456789)www.nature.com/scientificreports/
Figure 7. Combination analyses with proteomics and metabolomics. Red represents up-regulated and green
represents down-regulated. The rectangular node represents the KEGG pathway/biological process. The circular
and pentagon nodes represent the proteins and the metabolites in the tramadol group and the control group,
respectively. The P-value is represented by a blue color gradient; the deeper blue color indicates a larger P-value.
analysis, were included in each group in the present study. In addition, quantitative studies of proteomics need
to be performed to validate others DEPs not included in Fig. 3 after tramadol exposure in future research. As
the high abundance proteins in serum were not removed, the low abundance proteins may not be detected, that
result in the proteomics profile not the most comprehensive.
Conclusion
In conclusion, the proteomic and metabolomic profiles were significantly changed over a 5 weeks following
exposure to tramadol, several protein and metabolite markers have been found to be significantly changed. These
DEPs can be linked to protein digestion and absorption, the PPAR signaling pathway, cardiac muscle contrac-
tion and adherens junctions. These DEMs were enriched for the KEGG pathway “biosynthesis of amino acids”,
“protein digestion and absorption”. Integrated analyses of proteomics and metabolomics, the common KEGG
pathway is protein digestion and absorption. Collectively, our findings may provide the fundamental data for
toxicity of tramadol in serum.
Data availability
The mass spectrometry proteomics data have been deposited to the ProteomeXchange Consortium (http://prote
omecentral.proteomexchange.org) via the iProX partner repository with the dataset identifier PXD019233. All
data are fully available without restriction.
Received: 10 August 2020; Accepted: 4 January 2021
References
1. Kimura, M., Obata, H. & Saito, S. Antihypersensitivity effects of tramadol hydrochloride in a rat model of postoperative pain.
Anesth. Analg. 115, 443–449 (2012).
2. Beakley, B. D., Kaye, A. M. & Kaye, A. D. Tramadol, pharmacology, side effects, and serotonin syndrome: A review. Pain Phys. 18,
395–400 (2015).
3. Grond, S. & Sablotzki, A. Clinical pharmacology of tramadol. Clin. Pharmacokinet. 43, 879–923 (2004).
4. Mohamed, H. M. & Mahmoud, A. M. Chronic exposure to the opioid tramadol induces oxidative damage, inflammation and
apoptosis, and alters cerebral monoamine neurotransmitters in rats. Biomed. Pharmacother. 110, 239–247 (2019).
5. Ryan, N. M. & Isbister, G. K. Tramadol overdose causes seizures and respiratory depression but serotonin toxicity appears unlikely.
Clin. Toxicol. (Phila.) 53, 545–550 (2015).
6. Shubhakaran, K. P. & Khichar, R. J. Tramadol side effects: Seizure and hypoglycemia. Anesth. Essays Res. 10, 685–686 (2016).
7. Makunts, T., Ur, A., Atayee, S. & Abagyan, R. Retrospective analysis reveals significant association of hypoglycemia with tramadol
and methadone in contrast to other opioids. Sci. Rep. 9, 12490 (2019).
8. Liu, L. W. et al. Neuronal apoptosis in morphine addiction and its molecular mechanism. Int. J. Clin. Exp. Med. 6, 540–545 (2013).
Scientific Reports | (2021) 11:1454 | https://doi.org/10.1038/s41598-021-81109-7 10
Vol:.(1234567890)www.nature.com/scientificreports/
9. Mohamed, M., Ghaffar, H. M. & El Husseiny, R. M. Effects of tramadol, clonazepam, and their combination on brain mitochondrial
complexes. Toxicol. Ind. Health 31, 1325–1333 (2015).
10. Zhuo, H. Q., Huang, L., Huang, H. Q. & Cai, Z. Effects of chronic tramadol exposure on the zebrafish brain: A proteomic study. J.
Proteom. 75, 3351–3364 (2012).
11. Bameri, B. et al. Evidence for the involvement of the dopaminergic system in seizure and oxidative damage induced by tramadol.
Int. J. Toxicol. 37, 164–170 (2018).
12. Abdel-Zaher, A. O., Abdel-Rahman, M. S. & Elwasei, F. M. Protective effect of Nigella sativa oil against tramadol-induced tolerance
and dependence in mice: Role of nitric oxide and oxidative stress. Neurotoxicology 32, 725–733 (2011).
13. Atici, S. et al. Liver and kidney toxicity in chronic use of opioids: An experimental long term treatment model. J. Biosci. 30, 245–252
(2005).
14. Xiao, S. & Zhou, L. Gastric cancer: Metabolic and metabolomics perspectives (review). Int. J. Oncol. 51, 5–17 (2017).
15. Ronsein, G. E. et al. Parallel reaction monitoring (PRM) and selected reaction monitoring (SRM) exhibit comparable linearity,
dynamic range and precision for targeted quantitative HDL proteomics. J. Proteom. 113, 388–399 (2015).
16. Zecha, J. et al. TMT labeling for the masses: A robust and cost-efficient, in-solution labeling approach. Mol. Cell Proteom. 18,
1468–1478 (2019).
17. Zhou, B. Y. et al. Serum proteomic analysis reveals high frequency of haptoglobin deficiency and elevated thyroxine level in heroin
addicts. PLoS ONE 9, e95345 (2014).
18. Zhang, G. et al. Quantitative proteomics analysis reveals proteins and pathways associated with anthocyanin accumulation in,
barley. Food Chem. 298, 124973 (2019).
19. Tyanova, S., Temu, T. & Cox, J. The MaxQuant computational platform for mass spectrometry-based shotgun proteomics. Nat.
Protoc. 11, 2301–2319 (2016).
20. Ma, J. et al. iProX: An integrated proteome resource. Nucleic Acids Res. 47, D1211–D1217 (2019).
21. Tyanova, S. et al. The Perseus computational platform for comprehensive analysis of (prote)omics data. Nat. Methods 13, 731–740
(2016).
22. Boutet, E. et al. UniProtKB/Swiss-Prot, the manually annotated section of the UniProt KnowledgeBase: How to use the entry view.
Methods Mol. Biol. 1374, 23–54 (2016).
23. Kanehisa, M., Goto, S., Sato, Y., Furumichi, M. & Tanabe, M. KEGG for integration and interpretation of large-scale molecular
data sets. Nucleic Acids Res. 40, D109–D114 (2012).
24. Ashburner, M. et al. Gene ontology: Tool for the unification of biology. The Gene Ontology Consortium. Nat. Genet. 25, 25–29
(2000).
25. Kohl, M., Wiese, S. & Warscheid, B. Cytoscape: Software for visualization and analysis of biological networks. Methods Mol. Biol.
696, 291–303 (2011).
26. Liu, B. et al. Protective mechanism of 1-methylhydantoin against lung injury induced by paraquat poisoning. PLoS ONE 14, e222521
(2019).
27. R: A Language and Environment for Statistical Computing.{R Core Team}. R Foundation for Statistical Computing. (Vienna,
Austria, 2020). https://www.R-project.org
28. Klop, B., Rego, A. T. & Cabezas, M. C. Alcohol and plasma triglycerides. Curr. Opin. Lipidol. 24, 321–326 (2013).
29. Yamada, M. et al. Combined proteomic analysis of liver tissue and serum in chronically alcohol-fed rats. Alcohol Clin. Exp. Res.
37(Suppl 1), E79–E87 (2013).
30. Proietti, S. et al. Increase in motility and invasiveness of MCF7 cancer cells induced by nicotine is abolished by melatonin through
inhibition of ERK phosphorylation. J. Pineal Res. 64, e12467 (2018).
31. Piubelli, C. et al. Proteomic changes in rat serum, polymorphonuclear and mononuclear leukocytes after chronic nicotine admin-
istration. Proteomics 5, 1382–1394 (2005).
32. Cecconi, D. et al. Serum proteomic analysis during nicotine self-administration, extinction and relapse in rats. Electrophoresis 29,
1525–1533 (2008).
33. Iwazaki, T., McGregor, I. S. & Matsumoto, I. Protein expression profile in the striatum of acute methamphetamine-treated rats.
Brain Res. 1097, 19–25 (2006).
34. Schindeler, A., McDonald, M. M., Bokko, P. & Little, D. G. Bone remodeling during fracture repair: The cellular picture. Semin.
Cell Dev. Biol. 19, 459–466 (2008).
35. Kushner, I., Edgington, T. S., Trimble, C., Liem, H. H. & Muller-Eberhard, U. Plasma hemopexin homeostasis during the acute
phase response. J. Lab. Clin. Med. 80, 18–25 (1972).
36. Kim, S. W. et al. Proteomics approach to identify serum biomarkers associated with the progression of diabetes in Korean patients
with abdominal obesity. PLoS ONE 14, e222032 (2019).
37. Sheweita, S. A., Almasmari, A. A. & El-Banna, S. G. Tramadol-induced hepato- and nephrotoxicity in rats: Role of Curcumin and
Gallic acid as antioxidants. PLoS ONE 13, e202110 (2018).
38. Lin, W. H. et al. Seizure-induced 5-HT release and chronic impairment of serotonergic function in rats. Neurosci. Lett. 534, 1–6
(2013).
39. Rebholz, C. M. et al. Serum metabolomic profile of incident diabetes. Diabetologia 61, 1046–1054 (2018).
40. Leenaerts, D. et al. Plasma carboxypeptidase U (CPU, CPB2, TAFIa) generation during in vitro clot lysis and its interplay between
coagulation and fibrinolysis. Thromb. Haemost. 117, 1498–1508 (2017).
41. Morser, J. et al. Carboxypeptidase B2 and N play different roles in regulation of activated complements C3a and C5a in mice. J.
Thromb. Haemost. 16, 991–1002 (2018).
42. Tawara, S., Sakai, T. & Matsuzaki, O. Anti-inflammatory and anti-fibrinolytic effects of thrombomodulin alfa through carboxy-
peptidase B2 in the presence of thrombin. Thromb. Res. 147, 72–79 (2016).
43. Sabbah, N., Jaisson, S., Garnotel, R., Angles-Cano, E. & Gillery, P. Small size apolipoprotein(a) isoforms enhance inflammatory
and proteolytic potential of collagen-primed monocytes. Lipids Health Dis. 18, 166 (2019).
Acknowledgements
We thank International Science Editing (http://www.internationalscienceediting.com) for editing this manu-
script. We thank Shanghai Bioprofile Technology Co. Ltd. for supporting proteomics analysis.
Author contributions
Conceptualization: L.G. Data curation and formal analysis: S.J., G.L., H.Y. Investigation: E.X., W.X., X.Z. Meth-
odology: W.X., X.Z. Supervision: L.G., J.L., G.L. Writing—original draft: S.J., L.G., G.L. Writing—review and
editing: S.J., L.G. All authors reviewed the manuscript.
Funding
This study was funded by National Natural Science Foundation of China (81671864).
Scientific Reports | (2021) 11:1454 | https://doi.org/10.1038/s41598-021-81109-7 11
Vol.:(0123456789)www.nature.com/scientificreports/
Competing interests
The authors declare no competing interests.
Additional information
Supplementary Information The online version contains supplementary material available at https://doi.
org/10.1038/s41598-021-81109-7.
Correspondence and requests for materials should be addressed to L.G.
Reprints and permissions information is available at www.nature.com/reprints.
Publisher’s note Springer Nature remains neutral with regard to jurisdictional claims in published maps and
institutional affiliations.
Open Access This article is licensed under a Creative Commons Attribution 4.0 International
License, which permits use, sharing, adaptation, distribution and reproduction in any medium or
format, as long as you give appropriate credit to the original author(s) and the source, provide a link to the
Creative Commons licence, and indicate if changes were made. The images or other third party material in this
article are included in the article’s Creative Commons licence, unless indicated otherwise in a credit line to the
material. If material is not included in the article’s Creative Commons licence and your intended use is not
permitted by statutory regulation or exceeds the permitted use, you will need to obtain permission directly from
the copyright holder. To view a copy of this licence, visit http://creativecommons.org/licenses/by/4.0/.
© The Author(s) 2021
Scientific Reports | (2021) 11:1454 | https://doi.org/10.1038/s41598-021-81109-7 12
Vol:.(1234567890)You can also read