#LIVEATURBAN - URBAN INSTITUTE
←
→
Page content transcription
If your browser does not render page correctly, please read the page content below

Data Talk

#LiveAtUrban

Institutional Investors and the U.S. Housing Recovery

Lauren Lambie-Hanson, Wenli Li, and Michael Slonkosky
Federal Reserve Bank of Philadelphia*

Urban Institute
February 5, 2020

*The views in this presentation do not necessarily reflect those of the Federal Reserve Bank of Philadelphia or the Federal Reserve System

                                                                                                                                             2
Lambie-Hanson, Li, and Slonkosky                        3 of 20

      Motivation
        • A housing recovery without homeowners

                 Lambie-Hanson, Li, and Slonkosky   3
Lambie-Hanson, Li, and Slonkosky                                 4 of 20

       Regions Differed in Recovery Paths

                          Data source: CoreLogic Solutions
                 Lambie-Hanson, Li, and Slonkosky            4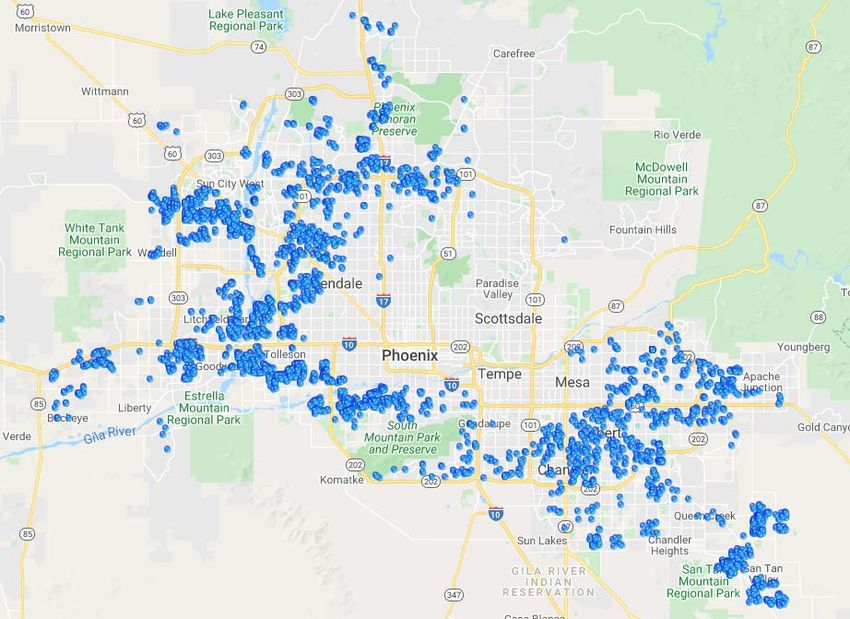
Lambie-Hanson, Li, and Slonkosky                                                                                               5 of 20

       What We Find
       •   Differences in recovery paths can be explained largely by the emergence of “institutional” investors purchasing through
           corporate entities

       •   Presence of institutional buyers had been mostly flat since the early 2000s but picked up significantly since the
           mortgage crisis
            •   Phenomenon is widespread, but particularly prominent in distressed markets
            •   Some investors are affiliated with large financial or real estate firms

       •   An increase in the share of institutional buyers helps boost local house prices and reduces vacancy rates

       •   No significant effect on local rent-price ratio or eviction rates

       •   Decreased homeownership rates

                    Lambie-Hanson, Li, and Slonkosky                                                          5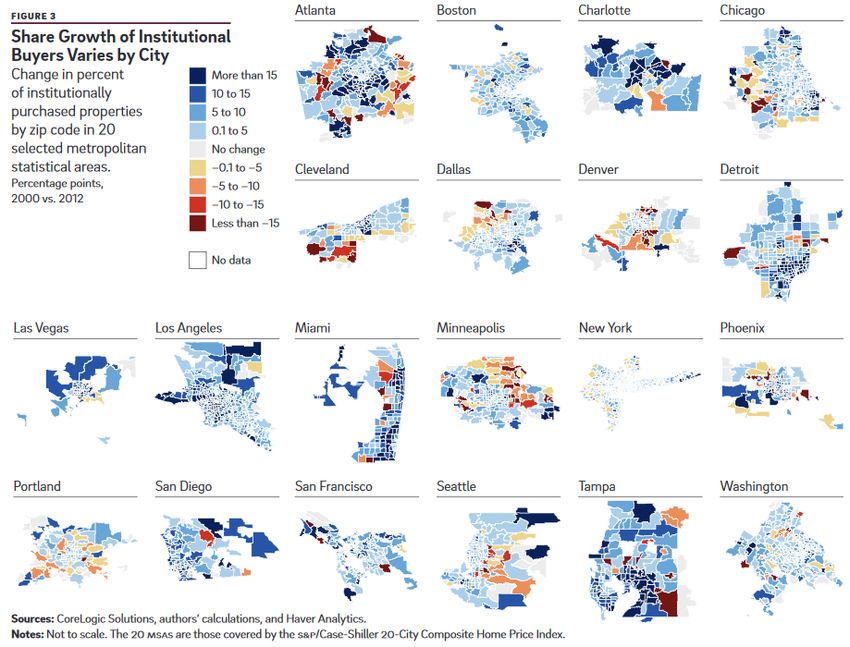
Lambie-Hanson, Li, and Slonkosky                                                                              6 of 20

      Presence of Institutional Investors Varies Between – and within – Metro Areas

                             Figure
                 Lambie-Hanson,      source:
                                Li, and      Lambie-Hanson, Li, and Slonkosky (2018, Economic Insights)
                                        Slonkosky                                                         6
Lambie-Hanson, Li, and Slonkosky                                                                                                        7 of 20

      Investors Have Different Business Models
         • Most common business models:
                • Buy-to-rent
                    •   With or without investment
                    •   With or without intention to sell once the market improves
                • Flip (with or without renovation)

         • Sometimes, business model simply depends on how market performs
                • Larger investors may be more committed to a particular strategy

        • Institutions, large and small, have advantages in buying
            •     As Mills, Molloy, and Zarutskie (2017) explain, they are not as sensitive to financing constraints (and post-crisis
                  contraction of mortgage credit availability), have better institutional knowledge, facilitated by new technology

                    Lambie-Hanson, Li, and Slonkosky                                                                          7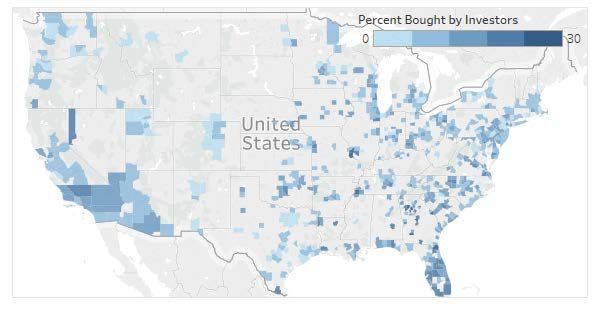
Lambie-Hanson, Li, and Slonkosky                                                                                                         8 of 20

         Datasets
       • CoreLogic Solutions (Real Estate Deeds)
              •   Property-level information on deed and mortgage transactions as originally electronically keyed at county registries
              •   Tax assessor data (mailing address for tax bill)

       • CoreLogic Solutions Home Price Index Data
          •       County-level series

       • Black Knight McDash Data
              •   Loan-level mortgage servicing data

       • Home Mortgage Disclosure Act (HMDA)

       • And more!
          •       Homeownership rates from Census
          •       Unemployment from Bureau of Labor Statistics
          •       Rent indices and rent-to-price ratios from Zillow*
          •       Eviction rates from the Eviction Lab at Princeton University

          *Source: Zillow Research at Zillow.com (data downloaded between January 2008 and August 2008)
                       Lambie-Hanson, Li, and Slonkosky                                                                      8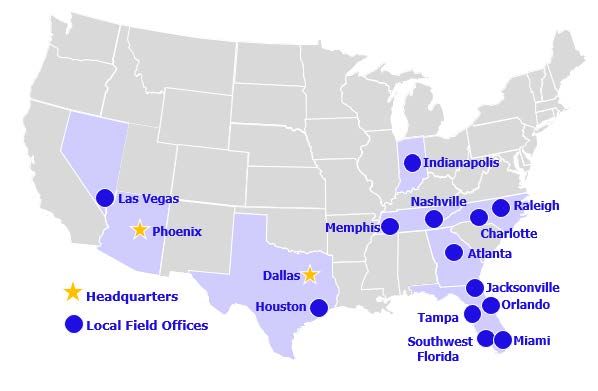
Lambie-Hanson, Li, and Slonkosky                                                                                                                          9 of 20

       Identifying Investors: The Literature

        • Various methods have been used in the literature; each has drawbacks:
            • Self- or lender-reported (Gao and Li 2015, Gao, Sockin and Xiong 2017, using HMDA; Li, White and Zhu 2011 using Black Knight McDash Data)
                 •     Can suffer from fraud (Elul and Tilson 2015)

            • Based the number of first-lien mortgages (Haughwout, Lee, Tracy, and van der Klaauw 2011, using Federal Reserve Bank of New
               York/Equifax Consumer Credit Panel data)

                 •     Will miss those who don’t borrow using a loan tied to their personal credit

            • Number of transactions within a short period (Bayer, Mangum, and Roberts 2016, using public records)
                 •     Hard to link investors together, given different names

            • Property address vs. mailing address (Fisher and Lambie-Hanson 2012 and Chinco and Mayer 2012, using public records)
                 •     Messy data, may not be reliable

                     Lambie-Hanson, Li, and Slonkosky                                                                                             9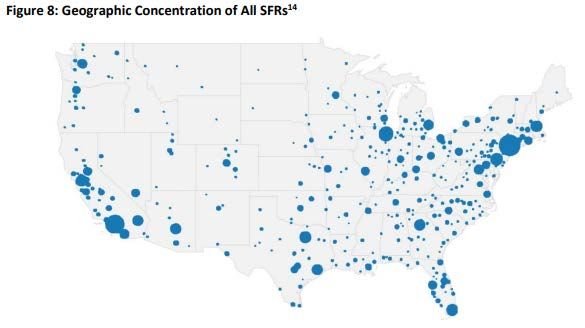
Lambie-Hanson, Li, and Slonkosky                                                                                                                                              10 of 20

       Identifying Investors: Our Approach
       • Our approach: in public records, determine if buyer (seller) is an institution or an individual, based on
         name
          • Who we capture:
              • Large institutions: (Top 20 identified by 2017 Amherst Capital Market Report)
                  (Blackstone (Invitation Homes), American Homes 4 Rent, Colony Starwood, Progress Residential, Main Street Renewal, Silver Bay, Tricon American Homes,
                  Cerberus Capital, Altisource Residential, Connorex-Lucinda, Havenbrook Homes, Golden Tree, Vinebrook Homes, Gorelick Brothers, Lafayette Real Estate, Camillo
                  Properties, Haven Homes, Transcendent, Broadtree, and Reven Housing REIT)

              • Smaller investors (e.g., LLCs not affiliated with large institutions)

           • Like Mills, Molloy, and Zarutskie (2015), we exclude government entities, corporate relocation
             services, banks, etc.

                 Lambie-Hanson, Li, and Slonkosky                                                                                                   10
Lambie-Hanson, Li, and Slonkosky 11 of 20
Identifying Large Institutions Using Associated Mailing Addresses
• “Snowball” approach to collecting names under which the top 20 large investors purchase properties
• Begin with a company’s name, cycling through 3 rounds of collecting mailing addresses from tax assessor data
• Confirm no false matches (shared addresses)
• Aggregate number of purchases to “top holder” investor, confirm they are similar to Amherst Capital 2017 report
Address 7
Investor b Address 4
Investor g Address 8
Address 1 Investor c Address 5 Investor i
Investor h Address 9
Investor d Address 6 Investor j
Investor d
Investor A
Address 2
Investor e
Investor c
Address 3
Investor f
Round 1
Round 2
Round 3 11Lambie-Hanson, Li, and Slonkosky 12 of 20
What about individual investors?
• Some investors buy in their own names, rather than through corporate entities.
• We proxy for this group in two ways:
1. Estimating the fraction of buyers in a county who are individual investors buying with a
mortgage
2. Counting up buyers who use cash (risks over-counting investors)
Lambie-Hanson, Li, and Slonkosky 12Lambie-Hanson, Li, and Slonkosky 13 of 20
Dataset Summary
• Single-family purchase transactions 2000 – 2014 for background; 2007 – 2014 for regression analysis on
recovery
• Exclude nominal sales with transaction price under $1000, relocation sales, sales into REO (foreclosure
deeds with bank purchasers), bank-to-bank transactions, etc.
• About 600 counties
• Within 300 MSAs in the continental U.S.
• 5,000 county-year observations (2007 – 2014)
Lambie-Hanson, Li, and Slonkosky 13Lambie-Hanson, Li, and Slonkosky 14 of 20
Investors made up a growing share of buyers in the recovery
Data source: CoreLogic Solutions, Black Knight McDash.
Lambie-Hanson, Li, and Slonkosky 14Lambie-Hanson, Li, and Slonkosky 15 of 20
Institutional Purchases
2000 2006
2014
Lambie-Hanson, Li, and Slonkosky Data source: CoreLogic Solutions 15Lambie-Hanson, Li, and Slonkosky 16 of 20
Large Institutional Purchases in 2014
+
Data source: CoreLogic Solutions
Lambie-Hanson, Li, and Slonkosky 16Lambie-Hanson, Li, and Slonkosky 17 of 20
How have investors affected local markets?
Our model:
yi,t = β1x i,t
1 + β2Zi,t-1 + ϵi,t
where
• i: county, t: year;
• yi,t : dependent variable, change in:
• real HPI growth
• homeownership rate
• REO duration
• vacancy rates
• construction employment
• and more (rent index, rent-price ratio, eviction rates);
• x i,t
1 : share of institutional buyers in county i in year t;
• Potentially endogenous
• Zi,t-1: other control variables
• County and year fixed effects
• Lagged: change in population, change in real HPI, unemployment, foreclosure rate, and real household income
Lambie-Hanson, Li, and Slonkosky 17Lambie-Hanson, Li, and Slonkosky 18 of 20
Instrument: GSE First Look Programs
• Fannie Mae instituted its First Look program in August 2009; Freddie
Mac followed in September 2010.
• For initial 15 days REO properties are on market, homeowners and
nonprofit organizations could bid on REO properties before they
became available to investors
• Period since extended to 20 days, 30 in Nevada
• Using Black Knight McDash Data on single-family properties in Source:
https://www.homepath.com/firstlook-program.html
foreclosure and REO, calculate for each county-year:
• Average share of distressed mortgages that list Fannie Mae (2009) or Fannie/Freddie
(2010+) as investors
• The series takes a value of zero prior to 2009.
• More distressed loans held by GSEs Less investor prevalence
• County fixed effects in first-stage model
18Lambie-Hanson, Li, and Slonkosky 19 of 20
Results: More Investor Purchases Greater House Price Growth
2SLS Coefficient
***
Share of Institutional Buyers (%) 0.626
***
Lagged real HPI growth rate (%) 0.451
***
Lagged growth rate of real median household income (%) -0.109
***
Lagged changes in unemployment rate (%) -1.425
***
Lagged changes in foreclosure rate (%) -19.257
***
Lagged growth rate in population (%) 0.227
Data sources: CoreLogic Solutions, Black Knight McDash Data, Census, and Bureau of Labor Statistics.
Note: indicates significance at the 1 percent level.
***
• 1-percentage-point increase in institutional buyers 63-bp increase in real home prices.
Lambie-Hanson, Li, and Slonkosky 19Lambie-Hanson, Li, and Slonkosky 20 of 20
Robustness: Definition of Investors
Share of Institutional Buyers (%) 2SLS Coefficient
Institutions [main model] 0.626 ***
Institutions + individual investors with mortgages 1.021***
Institutions + individual investors with mortgages + individuals with cash purchases 0.709 **
Net institutional investor purchases 0.594***
Top 20 Institutional Investors 1.022***
Data sources: CoreLogic Solutions, Black Knight McDash Data, Census, and Bureau of Labor Statistics.
Note: indicates significance at the 1 percent level, ** at the 5 percent level.
***
Lambie-Hanson, Li, and Slonkosky 20Lambie-Hanson, Li, and Slonkosky 21 of 20
Concluding Thoughts
• Institutional investors increased their presence in the housing market during and after the crisis.
• They sped local house price recovery and reduced vacancies.
• No evidence that more investors led to higher rents or greater eviction rates.
For the latest version of the paper, please contact Lauren.Lambie-Hanson@phil.frb.org
Lambie-Hanson, Li, and Slonkosky 21Lambie-Hanson, Li, and Slonkosky
Appendix
Data source: CoreLogic Solutions; Census.
Lambie-Hanson, Li, and Slonkosky
22Lambie-Hanson, Li, and Slonkosky
Appendix: Institutional sales show no consistent pattern across MSAs
during the recovery.
Data source: CoreLogic Solutions
Lambie-Hanson, Li, and Slonkosky 23Tracing the Source of Liquidity for Distressed Housing Markets
Rohan Ganduri 1 Steven Chong Xiao 2 Serena Wenjing Xiao 2
1 Emory University 2 University of Texas at Dallas
Urban Institute
February 5, 2020Motivation
• Foreclosure crisis following the 2007–2010 financial crisis:
• 7.8 million homes were foreclosed between 2007–2016.
• Foreclosure crisis peaked in 2011 at 1.6 million foreclosed homes (∼20% of all foreclosed homes).
1 / 23Motivation
• Foreclosure crisis following the 2007–2010 financial crisis:
• 7.8 million homes were foreclosed between 2007–2016.
• Foreclosure crisis peaked in 2011 at 1.6 million foreclosed homes (∼20% of all foreclosed homes).
• The large wave of foreclosures resulted in:
• Depressed prices for the foreclosed properties (Clauretie & Daneshvary 2009, Campbell et al. 2011).
• Depressed prices for nearby properties (spillover effect) (Harding et al. 2009, Lin et al. 2009, Frame 2010, Campbell et al. 2011, Anenberg &
Kung 2014, Gerardi et al. 2015, Fisher et al. 2015)
• Several government-led initiatives to mitigate the foreclosure crisis and stabilize neighborhoods (e.g., NSP,
REO-to-Rental, VRPOs, HAMP etc.).
• Simultaneously, institutional investors (e.g., Blackstone, Starwood ) were purchasing the deeply discounted
distressed properties (Allen et al. 2018, Mills et al. 2019, Lambie-Hanson et al. 2019).
• Returns from price appreciation.
• Returns from rental income.
1 / 23Single family homes purchases by institutional investors
• Insitutional investors have
purchased more than 300K homes
between 2010–2018 (30-fold
increase), and still growing.
• Largest owners are comparable in
scale to the large multifamily
owners.
• Blackstone (Invitation Homes)
($12 Billion), American Homes 4
Rent ($10.7 Billion), Colony
Starwood Homes (∼$8 Billion).
2 / 23Research question
• We study the effect of institutional investment on the local real estate market.
1. We focus on institutional investment in distressed homes.
2. We focus on the foreclosure crisis period.
3 / 23Research question
• We study the effect of institutional investment on the local real estate market.
1. We focus on institutional investment in distressed homes.
2. We focus on the foreclosure crisis period.
• Research question: How do institutional purchases of distressed homes affect neighborhood home prices?
3 / 23Preview of results
• Institutional investors were an important source of liquidity for distressed housing markets during the
foreclosure crisis.
• Institutional purchases of distressed properties have a positive spillover effect of neighboring home values.
• Homes that are within 0.25 miles (∼ 5 blocks) from an institutional purchased home sell at $1.33 per sqft, or a 1.4%
higher value relative to properties that are within 0.25–0.50 miles away.
• Above estimates imply 20% less underpricing of homes in distressed areas after institutional purchases.
• Positive spillover effect is greater for:
• Neighboring foreclosed transactions (4.3%)
• Similar properties (e.g., 2.5% of same-age properties)
• In more distressed neighborhoods (7.4%)
4 / 23Effect of institutional purchases on neighboring homes
• Ex ante, the effect is not obvious:
• Institutional investment reduces the supply of properties available for sale (+).
• Institutional investors can bargain for deeper discounts (−).
• Lower preference for rental properties in neighborhoods (−).
• Purchases by informed institutional investors can subject unsold properties to adverse selection issues (−).
5 / 23Data
• Primary Data: Zillow’s ZTRAX Database.
• 400 million detailed public records across 2,750+ U.S. counties.
• 20 years of deed transfers, mortgages, foreclosures, auctions, property tax delinquencies for commercial and residential properties.
• ZTRAX transactions data: transaction date, sales price, buyer and seller’s identity, foreclosure information,
etc.
• ZTRAX assessment data: property type, address, year built, lot size and building area, number of
bedrooms and bathrooms, etc.
• Manually identify institutional owners based on owner mailing address and name.
• We find 166,635 SFH owned by 26 institutional investors as of 2016.
• Amherst Capital Market Report 2016: 190,000 SFH owned by institutional investors.
• Therefore, we are able to identify 88% of all the SFHs owned by institutional investors.
6 / 23Geographic Distribution of Institutional SFR Holdings
Rank Investor Properties (#)
1 Invitation Homes 41,735
2 American Home 4 Rent 36,231
3 Starwood Waypoint 27,290
4 Progress Residential 13,890
5 Silver Bay 6,872
6 Main Street Renewal 5,819
7 Tricon American Homes 5,677
8 Altisource 4,256
9 Havenbrook Homes 3,568
10 Cerberus 3,440
11 Camillo Properties 2,817
12 Golden Tree Insite Partners(GTIS) 2,515
13 Connorex-Lucinda 2,434
14 Haven Homes 1,728
15 Gorelick Brothers Capital 1,717
7 / 23Institutional Investment and House Prices
0.012 0.012
Home Price Index (log, de-meaned) in Years 1, 2
Home Price Index (log, de-meaned) in Years 3, 4
0.008 0.008
0.004
0.004
0.000
0.000
-0.004
-0.004
-0.008
-0.008
-0.012
-0.012
-1.0 -0.5 0.0 0.5 1.0 1.5 -1.0 -0.5 0.0 0.5 1.0
Institutional Purchase (log, demeaned) Institutional Purchase (log, demeaned)
(A) House prices in t+1, t+2 (B) House prices in t+3, t+4
8 / 23Empirical challenge
• Selection concerns:
• Selection bias in favor (+): Institutional investors can cherry-pick properties in neighborhoods that have the greatest
potential for future growth.
• =⇒ Neighboring home prices trending up regardless of institutional purchases.
• Selection bias against (−): Institutional investors more likely to invest when they get the deepest discounts – i.e., in
the most distressed neighborhoods.
• =⇒ Neighboring home prices trending down regardless of institutional purchases.
9 / 23Empirical Strategy
• In February 2012, FHFA announced the REO-to-Rental Pilot Initiative:
• Purpose: Help clear the national backlog of real estate owned (REO) foreclosed homes.
• Strategy: Sell pre-packaged REO foreclosed properties in bulk to institutional investors.
• Implementation: Auction process, where investors bid on pre-packaged pools of foreclosed properties (individual homes
only privately valued).
• Other requirements: Investors were required to rent out the properties.
• Importantly, pre-packaging of foreclosed properties ensured investors were not allowed to cherry-pick
individual properties.
10 / 23Empirical Strategy
• Difference-in-differences (DD) setup in hyper-local areas around the pilot bulk-sale transactions (e.g.,
within 0.5 miles).
• Treatment group: Properties close to the pilot institutional bulk-sale transactions.
• Control group: Properties far away from the pilot institutional bulk-sale transactions.
• Assumption: In the absence of the institutional bulk-sale transaction, house prices for properties close to,
and far away from the bulk-sold property trend similarly.
• Plausible because of investor’s inability to cherry pick properties at highly local levels (however, while bidding,
investors likely accounted for house price growth at broader geographic levels, such as county.).
11 / 23Empirical Strategy
• DD model around REO bulk transactions:
Close Close
Pi,t = α + β1 P ostt × BSi + β2 BSi + f (Xi,t ) + γc,t + δs + εi,t
• Sample: transactions within 0.5-mile radius from bulk-sold properties that are neither related to the bulk transactions nor
purchased by other institutional investors
• Period: six months before and after bulk transactions, excluding the event month (June, 2012).
• Pi,t : residual transaction price from a hedonic regression for single family home i that is sold at time t.
• BSiClose : treatment variable that equals 1 for all properties within 0.25-mile radius of the bulk-sold property
12 / 23Illustration of Treated and Control Properties in Maricopa County, AZ
• Black circle: Bulk-sold institutional property.
• Blue diamond: Nearby treated property.
• Green triangle: Farther away control
property.
13 / 23Bulk Sale Transactions
Florida West Chicago
Transaction Transaction Size Geography Winning Bidder Vacancy Third Party Transacted Value
Name (# of Properties) Rate Valuation (% of Third Party)
SFR 2012-1-Florida 699 Florida Pacifica L 47, LLC 32.62% $81,527,995 95.8%
(Central, NE, SE, West Coast)
SFR 2012-1-Chicago 94 Chicago, Illinois Cogsville Capital Partners Fund I, LP 38.74% $13,689,012 86.2%
SFR 2012-1 West 970 Arizona, California, Nevada Colony Homes, LLC 36.05% $156,771,744 112.3%
Total 1763 $251,988,751
14 / 23Neighboring House Prices Around Bulk Transactions.
Dependent Variable: Adjusted price per sqft Adjusted ln(total price)
(1) (2)
Post-sales × I(DistanceNeighboring House Prices Around Bulk Transactions
0–0.25 mi (close) vs. 0.25–0.5 mi (far) 0–0.25 mi (close) vs. 0.25–1 mi (far)
16 / 23Neighboring foreclosed transactions.
• Positive price spillover effect is greater for neighboring distressed properties.
Dependent Variable: Adjusted price per sqft Adjusted ln(total price)
(1) (2)
Post-sales×I(DistanceNeighboring foreclosed transactions.
• Positive price spillover effect is greater for more illiquid distressed properties.
Dependent Variable: Adjusted price per sqft Adjusted ln(total price)
(1) (2)
Post-sales×I(DistanceSimilarity between Focal and Bulk-sold Properties.
• Positive price spillover effect is greater for properties that are more similar to the bulk-sold institutional
property.
• Channel: Evidence suggests supply effect rather than the disamenity effect.
Similarity: Size Age Property Type
Dependent Variable: price per sqft ln(total price) price per sqft ln(total price) price per sqft ln(total price)
(1) (2) (3) (4) (5) (6)
Post-sales×I(DistanceMost Distressed Neighborhoods
• Positive price spillover effect is greater for properties that are in the more distressed areas.
Dependent Variable: Adjusted price per sqft Adjusted ln(total price)
(1) (2)
Post-sales×I(DistanceBulk sale vs. individual sale
• Compare spillover effects between the bulk-sold properties and individually-sold properties.
• No evidence for positive spillover effect from individually-sold properties.
• Suggests that through bulk sales, investors accept some less desirable properties in the pool.
Spillover effect due to individually-sold properties
Dependent Variable: Adjusted price per sqft Adjusted ln(total price)
(1) (2)
Post-sales×I(DistanceConclusion
• Institutional purchases of distressed properties have a positive spillover effect of neighboring home values.
• Positive price spillover effect is stronger for:
• Neighboring foreclosed transactions.
• Similar properties.
• In more distressed neighborhoods.
• Institutional investors were an important source of liquidity for distressed housing markets during the
foreclosure crisis.
22 / 23Implications
• Liquidity provision to distressed housing markets is difficult when credit markets are tight, and significant
negative price externalities are present.
• Institutional investors can play an important part in providing this liquidity and stabilizing housing markets.
• Importantly, this liquidity provision is market-driven, which contrasts with other government spending
programs.
• Bulk sales not limited to FHFA’s program; banks such as Wells Fargo also implemented pre-packaged bulk
sale strategies.
23 / 23Urban Institute Discussion
Institutional Investor Impact on Housing Market
February 2020
Strictly confidential. Not for distribution.Thoughts, Questions, and Reactions
Lauren Lambie-Hanson: “Leaving Households Behind: Institutional Investors and the U.S. Housing Recovery”
Are institutional investors large enough to impact housing prices or homeownership rates at the submarket or zip code level?
How do we think about the difference in impact between large investors (1,000+ homes) and smaller investors (1-10 units) in 2008-14?
Initial investment allocations were to areas with substantial decreases in home values. Today, focus has shifted to identifying assets with
the best long-term cash flow returns. What does that mean for the impact of institutions going forward?
Foreclosures were 25-30% of home sales in 2008-2010 in 20 largest markets. If the next downturn is driven less by mortgage distress
(and therefore fewer foreclosures) how does that shape the magnitude of institutional buying on home prices?
Rohan Ganduri: “Tracing the Source of Liquidity for Distressed Housing Markets”
Supply effect (institutions buying excess homes for sale) was positive for local / MSA home prices in 2009-2014 – how does that dynamic
change in an environment of historically low inventory for sale?
Disamenity effect – Largest investors have a significant incentive to repair and maintain homes in excellent condition, for residents, for
cash flows, and for reputational risk. One-off owners and smaller investors may potentially have different incentives.
Today, there is a move away from buying discounted homes and a move to buying homes with the highest potential cash flows in the right
submarkets. A considerable amount of time and resources are spent identifying the right markets and home attributes.
Does the impact of institutions on home prices change as institutions keep these homes as rentals for the long-term, thereby adding to
the rental stock but reducing for sale stock.
Strictly confidential. Not for distribution. 26Agenda
I. Institutional SFR: Growth and Differentiation of Large Owners
II. Acquisitions: Comparison of Current to Post-GFC, and Concentration of Owners
III. Focus on Higher Growth MSA and Submarkets
1. [Footnote 1]
Strictly confidential. Not for distribution. 27SFR Has Always Been A Large Part of the U.S. Housing Landscape
15mn units today, and ~12% of all housing since 1970
Components of Rental Housing 1
Manufactured Housing, 4%
~15mn units
Single-Family Rentals, 34%
10+ Unit Multifamily, 32%
2-9 Unit Multifamily, 29%
SFR as % of
Components of U.S. Rental Housing, 2017 1 Rentals 2 SFR as % of All
Components of U.S. Rental Housing, 2017 1 Housing 2
40%
16.0%
14.0%
36%
33.6% 12.1%
12.0%
32%
10.0%
28%
8.0%
24%
6.0%
20%
4.0%
SFR as % of Rentals LT avg
SFR as % of Housing LT avg
1. U.S. Census Bureau, 2017 American Community Survey 1-Year Estimates, Table B25032 Tenure by Units in Structure.
2. U.S. Census Bureau. For 1970-1995 data, we use the American Housing Survey data. For 2000 and 2010 we use the Decennial Census. For 2005, and 2015-2018 we use the American Community Survey 1 Year Survey. Any error in combining these various data series is ours.
Strictly confidential. Not for distribution. 28We’re Discussing the Increase in Institutional Ownership
Part of a larger increase in SFR stock from 2005 (11.3mn units) to 2016 (15.3mn units)
Increase in Large Institutional Owners SFR Ownership by Number of Properties 2
200,000
# of SFR Est. Market
180,000
Portfolio Size Investors Properties Share
Institutional Investors 2000+ 18 ~188,000 1%
160,000
Middle-Tier Investors 50-2000 ~6,250 ~703,000 4%
140,000
Small Investors 11-50 ~88,000 ~1.6mn 7%
120,000
Very Small Investors 1-10 15.5mn ~19.3mn 88%
SFR Units (Attached + Detached) 3
100,000
18mn
80,000
16mn
15.3
14.7
60,000
14mn
40,000
12mn
11.3
20,000
10mn
Units Owned By Pretium and Public REITs (AMH, ARPI, SBY, TCN, INVH, CAH, and SFR)
0
2012 2013 2014 2015 2016 2017 2018 2019
8mn
6mn
1970 1975 1980 1985 1990 1995 2000 2005 2010 2015 2016 2017 2018
1. Zelman and Associates, “The Floor Plan,” January 2020.
2. Freddie Mac, Single-Family Rental, An Evolving Market”, December 2018.
3. U.S. Census Bureau. For 1970-1995 data, we use the American Housing Survey data. For 2000 and 2010 we use the Decennial Census. For 2005, and 2015-2018 we use the American Community Survey 1 Year Survey. Any error in combining these various data series is ours.
Strictly confidential. Not for distribution. 29Larger Institutions Own A Higher Quality SFR Home Than Mom & Pops
Pretium Fund I Home Attributes 1 Non-Institutional SFR is older2
35%
30%
Avg. Home Age Home Attributes School Score
18 years ~1,900 sf 6.2
25%
3.4 bedrooms
21%
20%
Atlanta, GA Nashville, TN Raleigh, NC
14%
15%
10%
5%
0%
Pre-1940 1940-1959 1960-1979 1980-1999 2000 or later
% of SFR % of MFR % All Rentals
Four largest institutional owners’ average
Total Homeowner home is 20 years old.3
Rent
Investment Association
~$200,000 / home ~70% ~$1,600 / month
1. Past performance is not indicative of future results. There can be no assurance that these objectives will be achieved. Based on homes owned or managed as of June 30, 2019.
2. Harvard JCHS, State of the Nation's Housing, 2018.
3. Average for AMH, INVH, TCNB, and Pretium.
Strictly confidential. Not for distribution. 30Institutional SFR: Benefits and Challenges as Ownership Increases
Benefits Challenges
Provides high-quality housing in desirable neighborhoods As portfolios grow, incumbent on owners to continue to
and school districts to residents who are unable to or provide high-quality, timely service for residents
choose not to own their home
Acquire homes primarily in neighborhoods with high rates
Institutional ownership favors higher quality homes and of homeownership that may otherwise have been purchased
effective governance practices demanded by institutional by individuals or ‘mom and pop’ owners
capital providers
– In historically low periods of existing home inventory,
Provides a significantly higher level of service and this impact may be more significant than in normal
convenience to customers than ‘mom and pop’ supply / construction periods
National Rental Home Council (“NRHC,” SFR industry As Rohan’s paper pointed out, institutional owners are
trade group) members: profit seeking firms, with a focus on generating rent and
profit growth
– Invest $21,000 in upfront repairs for each home
acquired; an investment that many first-time – Occupancy rate for 4 largest owners nearly 96% in 3Q
homebuyers may be unable to afford, at greater 2019, suggesting rents are in-line with market2
efficiency given institutional scale 1
1. NRHC data, through April 2018. http://www.rentalhomecouncil.org/wp-content/uploads/2018/06/1479-2581_NRHC_National_Fact-Sheet_041218d.pdf
2. Stabilized or same-property portfolio occupancy rates for AMH, INVH, TCN, and Pretium as of September 30, 2019.
Strictly confidential. Not for distribution. 31Agenda
I. Institutional SFR: Growth and Differentiation of Large Owners
II. Acquisitions: Comparison of Current to Post-GFC, and Concentration of Owners
III. Focus on Higher Growth MSA and Submarkets
1. [Footnote 1]
Strictly confidential. Not for distribution. 32Acquisitions in 2012-2013 vs. Today
Larger proportion of distressed purchases in 2012-14; today more selective
Institutional Owners Grew Quickly in 2012-14 1
Pretium Acquires Homes Primarily One By One 2
90,000 20,000
18,000
80,000
16,000
70,000
14,000
60,000
12,000
50,000
10,000
40,000
8,000
30,000
6,000
20,000
4,000
10,000
2,000
0
2012 2013 2014 2015 2016 2017 2018 2019
0
Net Annual Increase in Units Owned By Pretium and Public REITs 2014 2015 2016 2017 2018 2019
1. Zelman and Associates, “The Floor Plan,” January 2020.
2. Pretium Partners, data through December 2019. Past performance is not indicative of future results. There can be no assurance that these objectives will be achieved.
Strictly confidential. Not for distribution. 33Institutional Ownership Concentrated in High Peak to Trough HPA Markets
Freddie Mac analysis shows institutional ownership is concentrated than overall SFR inventory 1
All SFR in US Institutional Ownership of SFR
1. Freddie Mac, Single-Family Rental, An Evolving Market”, December 2018.
Strictly confidential. Not for distribution. 34Concentration of Institutional Investors
We estimate the four largest institutional investors own ~1.1% of the housing stock in the 15 markets where Pretium is most active 1
Institutional Ownership as % of SFR and Housing in Select Markets
Inst it ut ional Ownership (000s)
Tot al Owned Homes % of All Single Family
(AMH, INVH, Prog, TCN ) % of SFR Housing
At lant a Overall MSA 2 4 .6 8.4 % 1 .6 %
Charlot t e Overall MSA 1 2 .0 1 1 .3 % 2 .2 %
Dallas Overall MSA 9 .4 3 .1 % 0.6 %
Houst on Overall MSA 8.2 3 .1 % 0.5%
Indianapolis Overall MSA 4 .5 4 .7 % 0.8%
Jacksonville Overall MSA 5.7 7 .4 % 1 .5%
Las Vegas Overall MSA 5.7 4 .0% 1 .1 %
Memphis Overall MSA 1 .5 1 .7 % 0.4 %
Miami Overall MSA 1 1 .0 4 .5% 0.9 %
Nashville Overall MSA 5.2 6 .9 % 1 .1 %
Orlando Overall MSA 9 .7 5.3 % 1 .1 %
Phoenix Overall MSA 1 4 .3 5.4 % 1 .2 %
Raleigh Overall MSA 3 .0 5.3 % 0.9 %
Sarasot a Overall MSA 0.8 0.7 % 0.1 %
Tampa Overall MSA 1 4 .7 9 .6 % 1 .9 %
Pret ium Target Market s Overall 130.3 5.3 % 1 .1 %
1. Housing inventory data from 2018 1 Yr ACS survey. Institutional home counts by market through 3Q 2019, from public company financials and Pretium data.
Strictly confidential. Not for distribution. 35Agenda
I. Institutional SFR: Growth and Differentiation of Large Owners
II. Acquisitions: Comparison of Current to Post-GFC, and Concentration of Owners
III. Focus on Higher Growth MSA and Submarkets
1. [Footnote 1]
Strictly confidential. Not for distribution. 36Setting Acquisition Criteria: MSA and Submarket
Focused on adding homes in high growth, quality submarkets
Pretium’s investment team performs a comprehensive analysis on each target MSA based on demographic trends, job growth, school
scores, delinquency rates, replacement cost, overall economic data, and HPA trends, with a zip-code score assigned to each neighborhood
before any homes in the area are evaluated for acquisition.
The initial target markets, and locations within those markets, have largely been selected for their:
– Favorable outlooks for population, employment, and income growth Pretium Target SFR Markets
– Strong demonstrated single-family rental demand
– Fiscal stability and tax rates at the state, MSA, and local level
– Community stability, good schools, and low crime rates
– Business friendly environments
– Newer, affordable housing stock
– Attractive going-in yields and outlook for potential capital appreciation.
These attributes have generally led us to invest in high growth Sun Belt markets.
1. Represents homes managed by Pretium’s Real Estate Platform across Pretium’s investment vehicles. Past performance is not indicative of future results. There can be no assurance that these objectives will be achieved
Strictly confidential. Not for distribution. 37Setting Acquisition Criteria: MSA and Submarket
Focus on the submarkets where we expect above average growth, and where we can acquire the homes which work best for us as rentals
Pretium SFR Portfolio in Phoenix
1. Represents homes managed by Pretium’s Real Estate Platform across Pretium’s investment vehicles.
Strictly confidential. Not for distribution. 38Important Disclosures
This confidential presentation was prepared exclusively by Pretium (the “Manager”) for the benefit and internal use of the party to whom it is directly addressed and delivered (the “Recipient”). None of the materials, nor any content, may be
altered in any way, transmitted to, copied, reproduced or distributed in any format in whole or in part to any other party without the prior express written consent of the Manager, which was formed to manage certain investment vehicles. As
used in this presentation, “Pretium,” “Pretium Partners” or “we” refers to Pretium Partners, LLC and/or its affiliated property manager and/or the Manager, as the context requires.
These materials do not constitute, or form part of, any offer to sell or issue interests in any investment vehicle. A private offering of interests in a pooled investment vehicle will be made only pursuant to a Confidential Private Placement
Memorandum (together with any supplements thereto, the “Memorandum”) and the relevant subscription documents, which will be furnished to qualified investors on a confidential basis at their request for their consideration in connection
with the offering. With respect to any pooled investment vehicle, the information presented in these materials will be superseded by, and qualified in their entirety by reference to, the applicable Memorandum, which will contain information
about the investment objective, terms and conditions of an investment in such pooled investment vehicle and will also contain tax information, conflicts of interest and risk disclosures that are important to an investment decision. Any decision
by an investor to invest in a pooled investment vehicle should be made after a careful review of the applicable Memorandum and after consultation with legal, accounting, tax and other advisors in order to make an independent determination of
the suitability and consequences of an investment therein. No person has been authorized to make any statement concerning a pooled investment vehicle other than as will be set forth in the applicable Memorandum and definitive subscription
documents and any representation or information not contained therein may not be relied upon.
Any investment in an investment vehicle is speculative, not suitable for all investors and is intended for experienced and sophisticated investors who are willing to bear the high economic risk of the investment, which risks include, among other
things, risks relating to declines in the value of real estate, demand for properties, foreclosure risks, credit market dislocation, rental rates, dependence on the services of the Manager (who generally will have broad discretion to invest an
investment vehicle’s assets), limitations on withdrawal, risks associated with incentive compensation that may incentivize the Manager to make more speculative investments than would otherwise be the case, and the need for trading profits to
offset costs and expenses of an investment vehicle in order to achieve net profit. Investors should have the financial ability and willingness to accept these and other risks (including the risk of loss of all or a substantial portion of their
investment) for an indefinite period of time. Under no circumstances is this presentation to be used or considered as an offer to sell or a solicitation to buy, any security.
These materials discuss general market activity, industry or sector trends, or other broad-based economic, market or political conditions and should not be construed as research or investment advice. The Recipient is urged to consult with its
financial advisors before making any investment decisions or buying or selling any securities. Certain information contained in these materials has been obtained from published and non-published sources prepared by third parties, which, in
certain cases, have not been updated through the date hereof. While such information is believed to be reliable, the Manager has not independently verified such information nor does it assume any responsibility for the accuracy or completeness
of such information. The information included herein may not be current and the Manager has no obligation to provide any updates or changes. Except as otherwise indicated herein, the information, opinions and estimates provided in this
presentation are based on matters and information as they exist as of the date these materials have been prepared and not as of any future date, and will not be updated or otherwise revised to reflect information that is subsequently discovered or
available, or for changes in circumstances occurring after the date hereof. The Manager’s opinions and estimates constitute the Manager’s judgment and should be regarded as indicative, preliminary and for illustrative purposes only.
39Important Disclosures (cont.)
Certain information contained in these materials constitute “forward-looking statements,” which can be identified by the use of forward-looking terminology such as “may,” “will,” “should,” “seek,” “expect,” “anticipate,” “project,” “estimate,”
intend,” continue,” “target,” “plan,” “believe,” the negatives thereof, other variations thereon or comparable terminology. Due to various risks and uncertainties, actual events or results of the actual performance of a company or strategy may
differ materially from those reflected or contemplated in such forward-looking statements.
Past performance is not necessarily indicative of future results and there can be no assurance that targeted returns will be achieved. There can be no assurance that an investment vehicle will achieve results comparable to or that the returns
generated will equal or exceed those of other investment activities of the Manager or its affiliates or that investment vehicle will be able to implement its investment strategy or achieve its investment objectives. The Manager does not make any
representation or warranty, express or implied, regarding future performance. Targeted results shown herein are based on assumptions and calculations of the Manager using data available to it. Targeted results are subjective and should not be
construed as providing any assurance to the results that may be realized by an investment vehicle.
These materials are intended to assist you in connection with your due diligence and to assist you in understanding the types of factors that can affect portfolio performance. They are not intended as a representation or warranty by the Manager
as to the actual composition or performance of any future investments that would be made by an investment vehicle. Assumptions necessarily are speculative in nature. It is likely that some or all of the assumptions underlying potential
investments included herein will not materialize or will vary significantly from any assumptions made (in some cases, materially so). You should understand such assumptions and evaluate whether they are appropriate for your purposes.
Illustrative performance results are based on mathematical models that calculate these results using input that are based on assumptions about a variety of future conditions and events. The use of such models and modeling techniques
inherently are subject to limitations. As with all models, results may vary significantly depending upon the value and accuracy of the inputs given, and relatively minor modifications to, or the elimination of, an assumption, may have a significant
impact on the results. Actual conditions or events are unlikely to be consistent with, and may differ materially from, those assumed. ACTUAL RESULTS WILL VARY AND MAY VARY SUBSTANTIALLY FROM THOSE REFLECTED IN THESE
MATERIALS.
40You can also read