SENIOR HOUSING MARKET INSIGHT - Q3 2019 - CBRE

Page created by Randy Gonzales
 
CONTINUE READING
SENIOR HOUSING MARKET INSIGHT - Q3 2019 - CBRE
SE N I OR HO USING     Q3 2019
MA R KE T I N S IGHT
SENIOR HOUSING MARKET INSIGHT - Q3 2019 - CBRE
NATIONAL SENIOR HOUSING                                                                                                  IN THIS REPORT
PRIMARY CONTACTS

LISA WIDMIER                  ARON WILL                     AUSTIN SACCO
                                                                                                                        03
                                                                                                                      Introduction
                                                                                                                                          04
                                                                                                                                        Demographic
Executive Vice President      Vice Chairman                 First Vice President
Institutional Properties
National Senior Housing
                              Institutional Properties
                              National Senior Housing
                                                            Institutional Properties
                                                            National Senior Housing                                                       Demand
Capital Advisors, Inc.        Debt & Structured Finance     Debt & Structured Finance
Investment Banking            CBRE | Capital Markets        T +1 713 787 1952
Member FINRA/SIPC             T +1 713 787 1965
CBRE | Capital Markets
T +1 858 729 9890
M +1 858 952 4743

NATIONAL SENIOR HOUSING
TEAM                                                                                                                    06
                                                                                                                    General Industry
                                                                                                                                          07
                                                                                                                                         Investment
                                                                                                                      Parameters           Returns

ADAM MINCBERG                 MATT KURONEN                  TIM ROOT                    ASHAY SHAH
Vice President                Vice President                Vice President              Transaction/Underwriting
Institutional Properties      Institutional Properties      Institutional Properties    Manager

                                                                                                                        09                10
National Senior Housing       National Senior Housing       National Senior Housing     Institutional Properties
Debt & Structured Finance     Debt & Structured Finance     Debt & Structured Finance   National Senior Housing
                                                                                        CBRE | Capital Markets

                                                                                                                      Transaction      Senior Housing
                                                                                                                        Activity        Construction
                                                                                                                                           Activity
CYRUS PAYDAR                  ALLISON FORD                  BRANDON WILLIAMS            MICHAEL CREGAN
Financial Analyst             Financial Analyst             Production Analyst          Production Analyst
Institutional Properties      Institutional Properties      Institutional Properties    Institutional Properties
National Senior Housing       National Senior Housing       National Senior Housing     National Senior Housing
CBRE | Capital Markets        CBRE | Capital Markets        Debt & Structured Finance   Debt & Structured Finance

                                                                                                                        11
                                                                                                                      Comparison
                                                                                                                                          12
                                                                                                                                       Senior Housing
                                                                                                                      of Primary &      Capitalization
ALLIE SURGES
Client Services Coordinator
                              NATALIA MANNING
                              Client Services Coordinator
                                                            SANDY AGUILA
                                                            Graphic Design                                             Secondary            Rates
Institutional Properties      Institutional Properties      Institutional Properties
National Senior Housing
CBRE | Capital Markets
                              National Senior Housing
                              Debt & Structured Finance
                                                            National Senior Housing
                                                            CBRE | Capital Markets
                                                                                                                        Markets

                                                                                                                        14                17
CORPORATE LEADERSHIP
SUPPORT RESOURCE
                                                                                                                    CBRE Research       About CBRE
                                                                                                                    - Active Adult     National Senior
                                                                                                                    Research Brief        Housing
MITCHELL KIFFE
Senior Managing Director
National Senior Housing
Debt & Structured Finance
SENIOR HOUSING MARKET INSIGHT - Q3 2019 - CBRE
3 Introduction
 CBRE National Senior Housing is an industry leader in
 investment sales, debt originations, and investment banking.
 Our team has transacted more than $14.2 billion (including
 deals currently under contract) across the nation since 2014.

 We offer a depth of expertise rarely found in the senior
 housing sector. Our principals, Lisa Widmier, Aron Will, and
 Austin Sacco have 51 years of combined experience in the
 senior housing industry and have generated over $23 billion
 in transaction volume. The breadth of our experience as
 developers, institutional investors, appraisers, and owner/
 operators has given us the ability to understand a transaction
 from all sides.

 CBRE National Senior Housing focuses exclusively on senior
 housing. We provide a wide variety of services, including:

      •   Investment property sales
      •   Structured debt
      •   Investment banking/Capital raise
      •   Valuation
      •   General consulting

 We provide investment opportunities to the marketplace across
 a broad spectrum of senior housing property types including:

      •   Age-restricted multifamily
      •   Active Adult
      •   Independent living
      •   Assisted living
      •   Alzheimer’s/memory care
      •   Skilled nursing and continuum of care
      •   Continuing care retirement communities
          (rental and entry fee)

 For more information about CBRE National Senior
 Housing, please visit our website at www.cbre.com/
 nationalseniorhousing

3 |   CBRE SHMI Q3 2019
SENIOR HOUSING MARKET INSIGHT - Q3 2019 - CBRE
4                 Senior Housing Demand is Driven by
                                 Demographic Demand

                        The baby boomers (post-World War II babies) began                    years to approximately 20.4 years. Additionally, it is
                        turning 65 in 2011 and by 2030, the remainder will                   estimated that about one out of every four 65-year-
                        also reach age 65 and account for approximately                      olds will live to be 90 years old, with one of every 10
                        21% of the total United States population. By 2050,                  expected to live past 95 years of age.2
                        the 65-plus age group is estimated to exceed 85.6
                        million, a more than 50% increase over its estimated                 Driving this increased life expectancy, and
                        2020 population (56.1 million). The same figure for                  consequentially average population age, is the
                        85-plus group is even higher. By 2050, the 85-plus                   advancement in public health strategy and medical
                        age group is estimated to exceed 18.5 million, a                     treatment. Life expectancy in the United States has
                        177% increase over its estimated 2020 population (6.7                increased by approximately 30 years over the past
                        million). Additionally, by 2035 the 65-plus age group is             century, primarily due to the reduction of acute illness
                        estimated to be larger than the population under age                 threats. However, an unforeseen consequence of longer
                        18. By 2035, there will be 78.0 million people 65 years              life expectancy has been the increased prevalence of
                        and older compared to 76.7 million under the age                     heart disease, cancer and other chronic diseases as the
                        of 18. The projected growth in the senior population                 leading causes of death. As Americans age during the
                        will present many challenges to policy makers and                    next several decades, the elderly population will require
                        programs by having a significant impact on families,                 a larger number of formally trained, professional
                        businesses, healthcare providers and, most notably, on               caregivers as a direct effect of these chronic diseases,
                        the demand for senior housing.1                                      which often affect independence and mobility.3

                        One of the primary drivers in trends for the aging                   Moreover, the problems facing the United States aging
                        population is mortality rates. Survivorship rates have               population can be witnessed as a global phenomenon.
                        shown consistent improvement for many decades. In                    Fifty countries had a higher proportion of people aged
                        the United States in 1972, the average life expectancy               65-plus than the United States in 2010. This number
                        of a 65-year-old was 15.2 years. By 2017, the most                   is expected to increase to approximately 98 countries
                        recent available data, this metric increased by 5.2                  by 2050.1

                                                      NUMBER OF PEOPLE AGE 65 & OVER AND 85 & OVER
                           100
                            90
                            80
                            70
Population (millions)

                            60
                            50
                            40
                            30
                            20
                            10
                             0
                                  2020 F     2025 F      2030 F        2035 F           2040 F           2045 F            2050 F           2055 F           2060 F

                                                                      Population 65+          Population 85+

Copy Source: 1) U.S. Census Bureau. (2) Social Security Administration, Retirement & Survivors Benefits: Life Expectancy Calculator, 2019. (3) Center for Disease Control
and Prevention. The State of Aging and Health in America Report.

4 |                       CBRE SHMI Q3 2019
SENIOR HOUSING MARKET INSIGHT - Q3 2019 - CBRE
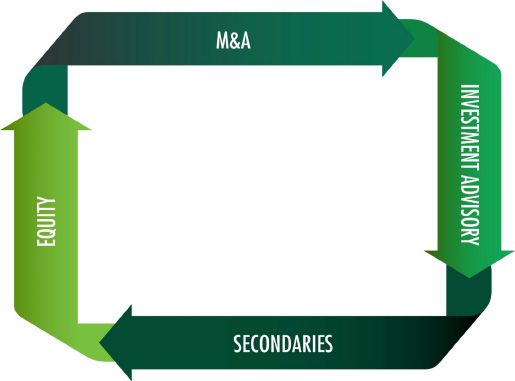
U.S. POPULATION ESTIMATES AGE 75-PLUS
                                                          60                                                                                                                                                                                                        14.0%

                          75-Plus Population (millions)
                                                          50                                                                                                                                                                                                        12.0%

                                                                                                                                                                                                                                                                            % of Total Population
                                                                                                                                                                                                                                                                    10.0%
                                                          40
                                                                                                                                                                                                                                                                    8.0%
                                                          30
                                                                                                                                                                                                                                                                    6.0%
                                                          20
                                                                                                                                                                                                                                                                    4.0%
                                                          10                                                                                                                                                                                                        2.0%

                                                               0                                                                                                                                                                                                    0.0%

                                                                                                                   Population 75+                                                                 % of Total Population

                              Chart Source: U.S. Census Bureau; release date: March, 2018 and U.S. Census Bureau, Statistical Abstract of the United States: 2012.
                              Note: “A” indicates actuals based on Census data and “F” indicates forecasted population estimates released March 2018.

      A Multi-Trillion Dollar Industry
      Annual United States healthcare services expenditures totaled almost $3.5 trillion in 2017. Healthcare is one of
      the largest line items in Federal and State Government spending. Healthcare spending is estimated to grow at an
      average of 5.5% per year from 2018 through 2027. Furthermore, over the same period, healthcare spending
      is estimated to grow 0.8% faster than GDP per year. As a result, the healthcare portion of GDP is expected to
      rise from 17.9% in 2017 to 19.4% by 2027.4
                                                                                                     NATIONAL HEALTH EXPENDITURES (BILLIONS)

                                                                                                                                                                                                                                                       $5,963
                                    $7,000

                                                                                                                                                                                                                                          $5,651
                                                                                                                                                                                                                             $5,345
                                                                                                                                                                                                                 $5,049
                                    $6,000
                                                                                                                                                                                                     $4,767
                                                                                                                                                                                       $4,502
                                                                                                                                                                            $4,255
                                                                                                                                                                  $4,031
                                                                                                                                                        $3,823

                                    $5,000
                                                                                                                                              $3,647
                                                                                                                                    $3,492
                                                                                                                           $3,361
                                                                                                                $3,206
                                                                                                      $3,031
                                                                                            $2,882
                                                                                 $2,798

                                    $4,000
                                                                      $2,691

                                    $3,000

                                    $2,000

                                    $1,000

                                                           $0

       Source: Centers for Medicare & Medicaid Services, actuals published as of 2/2019. The projections incorporate estimates of GDP and spending as of May 2017.

                                                                                                     NATIONAL HEALTH EXPENDITURES PER CAPITA
                                                                                                                                                                                                                                                          $16,907
                                                                                                                                                                                                                                             $16,148
                                                                                                                                                                                                                                $15,396

                        $20,000
                                                                                                                                                                                                                   $14,660
                                                                                                                                                                                                       $13,954
                                                                                                                                                                                        $13,281
                                                                                                                                                                             $12,656
                                                                                                                                                                  $12,087
                                                                                                                                                        $11,559
                                                                                                                                              $11,121
                                                                                                                                    $10,739
                                                                                                                          $10,410

                        $15,000
                                                                                                               $10,006
                                                                                                     $9,529
                                                                                          $9,129
                                                                               $8,927
                                                                   $8,649

                        $10,000

                         $5,000

                                                          $0

       Source: Centers for Medicare & Medicaid Services, actuals published as of 2/2019. The projections incorporate estimates of GDP and spending as of May 2017.

       Copy Source: (4) Centers for Medicare & Medicaid Services, National Health Expenditure Projections 2018 – 2027 https://www.cms.gov/research-statistics-data-and-
       systems/statistics-trends-and-reports/nationalhealthexpenddata/downloads/forecastsummary.pdf (accessed March 20, 2019).

5 |    CBRE SHMI Q3 2019
6 General Industry Parameters - Pricing
      SENIOR HOUSING/NURSING CARE VALUE
           ESTIMATED AT $420.4 BILLION

                                                                                           Majority
                                                                                           Independent
Continuing Care                                                                            Living, 18.38%
Retirement
Communities,
26.0%
                                                                                              Majority
                                                                                              Assisted
                                                                                              Living, 25.6%
 Majority Nursing
 Care, 26.9%
                                                                                              Majority
                                                                                              Memory
                                                                                              Care, 3.1%

         Chart Source: MAP, NIC. “NIC Investment Guide 5th Edition.” 2018.

     Historical Value Per Unit Pricing

                             SENIOR HOUSING (IL/AL) PRICE PER UNIT                                                    INDEPENDENT LIVING (IL) PRICE PER UNIT
                             $275                                                                                               $275

                             $225                                                                                               $225
               (thousands)

                                                                                                                  (thousands)

                             $175                                                                                               $175

                             $125                                                                                               $125

                              $75                                                                                                $75
                                    2009 2010 2011 2012 2013 2014 2015 2016 2017 2018                                                  2009 2010 2011 2012 2013 2014 2015 2016 2017 2018

                                       Median IL/AL price per unit          Average IL/AL price per unit                                   Median IL price per unit    Average IL price per unit

                                ASSISTED LIVING (AL) PRICE PER UNIT                                                               NURSING CARE (NC) PRICE PER UNIT
                             $275                                                                                               $105

                                                                                                                                $95
                             $225
                                                                                                                                $85
                                                                                                               (thousands)

                                                                                                                                $75
               (thousands)

                             $175
                                                                                                                                $65

                                                                                                                                $55
                             $125
                                                                                                                                $45

                             $75                                                                                                $35
                                    2009    2010   2011    2012   2013   2014   2015   2016    2017     2018                           2009 2010 2011 2012 2013 2014 2015 2016 2017 2018

                                           Median AL price per unit         Average AL price per unit                                     Median NC price per bed     Average NC price per bed

             Chart Source: The Seniors Housing Acquisition & Investment Report, First Edition, 2019

  6 |     CBRE SHMI Q3 2019
7 Senior Housing Investment Returns
The Property Index Performance Data provided by the National Council of Real Estate Investment Fiduciaries (NCREIF) indicates that
reporting senior housing properties have generally outperformed the broader National Property Index (NPI) since at least 2003.

The senior housing total return for Q3 2019 was 2.64%, which includes a 1.13% income return and a 1.51% capital appreciation
return. Over the past four quarters, senior housing returned 8.80% (4.50% income and 4.30% appreciation). The five year total
return of 12.45% is 343 basis points higher than the NPI return (all asset classes) of 9.02% and 401 basis points higher than
the multifamily total return of 8.44%.

Over a five-year period, senior housing returns have outperformed the NPI and multifamily in total returns and income returns.
The senior housing sector’s stronger performance may reflect the fact that senior housing has experienced continuous rental
rate growth, despite significant fluctuations in the general economy. The following charts compare the returns achieved by the
senior housing component, the multifamily component, and
the overall index. Items shown for each quarter represent that
particular quarter’s return, while periods showing a single year                 CUMULATIVE NCREIF TOTAL RETURNS
or multiple years represent the compounded annual index                       NPI VS. MULTI-FAMILY VS. SENIOR HOUSING
returns achieved for that period. All returns are before fees.        7,900                   Over the last ten years, Seniors Housing
                                                                                     6,900    returns have consistently outperformed
                                                                                              other types of real estate.
                                                                                     5,900
                    SENIOR HOUSING RETURNS
                                                                                     4,900
                                                                             Index   3,900
                               Total Returns
                            Total NPI        Total       Total Stabilized            2,900
                                          Multi-Family   Senior Housing
                                                                                     1,900
Q3 2019                   1.56%           1.31%               2.64%
                                                                                       900
Q2 2019                   1.59%           1.48%               2.41%
Q1 2019                   1.85%           1.49%               1.17%
Q4 2018                   1.47%           1.47%               2.57%                           All Properties NPI      Multi-Family       Senior Living Stabilized
One Year Return           6.63%           5.88%               9.08%           Chart Source: NCREIF Query Tool. 3Q 2004 = 1,000.
Three Year Return         7.13%           6.63%              10.73%
Five Year Return          9.02%           8.44%              12.45%
Ten Year Return          10.01%          10.37%              11.96%                          CUMULATIVE NCREIF APPRECIATION RETURNS
Fifteen Year Return       8.68%           8.38%              13.68%                           NPI VS. MULTI-FAMILY VS. SENIOR HOUSING
                                                                                     3,400
                   Capital (Appreciation) Returns
                        Total NPI          Total          Total Stabilized           2,900
                                       Multi-Family      Seniors Housing
Q3 2019                      0.50%          0.37%              1.51%                 2,400
                                                                             Index

Q2 2019                      0.53%          0.52%              1.34%
                                                                                     1,900
Q1 2019                      0.80%          0.53%             0.03%
                                                                                     1,400
Q4 2018                      0.41%          0.50%             1.42%
One Year Return              2.26%          1.93%             4.36%                   900

Three Year Return            2.67%          2.64%             5.89%
Five Year Return             4.36%          4.26%             7.40%
                                                                                              All Properties NPI      Multi-Family       Senior Living Stabilized
Ten Year Return              4.70%          5.57%             6.15%
                                                                               Chart Source: NCREIF Query Tool. 3Q 2004 = 1,000.
Fifteen Year Return          3.20%          3.55%             7.36%
                                  Income Returns
                            Total NPI        Total        Total Stabilized
                                         Multi-Family    Seniors Housing
                                                                                              CUMULATIVE NCREIF INCOME RETURNS
Q3 2019                      1.05%             0.94%           1.13%
                                                                                             NPI VS. MULTI-FAMILY VS. SENIOR HOUSING
Q2 2019                      1.06%             0.96%           1.07%
                                                                                     2,500
Q1 2019                      1.06%             0.96%          1.15%                  2,300
Q4 2018                      1.06%             0.96%          1.15%                  2,100
One Year Return              4.30%             3.88%          4.58%                  1,900
                                                                             Index

                                                                                     1,700
Three Year Return            4.37%             3.91%          4.63%
                                                                                     1,500
Five Year Return             4.51%             4.05%          4.79%                  1,300
Ten Year Return              5.13%             4.61%          5.56%                  1,100
                                                                                      900
Seven Year Index             5.35%             4.71%          6.01%
Source: NCREIF. Quarterly returns are not annualized.

                                                                                             All Properties NPI       Multi-Family       Senior Living Stabilized

                                                                               Chart Source: NCREIF Query Tool. 3Q 2004 = 1,000.
7 |   CBRE SHMI Q3 2019
8 Senior Housing Investment Returns                                                               (CONT’D)

       Seniors - Yield Opportunity
       Senior housing continues to provide a yield premium over conventional multifamily.

            CAP RATE COMPARISONS - CONVENTIONAL MULTI-FAMILY VS. SENIOR HOUSING & NURSING CARE

        US Seniors Housing & Care                                                                             6.4%

                              US Office                                                                         6.7%

                               US Retail                                                                        6.6%

                          US Industrial                                                                     6.3%

                     US Multi-Family                                                                 5.5%

            Source: Real Capital Analytics TrendTracker Report, Q3 2019.

       Historical Multi-family and Senior Housing & Nursing Care Cap Rates
       Senior housing acquisitions provide an income yield advantage over multifamily value-add acquisitions,
       trading at higher capitalization rates.

            CAP RATE COMPARISONS - CONVENTIONAL MULTI-FAMILY VS. SENIOR HOUSING & NURSING CARE

           10.00%
             9.50%
             9.00%
             8.50%
             8.00%
             7.50%
             7.00%
             6.50%
             6.00%
             5.50%
             5.00%
                        2009
                        2010
                        2010
                        2010
                        2010
                        2011
                        2011
                        2011
                        2011
                        2012
                        2012
                        2012
                        2012
                        2013
                        2013
                        2013
                        2013
                        2014
                        2014
                        2014
                        2014
                        2015
                        2015
                        2015
                        2015
                        2016
                        2016
                        2016
                        2016
                        2017
                        2017
                        2017
                        2017
                        2018
                        2018
                        2018
                        2018
                        2019
                        2019
                        2019
                        Q4
                        Q1
                        Q2
                        Q3
                        Q4
                        Q1
                        Q2
                        Q3
                        Q4
                        Q1
                        Q2
                        Q3
                        Q4
                        Q1
                        Q2
                        Q3
                        Q4
                        Q1
                        Q2
                        Q3
                        Q4
                        Q1
                        Q2
                        Q3
                        Q4
                        Q1
                        Q2
                        Q3
                        Q4
                        Q1
                        Q2
                        Q3
                        Q4
                        Q1
                        Q2
                        Q3
                        Q4
                        Q1
                        Q2
                        Q3

                                                     US Seniors Housing & Care   US Multi-Family

          Source: Real Capital Analytics TrendTracker Report, Q3 2019.

8 |   CBRE SHMI Q3 2019
9 Transaction Activity by Buyer Type
      U.S. Based Senior Housing & Care Transaction Activity by Buyer Type
          Cross-Border (Internationally Based)                              Private Equity
          A buyer is defined as “cross-border” if the buyer or              “Private equity,” as an investor type, refers to companies
          major capital partner is not headquartered in the country         whose control is in private hands and whose business
          where the property is located. An increasing number               is primarily geared toward operating, developing, or
          of firms have subsidiaries accessing capital in multiple          investing in commercial real estate. This includes private
          countries. A firm may have two headquarters locations             equity joint ventures, commingled funds, and high net
          for the purposes of the pie chart analysis. For example,          worth family offices.
          Deutsch Bank (DB Real Estate) is assumed to be based in
          Germany for deals outside of the United States while their        Public Listed/REITs
          acquisitions within the United States are assumed to be           Companies and or funds traded on open public markets
          made via its domestic headquartered subsidiary, RREEF.            whose business is primarily geared toward investing in
                                                                            and or operating or developing commercial real estate.
          Institutional                                                     These include REITs, REOCs, and publicly-listed funds.
          “Institutional” refers to an investor, such as a bank,
          insurance company, retirement fund, hedge fund, or                User/Other
          mutual fund, that is financially sophisticated and makes          Users of commercial property for specific purposes;
          large investments, often held in very large portfolios of         business users, government, educational or religious
          investments.                                                      institutions that own real estate for their own use.

           SENIOR HOUSING TRANSACTION ACTIVITY BY BUYER TYPE — U.S. BASED SENIOR HOUSING & CARE PROPERTIES
                                 1.0%                  1.2%                   2.6%                 1.8%                  1.8%
                100%
                 90%
                 80%            30.5%                  30.2%                 31.1%                 33.6%                33.5%
                 70%
      Buyer %

                 60%                                                         11.1%
                 50%                                   33.5%                                       27.5%
                                                                                                                        37.2%
                 40%            53.0%
                 30%                                                         48.5%
                                               6.3%                                                31.5%
                 20%                                   31.6%
                                                                   6.7%                  5.8%                   2.7%    24.8%
                 10%             9.3%           3.5%
                  0%
                                 2015                  2016                   2017                 2018                2019 YTD

                                      Cross-Border     Institutional      REIT/Listed    Private     User/Other
      Chart Source: Real Capital Analytics, Q3 2019.

 As the graph above illustrates, since 2016 there has been a clear trend in the mix of investors in the senior housing
 and care transaction market. During this period, private equity buyers (including dedicated senior housing funds,
 opportunity funds, and commingled funds with core plus and value-add investment objectives) have become
 increasingly active in the marketplace, as have REITs.

 The trend has been especially strong during 2019:

       • Private equity buyers (33.5%) and REIT buyers (37.2%) have accounted for 70.7% of all transaction activity
         in 2019 so far.
       • Institutional buyers, such as banks, insurance companies, retirement (pension) funds, hedge funds and mutual
         funds, have continued to be less active compared to their peak in 2017, accounting for 24.8% of the
         transaction volume in 2019.
       • Cross-border buyers accounted for just 2.7% of transaction activity. However, multinational investment platforms
         from Europe, Asia, and the Middle East are actively seeking investments in U.S.-based senior housing.
9 |     CBRE SHMI Q3 2019
10 Senior Housing Construction Activity
       With an annualized 2019 year-over-year growth rate of 2.6%, inventory growth has
                                                                        5
       contracted below the 30-year average annual growth rate of 4.2%.

       The onset of the credit crisis in mid-2008 caused a severe contraction in construction lending for Senior
       Housing projects. However, major construction lenders have returned to the sector. The Senior Housing
       pipeline (rolling four quarters construction versus inventory) averaged 3.86% during 2018 and lowered to
       2.56% in Q3 2019 for All Markets. New Senior Housing construction activity has averaged 2.95% during
       YTD 2019, with approximately 30,500 units/beds started per quarter. In Q3 2019 there were approximately
       26,713 units/beds of new construction starts for all market areas.5

                                                      SENIOR HOUSING INVENTORY GROWTH (ALL MARKETS)
                                 12.00%

                                 10.00%
                                                                                                                             Inventory Growth %
                                                                                                                               at 30 year lows
       Growth in Inventory (%)

                                  8.00%

                                  6.00%
                                                                                               Average = 4.2%
                                  4.00%

                                  2.00%

                                  0.00%

         Chart Source: NIC MAP Data & Analysis Service, Q3 2019 Supply Report; All Markets. *YTD 2019 Annualized.

       New Senior Housing Construction
                                                           NEW CONSTRUCTION STARTED BY QUARTER
                                 8,000
                                 7,000
                                 6,000
                                 5,000
   Units

                                 4,000
                                 3,000
                                 2,000
                                 1,000
                                    0

                                          Majority Independent Living         Majority Assisted Living              Majority Nursing Care

   Chart Source: NIC MAP Data Service & Analysis, Primary & Secondary Markets (Q3 2019).
   Copy Source: (5) “Q3 2019 NIC Map Data Report” NIC MAP Data & Analysis Services, (Q3 2019).

10 |               CBRE SHMI Q3 2019
11                                  Comparison of Primary & Secondary Markets
                                               Rent, Construction, Absorption & Occupancy
                        Annual Rent Growth - Primary & Secondary Markets
                        The stabilized occupancy rates for primary and secondary markets have diverged slightly in recent quarters.
                        In Q3 2019, 90 basis points separated primary markets (90.1%) from secondary markets (89.2%). Q3 2019
                        also saw annual rent growth taper to an extent in both primary and secondary markets, declining to 2.7% for
                        both market areas.

                                 SENIOR HOUSING STABILIZED OCCUPANCY                                                                SENIOR HOUSING AMR Y-T-Y GROWTH

                              90.2%                                                                                      3.5%
                              90.0%                                                                                      3.0%
            Occupancy (%)

                              89.8%
                                                                                                                         2.5%
                              89.6%
                                                                                                                         2.0%
                              89.4%
                              89.2%                                                                                      1.5%
                              89.0%                                                                                      1.0%
                              88.8%                                                                                      0.5%
                              88.6%                                                                                      0.0%
                                             Q4 2018      Q1 2019            Q2 2019     Q3 2019                                   Q4 2018             Q1 2019        Q2 2019           Q3 2019

                                 NIC MAP Primary Markets                 NIC MAP Secondary Markets                              NIC MAP Primary Markets               NIC MAP Secondary Markets

            New Senior Housing Construction & Absorption
            The pace of total inventory growth in Q3 2019 slowed relative to Q2 2019 but has seen continued expansion
            in the majority independent living and majority assisted living segments as investment capital remains focused
            on Class A, high margin facilities. Nursing care continues to contract as low-to-negative margins and regulatory
            uncertainty disincentivizes new construction and poorly performing operators are consolidated into larger
            brands. However, high stabilized occupancies and absorption levels across primary and secondary markets
            demonstrate that demand is not faltering, and new units will not be vacant for long.

                                     INVENTORY GROWTH BY QUARTER6                                                                          NEW SUPPLY & OCCUPANCY7
        8,000
                                                                                                                                97% Absorption       65% Absorption          81% Absorption
                                                                                                                       35,000                                                                       100%
                                                                                                                                                 81%…            66% Absorption      76% Absorption
        6,000                                                                                                                                                                                        90%
                                                                                                                       30,000
                                                                                                                                                                                                     80%
        4,000
                                                                                                                       25,000                                                                        70%
                                                                                                                                                                                                     60%     Occupancy %
        2,000                                                                                                          20,000
                                                                                                               Units
Units

                                                                                                                                                                                                     50%
            0                                                                                                          15,000
                                                                                                                                                                                                     40%

                                                                                                                       10,000                                                                        30%
        -2,000
                                                                                                                                                                                                     20%
                                                                                                                        5,000
                                                                                                                                                                                                     10%
        -4,000
                             Q4 Q1 Q2 Q3 Q4 Q1 Q2 Q3 Q4 Q1 Q2 Q3                                                           0                                                                         0%
                            2016 2017 2017 2017 2017 2018 2018 2018 2018 2019 2019 2019                                          2014        2015         2016      2017         2018     2019
                                                                                                                                                                                         (proj.)**
                            Majority Independent Living    Majority Assisted Living    Majority Nursing Care                New Units       Absorbed Units        % Absorption      % Stabilized Occupancy

            Sources: (6) NIC MAP® Data Service, Primary & Secondary Markets. (Q3 2019). (7) NIC MAP® Data Service Primary & Secondary Markets New Supply & Occupancy.
            (Q3 2019) **2019 numbers annualize YTD 2019 data.

         11 |                  CBRE SHMI Q3 2019
12 Senior Housing Capitalization Rates
       Summary of Capitalization Rates Spring 2019 Survey
        The table below summarizes the results of CBRE’s U.S. Senior Housing & Care Cap Rate Survey for the
        first half of 2019. The survey revealed that senior housing capitalization rates have increased since the
        survey for the second half of 2018. The spread changes range from -10 to 20 basis points for Class
        A properties and from 0 to 50 basis points for Class B and C properties, depending on the respective
        level of care and core versus non-core locations.

        Spreads by investment class also changed from the second half of 2018 and now show more fluctuation
        between Classes A to B and A to C. The change from the second half of 2018 for the spread from
        Class A to Class B properties increased for most property types, except for non-core nursing care. The
        spreads between core and non-core assets were largest for independent living communities, which
        indicates that location remains a key element in determining the capitalization rate. Survey respondents
        reported that the most attractive investment opportunities are in independent living followed by assisted
        living. Active adult has also gained considerable interest.

                                          Class A                                Class B                              Class C
                                                       Change                                   Change                              Change
                            Low     High Average                      Low    High Average                   Low   High Average
                                                        (bps)                                    (bps)                               (bps)
           Core   IL       4.00%    8.00%     5.40%         0        5.00%    8.00%    6.40%      20        6.00% 10.00%    7.70%     20
                  AL       5.00%    8.00%     6.10%        -10       6.00%    9.50%    7.10%      0         6.00% 10.50%    8.50%     10
                  MC       5.00%    9.50%     7.00%         0        6.00%    9.50%    7.70%      0         7.00% 11.00%    9.00%     10
                  NC       9.00%   14.00%    11.30%         0        9.50%   14.50%   12.20%      0        12.00% 15.00%   13.60%     0
                  CCRC     6.00% 10.00% 7.30%              0         6.00% 10.50% 8.00%           0        7.00% 12.00% 9.30%          0

           Non-
                  IL       5.00% 9.00%        6.50%        0         6.00% 10.00% 7.20%           0        7.00% 11.00% 8.50%         20
           Core
                  AL        5.50% 9.00% 6.90%              10         6.00% 10.00% 7.60%           0        7.00% 11.00% 8.90%        20
                  MC        6.00% 10.00% 7.40%              0         7.00% 11.00% 8.10%          10        8.00% 11.00% 9.20%        10
                  NC       10.00% 14.00% 12.10%            20        11.00% 16.00% 12.80%         0        13.00% 16.00% 14.30%       50
                  CCRC     6.00% 10.00% 7.90%              10        7.00% 11.00% 8.60%           10       8.00% 12.00% 9.80%         40

                               Investment Class Spreads (bps)                           Location Spreads (Core Vs. Non-Core in bps)

                            A-B Change B-C Change A-C Change                               A     Change       B   Change     C      Change

           Core   IL        100      20     130        0       230     20      IL       110            0     80     -20      80       0
                  AL        100      10     140       10       240     20      AL       80            20     50      0       40      10
                  MC         70       0     130       10       200     10      MC       40             0     40     10       20       0
                  NC         90       0     140        0       230     0       NC       80            20     60      0       70      50
                  CCRC      70       0      130       0        200     0       CCRC        60         10     60     10       50      40

           Non-
                  IL         70      0      130       20       200     20
           Core
                  AL         70     -10     130       20       200     10
                  MC         70      10     110        0       180     10
                  NC         70     -20     150       50       220     30
                  CCRC       70      0      120       30       190     30

                  Source: CBRE Seniors Housing Cap Rate Survey H1 2019. Change from H2 2018 Survey.

12 |   CBRE SHMI Q3 2019
13 CBRE Research - Special Report on Active Adult
                                                                                                FIGURE 2: SENIORS HOUSING INVESTMENT PREFERENCE -
                                                                                                 % SELECTING ACTIVE ADULT AS BEST SENIORS HOUSING
 Key Takeaways                                                                                                SEGMENT FOR INVESTMENT

 •     Active adult housing has gained tremendous                                                       %
       market and investor appeal in recent years.                                                   25
 •     CBRE’s latest Senior Housing & Care Investor                                                                                                                 21.7
                                                                                                                                                     18.6
       Survey found that 22% of respondents believe                                                  20
       active adult offers the best investment opportunity,                                          15                                 11.0
       three times the response four years ago.                                                                 7.7
                                                                                                     10                      6.4
 •     Defining active adult housing is problematic; many
       terms are used for similar lifestyle seniors living                                              5
       product. Adding further complication, many terms                                                 0
       used within the industry are not necessarily the                                                      H2 2015 H1 2016 H1 2017 H1 2018 H1 2019
       same used for consumers.
 •     CBRE defines active adult housing as purpose-                                          Source: CBRE Research, CBRE Valuation & Advisory Services, Q2 2019. Seniors
       built multifamily rental housing for younger                                           Housing & Care Investors Surveys.

       seniors. It has a heavy emphasis on community
       space and activities. It can almost be thought of
       as “independent living unbundled.”
                                                                                          their current homes (age in place). However, given the
 Active Adult Research Series                                                             large size of the baby boom (74.5 million), if even only
                                                                                          a small percentage of the cohort chooses some form of
 Active adult is one of the hottest specialty housing                                     seniors housing, that will create significant increases in
 products today. Consumer and investor demand are                                         demand for lifestyle seniors housing including active adult.
 both rising rapidly. Over 40% of baby boomers are 65+
 years old; the oldest turns 73 in 2019. Older boomers are                                This Research Brief is the first of a series of papers on
 in active adult's entry target ages—late 60s to mid 70s.                                 the active adult sector. The series will define the product,
 Active Adult is often marketed to younger seniors, but the                               provide perspectives on its recent and future growth,
 average age of active adult residents is about 74 years.                                 explain the demographics behind the demand potential,
 Most seniors in the target age range will remain in                                      examine market performance in the sector, identify leading
                                                                                          companies active in the space and much more.

                                                FIGURE 1: MULTIFAMILY - SENIORS HOUSING SPECTRUM

                                                                        Lifestyle                                                  Healthcare
            Orientation/Services
                                                                             Transport,       Meals         Basic Care     ADL Care       Specialized      Long-Term
                                                   Shelter      Activities
                                                                              Laundry        Included        Services     Services***    Memory Care      Chronic Care

       Multifamily   Conventional Multifamily                      -               -           -               -              -                -              -
       Hybrid/
       Bridge
                     Active Adult, Etc.*                                       **             **              -              -                -              -
                     Independent Living                                                                     -              -                -              -
       Traditional   Assisted Living                                                                                                      -              -
       Seniors
       Housing       Memory Care                                                                                                                        -
                     Skilled Nursing Care                                                                                                              

        Source: CBRE Research, NICMAP ® Data Service. *Represents wide variety of lifestyle housing for seniors as shown on Figure 3. **These services and others
        often contracted out, some of activities also contracted out. **ADL = activities of daily living.

13 |     CBRE SHMI Q3 2019
14                   CBRE Research - Special Report on
                      Active Adult (CONT’D)  FIGURE 4: SENIORS LIFESTYLE HOUSING* -
                                                                                                                 SHARED CHARACTERISTICS
                                                                                       Category                                      Characteristics
Investor Interest in Active Adult Rises                                                                         Active, healthy, younger seniors, even sometimes empty-
                                                                                                                nesters in their 50s. Average age: late 60s through mid
Increased investor interest is evident in CBRE's "Seniors                              Target Market            70s. Most residents retired, but not all. Factors behind
                                                                                       (Consumer)               consumers' choice to select this housing predominantly
Housing & Care Investor Surveys." The Summer 2019                                                               "lifestyle," not related to healthcare or ability to care for
survey revealed that 22% of respondents—all from                                                                one self or spouse/partner.
the traditional seniors housing industry—believe that                                                           Wide array of activities offered, both those which
active adult offers the best investment opportunity                                                             management organizes and ones organized by
                                                                                       Community,               residents. Many activities are social and focus on
among the different types of traditional seniors                                       Activities               bringing residents together. Building a sense of
housing products and active adult. The response is                                                              community important.
up sharply from 7.7% only four years ago.                                                                       Emphasis on active living which is incorporated into
                                                                                       Active                   design, amenity options and programming.
In addition, traditional multifamily investors (and
developers) see active adult as an extension of                                                                 Simpler lifestyle including ability for traveling seniors
multifamily and a product type with significant                                        Lock ‘n’ Leave           to "lock and leave" their homes, minimal home
                                                                                                                maintenance, etc.
investment and yield opportunity.
                                                                                                                No healthcare or healthcare-related services provided
                                                                                       No Healthcare            (although sometimes properties are networked to
                                                                                                                healthcare providers).
Housing for Younger Seniors
                                                                                                                Limited services. "Unbundled" or "à la carte" services.
                                                                                                                Services usually more similar to conventional multifamily
Active adult is one of many kinds of housing designed                                                           than independent living. However, management may
                                                                                       Services
for younger seniors or housing where seniors are                                                                have contract agreements with service providers to
                                                                                                                provide services (e.g., Lyft). Often residents will provide
the predominant residents. Active adult can be                                                                  services to one another (free or for fee).
considered a subset of a broad category of "lifestyle"                                                          Designs commonly include features which would be
seniors housing (meaning no healthcare services are                                    Product Design           useful for aging residents such as minimal or no stairs,
                                                                                                                wider doors that could accommodate a wheelchair
provided).                                                                                                      (down the road), etc.
                                                                                                                Most new development by for-profit developers by both
Independent living is also considered "lifestyle," but                                                          seniors housing specialists and increasingly multifamily
is a separate category of housing primarily because                                    Development              developers. (Owners of existing assets are both for-profit
                                                                                                                and non-profit.) Many affordable programs for seniors
it is considered a traditional seniors housing product                                                          housing.
and because it provides communal dining as part of
the fees to live in the community.                                                    Source: CBRE Research, Q3 2019. *Excluding independent living.

FIGURE 3: SENIORS LIFESTYLE HOUSING* - PRODUCT NAMES AND BASIC DISTINGUISHING TRAITS

 Term/Type                                                                                 Comments
 Seniors              Generic term for any rental multifamily housing catering to or restricted to seniors. Not necessarily purpose-built for seniors. NIC** uses
 Apartments           both "seniors apartments" and "55+ seniors apartments" as generic terms for all rental seniors housing.
                      Often used for any kind of lifestyle seniors housing (excluding independent living). Sometimes used in reference to multifamily, but most
 55+                  55+ communities are for-sale single-family housing communities. Could be manufactured home communities also (typically homes
                      owned, land leased).
                      "62+" has a much more restricted usage and is used predominantly only in reference to communities with specific requirements of
 62+                  occupants being 62 or older.
                      Also, age-targeted. Terms used broadly to represent a wide-array of seniors lifestyle housing. Usually refers to multifamily, but sometimes
 Age-Qualified,       used for single-family communities. Terms sometimes used interchangeably with "active adult," but active adult has a tighter definition
 Age-Restricted       (see below).
 Active Lifestyle,    Terms often used in marketing. Could include any of the type of lifestyle housing catering to younger seniors, but usually connotes
 Active Living        multifamily. It's one way to avoid the term "seniors" in marketing.
                      Purpose-built multifamily rental. Industry generally sees it as a new, emerging concept. Typically newer and somewhat upscale, though
 Active Adult         more affordable product exists. Often designed for possible conversion to independent living (flex space that could be converted to a
                      commercial kitchen and dining hall).
 Independent          Informal term sometimes used for active adult by both industry and for consumers.
 Living “Light”

 Source: CBRE Research, Q3 2019. *Excluding independent living. Note that terminology usage remains in flux. **National Investment Center for Seniors Housing & Care.

14 |    CBRE SHMI Q3 2019
15            CBRE Research - Special Report on
                Active Adult (CONT’D)
Investor Interest in Active Adult Rises
For both industry and consumers, the terminology is               FIGURE 5: ACTIVE ADULT DEFINING CHARACTERISTICS
confusing and often not consistent. There is a blending
of concepts at different communities. The confusion is not   product                                     resident profile - caters to
surprising given the long list of common characteristics       multifamily, rental                           younger seniors (late 60s-mid 70s)
as outlined in Figure 4.
                                                               purpose built                                 active, healthy seniors
Figure 3 provides some of the different prevailing types
of seniors lifestyle housing and different terms used in       mostly relatively new                         usually above-average income*
the industry. But these are not hard and fast definitions,     private sector development                programming
and both terminology and product offerings are evolving.
                                                               emphasis on shared amenity space              mgmt organizes array of activities

                                                                                                             resident led activities encouraged
What is Active Adult?
                                                                                                             sense of “community” evolves
Understanding active adult starts with positioning it in
the housing spectrum (Figure 1), and distinguishing it
                                                              Source: CBRE Research, Q3 2019. *Most of the new product caters to upper-
from other similar housing product (Figure 3), a much         middle income residents, though there are more affordable communities as well.
more difficult task.

Active adult is blurring the line between conventional
multifamily and independent living. It is not considered     Developers and operators of active adult communities
either, nor is it part of the traditional seniors housing    are trying to create a new product appealing to baby
spectrum. However, prospective active adult residents        boomers ("not my parents' retirement home"), a product
often comparison shop conventional multifamily or            that emphasizes an active lifestyle and simpler way of
independent living communities. Moreover, active adult       living. Therefore one of the principal differences between
is attracting investor and developer interest from both      active adult and independent living is the emphasis on
traditional seniors housing and conventional multifamily     the active living programming and recreational facilities
companies (and the broader real estate investment            (e.g., aerobics classes). This focus has much less emphasis
world).                                                      in independent living in part due to independent living
                                                             residents being older—the average age is the mid 80s and
The principal differences between active adult and           rising.
conventional multifamily is the greater attention
to community space and to activities. While some             The other principal difference between active adult and
multifamily communities do have organized activities,        independent living is that the latter offers full meal service
they play a minimal role. In design, active adult and        and the former does not (hence, independent living comes
multifamily are quite similar, expect for more square        at a much higher price point). Additionally, independent
footage given to community space. However, many active       living communities offer more services than active adult.
adult communities are designed for possible evolution to     Often with active adult, these services are contracted out
independent living.                                          or "unbundled."

Active adult management also arranges for many resident      One of the challenges of active adult communities, however,
services, more than conventional multifamily. Active adult   is aging residents. As residents age, programming and
rents are usually at a premium to comparable multifamily     services may need to change or the residents may need
communities due to higher operating expenses (from           to change—both possibly problematic. Many active adult
more programming). Active adult lease-ups are usually        properties are being designed so they could be converted
much slower than conventional multifamily, though            to independent living communities in the future. The key
retention is reportedly higher. Prospective active adult     element is having flex space that could be converted to
residents visit a property several times before leasing,     dining and a commercial kitchen. Individual unit designs
and the leasing decision process is further slowed if a      also need to include features which make them adaptable
home sale is involved.                                       for older seniors.

15 |   CBRE SHMI Q3 2019
16                       About CBRE National Senior Housing -
                          Our National Presence
  CBRE has assembled a fully
  integrated team with the                                                            WA

  experience, expertise, and                                                                                 MT                 ND
                                                                                                                                                                                                                        ME

  successful track record                                                        OR                                                          MN                                                               VT
                                                                                                                                                                                                                   NH
  necessary to structure and                                                                   ID
                                                                                                                                SD
                                                                                                                                                         WI                                             NY
                                                                                                                                                                                                                   MA

  execute a transaction to                                                                                     WY                                                        MI                                        CT RI

  meet the client’s objectives.                                                        NV
                                                                                                                                NE
                                                                                                                                               IA                                                  PA
                                                                                                                                                                                                             NI
                                                                                                                                                                                   OH               MD       DE
                                                                                                                                                              IL    IN
                                                                                                      UT
                                                                                                                  CO                                                                     WV
                                                                                                                                       KS                                                          VA
                                                                                                                                                    MO
                                                                                CA                                                                                            KY

                                                                                                                                                                                                   NC
                                                                                                                                                                         TN

  45 States
                                                                                                 AR                                     OK
                                                                                                                  NM                                AR                                    SC

                                                                                                                                                                     AL             GA
                                                                                                                                                              MS

  890+ Communities                                                                                                               TX                 LA

  118,700+ Units/Beds                                                                                                                                                                         FL

       CBRE National Senior Housing Offices: San Diego, Houston, and Boston   States where CBRE Team Members have conducted business         CBRE Senior Housing & Care Valuation & Advisory Services Offices

                                    INVESTMENT SALES                                                                             DEBT TRANSACTIONS
                                 TRANSACTIONS SINCE 2014                                                                             SINCE 2014
                                             $7.2B+                                                                                     $6.9B+
                               From 2014 to Q3 2019, principals                                                                 From 2014-2019 CBRE
                                  of the CBRE National Senior                                                                National Senior Housing has
                                 Housing team completed more                                                                 completed over $6.9 billion
                               than $7.2 billion in senior housing                                                           in debt transaction volume.
                                  investment sales, investment
                               banking, and leasing transactions
                                spanning across multiple states.

                     COMPLETED IN 2019                                                                              DEBT ORIGINATIONS
                        $1.78B+                                                                                            TOP 2
                    Since the beginning of                                       CBRE National Senior Housing was ranked Top Two Senior Housing
                 2019, CBRE National Senior                                        Originator in the nation from 2010 through 2016 and was the #1
                  Housing closed over $1.78                                       Senior Housing/Age Restricted Originator in the U.S. in 2013 and
                  billion in investment sales                                     2014 and #2 in 2015. The team has originated $4.2 billion in debt
                    and debt transactions                                          transactions over the past four years. CBRE is the largest agency
                        across the U.S.                                          originator (Fannie/Freddie) in the nation, with more than $18 billion
                                                                                     of loan volume in 2017, and has been Freddie Mac’s #1 Seller
                                                                                                      Servicer from 2009 to 2017.

16 |      CBRE SHMI Q3 2019
CBRE NATIONAL SENIOR HOUSING
 REPRESENTATIVE INVESTMENT PROPERTY
 TRANSACTIONS - 2015 FORWARD
 Today’s complex and constant changing market environments require special solutions. CBRE SH Team
 Members consistently achieve the highest sale price/best debt terms in the industry for their Clients.

 RECENT PORTFOLIO SALES TRANSACTIONS
              Sunwest Portfolio                     Vintage Portfolio                     The Maestro Portfolio
              $1.29 billion                         $1.29 billion                         $921,000,000
              National Portfolio                    Northern and Southern CA (21)         Alberta and Quebec, Canada
              11,096 IL/AL/MC units/beds            and Western WA (1)                    8,206 IL/AL/MC units/beds
              Client was The Blackstone Group       3,054 IL/AL/MC units                  Client was Maestro Funds
                                                    Client was Vintage Senior Living
                                                    and their private investors

              The Fountains Portfolio               Brightview I                          Programmatic Equity Raise
              $640.0 million                        $498,500,000                          $300,000,000
              National Portfolio                    National Portfolio                    National Portfolio
              (11 states)                           (5 States)                            Client was LCS
              3,637 IL/AL/MC and Entry Fee          1,584 IL/AL/MC units/beds
              CCRC units/beds                       Client was Affiliate of Prudential
              Client was Fountains Senior Living
                                                    Real Estate Investors
              Holdings, LLC
              Sunwest Managed Portfolio             Brightview II                         The Garden Empire Portfolio
              $364,250,000                          $363,500,000                          $307,500,000
              National Portfolio                    National Portfolio (3 States)         NJ and NY
              (11 states)                           1,117 IL/AL/MC units/beds             933 IL/AL/MC units/beds
               3,054 IL/AL/MC and Cottages          Client was an Affiliate of The        Client was an Affiliate of The
              Client was Sunwest                    Shelter Group                         Carlyle Group

              CCRC Portfolio                        Mid-Atlantic Portfolio                MorningStar 4 Pack
              $186,500,000                          $186.2 million                        Confidential
              Dallas, TX                            Greater Baltimore, Maryland           CO, IA, NM and OR
              1,104 units                           (5) and Greater Washington,           415 IL/AL/MC units
              Client was LCS                        D.C. (2)                              Client was Confluent
                                                    526 AL/MC units
                                                    Client was an affiliate of Harrison
                                                    Street

              Five Allegro Communities              Kronos FL 2 Pack
              $172,500,000                          Confidential
              FL and KY                             Jacksonville & Stuart, FL
              705 IL/AL/MC/NC units/beds            263 units
              Client was Almanac Realty             Client was Kronos

 RECENT SINGLE ASSET SALES TRANSACTIONS
              MorningStar at RidgeGate              Parker Senior Living                  Renaissance on Peachtree
              Confidential                          Confidential                          $78,600,000
              Denver, CO                            Parker, CO                            Atlanta, GA
              224 IL/AL/MC units                    191 IL/AL/MC units/beds               229 IL/AL units/beds
              Client was AEW                        Client was Faestel Properties         Client was The Carlyle Group
                                                                                          and Formation Development

               Class A IL/AL Community              Watermark at Logan Square             Sunrise of Severna
               $77,000,000                          $72,500,000                           $72,000,000
               Scottsdale, AZ                       Philadelphia, PA                      Severna Park, MD
               216 IL/AL units/beds                 463 IL/AL/MC/SNF units                156 IL/AL/MC units
               Client was Affiliate of Prudential   Client was Watermark Retirement       Client was Sunrise Senior Living
               Real Estate

               The Village at Arboretum             The Village of Tanglewood             Meadowbrook
               $72,000,000                          $66,850,000                           $60,000,000
               Austin, TX                           Houston, TX                           Agoura Hills, CA
               172 IL units                         188 IL units                          156 IL/AL/MC units
               Client was BayNorth/                 Client was BayNorth/Bridgewood        Client is Confidential
               Bridgewood JV                        JV

17 |   CBRE SHMI Q3 2019
Woodhaven                            MorningStar of Littleton              The MorningStar Portfolio
              Confidential                         $45,500,000                           $45,000,000
              Conroe, TX                           Littleton, CO                         Colorado Springs, CO
              157 IL/AL/MC units                   85 AL/MC units                        112 AL/MC units
              Client was Padua Realty              Client was PREI/MSL JV                Client was Confluent Develop-
                                                                                         ment/MorningStar Senior Living

              St. Andrew’s Village                Kennewick Campus                       The Solana Horsham
              $42,500,000                         $40,500,000                            $31,500,000
              Aurora, CO                          Kennewick, WA                          Greater Philadelphia, PA
              (Greater Denver)                    138 IL/AL/MC units                     76 AL/MC units
              246 CCRC units/beds                 Client was Bourne Financial            Client was CSH/Formation-Shel-
              Client was RSF Partners                                                    bourne Partners JV

              Cappella of Grand Junction
              Confidential
              Grand Junction, CO
              66 AL/MC units
              Client was Confluent
              Senior Living

 RECENT DEBT TRANSACTIONS
              The Fountains Portfolio             The Ranger Portfolio                   Large National Portfolio
              $410,000,000                        $348,592,000                           (Confidential)
              National Portfolio (11 states)      National Portfolio                     $238,250,00
              3,637 IL/AL/MC and Entry Fee        2,528 IL/AL/MC units                   National Portfolio
              CCRC units/beds                     Client was Formation Capital           1,702 IL/AL/MC/SNF units
              Client was Watermark Retirement     and NorthStar Realty Finance
              & NorthStar Realty Finance

              LCS Portfolio                       CA Senior Living Portfolio             DiNapoli Portfolio
              $120,000,000                        $104,000,000                           $91,840,000
              Various Locations                   Various Locations                      Various Locations, CA
              1,104 IL/AL/MC/SNF units            85 AL & 155 MC units                   568 IL/AL/MC units
              Client was LCS/Aspect               Client was Venture and a Global        Client was DiNapoli Capital
                                                  Investment Manager                     Partners

              The Belmont Village Portfolio       The Fountains Portfolio                The Bonaventure Portfolio
              Confidential                        Supplemental                           $72,466,000
              Thousand Oaks, CA and Scottsdale,   $75,401,000; $485MM+ Combined          Washington and Oregon
              AZ                                  Various Locations
                                                                                         453 IL/AL units
              275 AL/MC units                     3,484 IL/AL/MC/SNF units
              Client was Belmont Village & Blue   Client was NorthStar REalty Finance/   Client was NorthStar Realty
              Moon Capital Partners               The Freshwater Group                   Finance

              The Springs at Lake Oswego          The Virginian                          The Bristal Portfolio
              $66,400,000                         $65,200,000                            $62,832,000
              Lake Oswego, OC                     Fairfax, VA                            Huntington, NY
              (Portland MSA)                      306 CCRC units                         118 AL units
              216 IL/AL/MC units                  Client was Focus Healthcare            Client was The Engel Burman
              Client was Harrison Street/The                                             Group and Harrison Street Real
              SPrings Living                                                             Estate Capital

              The Springs Living Portfolio        The Seattle Portfolio                  Village of Southampton
              $61,000,000                         $60,020,000                            Confidential
              Wilsonville & Carmen Oaks, OR       Seattle MSA (4 properties)             Houston, TX
              294 AL/MC units                     368 IL/AL units                        204 IL/AL/MC
              Client was The Springs Living       Client was The Carlyle Group           Client was Bridgewood/Harrison
                                                  and Capitol Seniors Housing            Street

              Arbor Terrace Portfolio
              $50,525,000
              Atlanta MSA
              236 IL/AL/MC units
              Client was Arcapita

18 |   CBRE SHMI Q3 2019
19CBRE Advantage
       CBRE Cap, the investment banking business of CBRE, provides independent M&A advisory, acts as a global
       placement agent, actively trades real estate LP secondary interests, and advises institutions on real estate
       investments. Lisa Widmier has been integrated into this practice to provide specialized investment banking
       services to clients in the senior housing industry.

                                              Portfolio   Public         Valuation/Fairness
                                               Sales      M&A                Opinions

                                     Recapitalizations                                    Financing

                                     Comingled                                            Buyside
                                     Fund Raising                                         Advisory

                                                           INV ESTMENT
                                                             BA NKING
                                     Joint Ventures                               Restructuring

                                                Direct                        Portfolio
                                              Secondary     Trading            Sales

               The CBRE platform uniquely combines the critical components for a successful outcome.

                          Highly Experienced Investment Banking Team
                          CBRE offers an experienced senior investment banking team with expertise in all forms of
                          capital raising and advisory. Our knowledge base provides the background to structure
                          an opportunity properly and react to change.

                          World Leading Asset Level Expertise
                          CBRE is a leader in real estate, senior housing, and local market knowledge. This
                          allows us to leverage expertise encompassing all aspects of real estate and to evaluate,
                          underwrite, and position assets and industry fundamentals to optimize outcomes.

                          Global Capital Distribution
                          CBRE has the market presence to access providers of real estate capital in all of the major
                          markets around the world. This capability is enhanced by constant investor dialogue,
                          global infrastructure, and a strong product pipeline, which enables us to utilize live
                          market intelligence to align investment capital targeted investment opportunities.

19 |    CBRE SHMI Q3 2019
Today’s complex and constantly changing market environments require special
solutions. The professionals at CBRE have the experience, knowledge, connections
and track record to provide you with the best solutions in the marketplace and the
                ability and determination to execute those solutions.

       Investment Brokerage | Structured Debt | Investment Banking
            Consulting Services | Valuation | Asset Management

             4301 La Jolla Village Dr., Suite 3000, La Jolla, CA 92122
         Please visit our website at cbre.com/nationalseniorhousing
You can also read