Iluka Resources Limited - BMO 29th Global Metals & Mining Conference Tuesday 25 February 2020 Tom O'Leary, Managing Director
←
→
Page content transcription
If your browser does not render page correctly, please read the page content below
Iluka Resources Limited
BMO 29th Global Metals & Mining Conference
Tuesday 25 February 2020
Tom O’Leary, Managing Director

Disclaimer – Forward Looking Statements                                                                                                                                                                       2

This presentation has been prepared by Iluka Resources Limited (Iluka). By accessing this presentation you acknowledge that you have read and understood the following statement.

This document provides an indicative outlook for the Iluka business in the 2020 financial year. The information is provided to assist sophisticated investors with the modelling of the company, but
should not be relied upon as a predictor of future performance. The current outlook parameters supersede all previous key physical and financial parameters.

This information is based on Iluka forecasts and as such is subject to variation related to, but not restricted to, economic, market demand/supply and competitive factors. It is Iluka’s
approach to modify its production settings based on market demand, and this can have a significant effect on operational parameters and associated physical and financial
characteristics of the company.

Forward Looking Statements

This presentation contains certain statements which constitute “forward-looking statements”. Often, but not always, forward looking statements can generally be identified by the use of forward
looking words such as “may”, “will”, “expect”, “plan”, “believes”, “estimate”, “anticipate”, “outlook” and “guidance”, or similar expressions, and may include, without limitation, statements regarding
plans; strategies and objectives of management; anticipated production and production potential; estimates of future capital expenditure or construction commencement dates; expected costs or
production outputs; estimates of future product supply, demand and consumption; statements regarding future product prices; and statements regarding the expectation of future Mineral Resources
and Ore Reserves.

Where Iluka expresses or implies an expectation or belief as to future events or results, such expectation or belief is expressed in good faith and on a reasonable basis. No representation or
warranty, express or implied, is made by Iluka that the matters stated in this presentation will in fact be achieved or prove to be correct.

Forward-looking statements are only predictions and are subject to known and unknown risks, uncertainties, assumption and other important factors that could cause the actual results, performances
or achievements of Iluka to differ materially from future results, performances or achievements expressed, projected or implied by such forward-looking statements. Readers are cautioned not to
place undue reliance on these forward-looking statements, which speak only as of the date thereof. Such risks and factors include, but are not limited to: changes in exchange rate assumptions;
changes in product pricing assumptions; major changes in mine plans and/or resources; changes in equipment life or capability; emergence of previously underestimated technical challenges;
increased costs and demand for production inputs; and environmental or social factors which may affect a licence to operate, including political risk.

Capital estimates include contingency and risk allowances commensurate with international estimating classification systems.

To the extent permitted by law, Iluka, its officers, employees and advisors expressly disclaim any responsibility for the accuracy or completeness of the material contained in this presentation and
exclude all liability whatsoever (including in negligence) for any loss or damage which may be suffered by a person as a consequence of any information in this presentation or any error or omission
therefrom. Iluka does not undertake to release publicly any revisions to any forward-looking statement to reflect events or circumstances after the date of this presentation, or to reflect the occurrence
of unanticipated events, except as may be required under applicable securities laws.

No independent third party has reviewed the reasonableness of the forward looking statements or any underlying assumptions.

Non-IFRS Financial Information

This document contains non-IFRS financial measures including cash production costs, non production costs, Mineral Sands EBITDA, Underlying Group EBITDA, EBIT, free cash flow, and net debt
amongst others. Iluka management considers these to be key financial performance indicators of the business and they are defined and/or reconciled in Iluka’s annual results materials and/or Annual
report. Non-IFRS measures have not been subject to audit or review.

All figures are expressed in Australian dollars unless stated otherwise.
Global Assets and Portfolio                                                                                                                                          3

60 years experience in mineral sands exploration, project development, mining, processing and marketing

                                                                                   AMSTERDAM
                                                                       LONDON
                                                                                  ANTWERP

                                                 NEWCASTLE                       NULES
                                 CINCINNATI                                     CASTELLON
                                              VIRGINIA
                                              RALEIGH                                                                                 QINGDAO
                                                                                                                                      ZHENJIANG
                                                                                                                                      SHANGHAI
                                                                                                                                    XIAMEN
                                                                                                    GUJARAT

                                                             SIERRA LEONE                             PUTTALAM            PORT KLANG
                                                                                                                            SINGAPORE

          OPERATIONS AND PROJECTS
          MARKETING AND DISTRIBUTION                                                                                MINING AREA C
          ROYALTY ASSET                                                                     JOHANNESBURG
                                                                                                                      MID WEST           SOUTH AUSTRALIA
          CORPORATE OFFICE
                                                                                                                     PERTH                        NEW SOUTH
                                                                                                                 SOUTH WEST          ADELAIDE     WALES / VICTORIA

          World class royalty over iron ore produced from BHP’s Mining Area C (MAC) province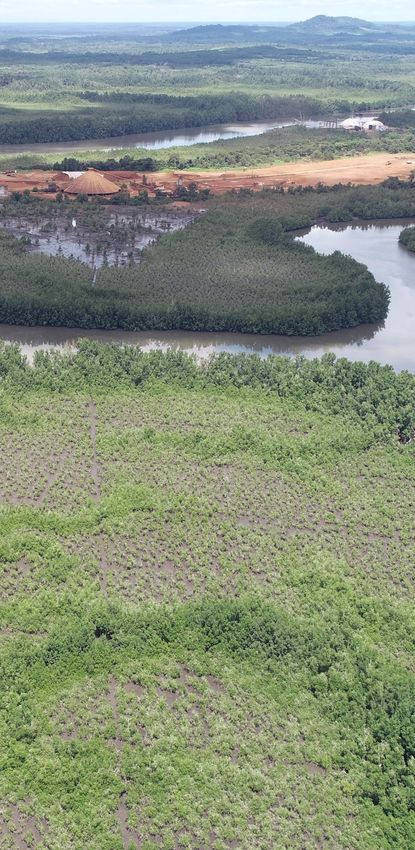
Solid Underlying Results                                                                                                                                          4

                                    Over the past two years Iluka has delivered two of its best results in the company’s history

                                            Mineral Sands Revenue $1,193 million,                         Underlying Group EBITDA $616 million,
                                                     down 4% from 2018                                               up 3% from 2018
                                          $ million          Mineral Sands Revenue                                          Underlying Group EBITDA
                                                                                                         $ million
                                            1400                                                          700
                                            1200                                                          600
                                            1000                                                          500
                                             800                                                          400
                                             600                                                          300
                                             400                                                          200
                                    301      200                                                          100
                                               0                                                            0
                                                      2015      2016   2017    2018   2019                           2015      2016      2017
                                                                                                                                            279    2018       2019

                                                                                                                                  $140m
                                                      17% increase in                                                         Free cash flow
                                               revenue per tonne to A$1,654/t
                                                                                                                     40% free cash flow returned to
                                                          Z/R/SR
                                                                                                                             shareholders
                                                     (2018: A$1,415/t)                                                13 cents full year dividend, fully franked

Jacinth-Ambrosia, South Australia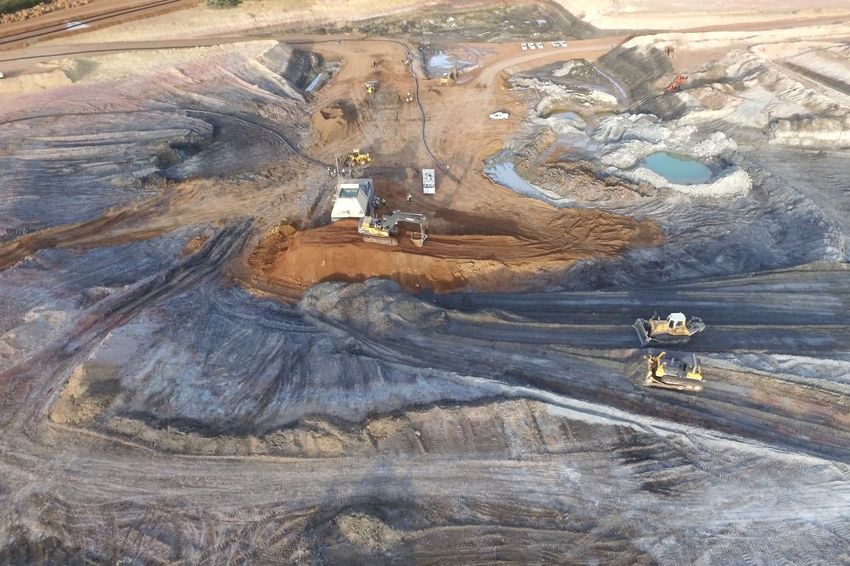
Zircon Overview                                                                                                                                                                  5

Business and consumer confidence in the zircon market continued to be affected by a subdued outlook for global economic growth

                                                                                                                               Iluka zircon sales volumes
Result                                                                                                                                    (2019)
• Full year zircon sales of 274kt (2018: 379kt) – in line with guidance                                                   Concentrate                    Premium
• Full year zircon production of 322kt (2018: 349kt)                                                                         30%                           42%

Pricing
• 2019 weighted average received price for zircon (premium and standard grades) up 10% to
  US$1,487/t (2018: US$1,351/t)
                                                                                                                            Standard
• Pricing achieved was relatively stable given market uncertainty in 2019                                                     28%

                                                                                             Iluka Zircon Reference Price
Supply / Demand
                                                                                             US$/t
• Market conditions experienced over 2019:                                                   1600           Zircon Reference Price less freight
                                                                                                            Freight
  ‒   political and trade tensions affected business sentiment and customer purchasing                      Zircon price (Premium and Standard)
  ‒   ceramics demand particularly affected, largely China, but also India and Europe        1200

  ‒   customers focus on cost reduction during uncertainty, supported demand for
      concentrate and Standard products                                                       800
• Subdued Q1 2020 outlook given economic conditions and seasonally low quarter, additional
  uncertainty with COVID-19 outbreak
                                                                                              400
• Medium-term outlook for supply tightness remains

                                                                                                0
                                                                                                     1Q16     3Q16      1Q17     3Q17      1Q18   3Q18   1Q19      3Q19   1Q20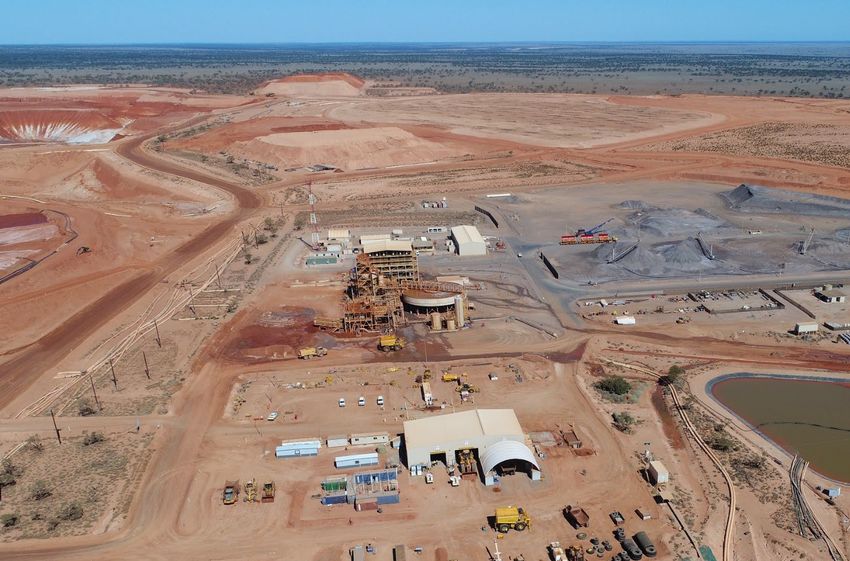
High Grade Titanium Feedstock Overview                                                                                                                                                               6

Market conditions remain positive for high grade titanium feedstocks with Iluka’s sales constrained by production in 2019. Iluka secured
take-or-pay offtake agreement with Kronos, providing further revenue certainty.
                                                                                                      Iluka sales volumes by destination                   Iluka sales volumes by market
Result                                                                                                               (2019)                                             (2019)
• Full year high grade feedstock sales of 407kt, 9% lower year-on-year (2018:448kt)                                               Americas
                                                                                                                                    14%
• 2019 sales were production constrained given limited inventories                                       Asia                                                                                  Welding
                                                                                                         35%                                                                                    6%

                                                                                                                                                                                                Ti Sponge
Pricing                                                                                                                                                 TiO2                                     & Others
                                                                                                                                                       Pigment
• Positive dynamics for high grade feedstock pricing, largely due to growth of chloride pigment and                                                      88%
  welding market requirements
                                                                                                                                         EMEAI 2
• Weighted average price for rutile1 products up 20% to US$1,142/t (2018:US$952/t)                                                        51%

• Take-or-pay offtake agreement with Kronos for 75% of standard grade rutile from Sierra Rutile
                                                                                                         Global Rutile Supply Outlook
                                                                                                         kt TiO2
                                                                                                         800
Supply/ demand
• Tight supply conditions for high grade feedstocks                                                      600

• Customers anticipating steady sales at start of 2020
• Welding and sponge markets remain strong                                                               400

                                                                                                         200

                                                                                                           0
                                                                                                            2013      2014     2015      2016   2017   2018 2019f 2020f 2021f 2022f 2023f
 1.   Excludes HYTI products.
 2.   Europe, Middle East, Africa and India.                                                                    Production outlook excludes Iluka’s rutile projects: Sembehun and Balranald.
                                                                                                                Source: Iluka and TZMI
High Grade Titanium Feedstock – Offtake Agreements                                                                                                                              7

A significant proportion of Iluka’s high grade feedstock production – 70% in 2020 – now underpinned by longer term take-or-pay agreements

                                                                High Grade Titanium Sales, Production Outlook and Take-or-Pay Contracts
                                                                 kt
 • Take-or-pay contracts deliver revenue certainty for Iluka    500                               2020 production outlook
   and security of supply for customers
                                                                                2019 sales
 • Contracts contain favourable terms for Iluka delivering      400
   exposure to pricing upside while limiting risk on downside

 • Cataby development returns are underpinned by take-or-       300
                                                                                                                                                              Rutile Contract 3
   pay contracts for minimum 4 years, which in 2020
   represents 82% of guided production of 225kt of                                                                                                            Rutile (HYTI) Contract
   synthetic rutile                                             200
                                                                                                                                                              Rutile Contract 2
 • Sierra Rutile production subject to three contracts with
   minimum 2020 take-or-pay volumes being in aggregate          100                                                                                           Rutile Contract 1
   ~115kt of rutile
                                                                                                                                                              SR Contracts
                                                                      0
                                                                                   2019                   2020                  2021                   2022

                                                                          Note: Includes 30kt lower grade HYTI contract volume from Jacinth Ambrosia
Operations and projects

                          Cataby, Western Australia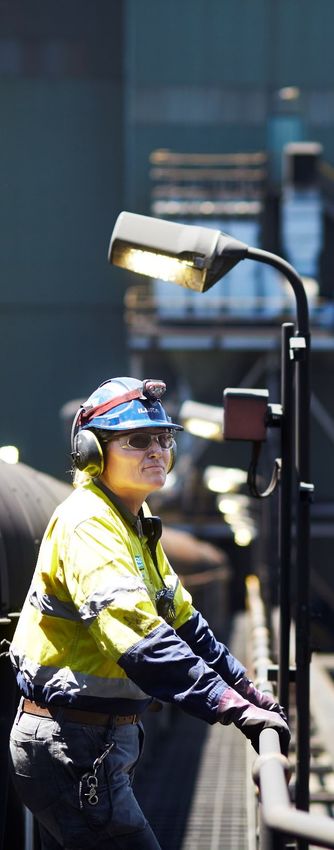
Projects Delivered
Key Features
                                                                                                                                                                     9

In 2019, Iluka successfully delivered five projects across the portfolio including the commissioning and ramp-up of Cataby and
expansion projects at Sierra Leone and SR2 kiln major maintenance outage

                                                   Total 2019 Capital Expenditure of $198 million

      Cataby,                            Gangama                      Lanti Expansion,                  Ambrosia Mine                   SR2 Kiln Major
  Western Australia                     Expansion,                      Sierra Leone                        Move,                        Maintenance
                                       Sierra Leone                                                     South Australia                    Outage,
                                                                                                                                       Western Australia

• $270 million capex             • Doubling of capacity             • Doubling of capacity           • $22 million capex in 2019     • $35 million capex
• Construction of new mine and   • Duplication of existing design   • Second mining unit and         • Commissioning complete –      • SR2 kiln reline
  infrastructure                                                      doubling of concentrator         delivered ahead of schedule
                                 • Delivered on schedule                                                                             • New rotary cooler shell and
                                                                      capacity                         and under budget
• Highway upgrade                                                                                                                      quench tower
                                 • Reached design rates end H1
                                                                    • Delivered on schedule          • Smooths zircon production
• Processing plant upgrades                                                                                                          • Ramp up rate exceeded
• Utilises existing processing                                      • Reached design rates late Q3                                     expectations
  and kiln assets
Mineral Sands Operational Outlook                                                                                                       10

      Cataby / South West                         Jacinth-Ambrosia / Mid West                             Sierra Leone

Cataby commissioned and near nameplate capacity        Mining moved to Ambrosia deposit        Lanti and Gangama expansions completed
    Kiln refurbished for next 4 year campaign                                                        Four mining units operational
           2020 Production Outlook                         2020 Production Outlook                    2020 Production Outlook
             ~70kt zircon (incl ZIC)                         ~200kt zircon (incl ZIC)                        ~170kt rutile
                  ~25kt rutile                                  ~30kt rutile (HyTi)                        ~5kt zircon (ZIC)
             ~225kt synthetic rutile                   ~105kt ilmenite (for sale or upgrade)

                  Portfolio of operations weighted towards premium zircon and high-grade titanium products
Overview of Growth Projects 11
Key Features
Iluka is progressing initiatives across its growth projects to extend and expand its existing asset base
Atacama, Wimmera, Eneabba Mineral Sands Recovery,
South Australia Victoria Western Australia
Satellite deposit located 5km from JA operation Significant zircon and rare earth project which is Monetise rare earth minerals contained in
located in the Murray Basin, Victoria monazite-rich stockpile from historic mining
Potential to add material zircon production
Zr
Other
utilising existing infrastructure
Pre-feasibility study progressing with further Simple process with low capital expenditure
Resource of 73Mt @ 12.0% HM for 8.7Mt enhancements to processing flow-sheet
of in situ Heavy Minerals Modular expansion project with construction of
Test pit product samples with customers Phase 1 underway (first sales Q3 2020)
Pre-feasibility study due mid-2020
First production possible as early as 2022-23 Strategic project given diversification into the Phase 2 pre-feasibility study underway
rapidly growing rare earths market
Sembehun, SR1 restart, Balranald,
Sierra Leone Western Australia New South Wales
Re-scoping development options following SRL Refurbishing SR1 kiln is a low risk and low capex Large, deep and high grade rutile rich deposit
learnings and to optimise risk-return growth opportunity ($30–50m capex)
Mined through innovative underground mining
Ti
The deposits associated with Sembehun are the
Plan to add 110–120ktpa of synthetic rutile method via directional drilling
world’s largest rutile deposit globally
Sembehun is the next expansion deposit for SRL Engineering for restart is now complete with Trial underground mining to be completed by
long lead time items ordered mid-2020 at a cost of $35m
Targeting decision on preferred pathway in 2020
Subject to securing ilmenite feed source and Execution planning to commence H2 2020
appropriate commercial arrangements, potential
first production within twelve monthsGrowth Pipeline Summary 12
ASSESS SELECT DEVELOP EXECUTE OPERATE
Region Mineral Resource1 Preliminary Feasibility Definitive Feasibility
Scoping Study Project execution Operate and maximise
Study Study
361Mt @ 4.8% HM for Jacinth-
Eucla Basin Atacama
17.4Mt In Situ HM Ambrosia
195Mt @ 17.2% HM for
Murray Basin Wimmera Balranald
33.4Mt In Situ HM
South
Mid West / South 994Mt @ 5.6% HM for Eneabba SR1 Kiln Eneabba
West Cataby
West WA 55.6Mt In Situ HM (Phase 2) Restart (Phase 1)
Deposits
739Mt @ 1.1% Rutile for
Sierra Leone Sembehun Lanti Gangama
8.2Mt In Situ Rutile
673Mt @ 8.1% HM for
Sri Lanka Puttalam
54.6Mt In Situ HM
No Resource estimate Resource estimate Reserve estimate Other
1. Refer to the 2019 Annual Report for additional information.
The Mineral Resource (MR) information on this indicative growth pipeline summary is extracted from the company’s previously published MR statements and are available at: www.iluka.com.au . Iluka confirms that it is not aware of any new information or
data that materially affects the information included in the original market announcements and, in the case of estimates of Mineral Resources or Ore Reserves, that all material assumptions and technical parameters underpinning the estimates in the
relevant market announcement continue to apply and have not materially changed. Iluka confirms that the form and context in which the Competent Person’s findings are presented have not been materially modified from the original market announcement.
All Mineral Resource figures are estimates.Iluka’s commitment to sustainability 13
Iluka Group TRIFR down to 2.9 in 2019 (3.5 in 2018) and ongoing commitment to sustainability
Iluka’s Sustainability Approach Female
Key Pillars
2.9 representation
• Health and Safety Group TRIFR 2019
• People (2018: 3.5) 33% 38%
• Social Performance Exec. Mgt. Board
• Environmental Stewardship
• Economic Responsibility and Governance
Mid West Chamber of
Commerce and Industry 686
Approach Business Excellence hectares
• Accountability and transparency through setting of targets Award for Aboriginal rehabilitated in 2019
and performance linked to incentive plans Engagement (2018: 808 hectares)
• Ongoing trust of communities in which we operate,
earned from delivering on commitments.
• Developed steps to understand physical climate risks and
opportunities, in line with the TCFD LTI free April 2020
Annual Sustainability
at Sierra Rutile in 2019
Report release
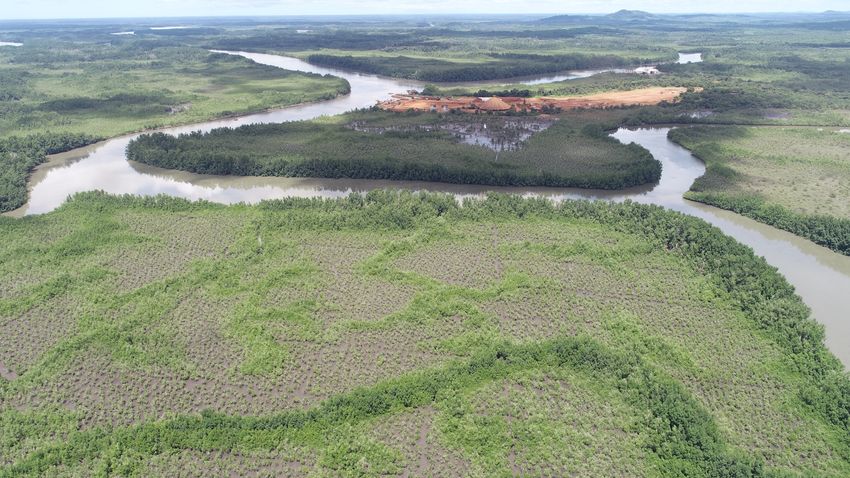
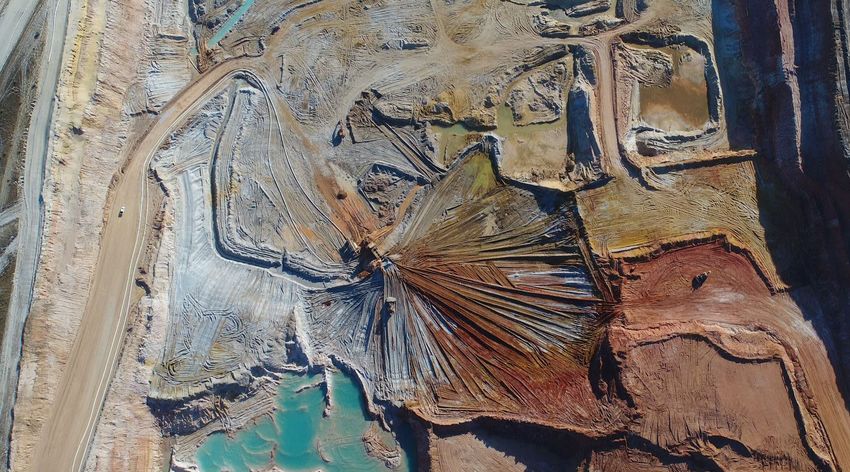
Capel, Western AustraliaOutcome of corporate and capital structure review
Source: Google Maps – Imagery 2020 CNES / Airbus Maxar Technologies, Imagery CNES / Airbus, Landsat / Copernicus, Maxar Technologies, Map data 2020Outcome of corporate and capital structure review 15
Iluka’s corporate and capital structure review has concluded that a demerger of Iluka’s royalty business is the optimal structure to deliver
sustainable value. Upon demerger, the MAC Royalty would be the cornerstone asset for Australia’s leading ASX-listed royalty company
Outcome of review Demerger benefits
• As announced on 31 October 2019, Iluka has been conducting a 1. Unlock significant shareholder value: given that Iluka’s mineral
formal review of the corporate and capital structure of its two sands operations and royalty business have distinct business
principal businesses – its mineral sands business and the MAC characteristics, risk-return profiles and commodity mixes
Royalty business
2. Greater investor choice: enabling shareholders to hold shares in
• The review has concluded that a structural separation of the two one or both of Iluka and RoyaltyCo based on individual investment
businesses by way of a demerger of the MAC Royalty business objectives and risk tolerances
represents the optimal structure to deliver sustainable value
3. Distinct growth strategies: the Board and management of each
• The proposed demerger will establish two separately listed ASX company is empowered to focus on tailored growth strategies
vehicles – Iluka and RoyaltyCo1 – shareholders will receive 1 share
in RoyaltyCo for each existing Iluka share 4. Discipline when pursuing growth: each business can apply
appropriate capital allocation and project evaluation metrics which
• Iluka will retain a minority shareholding interest of 15% align with the risk-return profile of each business
• Iluka has engaged with the ATO on demerger tax relief and 5. Distinct capital structure: each business can tailor its capital
submitted a final ruling application – Iluka is confident of receiving structure and financial policies to its business characteristics
a favourable ruling in due course
• Additional information about the demerger including transaction
timetable will be provided at the AGM on 9 April 2020
1. RoyaltyCo registered company name and branding will be announced in due course.Overview of Iluka’s two distinct businesses 16
Iluka’s two principal businesses have distinct business characteristics, risk-return profiles and require different and tailored growth strategies.
Consequently, a demerger is expected to unlock the full potential of both businesses over time.
Mineral Sands business Royalty business (RoyaltyCo post demerger)
Business The leading pure play mineral sands company globally Australia’s leading ASX-listed resources royalty company
Current commodity Mineral sands (zircon and titanium feedstocks) Iron ore (primarily)
mix
Key assets Cataby, Western Australia MAC Royalty, Western Australia
Jacinth Ambrosia, South Australia Portfolio of four small royalties (one in production)
Sierra Rutile, Sierra Leone
Revenue (2019) $1,193 million $85 million1
EBITDA (2019) $531 million $85 million (prior to standalone company corporate costs)
Business activities Large-scale mining operations, engineering and project delivery Management of existing royalty portfolio
Exploration and geology Identifying and acquiring value accretive royalty investments
Occupational health & safety and employee management
Customer marketing & offtake
Relative cost of capital Higher Lower
Capital intensity2 Yes No
Operating cost Yes No3
exposure
Dividend policy 40% of FCF (not required for investment or balance sheet purposes) Policy will be to payout 100 per cent of net profit after tax (subject to any future
RoyaltyCo Board determination)
Key growth drivers Mineral sands project delivery MAC South Flank development – more than doubling CY19 production by 2023
Mine expansion and life extension Mine expansions, extensions and exploration success in the MAC Royalty Area
Exploration success Ability to invest in or acquire value accretive royalty interests over time
1. Excludes income of $0.6 million from other royalties in portfolio.
2. Capital intensity represents exposure to capital expenditure for underlying mines.
3. MAC Royalty has no operating cost exposure other than to the extent operating costs impacts the economic viability of the underlying mine.Introduction to RoyaltyCo 17
RoyaltyCo’s vision is to be Australia’s leading resources royalty company, providing shareholders with a cash flow generative and
low operational risk investment vehicle with strong growth potential
RoyaltyCo overview MAC Royalty is RoyaltyCo’s cornerstone asset
• Upon successful demerger, RoyaltyCo will be Australia’s leading listed Ongoing 1.232% of Australian One-off $1 million per 1 million dry
resources royalty company with MAC Royalty being its cornerstone asset dollar denominated revenue from the metric tonne increase in annual production
MAC Royalty Area
• Portfolio complemented by four other significantly smaller royalties1
• Headquartered Perth, Western Australia Mining Area C annual production to 1,028km royalty area vs combined
more than double by 2023 from North and South Flank envelope of 360km
• Principal business will be management of existing royalty portfolio and, over 60Mtpa (WMT) produced in 2019
time, building a diversified royalties business by making value accretive
royalty investments that provide earnings growth and diversification
145Mtpa (WMT) target production
• Dividend policy will be to payout 100% of net profit after tax (subject to any by 2023 over a 25+ year mine life
future RoyaltyCo Board determination), with a lean corporate structure
• Chair and CEO will be Jenny Seabrook and Julian Andrews respectively $85 million of EBITDA for the
(selection for remaining Board and management underway) MAC Royalty in the year ended 31
December 20192
1. RoyaltyCo will also own four other significantly smaller royalty interests which have been established by Iluka in historical transactions comprising one producing royalty, Yoongarillup Mineral Sands Mine operated by Doral
Mineral Sands (2019 revenue $0.6 million). The other three royalties relate to non-producing projects.
2. MAC Royalty EBITDA is shown prior to the inclusion of standalone company corporate costs and does not include royalty income from the four other significantly smaller royalty interests (refer to footnote1).MAC Royalty growth profile and revenue potential 18
Considerable growth to underlying Mining Area C production over coming years - MAC Royalty earnings are determined based on sales
volumes, iron ore pricing, the ratio of lump to fines, the premium lump attracts over fines and the USD:AUD exchange rate
MAC Royalty EBITDA and Mining Area C sales volumes MAC Royalty revenue set to grow with South Flank development
Mt, $m
150 • Steady state MAC Royalty revenue contribution is shown below assuming:
MAC Royalty sales volumes (Mt DMT)
MAC Royalty EBITDA ($m) ‒ target 2023 production of 145Mtpa (WMT) achieved and sold (135Mtpa DMT)
BHP’s South Flank expansion
is expected to expand the MAC ‒ lump ratio from South Flank of 35% and a lump premium of 20%
120 hub to ~135Mtpa (DMT) iron ore
production by 20231 • MAC Royalty revenue sensitivity table below excludes one-off capacity payments
(approximately $80m), payable to RoyaltyCo as annual tonnages increase with
South Flank ramp up
90
MAC Royalty Annual Revenue Sensitivity ($ million)2
Iron ore fines price - US$/DMT, 62% Fe (CFR)
60
55 65 75 Spot (88)
0.75 $116m $140m $163m $194m
30
AUD:USD
0.70 $124m $150m $175m $208m
Spot (0.67) $130m $156m $183m $217m
-
0.65 $134m $161m $188m $223m
Indicative ramp up assumptions
50% 75% 100%
1. Indicative ramp-up schedule based on 145mtpa (WMT) expanded MAC hub potential assumption in line with BHP disclosures, noting BHP’s May 2017 EPA approval has nominal combined processing rate of 150Mpta (WMT) of blended ore.
2. MAC Royalty is based on FOB revenue. Assumed freight of US$6/t. Spot iron ore price of US$88/t and AUD:USD exchange rate of 0.67 as at 14 February 2020.Outlook for 2020 – Summary 19
• Q1 zircon sales are typically a seasonal low
• The impact on zircon demand of COVID-19 and macroeconomic factors remain uncertain
Market outlook
• Tight conditions expected to continue in high grade titanium feedstocks
• Potential for recovery in zircon market hastened given destocking has largely run its course in 2019
• Projects completed in 2019 expected to deliver full year of production in 2020
Operational outlook
• Focus on optimising production and operational efficiencies across all sites
• Project work to be advanced across all major projects – including Sembehun, Balranald, Atacama
Project pipeline
• Employing innovative technology and processes to maximise returns from assets
• Demerger subject to final Board approval, regulatory and shareholder approvals. If approved, the
Capital structure demerger is expected to be completed in 2020.
review and next • Iluka has engaged with the ATO on demerger tax relief and submitted a final ruling application – Iluka
steps is confident of receiving a favourable ruling in due course
• Further update to be provided at the AGM on 9 April 2020Supplementary slides Sierra Rutile, Sierra Leone
Zircon Applications                                                                                                                                                  21

                                                 Zircon is opaque (white) and water, chemical, heat and abrasion resistant

                               Ceramics                        Chemicals, Fused Zirconia                  Refractory and Foundry
                                                                  and Specialty Uses
2018 global demand

                                                                       20%
                                                                                                                                                   Key drivers of demand
                                           50%
                                                                                                                                                   Short term
                                                                                                                30%                                • Construction industry
                                                                                                                                                   • Industrial activity

                     Tiles, sanitary ware, table ware       Electronics, catalytic converters, fibre   Investment casting, glass, steel and        Medium to long term
                                                                   optics, nuclear fuel rods                   cement industries                   • GDP per capita
                                                                                                                                                   • Urbanisation
                                                                                                                                                   • Flooring trends
                                                                                                                                                   • Innovation and
                                                                                                                                                     increased applications

                                                                       Other
 2018 Iluka sales

                                                                      specialty
                                            Ceramics                    9%
                                              61%                 Zircon
                                                                Chemicals
                                                                 & Fused
                                                                 Zirconia
                                                                                                         Refractory
                                                                   24%
                                                                                                         & Foundry
                                                                                                                                       Demand source: TZMI
                                                                                                            6%                         Sales source: Iluka
Titanium Dioxide Applications 22
Titanium pigment is opaque (white), UV resistant and inert.
Titanium metal has high strength to weight ratio and is corrosion resistant.
Titanium Pigment Titanium Metal Welding (flux)
2018 global demand
Key drivers of demand
5%
Short Term
90% 5%
• Construction industry
• Consumer spending
• Renovation spending
• Steel industry
Paint, plastics, inks, specialty coatings Aircraft frames and engines, Steel fabrication, ship building
• Ship build orders
medical items, sporting goods
• Aircraft build orders
Medium to long term
• GDP per capita
• Urbanisation
• Innovation and
increased applications
Ti Sponge
2018 Iluka sales
/ Other
Welding
Pigment 13%
5%
82%
Demand source: TZMI
Sales source: IlukaCash Flow 23
Iluka reported $140 million of free cash flow in 2019 with strong operating cash flow generated from mineral sands operations and MAC
royalty income and investment of $198 million in capital projects
Cash flow movements
2019 free cash flow $140 million
$ million
600
Key cash flow drivers in 2019
• Operating cash flow $408 million (2018: $594 million)
• Final 2018 tax instalment payment of $127 million 500 79
• Capital expenditure $198 million, reflecting a year of (11)
significant project delivery 408
400
• MAC Royalty cash flow $79 million (153)
• Exploration spending $11 million
300
200 (198)
(12)
29
100
(100)
2 43
-
Open net cash Operating MAC royalty Exploration Interest & Tax Capex IFC proceeds Other Dividends Closing net
31 Dec 18 cash flow cash
31 Dec 19Inventory 24
As at 31 December 2019, Iluka’s inventory balance of $425 million sits within normal working capital levels
Inventory balance movements
• Iluka’s inventory provides flexibility to release product as market conditions improve
• Zircon finished goods inventory is higher due to subdued 2019 sales
• Rutile and synthetic rutile inventories reduced over 2019 reflecting tight market conditions
• Work in progress inventory relates to heavy mineral concentrate at Jacinth-Ambrosia and intermediate materials
associated with initial Cataby operations
Other
Total Inventory Ilmenite
$ million
1000 Synthetic
Rutile
Finished
Finished Goods Work in Progress*
Goods
800 (Dec-19)
Rutile
600 Zircon
400
Normalised inventory level
Ore
Other
200
Work in
0 progress
(Dec-19)
Dec-10
Dec-11
Dec-12
Dec-13
Dec-14
Dec-15
Dec-16
Dec-17
Dec-18
Dec-19
Jun-10
Jun-11
Jun-12
Jun-13
Jun-14
Jun-15
Jun-16
Jun-17
Jun-18
Jun-19
* Includes ilmenite and consumables HMCBalance Sheet 25
Iluka has a strong balance sheet with $43 million net cash position (as at 31 Dec 2019), and debt facilities of $519 million
Key movements
Net Debt, Gearing and Funding Headroom • Net cash position of $43 million as at December 2019
$m Gearing %
Total facilities available Net debt (cash) Gearing* • Full year free cash flow of $140 million (2018: $304 million)
1,050
• Iluka maintains a balance sheet with sufficient funding headroom as required
35 Hedging
• Entered into US$32 million in forward FX contracts maturing in 2020
750
− average AUD:USD rate of 69.3 cents in relation to expected 2020 US$ revenue
• US$118 million in FX collar contracts consisting of:
21 − bought AUD call options weighted average strike price 80.5 cents; and
450 − sold put options at weighted average strike price 70.0 cents expired during the year.
Multi Option Facility Agreement (MOFA)
7
150 • Completed refinancing of MOFA in July
• Reset 5 year tenure with maturity July 2024
• Refinancing resulted in improved margin and fees
(150) -7 • Total facilities reduced to $519 million
H1 14
H2 14
H1 15
H2 15
H1 16
H2 16
H1 17
H2 17
H1 18
H2 18
H1 19
H2 19
‒ reflecting medium term liquidity requirements
* Net debt / net debt + equityJacinth-Ambrosia 26
In 2019 the move to the Ambrosia deposit was completed on schedule and under budget
Historical Production and Unit Cost
• Mining and concentrating activities ongoing as planned
kt Zircon Rutile (HYTI 90) $/tonne
• Improved grades and recoveries in-line with historical levels
400 Ilmenite Unit Cost (per tonne Z/R) (RHS) 800
Move from Jacinth North to Ambrosia completed in August 2019 300 J-A idled 600
• Move to Ambrosia deposit completed ahead of schedule and under budget
• Capital expenditure $22 million 200 400
• Major works included earthworks, site establishment and infrastructure
100 200
• Mining unit relocated and production commenced within 3 days of outage (planned 7 days)
• Minimal disturbance to HMC production - first HMC produced two months ahead of schedule
0 0
2014 2015 2016 2017 2018 2019
Unit costs in-line with levels
prior to idling of J-A in 2016Cataby 27
Ramp-up completed and full feed maintained to sustain synthetic rutile production at SR2 kiln
• $270 million development, delivered on schedule and on budget Cataby Rougher Head Feed
kt
‒ re-use of refurbished equipment required re-configuration 800
Improving throughput as Cataby
• Full feed maintained to SR2 kiln and synthetic rutile production ahead of expectations
700 mine ramped up over 2019
• Production levels approaching capacity and reliability of plant improved quarter on quarter
600
500
Current Focus Areas
400
• Building throughput capacity beyond current nameplate
• Optimising cost base in stable operations 300
200
100
-
Jan Feb Mar Apr May Jun Jul Aug Sep Oct Nov DecSierra Rutile 28
Improvement initiatives implemented, focus on efficiency
• Operational challenges in 2019 impacting runtime and throughput Mining Unit Ore Feed and Rutile Production
• Improvement initiatives implemented throughout year Ore feed kt Rutile kt
Gangama Lanti Dry
3,000 50
‒ expert maintenance team on site Lanti Dredge Rutile Production (RHS)
‒ system and plant design improvements 2,500 45
‒ simplified flowsheet
2,000 40
‒ upskilling of workers
• Lanti and Gangama expansions completed on schedule and budget 1,500 35
• By end of 2019 four mining units operational and productivity improvements evident
1,000 30
• Q4 2019 rutile production of 44kt, with mineral separation plant at capacity
500 25
Focus for 2020 - 20
Q1 Q2 Q3 Q4 Q1 Q2 Q3 Q4
• Continue to focus on productivity improvements 2018 2018 2018 2018 2019 2019 2019 2019
• Building consistency and reliability in operations
Lanti, Sierra LeoneOutlook for 2020 – Group 29
Key Parameters 2018 2019 20201 Comments
Annual production
Zircon kt 349 322 2802 Includes ~35kt of ZIC.
Higher production outlook from Sierra Rutile
Rutile3 kt 163 184 230
and full year of operations at Cataby
Synthetic Rutile kt 220 196 225 Full year of kiln operation
Total Z/R/SR kt 732 702 735
Average annual unit costs
Increase reflects full year of Cataby
Unit cash costs of production $/t Z/R/SR 606 753 790
operations and Ambrosia
Increase weighting of Cataby and Ambrosia
Unit cost of goods sold $/t Z/R/SR 750 889 860
product in Z/R/SR sales
Capital investment
Spending includes:
• Deferred mine development work at
Cataby ($25m) and Ambrosia ($10m)
Capital expenditure $m 312 198 135 • Sembehun project work ($30m)
• Growth projects ($20m)
• Eneabba project ($5m)
• Other sustaining expenditure
Note: Cash flow outlook not provided but an estimated 2019 final tax payment of $94 million is to be paid in H1 2020
1. Indicative only. Production settings are able to be adjusted and are dependent on market demand conditions. This slide should be read in conjunction with the disclaimer on forward
looking statements on slide 2.
2. As noted in the 2019 Full Year Results ASX announcement, uncertainty created by the potential impact of the COVID-19 (and other factors) may impact global and in particular Chinese
demand for zircon. Iluka will monitor the situation closely and adjust operational settings if appropriate over the course of the year.
3. Includes HYTIOutlook for 2020 – Group 30
Key Parameters 2018 2019 20201, 2 Comments
Cash costs ($m)
Increased costs associated with full year of Cataby
Cash costs of production (Z/R/SR) 444 529 580 operations, Ambrosia and full year of synthetic rutile kiln
operation
Ilmenite concentrate and by-product costs 11 11 20 Includes cost of monazite concentrate
Restructure and idle costs 25 20 20
Resource development 30 42 75 Includes cost of third Balranald mining trial ($35 million)
Corporate 48 48 60
Marketing, selling and royalty costs 76 74 n/a Dependent on sales price / volume and activity
Total cash costs 634 724 n/a
Non cash costs ($m)
Lower depreciation of Sierra Rutile following write-
Depreciation and amortisation 94 163 135 down, increase at Cataby with commissioning and full
year of operation
Rehabilitation for closed sites (5) 3 -
Rehabilitation unwind 17 39 15 2019 included adjustment to discount rate of $18 million
Total non-cash costs 112 106 155
1. Indicative only. This slide should be read in conjunction with the disclaimer on forward looking statements on slide 2.
2. Costs exclude inventory movement; FX gains/losses; net interest and bank fees; and tax.Outlook for 2020 – Sierra Rutile 31
Key Parameters 2018 2019 20201 Comments
Annual production
Outlook reflects full year of expanded operations and
Rutile kt 122 137 170
implementation of operational improvements
Zircon kt 11 9 5 ZIC shipment
Total Z/R kt 133 146 175
Ilmenite kt 54 59 70
Annual unit costs & capital expenditure
Cash costs of production US$m 115 121 125
Unit cash costs of
US$/t Z/R 863 823 715 Increased production outlook reducing unit costs
production
Includes Sembehun project work, further operational
Capital expenditure US$m 76 71 30
improvement works and sustaining capital
1. Indicative only. This slide should be read in conjunction with the disclaimer on forward looking statements on slide 2For more information contact: Melissa Roberts GM – Investor Relations and Commercial Mineral Sands Operations investor.relations@iluka.com +61 (0) 450 398 431
You can also read