Household Energy Efficiency National Statistics - Detailed Report 2018 Statistical Release: National Statistics - Standard Numbering
←
→
Page content transcription
If your browser does not render page correctly, please read the page content below
Household Energy Efficiency
National Statistics
Detailed Report 2018

Statistical Release:
National Statistics

18 April 2019
© Crown copyright 2019

You may re-use this information (not including logos) free of charge in any format or medium,
under the terms of the Open Government Licence.

To view this licence, visit www.nationalarchives.gov.uk/doc/open-government-licence/
or write to the Information Policy Team, The National Archives, Kew, London TW9 4DU,
or email: psi@nationalarchives.gsi.gov.uk.

Any enquiries or comments in relation to this statistical release should be sent to BEIS’s
Household Energy Efficiency Statistics Team at the following email address:
EnergyEfficiency.Stats@beis.gov.uk

The statistician responsible for this publication is Stephen Oxley.
Contact telephone: 0300 068 5025

Further information on energy statistics is available at:
https://www.gov.uk/government/organisations/department-for-business-energy-and-
industrial-strategy/about/statistics

This document is also available from our website at:
https://www.gov.uk/government/collections/household-energy-efficiency-national-statistics
Contents
Executive Summary ___________________________________________________ 4
Section 1: Energy Efficiency Measures, Households and Carbon Savings _________ 6
    Household Energy schemes ____________________________________________ 6
    One million homes improved target _______________________________________ 7
    Estimated carbon and energy savings for measures installed ___________________ 8
Section 2: The Energy Company Obligation _________________________________ 9
    Measures installed under ECO __________________________________________ 9
    ECO Brokerage _____________________________________________________ 14
    ECO Costs _________________________________________________________ 14
Section 3: The Green Deal ______________________________________________ 16
    Green Deal Finance Plans _____________________________________________ 16
    The Supply Chain ___________________________________________________ 17
Section 4: Estimates of Home Insulation Levels in Great Britain _________________ 18
    Sources of increase in insulation levels ___________________________________ 20
    Remaining potential __________________________________________________ 21
Annex A – Background _________________________________________________ 24
    Energy Company Obligation ___________________________________________ 24
    ECO Brokerage _____________________________________________________ 25
    ECO delivery costs __________________________________________________ 26
    Green Deal ________________________________________________________ 27
    Legacy Green Deal Schemes __________________________________________ 28
    The Supply Chain ___________________________________________________ 29
    Insulation statistics___________________________________________________ 29
Annex B – Sources and Methodology ______________________________________ 31
    Green Deal and ECO data sources ______________________________________ 31
    Revisions __________________________________________________________ 31
Annex C - Household Energy Efficiency schemes ____________________________ 32
    ECO and the Green Deal ______________________________________________ 32
    Feed-In Tariffs ______________________________________________________ 32
    Renewable Heat Premium Payment _____________________________________ 33

                                                                                       2
Householders’ scheme _______________________________________________ 33
Communities scheme ________________________________________________ 34
Domestic RHI ______________________________________________________ 34
Smart Meters _______________________________________________________ 34
National Statistics ___________________________________________________ 35
Accompanying tables_________________________________________________ 35
Methodology Note and Background Quality Report __________________________ 35
Next Releases ______________________________________________________ 35
3Executive Summary
This annual report presents in-depth statistics on the Energy Company Obligation (ECO),
the Green Deal (GD) and insulation levels in Great Britain (GB), up to the end of 2018. This
report also contains an update on progress against the one million homes improved target,
up to the end of February 2019. This is the fourth annual report on GD, ECO and insulation
level statistics. See the Headline statistics release and tables for the latest quarterly and
monthly statistics.
Energy Efficiency Measures, Households and Carbon Savings
• Between the start of May 2015 and the end of February 2019 there were around
852,000 households that had installed an improvement measure under ECO or the
GD.
• Around 2.5 million measures were installed in around 2.0 million properties through
ECO or under the GD Framework to the end of 2018.
• The provisional estimated lifetime carbon savings of measures installed by the end of
December 2018, under ECO (excluding Affordable Warmth1), Cashback, GDHIF and
GD Plans was up to 37.9 MtCO2 with provisional estimated lifetime energy savings up
to 150,400 GWh. It should be noted that the only live scheme contributing to this since
September 2018 is the GD. To date savings from the Affordable Warmth Obligation
have not been included since that obligation is defined in terms of lifetime bill savings.
ECO Measures Installed and Households
• There were 2,454,300 measures installed under ECO up to the end of 2018. During
2018, 212,700 measures were installed, 5 per cent higher than the 201,900 installed
in 2017.
• There were 888,100 Affordable Warmth measures installed under ECO up to the end
of 2018, to date these savings are estimated to deliver around £11.3bn worth of
notional lifetime bill savings.
• Around seven per cent of all households in Great Britain had a measure installed under
ECO funding (i.e. 73 per 1,000 households). The North West and North East regions
had the highest amount with 111 and 97 households with ECO measures per 1,000
households respectively. In Scotland there were 106 per 1,000 households and 75 per
1,000 households in Wales. Around 14 per cent of measures were installed in rural
areas of Great Britain.
1 The ECO Affordable Warmth Obligation is measured in terms of lifetime bill savings not lifetime carbon
savings so has historically not been included in this summary. Given that ECO3 is only delivered through
Affordable Warmth no new measures have been delivered under ECO since the end of September 2018 so
these figures are virtually unchanged since last quarter. BEIS is looking to develop estimates of the carbon
savings from Affordable Warmth to include in a future publication.
4• Around 85 per cent of ECO measures were installed in properties that used gas as
their main fuel type (2,094,000 measures); however this has steadily decreased from
90 per cent in ECO 1 (2013 – March 2015), to 85 per cent in ECO2 (April 2015 – March
2017) and to 66 per cent in ECO Help-to-Heat (April 2017 - September 2018).
Green Deal Plans
• At the end of 2018 there were 13,830 ‘live’ or ‘completed’ GD Plans in unique
properties in GB (i.e. measures were installed, billing had commenced or had been
paid off early), with 11,777 of these plans ‘live’, in unique properties.
Home Insulation Levels
It is estimated that at the end of December 2018:
• There were 28.4 million homes in GB. Of these, 19.9 million had cavity walls with the
remaining 8.5 million having solid walls and 24.5 million properties had a loft.
• There were 269,000 more properties with cavity wall insulation than at the end of 2017;
204,000 more had loft insulation of at least 125mm, and 18,000 more had solid wall
insulation2.
• 13.8 million homes had cavity wall insulation (70 per cent of homes with cavity walls).
Of the 5.3 million homes without cavity wall insulation, 4.0 million are easy to treat
standard cavities, and 1.3 million are hard to treat (including standard cavity wall
property with issues such as structural faults or presence of a conservatory, creating
access issues and some unfillable cavity walls). There are around 0.8 million properties
which may or may not have cavity wall insulation.
• 16.2 million homes had loft insulation of at least 125mm (66 per cent of homes with
lofts). Of the 8.0 million homes with lofts without at least 125mm of insulation, only a
small number are estimated to have no insulation. Around 5.8 million of these homes
require easy to treat loft insulation, and 2.3 million are hard to treat (including room in
roofs, flat roofs and some unfillable lofts).
• 752,000 homes had solid wall insulation, which is nine per cent of homes with solid
walls.
2 It should be noted that both new build and retrofit contribute to these figures. See Section 4 for details.
5Section 1: Energy Efficiency Measures,
Households and Carbon Savings
This commentary section provides detailed information on the overall number of energy
efficiency measures delivered under central Government schemes, as well as reporting
progress against the one million homes improved target. It also reports estimates of the
carbon savings achieved through these installed measures. Where the report refers to table
numbers in brackets, these are included in the accompanying Excel tables here.
Household Energy schemes
The Energy Company Obligation (ECO) and Green Deal (GD) are Government
energy efficiency schemes which began operating in 2013. They replaced the
previous schemes: Carbon Emissions Reduction Target, Community Energy
Saving Programme and Warm Front. Their aim is to encourage the uptake of
energy efficiency measures so that the efficiency of the building stock is
improved. This has impacts such as reduced consumer bills and increased
comfort in the home.
Between January 2013 and February 2019, energy efficiency measures were installed in:
• 1,962,600 properties under the Energy Company Obligation (ECO);
• 35,300 properties using the Green Deal Home Improvement Fund (GDHIF);
• 14,700 properties following the redemption of Cashback vouchers;
• 13,800 properties using a GD Finance Plan; and
• 15,600 properties using GD Communities funding.
There is a small amount of double counting between these mechanisms (around 24,000
households), i.e. measures not installed in unique properties. (Table 1.2)
Progress in other household energy efficiency schemes including Renewable Heat
Incentive, Feed in Tariff and Smart Metering are reported in Annex C.
6One million homes improved target
The Clean Growth Strategy3 announced a target to upgrade around one million
homes through the Energy Company Obligation (ECO) and other Government
domestic energy efficiency schemes, including insulation and other energy
efficiency measures. The period covered is over five years from the start of May
2015 through until the end of April 2020.
Between the start of May 2015 to the end of February 2019 (three years and ten months)
there were around 852,000 households that had installed an improvement measure under
ECO or the GD (GD Plans, GDHIF or GD Communities). This implies that 85 per cent of the
required homes have been improved in 77 per cent of the months available. (Table 1.3)
Please see the methodology note here for more details of the measurement of this target.
Infographic 1: Proportion of the 1 million homes target achieved, up to end February
2019
3 Clean Growth Strategy: Page 13
https://www.gov.uk/government/uploads/system/uploads/attachment_data/file/651916/BEIS_The_Clean_Gro
wth_online_12.10.17.pdf “Support around £3.6 billion of investment to upgrade around a million homes
through the Energy Company Obligation (ECO), and extend support for home energy efficiency
improvements until 2028 at the current level of ECO funding.”
7Estimated carbon and energy savings for measures installed
This section estimates savings derived from measures installed through ECO and GD.
Estimated carbon and energy savings relating to measures installed (Table 1.4)
Table 1.4 presents the estimated impact of measures installed under ECO4 (through the
Carbon Saving Obligation and Carbon Saving Communities Obligation5), and through the
GD framework up to the end of December 2018. It should be noted that the only live scheme
contributing to this since September 2018 is the GD. To date savings from the Affordable
Warmth Obligation have not been included since that obligation is defined in terms of lifetime
bill savings.
The provisional estimated lifetime carbon savings of measures installed by the end of
December 2018, under ECO (excluding Affordable Warmth6), Cashback, GDHIF and GD
Plans was up to 37.9 MtCO2 with provisional estimated lifetime energy savings of up to
150,400 GWh (Table 1.4). For context, UK carbon dioxide emissions for the residential
sector (including electricity) in 2017 were 95.2 MtCO27 and the average measure has a
lifetime of 41 years.
For GD Plans, GDHIF and Cashback measures8, the net estimated carbon savings has
been calculated from the difference between that in the original EPC (pre-installation of
measures) and the updated EPC (post installation of measures). For ECO measures, the
estimated lifetime carbon savings has been adjusted to account for estimated levels of
comfort taking, which better represent our understanding of the assumed net impact of the
installed measures. Estimated carbon and energy savings relating to measures installed
through ECO, Cashback, GDHIF and GD Plans are reduced by 15 per cent to account for
comfort taking following the installation of measures. This is consistent with analysis for the
2012 ECO/GD Final Stage Impact Assessment analysis but does not reduce the progress
reported against the obligations. Therefore, the carbon estimates for ECO may differ from
those published through Ofgem. Also all carbon and energy savings from installed measures
are adjusted by the relevant specific in-use factors for each measure type9 for ECO10 and
for GD delivery mechanisms. More information on the methodology used is included here.
4 The expected net reduction in carbon from ECO measures depends on the reductions in the traded sector
emissions out-weighing any increase in non-traded sector emissions.
5 Affordable Warmth is excluded because carbon reductions are not the stated aim of this policy and difficulties
in accurately estimating their carbon impact).
6 The ECO Affordable Warmth Obligation is measured in terms of lifetime bill savings not lifetime carbon
savings so has historically not been included in this summary. Given that ECO3 is only delivered through
Affordable Warmth no new measures have been delivered under ECO since the end of September 2018. BEIS
is looking to develop estimates of the carbon savings from Affordable Warmth to include in a future publication.
7 https://www.gov.uk/government/statistics/final-uk-greenhouse-gas-emissions-national-statistics-1990-2017
8 Carbon savings from Green Deal Communities have not been included due to the large amount of double-
counting between this and other schemes (specifically ECO).
9 Domestic measures in-use factors, page 9
https://www.gov.uk/government/uploads/system/uploads/attachment_data/file/48407/5505-how-the-green-
deal-will-reflect-the-insitu-perfor.pdf
10 Ofgem ECO measures https://www.ofgem.gov.uk/ofgem-publications/83100/energycompaniesobligation-
measures.pdf
8Section 2: The Energy Company Obligation
This section provides detailed information on different elements of the Energy Company
Obligation (ECO) including geographical breakdowns, ECO brokerage and ECO costs.
Where the report refers to table numbers in brackets, these are included in the
accompanying Excel tables here.
Measures installed under ECO
The Energy Company Obligation (ECO) was introduced in January 2013 to
reduce energy consumption and support people at greater risk of living in fuel
poverty. The larger energy companies are set obligations to install insulation and
heating measures in order to achieve reductions in energy usage and heating
costs. All measures installed under ECO are provisional until the end of the
obligation period with checks undertaken by Ofgem.
Headlines for ECO delivery
There were 2,454,300 measures installed under ECO up to the end of 2018, with 212,700
installed in 2018, 5 per cent higher than the 201,900 installed in 2017. The number of
measures delivered fell each year between 2014 and 2017 as the size of the obligation has
been reduced over the different phases of the scheme. (Table 3.1)
Chart 1: ECO measures installed, by obligation, by year, up to end 2018
ECO Help-To-Heat ran from April 2017 to September 2018 and delivered 328,000
measures. Some of these though may be re-elected as ECO3 measures where suppliers
have exceeded their Help-To-Heat targets. (Table 2.4) The ECO3 phase went live on 3rd
December 2018 but measures have been installed since October 2018. Up to the end of
February 2019, 40,100 measures have been installed through this phase. (Table 2.5)
9Estimated lifetime bill savings for Affordable Warmth measures installed (Table 2.1)
There were 888,100 Affordable Warmth measures installed under ECO up to the end of
2018, with 97,900 installed in 2018, 1 per cent higher than the 97,000 installed in 2017.
Since October 2018, the whole of ECO3 is delivered under the Affordable Warmth
Obligation.
To date these savings are estimated to deliver around £11.3bn worth of notional lifetime bill
savings11, of which £1.5bn of savings delivered in 2018.
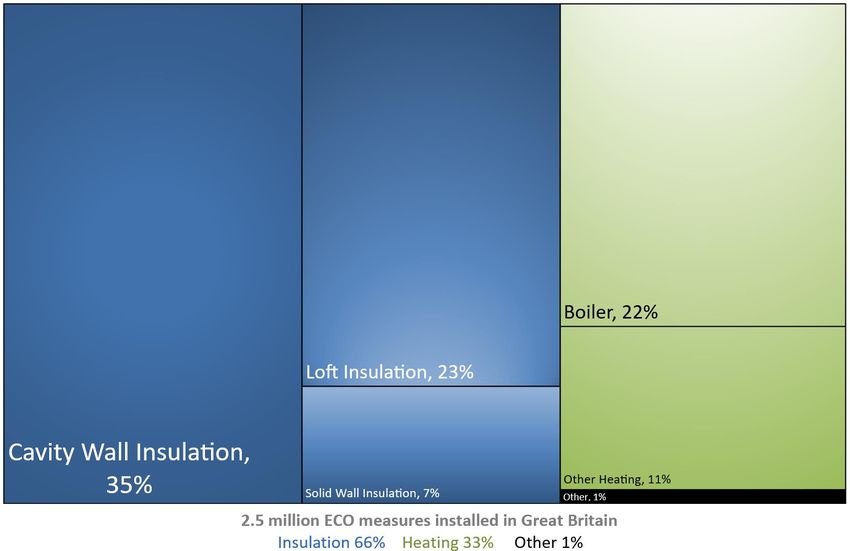
Type of measures installed under ECO (Table 3.1)
Over the ECO scheme as a whole, 66 per cent of measures have been insulation measures,
including cavity wall insulation (35 per cent), loft insulation (23 per cent) and solid wall
insulation (7 per cent). The remainder are mostly heating measures with 22 per cent boiler
measures and a further 11 per cent for ‘other heating’ measures.
Infographic 2: ECO measures by measure type, up to end February 2019.
11Each Affordable Warmth measures is given an assumed lifetime bill saving based on the type of measure
and the house in which it is installed. For ECO3 and Help-To-Heat this is based on ‘Deemed scores’ and
previously an assumed saving using the Standard Assessment Procedure (SAP) methodology.
10Over the year to December 2018, 38 per cent of measures have been cavity wall insulation,
20 per cent loft insulation with 16 per cent boiler measures and a further 16 per cent for
‘other heating’ measures. (Table 3.1)
Geographic location of measures installed under ECO (Tables 3.3-3.7)
Tables 3.3-3.6 present the number of measures installed under ECO, broken down by
obligation, in each region (Table 3.3), Local Authority (Table 3.4) and Parliamentary
Constituency (Table 3.6) up to end December 2018. Around one fifth (18 per cent) of ECO
measures were in the North West (447,200), the highest in any region. Thirteen per cent of
ECO measures were installed in Scotland (308,300) and five per cent were in Wales
(133,300).
Table 3.5 reports the measures installed through Flexible Eligibility12 for Local Authorities
who have been active in this aspect of the scheme. Up to the end of December 2018, 223
Local Authorities have participated in this aspect of the scheme, an increase from 61 up to
the end of December 2017. Up to December 2018, 66 local authorities had seen 50 or more
measures installed through Flexible Eligibility, eight of these had over 500 measures
installed. The South West and South East regions had the highest share in England with 20
per cent and 10 per cent of flex measures in Great Britain respectively. Wales had 24 per
cent and Scotland 10 per cent. (Table 3.5)
Table 3.7 presents the number of measures installed under ECO by measure type and
region. Fifty-seven per cent of solid wall insulation was installed in England, 34 per cent in
Scotland and nine per cent in Wales. Thirty-eight per cent of all window glazing installed
under ECO was in London. Around one fifth (18 per cent) of all cavity wall insulation installed
up to end December 2018 was installed in the North West, as well as the highest proportion
of boiler installs (22 per cent). The North of England (North East, North West and Yorkshire
and The Humber) account for 44 per cent of all boilers installed under ECO.
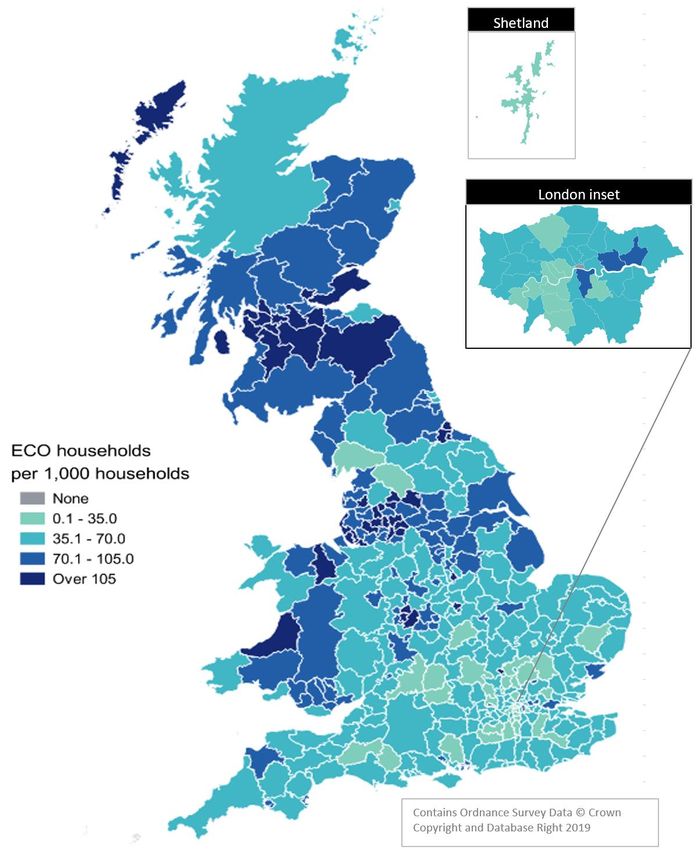
Geographic location of households receiving ECO measures (Tables 4.1, 4.4 & 4.5 and Map
1)
When comparing areas, it is more representative to use the number of households in receipt
of ECO measures per 1,000 households. In GB, on average, there were around 73
households in receipt of ECO measures per 1,000 households or, in other words, around
seven per cent of all households in GB had a measure installed under ECO funding.
The North West and North East regions had the highest amount with 111 and 97 households
with ECO measures per 1,000 households respectively. In Scotland there were around 106
per 1,000 households and 75 per 1,000 households in Wales. Na h-Eileaan Siar13 in
Scotland had the highest proportion of households with ECO measures in any Local
12 Since April 2017, Local Authorities can determine eligible homes under the new ‘flexible eligibility’
mechanism. Suppliers can use this voluntarily for up to 25 per cent of their ECO3 obligation and up to 10 per
cent of their Affordable Warmth obligation under ECO Help-to-heat.
13 Na h-Eileanan Siar was formerly known as the Western Isles, then Eilean Siar and then Comhairle nan
Eilean Siar.
11Authority (LA) in GB with 218 per 1,000, having seen its number of households receiving
measures increase by over 50 per cent in the last year.
Rurality of measures installed under ECO (Tables 3.8-3.9)
Tables 3.8 and 3.9 provide a breakdown of measures installed under ECO into rural and
urban areas by country, by obligation and by region. Across the whole of Great Britain
around 14 per cent of measures were installed in “rural14” areas. This varies across the
country with 34 per cent of measures installed in Wales and 14 percent installed in Scotland
being located in rural areas. Table 3.8 shows the number of measures installed under the
rural sub-obligation.
Further breakdowns of measures installed under ECO (Tables 3.2, 4.2 & 4.3)
These tables present further analysis of measures installed under ECO up to end December
2018.
Table 3.2 shows that overall 85 per cent of ECO measures were installed in gas-fuelled
properties but this share fell to 65 per cent over the last year.
Table 4.2 shows that around three quarters (73 per cent) of properties with ECO measures
were houses, 17 per cent were flats and the remainder were bungalows, maisonettes and
park homes. However, this varies by obligation, with a greater proportion of properties with
measures installed under Carbon Saving Target and Carbon Saving Communities being
flats (23 to 20 per cent), compared with properties with measures installed under Affordable
Warmth (seven per cent).
Table 4.3 shows that around 70 per cent of homes receiving ECO measures are in the
owner-occupied sector, 15 per cent in the social rented sector and 15 per cent in the private
rented sector. Over the last year, 29 per cent of additional homes receiving ECO measures
were in the social rented sector reflecting the change to the policy in April 2017 when social
housing became eligible for Affordable Warmth measures.
14 Includes the groups, rural town and fringe, rural town and fringe in a sparse setting, rural village, rural village
in a sparse setting, rural hamlet and isolated dwellings, rural hamlet and isolated dwellings in a sparse setting,
or in Scotland Accessible Rural, remote rural, and very remote rural. This summary is not based on the rural
sub-obligation.
12Map 1: Households in receipt of ECO measures by Local Authority per 1,000
households up to end December 2018
Table 4.4 and Map 1 shows the number of households in receipt of ECO measures by Local
Authority per 1,000 households. This illustrates the concentration of households in receipt
of ECO measures in the North West, North East and West Midlands in England, as well as
parts of Wales and Scotland.
13ECO Brokerage
The ECO Brokerage system (Tables 5.1 - 5.5) operates as a fortnightly
anonymous auction where providers can sell ‘lots’ of future measures of the ECO
Obligation, to energy companies in return for ECO subsidy.
Table 5.3 presents the clearing prices of all lots sold through ECO1-2 brokerage. To the end
of March 2017 there were 105 auctions with a total value of contracts let worth £479 million,
99 per cent of all ECO brokerage up to March 2019. Trading for ECO Carbon Saving
Communities ceased with auction 105.
Auctions that have taken place after the extension of the ECO2 scheme in April 2017
(auction 106 to 143) are listed in table 5.4. During this phase, activity in the auction markets
has remained subdued with less than £4m traded and over 75 per cent of auctions
concluding with no trading.
At the start of ECO3 the lots remained unchanged so were reported in table 5.4 up to 5 th
February 2019. New lots were introduced for the 19th February auction, the results of which
are shown in table 5.5. The first ECO3 auction on 2nd October traded nearly £2m but since
then, 9 out of 11 auctions have concluded with no trading.
For more detail on the results of each auction, please see ECO Brokerage.
ECO Costs
As with any scheme there are costs associated with delivering the ECO scheme.
BEIS receives summary information, reported by energy suppliers, covering the
costs associated with delivering ECO for all obligated energy suppliers at the end
of each quarter. For more information on ECO costs please see Annex A and full
definitions are included in the Methodology note.
The latest aggregate delivery costs, up to the end of 2018 (covering the whole of ECO1,
ECO2, ECO Help-To-Heat and the first 3 months of ECO 3), are included in Table 6.1, and
include some revisions as reported by energy suppliers. Historic costs and future costs may
go up or down depending on a range of factors.
Chart 2 below shows that the total delivery costs from January 2013 to December 2018 were
around £3.81bn, with an additional £407m in administrative costs. This meant that the total
cost of ECO for the period was £4.22 billion. Over the last year, suppliers spent £360m
including £40m in administrative costs. (Table 6.1)
The costs reflect how the size of obligation was reduced from ECO1 to ECO2, and further
reduced for ECO Help-To-Heat.
14Chart 2: Estimated ECO delivery costs by obligation and year up to December 2018
Tables 6.2-6.3 show the average cost by obligation and the highest average cost and lowest
average cost reported by suppliers for each obligation as at the end of March 2017 for the
ECO phase (Table 6.2) and from April 2017 to September 2018 for the ECO Help-to-Heat
phase (Table 6.3). The suppliers have not been identified to protect commercial
confidentiality. This shows that some energy suppliers are discharging their obligation more
cost effectively than others. Table 6.4 just shows the average cost per obligation until the
distribution can be presented in a non-disclosive way.
A simple comparison of Tables 6.2-6.4 shows that while cost associated with Affordable
Warmth measures have remained broadly stable between the ECO phases, the average
cost (all suppliers) for the Carbon Saving Obligation has fallen by around two thirds.
15Section 3: The Green Deal
This section provides the latest information on Green Deal Finance Plans. Since the Green
Deal Framework was launched in 2013 there have been a number of schemes within the
framework. Green Deal finance plans is the only scheme that is still live and is reported
below. For final figures for other schemes including the Green Deal Home Improvement
Fund and Green Deal Communities please see the 2017 Detailed report. BEIS stopped
reporting the number of Green Deal Advice Reports in June 2018 as they are no longer
considered an effective lead indicator of Green Deal Plans and their associated
measures15.
Green Deal Finance Plans
The Green Deal (GD) is a government initiative that is designed to help home
owners install energy efficiency measures into their properties, and the costs of
these measures are paid back through their energy bill over a period of time; this
is in the form of a Green Deal Finance Plan (GD Plan). This is unlike a
conventional loan because the loan stays with the property where the measures
have been installed rather than moving with the individual who took out the loan.
Uptake of the GD was below expectations and in July 2015 the Government announced
there would be no further public investment in the scheme. The Framework to support the
programme has remained in place to service existing GD Plans and for any private finance
providers wishing to enter the market. The Green Deal Finance Company – the vehicle
created to finance GD loans and in which the Government ended public investment during
2015 – was purchased in January 2017 by new owners, who are now offering new GD plans.
At the end of 2018 there were 13,830 ‘live’ or ‘completed’ GD Plans in unique properties in
GB (i.e. measures were installed, billing had commenced or had been paid off early), with
11,777 of these plans ‘live’, in unique properties. 36 properties had two 'live' GD Plans, so
there are 11,813 'live' GD Plans, in total, at the end of 2018. For the latest statistics please
see the latest Headline release.
To the end of 2018 the most common measure to install was a boiler, accounting for 31 per
cent of all recorded measures. In 2018, boilers accounted for 13 out of the 29 measures
installed.
15 Some stakeholders have significantly reduced the typical lead time between a GDAR being
lodged and a Green Deal Plan going live, meaning that there is often little lag between these.
GDARs are also used to facilitate access to some local energy efficiency schemes and based
on recent numbers these reflect the majority of activity. It is therefore not possible to determine
the share of GDARs that result in a Green Deal Plan and hence analyse the take up rate of
households receiving Green Deal Finance relative to those who started the process
16During 2018, 548 plans were completed and 25 went live. We estimate that the total initial
loan amounts (i.e. excluding APR interest payments) associated with these ‘live’ plans was
around £42.2m and ‘completed’ plans was around £7.2m. Therefore, the average initial loan
amount per GD Plan was around £3,600.
The Supply Chain
The supply chain to support the Green Deal (GD) developed in various ways
since October 2012. This includes individual Advisors (who carry out and produce
GDARs) and Assessor organisations (who employ authorised GD Advisors), GD
Providers (who quote for and arrange GD Plans with customers), and Installer
organisations (who install energy efficiency improvements under the GD finance
mechanism).
The Supply chain (Table 7.4)
The number of accredited GD Assessor organisations decreased from 44 at the end of 2017
to 24 at the end of 2018. The number of active individual Advisors also decreased from
1,891 to 1,501. The number of GD Providers decreased from 169 to 143. There were 1,030
Green Deal accredited installer organisations at the end of 2018; this was an eight per cent
decrease since the end of 2017. These organisations will provide a wide range of different
measures and in different geographical locations
17Section 4: Estimates of Home Insulation
Levels in Great Britain
Chart 3 shows that over the last ten years since 2009, 7.3m major professional insulation
(cavity wall, solid wall and loft) measures have been installed through ECO and previous
Energy Obligations16. While the number of measures delivered per year has fallen as the
size of the obligation has been reduced the focus of the obligations has changed to include
more expensive measures such as solid wall insulation and target the scheme more
towards vulnerable households.
Chart 3: Cumulative professional insulation measures installed through Energy
Obligations 2009-2018
This section presents estimates of the number of homes in Great Britain (GB) with loft, cavity
wall and solid wall insulation. It gives headline estimates for the number of insulated
16 Measures are not included from the Community Energy Savings Programme as these are
not available by year. Measures from the Carbon Emissions Reduction Target can be found in
table 3.27 of Energy Consumption in the UK https://www.gov.uk/government/statistics/energy-
consumption-in-the-uk . A wide range of energy and carbon saving measures are included in
these schemes.
18properties and sets out the remaining potential for insulation in properties in GB. Estimates
of insulation levels were re-based to April 2013 to reflect more up to date information
available in the English and Scottish Housing Surveys and close to the start of Energy
Company Obligation and Green Deal schemes. Full details on how these estimates are
constructed, based on the new methodology, can be found in the Methodology note.
Housing stock
The housing stock in Great Britain is made up of different types of properties, for
example cavity wall and solid wall properties. It is important to understand the
profile of the housing stock since different insulation measures are suitable for
different property types.
At the end December 2018 there were an estimated:
Levels of insulation
Estimating levels of different types of insulation in the housing stock makes it
possible to see progress to date and how much work there is left to do.
At the end of December 2018:
• 13.8 million properties had cavity wall insulation (70 per cent of properties with a
cavity wall)
• 16.2 million had loft insulation (66 per cent of properties with a loft)
• 752,000 had solid wall insulation (nine per cent of properties with solid walls)
19Progress over the last twelve months:
Taking into account retro-fit insulation delivered through Government schemes17 and new
properties18 built with insulation during the last year, in December 2018 there were:
• 269,000 more homes with cavity wall insulation (a 2 per cent increase between the
end of December 2017 and December 2018) of which 82,000 were through retrofit
and 188,000 through new build.
• 204,000 more homes with at least 125mm of loft insulation (a 1 per cent increase
between the end of December 2017 and December 2018) of which 42,000 were
through retrofit and 162,000 through new build.
• 18,000 more homes with solid wall insulation compared with December 2017 (a two
per cent increase between the end of December 2017 and December 2018). All these
are assumed to be through retrofit.
Sources of increase in insulation levels
Increases in the number of properties with insulation result from new properties
being built and from retro-fit insulation, predominately through Government
schemes.
Of retrofit measures since 2013, over 99 per cent of cavity wall and loft insulation measures
have been delivered through ECO. Nearly 80 per cent of solid wall insulation over this period
has been through ECO but with 39,000 SWI measures through the Green Deal framework.
17 Insulation measures delivered in Scotland exclusively under the Green Homes Cashback scheme are
excluded from the figures.
18 Information is not available on the wall construction of new homes. Typically building regulations would be
met by insulated cavity walls but other construction types could be used with an equivalent insulating
performance. In this publication it is assumed that all new builds since April 2013 have cavity wall insulation.
It is estimated around 188,000 new builds were completed in 2018. MHCLG, Live tables on house building,
by country (Tables 212 to 215) https://www.gov.uk/government/statistical-data-sets/live-tables-on-house-
building
20Chart 4: Number of homes in GB with cavity wall insulation and loft insulation by
source, December 2018
Chart 5: Number of homes in GB with solid wall insulation by source, December
2018
Remaining potential
A key use of these estimates for BEIS is to identify homes that have the potential
to receive cavity wall, loft and solid wall insulation in the future to aid the design
of future policies.
21Chart 6 gives a summary of the remaining potential for insulating properties in GB. It shows
around two-thirds of properties with cavity walls (70 per cent) and properties with a loft (66
per cent) are insulated. In comparison only nine per cent of properties with solid walls are
insulated.
Chart 6: Remaining potential to insulate the housing stock in GB, end December 2018
Historical figures and more detailed breakdowns of remaining potential figures are available
in Table 8.4, 8.5 and 8.6 of the accompanying Excel tables.
Cavity wall insulation
It is estimated that at the end of December 2018 there were 13.8 million homes with cavity
wall insulation (70 per cent of homes with cavity walls). Of the 5.3 million homes without
cavity wall insulation, 4.0 million are easy to treat standard cavities, and 1.3 million are hard
to treat19 (including standard cavity wall property with issues such as structural faults or
presence of a conservatory, creating access issues and some unfillable cavity walls). There
are around 0.8 million properties which may or may not have cavity wall insulation (Chart 6,
Table 8.4).
Loft insulation
In this publication lofts are defined as insulated if they have 125mm or more of insulation.
Lofts with less than 125mm of insulation are defined as uninsulated as they would benefit
most from top up insulation.
19 Hard to treat cavities are ones that are more difficult or more expensive to fill than standard cavities. This
includes properties with a narrow cavity, and properties of either concrete or metal frame construction. The
definition of hard to treat used in this publication is based on the definition used in the 2013 Housing Surveys.
The ECO definition of hard treat differs from this definition slightly as it also includes partial fill cavities and
cavity wall properties over three storeys (compared to over four) and excludes some cavities which assessors
would not be able to identify as hard to treat, such as properties with high exposure to wind and rain.
22At the end of December 2018, it is estimated that there were 8.0 million uninsulated lofts (33
per cent of homes with lofts). Of these, around 5.8 million of these homes require easy to
treat loft insulation and 2.3 million are considered to be hard to treat or unfillable which
means the loft would be hard/costly to insulate or could not be insulated. This can occur in
properties with a flat roof, room in roof properties, or in properties where the roof has a very
shallow pitch which makes the loft space inaccessible. (Chart 6, Table 8.5).
Solid wall insulation
It is estimated that at the end of December 2018 there were 7.7 million uninsulated solid
walls (91 per cent of homes with solid walls), with around 752,000 with solid wall insulation
in GB. Prior to 2013, Government schemes have focused on insulating homes with cavity
walls due to the costs involved with insulating solid wall properties; however in recent years
with policies such as ECO, the focus has switched to harder or more expensive to treat
properties, including solid wall properties. Of the remaining potential it may not be possible
to insulate all uninsulated solid wall properties, it is likely that some of these will be too costly
to treat or be within conservation areas and will therefore never be insulated. Solid wall
insulation has been defined throughout this report as internal or external wall insulation
installed through Government programmes.
23Annex A – Background
Energy Company Obligation
The Energy Company Obligation (ECO) is now in its fourth phase. ECO broadly takes over
from two previous Energy Obligation schemes (Carbon Emissions Reduction Target - CERT
- and Community Energy Saving Programme - CESP) and focuses on providing energy
efficiency measures to low income and vulnerable consumers and those living in 'hard-to-
treat' properties.
• ECO1 started on 1 January 2013 (although energy companies were able to count
measures delivered since 1 October 2012, against their targets) and ran to 31 March
2015 for the ECO 1 period.
• ECO2 commenced from April 2015 and ran until 31 March 2017.
• ECO Help-to-Heat commenced from April 2017 and ran until September 2018.
• ECO3 went live on 3 December 2018 but suppliers can count action from October
2018 with the scheme due to run until March 2022.
There have been three main ECO obligations – The Carbon Saving Target (CERO) which
closed in September 2018; Carbon Saving Communities (CSCO) which closed end March
2017 and Affordable Warmth (also known as The Home Heating Cost Reduction Obligation
HHCRO) which is continuing through ECO3.
Energy Suppliers are set targets for each phase of the scheme based on their number of
customers and amount of energy supplied to domestic properties in Great Britain. This
threshold remained the same for ECO1, 2 & Help-to-Heat but is tightening through ECO3.
Suppliers are obligated if on 31 December of the previous year they exceed the customer
number threshold and the electricity or gas threshold.
Table: ECO Supplier Obligation Thresholds: 2013-2022
Up to 3 Dec 3 Dec 2018 – 1 Apr 2019 – 1 Apr 2020 – 1 Apr 2021 –
2018 31 Mar 2019 31 Mar 2020 31 Mar 2021 31 Mar 2022
Number of 250,000 250,000 200,000 150,000 150,000
domestic
customers
Electricity 400 GWh 500 GWh 400 GWh 300 GWh 300 GWh
supply to
domestic
customers
Gas supply 2,000 GWh 1,400 GWh 1,100 GWh 700 GWh 700 GWh
to domestic
customers
24Carbon Saving Target – Closed end September 2018 – This covers the installation of
measures like solid wall and hard-to-treat cavity wall insulation, which ordinarily can’t be
financed solely through Green Deal Plans. From April 2017 this included a rural sub-
obligation where at least 15 per cent of a supplier’s CERO for Help-to-Heat must be
achieved in rural areas.
Carbon Saving Communities Obligation – Closed end March 2017. This provides insulation
measures to households in specified areas of low income. It also makes sure that 15 per
cent of each supplier’s obligation is used to upgrade more hard-to-reach low-income
households in rural areas.
Affordable Warmth Obligation – This provides heating and insulation measures to
consumers who receive particular means-tested benefits. Since April 2017 it enables those
in social housing living in E, F and G rated properties to receive insulation measures, and
some heating measures. This obligation supports low-income consumers who are
vulnerable to the impact of living in cold homes, including the elderly, disabled and families.
Under this scheme, Local Authorities can determine eligible homes under the new ‘flexible
eligibility’ mechanism, introduced in 2017. Up to 25% of the Obligation can be delivered
through Flexible Eligibility under ECO3, up from 10% under ECO Help-To-Heat. Households
can be assessed by local authorities to be 'living in fuel poverty'; or assessed to be 'living on
a low income and vulnerable to cold'. From October 2018 this included a rural sub-obligation
where at least 15 per cent of a supplier’s ECO3 must be achieved in rural areas.
Furthermore, under ECO3, suppliers are able to meet up to 10% of their obligation to deliver
innovation measures to eligible households. A further 10% can be used to monitor the actual
energy performance of measures in homes.
ECO Brokerage
The ECO Brokerage system operates as a fortnightly anonymous auction where GD
Providers can sell ‘lots’ of future measures of ECO Carbon Saving Obligation, ECO Carbon
Saving Communities (until March 2017) and ECO Affordable Warmth, to energy companies
in return for ECO subsidy. New lot types have been introduced over time to reflect changes
to the policy most recently in February 2019 following the start of ECO3.
This market-based mechanism is to support an open and competitive market for the delivery
of the ECO. Brokerage allows a range of GD Providers to fairly compete on price to attract
ECO support and enables energy suppliers to deliver their obligations at the lowest possible
cost, thereby reducing the impact on customer energy bills.
Sellers (GD Providers) can make a competitive offer on brokerage by leveraging additional
sources of finance, such as part funding measures through GD Finance, partnerships with
local authorities, or driving down costs by economies of scale.
25ECO delivery costs
ECO delivery costs are reported by obligated energy suppliers following each reporting
quarter.
ECO delivery costs are defined as the cost of installing an ECO measure in a property.
This includes the costs of technical monitoring, cost of assessment, costs involved with
searching for ECO properties, installation costs and marketing costs by delivery partners
involved with promoting the ECO obligations. Figures up to the end of December 2018 show
aggregate expenditure of £3.81bn.
In addition, administrative costs are collected from suppliers and include: reporting and
compliance, own marketing and direct administrative costs (such as development of IT /
reporting systems to support delivery of the scheme). Figures up to the end of December
2018 show aggregate expenditure of £407m. Suppliers make returns on delivery and
administrative costs by the end of the second month following each reporting quarter.
Full definitions on ECO costs are included here.
26Green Deal
The Green Deal (GD) was launched in January 2013 in England and Wales (and in February
2013 in Scotland). It enables consumers to take out loans to pay for energy efficiency
improvements in their properties, with repayments made through their energy bill.
Repayments are made on a “Pay As You Save” (PAYS) basis: after the improvement has
been made, the consumer begins to save energy, their energy bills are less than they would
have been without the improvement, and these savings are used to repay the loan. A
principle called the “Golden Rule” is intended to ensure that the loan repayments should not
exceed the savings.
Customers having GD Assessments undertaken have the choice of how they proceed. They
might take the view that their home is sufficiently energy efficient, or that they want to finance
work through a GD Plan or that they want to use alternative funding arrangements (e.g. use
of savings).
Uptake of the GD was below expectations and in July 2015 the Government announced
there would be no further public investment in the scheme. The Framework to support the
programme has remained in place to service existing GD Plans and for any private finance
providers wishing to enter the market. The Green Deal Finance Company – the vehicle
created to finance GD loans and in which the Government ended public investment during
2015 – was purchased in January 2017 by new owners, who are now offering new GD plans.
The Government is reviewing the GD and published a Call for Evidence in late 2017 and a
Summary of Responses in July 2018. Any significant proposals for change will be the subject
of consultation.
A brief description of how the GD process works is shown below:
Step 1 – Assessment – A GD Assessor will come to the home, talk to the owner/occupier
about their energy use and see if they can benefit from making energy efficiency
improvements to their property.
Step 2 – Recommendations – The GD Assessor will recommend improvements that are
appropriate for the property and indicate whether they are expected to pay for themselves
through reduced energy bills.
Step 3 – Quotes – GD Providers will discuss with the owner/occupier whether a GD Plan is
right for them and quote for the recommended improvements, including the savings
estimates, savings period, first year instalments and payment period for each improvement.
A number of quotes can be obtained.
Step 4 – Signing a Plan – The customer chooses to proceed with a given provider and
package of measures. The owner/occupier needs to obtain the necessary consent to make
27improvements to the property before they can agree terms with the GD Provider of a GD
Plan20, at which stage they enter a cooling-off period21.
Step 5 – Installation – Once a GD Plan has been agreed, the Provider will arrange for the
improvements to be made by a GD Installer. Once the installation has been completed a
letter is sent to the Bill Payer and, at this stage, the GD Plan goes ‘live’.
Step 6 – Payment ends - ‘live’ GD Plans can be paid off before their expected last payment
date. These are known as ‘completed’ GD Plans.
Following a GD Assessment there have been a range of delivery mechanisms which could
be used to improve the energy efficiency of the property. Using record level data matching
we have estimated the number of households that have benefitted from energy efficiency
installations through more than one delivery mechanism. Full details of this are available in
the accompanying Methodology note.
Legacy Green Deal Schemes
Measures installed from these legacy schemes are still included in table 1.1-1.4 but the
detailed scheme figures are not reported in this release but are available in the 2017
Detailed report.
Green Deal Home Improvement Fund
On 23 July 2015 it was announced that there will be no future funding releases of the Green
Deal Home Improvement Fund (GDHIF).
The GDHIF was an incentive scheme open to all householders in England and Wales
wanting to improve the energy efficiency of their homes. The scheme allowed householders
to choose one or both of two offers and they were eligible to claim up to £7,600.
Householders could also claim a refund of up to £100 for a GDAR. GDHIF release 1 closed
to new applicants at 6:30pm on 24 July 2014. GDHIF release 2 commenced on 10
December 2014 (and closed to new Solid Wall Insulation applicants on 11 December 2014)
and GDHIF release 3 commenced on 16 March 2015 (and closed to new Solid Wall
Insulation applicants on 26 March 2015) and closed for the “two-measure” offer on 30th
September 2015. The scheme closed down in June 2016. A number of different separate
Cashback schemes operated in Scotland (see website for the latest statistics).
20 The Plan is a contract between the owner/occupier and the Provider – it sets out the work that will be done
and the repayments.
21 For example, in the case of a GD Plan that is regulated by the Consumer Credit Act 1974, the consumer will
have 14 days to withdraw from the part of the GD Plan which provides credit.
28Green Deal Communities
The Green Deal Communities scheme was in operation from April 2014 until September
201622. Twenty-three areas in England (covering 98 individual Local Authorities) received
£85 million to help deliver the Government’s Green Deal home energy efficiency
programme.
Participating areas have installed a range of energy efficiency measures, including solid wall
insulation, and other insulation and heating measures. Many areas are providing funding to
householders in rural areas, to the private rented sector and in fuel poverty.
The Supply Chain
To understand more about the organisations and infrastructure underpinning the GD, this
report also includes a section summarising the number of GD Advisors (and Assessor
organisations), the number of GD Providers and the number of GD Installer organisations.
Insulation statistics
The following types of insulation which are included in the estimates of home insulation
levels.
Cavity wall insulation
Many homes built in GB have external walls made up of an inner and outer wall with a small
cavity in between. These have been typical since the 1930s, but some older properties will
also have them. Cavity walls were used initially because they were cheaper (as the inner
leaf could use non-decorative brick) and had a greater resistance to moisture moving from
outside to inside. The presence of a cavity also improves the thermal performance of the
wall, especially if the cavity is insulated. Since the mid-1980s, homes have been increasingly
built with pre-insulated cavity walls, though the type of blockwork used for the inner leaf has
also contributed to the improved thermal performance required by Building Regulations.
Loft insulation
Some loft insulation has been installed in new homes since 1965. Building regulations for
new homes require a roof to have a thermal transmittance (U-value) of at least as low as
0.13 W/m².K (0.15 W/m2.K in Scotland), which would typically be achieved with 300mm of
loft insulation. There is a strong ‘diminishing returns’ effect with savings from increasing the
depth of loft insulation, so the first inch gives about half the savings from full insulation.
Therefore, a threshold of 125mm is used in these statistics since homes with less than this
would expect to see significant improvements in energy efficiency from a top-up.
Solid wall insulation
It is possible to improve the thermal performance of solid walls by adding insulation either
internally or externally. There is a wide variety of technical solutions that can be used to
22 Some installations were until end of November 2016.
29insulate either the internal or external face of the wall. Building regulations require a target
U-value of 0.30 W/m².K to be reached if this modification to the wall is made. It is likely that
installations of solid wall insulation before 2002 (i.e. before the first phase of the Energy
Efficiency Commitment) may not achieve this level of thermal performance, so these are
recorded separately in the statistics.
30Annex B – Sources and Methodology
More information on the methodology is included here.
Green Deal and ECO data sources
Administrative data generated as part of ECO and GD processes is used for this statistical
release.
The following are the main sources of information used in this report:
• Ofgem – who administer the Energy Company Obligation (ECO) and collect
information from energy companies on measures installed under ECO.
• Data on ECO brokerage is publically available following each auction.
• Green Deal Central Charge Database – which manages the recording and
administration of GD Plans including when plans are completed.
• Northgate – who manage the national lodgement of GD measures in England and
Wales
• Energy Savings Trust (EST) – who manage the national lodgement of GD measures
in Scotland
• The Green Deal Oversight and Regulation Body (ORB) – who administer the
certification of GD organisations (including assessors, installers and providers)
Revisions
All data in this release should be treated as provisional and subject to revision.
On occasions, previously published data will need to be revised due to changes to source
data, methodology or correcting of errors. Explanation will be provided for any significant
revisions.
31Annex C - Household Energy Efficiency
schemes
This section of the report presents activity levels on the Energy Company Obligation (ECO)
and Green Deal (GD) between January 2013 and December 2018 alongside figures on
Feed-In Tariffs installations, Renewable Heat Premium Payment voucher redemptions, and
on Smart Electricity and Gas Meter installations that have been previously published in their
own statistical releases. These figures are shown in table 9.1 of the Detailed tables.
ECO and the Green Deal
It is estimated that around 1,947,700 households benefitted from ECO between January
2013 and December 2018. Around 14,700 households installed measures and received
money from the Cashback scheme, around 13,800 households had funded measures
through GD Finance Plans, 35,300 households had funded measures through GDHIF and
15,600 households had measures funded under the Green Deal Communities. There is a
small amount of double counting between these mechanisms (around 24,000 households).
For the latest statistics please see the latest Headline release.
Feed-In Tariffs
The Feed-in Tariff (FITs) scheme was launched in April 2010 and is a financial support
scheme for eligible low-carbon electricity technologies, aimed at small-scale installations
with a capacity of less than 5 megawatts (MW). FITs support new anaerobic digestion (AD),
solar photovoltaic (PV), small hydro and wind, by requiring electricity suppliers to make
payments (generation tariffs) to these generators based on the number of kilowatt hours
(kWh) they generate. An additional guaranteed export tariff is paid for electricity generated
that is not used on site and exported to the grid. The scheme also supports micro combined
heat and power installations with an electrical capacity of 2 kW or less.
The majority of the installations installed under FITs are in the domestic sector (96 per cent)
but as these tend to be smaller in size, the capacity of domestic schemes makes up 46 per
cent of the total capacity installed under FITs. The majority of the domestic schemes are
solar PV (99 per cent). These solar PV schemes cover 98 per cent of the total installed
domestic capacity, whilst domestic wind installations account for 1.5 per cent of capacity.
Between January 2013 and the end of December 2018, 456,400 domestic installations were
confirmed onto the Central FIT Register. Since the FIT scheme began in April 2010 to the
end of December 2018, 801,200 domestic installations were confirmed onto the Central FIT
Register.
32You can also read