Spectroscopic Analysis for Harnessing the Quality and Potential of Gemstones for Small and Medium-Sized Enterprises (SMEs) - Hindawi.com
←
→
Page content transcription
If your browser does not render page correctly, please read the page content below
Hindawi
Journal of Spectroscopy
Volume 2021, Article ID 6629640, 12 pages
https://doi.org/10.1155/2021/6629640

Research Article
Spectroscopic Analysis for Harnessing the Quality and Potential of
Gemstones for Small and Medium-Sized Enterprises (SMEs)

 Imtiaz Ahmad ,1 Suhail H. Serbaya ,2 Ali Rizwan ,2 and Malik Sajjad Mehmood 1

 1
 Department of Basic Sciences, University of Engineering and Technology, Taxila, Pakistan
 2
 Department of Industrial Engineering, King Abdulaziz University, Jeddah 21589, Saudi Arabia

 Correspondence should be addressed to Malik Sajjad Mehmood; msajjad.82@gmail.com

 Received 9 December 2020; Revised 4 April 2021; Accepted 28 June 2021; Published 9 July 2021

 Academic Editor: Daniel Cozzolino

 Copyright © 2021 Imtiaz Ahmad et al. This is an open access article distributed under the Creative Commons Attribution License,
 which permits unrestricted use, distribution, and reproduction in any medium, provided the original work is properly cited.
 Introduction of modern technologies and methods and quality analysis for the gemstone industry are the main strategic initiatives
 of the Small and Medium Development Authority (SMEDA) of Pakistan. In this regard, four natural gemstones Quartz, Pyrope-
 Almandine Garnet, Black tourmaline, and Amethyst brought from Hunza valley Pakistan were analyzed by state-of-the-art
 spectroscopic techniques including EDX, UV-VIS, and FTIR spectroscopy. EDX revealed the traces of Fe, Mg, and Ca in Pyrope-
 Almandine garnet, Mg and Fe in Black tourmaline, Au and Ca in Amethyst. UV-VIS data revealed the values of Urbach energies
 520, 210, 460, and 430 meV, and the values of direct bandgap energies 5.14, 6.12, 5.54, 5.74 eV, respectively. The higher structural
 disorder due to the presence of Fe and other impurities in stones except Quartz was attributed to the higher values of Urbach
 energies and decrease in band gaps: FTIR data Fe-O and Si-O stretching vibration in Pyrope-Almandine garnet, Si-O bending
 vibrations and O-H stretching vibration in Quartz, Si-O-Si bending and stretching vibrations and C�O stretching vibrations in
 Black tourmaline, Ca-O stretching vibrations and Si-OH weak-vibrations in Amethyst. Photoluminescence results also showed
 useful information in investigating the properties of gemstones.

1. Introduction of gemstones has significant value for the commercial trade
 of natural gemstones. Therefore, a robust qualitative and
Mineral deposits play a vital role in the economic devel- quantitative analytical technique is required for dis-
opment of a country, and in this regard, Pakistan is well tinguishing synthetic and natural gemstones. In this regard,
known for its abundance of natural resources and beauty. refractometers, polariscopes, hand spectroscope, and mi-
Especially northern and northwestern areas are rich with croscopes were being used in gemstones identification in
minerals incorporating precious and semiprecious gem- the past. Nowadays, most sophisticated techniques like
stones. Of particular importance, these areas are blessed ultraviolet visible (UV-VIS) spectrometer, Raman spec-
with huge reservoirs of ruby, sapphire, spinel, emerald, troscopy, infrared spectroscopy, electron dispersive X-ray
Quartz, topaz, tourmaline, and aquamarine. The afore- spectroscopy, and X-ray fluorescence (XRF) are used for
mentioned types/classes of gemstones have great signifi- detail qualitative and quantitative analysis of natural
cance due to their wide use in jewelry, as well as in gemstones in order to separate them from their artificial
electronic, instrument, and scientific tools. It is, therefore, counterpart [1–4].
necessary to identify and distinguish natural gemstones The color of the natural gemstones is the basic factor for
from their synthetic counterparts to avoid the imitation of determining the quality and commercial significance, and
natural ones. Most of the gemstones are colorless in nature there are multiple factors for the origin of these colors in gem
and they are colored by some trace elements as impurities. minerals [2, 5–7]. Geologists have identified the following
These trace elements can serve as fingerprints for the five mechanisms which are responsible for the color of
identification and provenance of gemstones. Identification gemstones [8–10].
2 Journal of Spectroscopy

 (i) Disperse metal ions causes the color in the gem- identification and classification on the basis of properties
 stones. Illumination of dispersed metal ions by a like color and inclusion, morphism (Iso and poly), anisot-
 light source absorbs certain wavelengths and can ropy (optical), crystallinity index, H2O contents, and pol-
 cause the electrons to jump to some temporary yphysicity, etc. The associated functional groups were used
 higher state. Luminescence is emitted as energy for the estimation of all the abovementioned properties.
 from electrons and confers color to the gemstones. However, still, more in-depth analysis is required to have a
 The recognition of the ion is not the only factor that precise qualitative and quantitative analysis of gemstones
 can affect the color of gemstones; other factors like from different localities.
 the valence state, nature of neighboring atoms, and In this paper, characterization of four natural gemstones
 ion coordination also take part in coloration in including Quartz (colorless), Pyrope-Almandine Garnet
 gemstones. (purplish-red), Black tourmaline, and Amethyst (light
 (ii) When the absorption occurs, then electrons jump purple) brought from Hunza valley (Gilgit Baltistan) is
 from one atom to another atom that causes the performed. All four precious ornaments are primarily
 coloration of the gemstones. characterized with EDX spectroscopy for investigating the
 trace elements. Subsequent to EDX, FTIR spectroscopy was
 (iii) Irradiation of gemstones can affect the metal ions
 performed to identify the major functional groups in each
 and change their oxidation state along with the
 sample. In addition, UV-VIS spectroscopy is performed to
 color center.
 figure out the Urbach energy, direct and indirect bandgap
 (iv) Absorption can be occurred due to the transition of energies of each stone. Actually, the main theme is to explore
 energy bands that can cause the color. the electronic transitions responsible for the color origi-
 (v) Phenomena like interference, scattering, diffraction, nation and to develop the correlation among the electronic
 and inclusion can change the color of gemstones. properties with the molecular ones. Furthermore, a Pho-
 toluminescence study was carried out to further investigate
 In order to have fully explored the nature of scientific
 the trace elements and meaningful information about the
phenomena responsible for giving color to gemstones,
 identification of gemstones.
various spectroscopic methodologies including UV-VIS,
FTIR, XRD, XRF, EDX spectroscopy, are used [11–13]. In
this regard, Kassem et al. [14] have characterized the Quartz
 2. Experimental
sample (milky color) belonging to a wadi of the eastern 2.1. Materials. Four natural gemstones which are investi-
desert of Egypt, i.e., Araba, while using a number of tech- gated in this study are Quartz (colorless), Pyrope-Almandine
niques including SEM, XRD, UV-VIS, FTIR, XRF, and Garnet (purplish-red), Black tourmaline, and Amethyst
inductively coupled plasma-optical emission spectra (ICP- (light purple). These samples were brought from Hunza
OES) and electron spin resonance (ESR) technique to assess valley (Gilgit Baltistan), Pakistan. The information about the
the radiation treatment effect on the color of Quartz. The chemical composition of each stone is given below.
FTIR spectra results revealed the increased absorption bands
for [Al- OH/Na]+ and [Al-OH/Li]+ on irradiation. UV-VIS (i) Quartz is the most abundant mineral in the crust of
spectra reveal an increase in bandgap properties on irra- Earth and is found in tetrahedron form, and its
diation while ESR spectroscopy has shown a significant chemical composition is SiO2.
increase in peak intensity. Although Kassem et al. [14] have (ii) Pyrope-Almandine Garnet is a mixed variety of
used many techniques, unfortunately, the correlation among pyrope and almandine garnet, and its general for-
the results of different experimental techniques is missing to mula is (Mg, Fe)3Al2(SiO4)3.
have a solid conclusion. In another study, Branca et al. [15] (iii) Tourmaline constitute the supergroup minerals and
utilized the SEM, XRD, Raman, and FTIR spectroscopy for a its general formula is XY3Z6 [T6O18][BO3]3V3W; In
qualitative investigation of five types of emerald samples which X can be Na, K, Ca, Pb+2; Y can be Li, Mg,
from different localities. They have used the Gaussian Fe2+, Mn2+, Cu2+, Al, V3+, Cr3+, Fe3+, Mn3+, Ti4+; Z
deconvolution for the identification/quantification of OH can be Mg, Fe2+, Al, V3+, Cr3+, Fe3+; T can be Si, B,
and Si-O contents while figuring out the hidden peaks in Al; B �B; V can be OH, O; W can be OH, F−, O2_.
3400–3800 cm−1 and 1000–1300 cm−1, respectively. In ad- Black tourmaline is a black color variety of tour-
dition to peak deconvolution, they also used spectral dif- maline group, and its chemical formula is NaFe3[Al,
ferentiation for establishing the proper correlation for alkali Fe]6[Si6O18][BO3]3[OH]3OH.
contents within the beryl channels. However, a major
 (iv) Amethyst is the purple color variety of Quartz and
limitation of this smart systemic approach is its narrow line
 its composition is the same as that of Quartz. The
of investigation as far as the regime of the research area is
 purple color of Amethyst is caused by the traces of
concerned, i.e., alkali contents. More recently, Izzo et al. [16]
 iron impurities or other transition elements.
have established a comprehensive information bank of 192
FTIR spectra of geomaterials for the mineralogical com- All stones have been used as received without any further
munity. This data set offers a robust tool for gemstone treatment.
Journal of Spectroscopy 3

2.2. Sample Characterization where Eg is the bandgap energy and is either direct or in-
 direct depending on the value of x, If x � 1/2, then the above
2.2.1. EDX Testing. For the observation of trace elements equation gives the values of the allowed direct transition, If
within each stone, a small piece of each stone was crushed x � 2, then the above equation gives the value of indirect
and examined under the scanning electron microscopy transitions, and K is a constant within the given frequency
model JSM-5910 SEM (JEOL Company, Japan). The ele- range.
mental composition of the samples was obtained through an For determination of direct and indirect transition, a
EDS analysis by utilizing Field Emission Gun of Scanning graphical approach is used, where extrapolation of linear
Electron Microscope (FEG-SEM, SE-4300, Hitachi Co., regions of [αh]]2 and [αh]]1/2 plots to Y axis � 0 on energy
Tokyo, Japan), which was equipped with an Electron Dis- axis give the values of direct and indirect energy bands gaps.
persive X-ray Diffraction (EDS) probe and a cath- As α is proportional to the Kulekha–Munk function F(R)
odoluminescent (CL). The accelerated voltage was 5 kV with given as follows:
magnification between 2,000X to 70,000X.
 K (1 − R)2 (4)
 [F(R)] � � ,
 S 2R
2.2.2. FTIR Testing. The infrared spectroscopy (in total at-
tenuated reflectance mode) of pure all stones was performed where [F(R)] is remission or Kubelka-Munk function
in the laboratory by using Nicolet-6700 Fourier transform (KMF), R is reflectance, K is the absorption, S is the scat-
infrared spectrophotometer (Thermo Electron Corporation, tering from sample, respectively.
Waltham, MA, USA) at a resolution of 4 cm−1 from It is, therefore, used here for the calculation of Urbach
400 cm−1 to 6000 cm−1. The FTIR spectra were standardized energy and band gap properties.
and significant vibration groups were recognized and as-
sociated with the main chemical group. In order to reduce 2.2.4. Photoluminescence Testing. Photoluminescence is the
the signal-to-noise ratio (SNR), spectra were taken from process in which a substance absorbs electromagnetic ra-
three/four points and then averaged to have a single spec- diation in the form of photons and reradiates photons.
trum for each sample [17]. Quantum mechanically, it is defined as the excitation of
 electrons to higher energy states and then relaxes to lower
2.2.3. UV-VIS Testing. The stones under investigation were energy states accompanied by emission of light. Photo-
tested on Perkin Elmer DRS setup Model Lamda 950 luminescence spectroscopy measures the emission spectra,
equipped with a 150 mm integrating sphere, which is which reveals only the lower energy features. In this study,
available at National Center for Physics, Islamabad, Paki- the gemstones were analyzed by Photoluminescence spec-
stan. The reflectance measurements were carried out over trometer DONGWOO OPTRONIC CO. Ltd. with a Laser
the spectral range 250–100 nm and further processed to exciting wavelength of 325 nm.
extract the spectroscopic and bandgap properties. The detail
of processing the reflectance data is given below. 3. Results and Discussion
 The absorption coefficients over the wavelength of in-
terest are utilized for determining the Urbach energy and Chemical analysis of samples was carried out by SEM/EDX
bandgap energies (Eg) [18]. The value of absorption coef- that revealed the concentration of each component element
ficient at a particular wavelength is the ratio of absorption to and impurity traces. The results of EDX are tabulated in
sample thickness and is represented as α, i.e., Table 1 and it can be seen as follows:

 A (i) Traces of Ca, Mg and Fe in Pyrope-Almandine
 α� , (1) Garnet
 d
 (ii) Traces of Mg and Fe in Black tourmaline
where α is the absorption coefficient, A is the absorption, and
d is the thickness of the sample. (iii) Traces of Au and Ca in Amethyst
 For the calculation of Urbach energy which is denoted by (iv) No trace elements or impurity contents were ob-
Eu, the following relation is used [all relevant ref]. served in Quartz.

 α � α0 exp(h]/Eu ) , (2) In UV-VIS spectroscopy, the sample is irradiated by an
 ultraviolet and visible portion of the spectrum. When a
where α is the absorption coefficient, h] is the photon certain band of UV-Visible spectrum matches the certain
energy. electronic transition of the sample, then it will be absorbed.
 The slope of the ln (a) vs. h] plot in the lower photon The absorbed energy of the electron must be equal to the
energy region is used for the calculation of Eu of each energy gap between the two levels; as a result of the
sample. For the calculation of bandgap energies direct and/ aforementioned electronic transition phenomena, an ab-
or indirect, modified Mott and Davis as reported in the sorption spectrum is obtained, called UV-VIS absorption
literature [19, 20] is used. spectrum. In the case of crystalline materials, the ultraviolet
 x region of the spectrum reveals the interesting features of
 αhv � K hv − Eg , (3) sample due the band to band transition. Among these
4 Journal of Spectroscopy

 Table 1: Concentration of impurities within the gemstones characterized in this study.
Gem stone Au Ca Mg Fe Na Al Si O
 wt.% — 1.09 3.63 20.00 — 10.57 17.15 47.56
Pyrope-almandine garnet
 A% — 0.60 3.31 7.94 — 8.59 13.54 65.92
 wt.% — — — — — — 48.10 60.90
Quartz
 A% — — — — — — 26.78 73.22
 wt.% — — 1.49 8.98 0.98 19.24 18.88 50.44
Black tourmaline
 A% — — 1.27 3.35 0.89 14.84 14.00 65.65
 wt.% 4.68 0.66 — — — — 53.31 41.34
Amethyst
 A% 0.53 0.37 — — — — 41.97 57.14
Note. Boron was not detected in Black tourmaline EDX spectra due to low X-rays energy.

features, absorption edge close to short wavelength is of which belongs to SiO2 absorbance, thus complementing the
particular importance because this absorption is due to the EDX results given in Table 1. From Figure 1(c), it was
excitation of electrons from the valence band to the con- observed that the UV-visible spectra of Black tourmaline
duction band [21, 22]. This transition from valance-to- revealed the absorption bands of Mg at wavelengths of 263,
conduction bands, i.e., absorption edge in the shorter 301, 340, 351, and 381 nm and Fe at 437, 469, 532, and
wavelength region, has meticulous importance in the field of 701 nm. The iron band 701 nm is assigned to 6A1g (S) ⟶
 4
electronic structure. In addition to such absorption in the T1g (G) transition, the band 532 nm is assigned to 6A1g
shorter wavelength or UV regions, the absorption in the (S) ⟶ 4T2g (G) transition, while the bands 469 nm and
visible region is responsible for the coloration of an object, 437 nm are assigned to 6A1g (S) ⟶ 4A1g (G), 4Eg (G)
and the color is the most attractive characteristic of gem- transitions, respectively. The spectrum of Amethyst is shown
stones that arise at different wavelengths. In most of the in Figure 1(d), which revealed the absorption band of Au at
cases, transition metals (Fe, Mn, Co, Ni, Cu, Ti, Cr, V) are 550 nm, which is assigned to 2Eg (2D) ⟶ 2T2g (2D) tran-
responsible for the coloration of gemstones due to the ab- sition and the Ca bands revealed at 344, 309, and 272 and
sorption of visible light. These transition metals can be 256 nm. As impurities of iron changes the purple color to
present as part of impurities or as part of the chemical Amethyst, but Amethyst used in this study has a light purple
composition of gemstones. The transition metals have the color and revealed the weak absorption of Au impurities at
partially filled d-orbital. When the wavelength having 550 nm. Therefore, it means that very weak absorption of Au
suitable energy raises the unpaired electron to higher energy in the visible region may cause the light purple color in
states, the energy of such wavelength is completely absorbed Amethyst, and thus, in this case, Au impurities cause the
by electrons, thus giving the absorption spectrum in gems light purple color in Amethyst. The results of EDX shown in
due to d-orbital’s transition. These transition metals are Table 1 are in total agreement with the UV-VIS
identified by the UV-VIS spectrum of gemstones in ac- spectroscopy.
cordance with their specific absorption bands [23]. Urbach energies (Eu) or the optical activation energies of
 Figure 1(a) shows the UV-VIS spectrum of Pyrope- the gemstone, which are calculated from UV-VIS absorption
Almandine Garnet in which absorption peaks of Fe were spectra, are given in Table 2. Urbach energy was calculated
observed in the visible region, Mg and Ca in UV region. from the plot of ln[F(r)] (shown in Figure 3) on the y axis
Following are the identified absorption bands in the UV-VIS versus the photon energy on the x-axis while calculating the
spectrum shown in Figure 1. reciprocal of the slopes of the linear portion in the shorter
 (i) The UV-VIS spectra of Pyrope-almandine garnet wavelength region. The reason for choosing the Kublekha
 revealed the absorption bands of Ca at 266, 243, 228, Munk function for the calculation of Urbach energy is the
 and 205 nm, while Mg at 371, 336, 318, and 292 nm linear dependence of F(R) on the absorption coefficient α.
 and Fe at 701, 574, 507, and 426 nm. Urbach energy is among the important parameters as far as
 optical transitions are concerned and has a correlation to the
 (ii) The Iron band at 701 nm is assigned to 6A1g (S) ⟶
 4 structural disorder of the material under investigation. This
 T1g (G) transition, the bands 574 nm and 507 nm are
 means that the higher value of Urbach energy reveals a low
 assigned to 6A1g (S) ⟶ 4T2g (G) transitions, while
 crystalline structure while a smaller value reveals a higher
 the band 426 nm is assigned to 6A1g (S) ⟶ 4A1g (G),
 4 crystalline structure. Thus, Urbach energy indicates the
 Eg (G) transition.
 structural disorder or imperfection in materials. These
 The EDX data shown in Table 1 and documented results structural imperfections arise due to the formation of lo-
in the literature [24, 25] are in agreement with our findings. calized energy states close to the boundaries of the energy
Furthermore, the higher concentration of Fe, i.e., 20% by gap. Urbach energy is also inversely proportional to the
weight within the matrix of this gem stone, is the reason for optical band gap energy [18, 19]. The values of Urbach
the purplish-red color of Pyrope-Almandine Garnet (see energies of Pyrope-Almandine garnet, Quartz, Black tour-
Figure 2). Shown in Figure 1(b) is the UV-VIS spectrum of maline, and Amethyst are 0.52 eV, 0.21 eV, 0.46 eV, and
Quartz. It shows only one absorbance peak at 321.9 nm, 0.43 eV, respectively. The smaller value of Urbach energy for
Journal of Spectroscopy 5

 9 Mg 9

 Ca
 Ca Mg
 6
 6 Ca
 Absorbance

 Absorbance
 3
 3
 Mg Fe
 Fe Fe SiO2
 Fe
 0
 0

 200 400 600 800 1000 200 400 600 800 1000 1200
 Wavelength (nm) Wavelength (nm)
 Pyrope-almandine garnet Quartz
 (a) (b)

 8 8

 6 Mg Mg 6
 Mg Mg
 Mg
 Fe Ca Ca
 Absorbance
 Absorbance

 Fe
 4 Fe Fe 4

 Ca
 2 2
 Ca Au
 0 0

 −2 −2
 200 400 600 800 1000 1200 200 400 600 800 1000 1200
 Wavelength (nm) Wavelength (nm)
 Black tourmaline Amethyst
 (c) (d)

 Figure 1: UV-VIS spectrum of (a) pyrope-almandine garnet, (b) Quartz, (c) Black tourmaline, and (d) Amethyst.

 (a) (b)
 Figure 2: Continued.
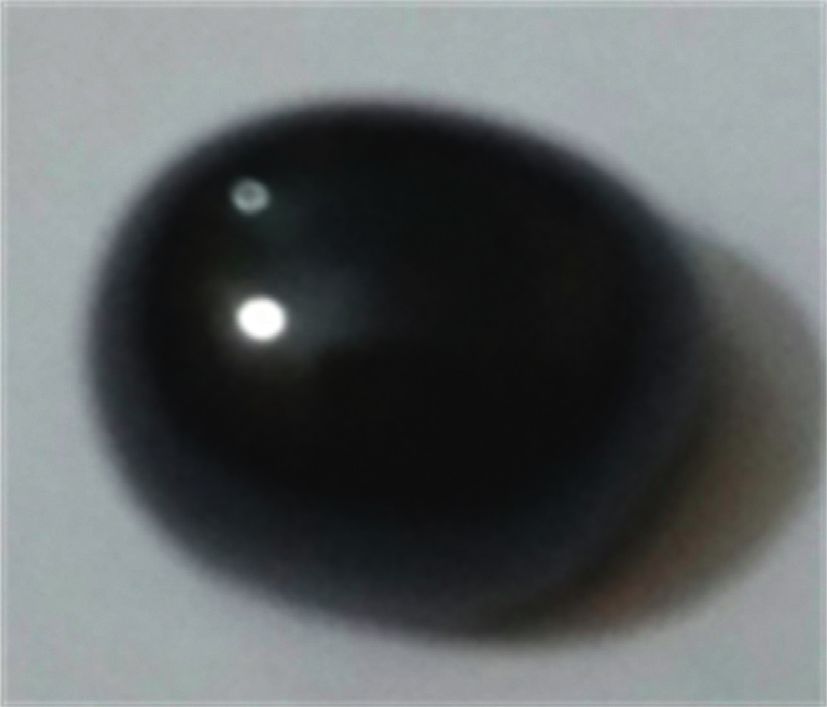
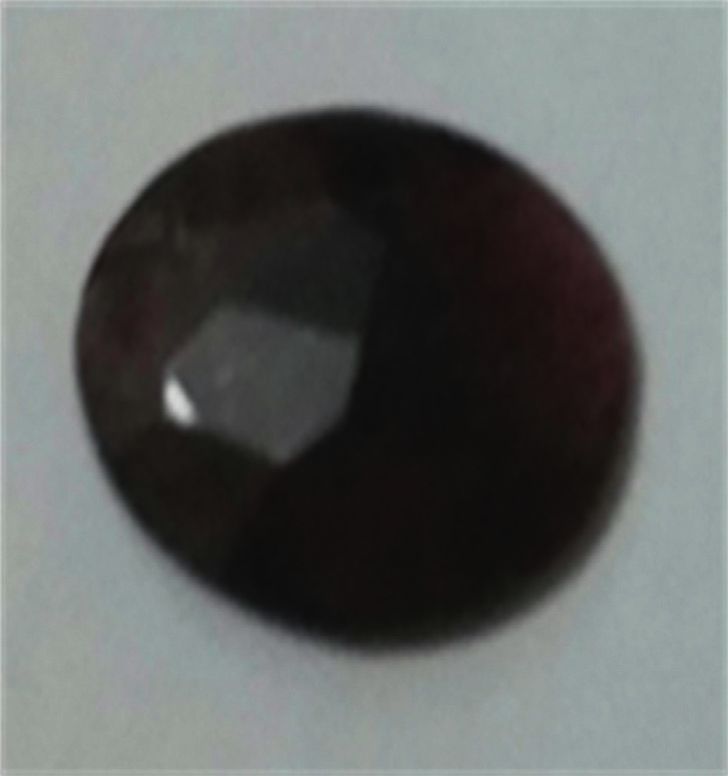
6 Journal of Spectroscopy

 (c) (d)

Figure 2: Screen shots of stone investigated in this study: (a) Quartz (10 Ct) (b) Pyrope-almandine garnet (5Ct), (c) Black tourmaline (30
Ct), and (d) Amethyst (5 Ct).

Table 2: Urbach energy of gemstones calculated by the slope of the Table 3: Direct bandgap energy is calculated by extra plotting the
best fit line through vertical segments of plots from Figure 3 vertical segment of the plot with intercept x-axes from Figure 4.
Samples Slope Urbach energy (meV) Sample Direct band gap energy (eV)
Pyrope-almandine garnet 1.93 520 Pyrope-amandine garnet 5.14
Quartz 4.75 210 Quarts 6.12
Black tourmaline 2.17 460 Black tourmaline 5.54
Amethyst 2.32 430 Amethyst 5.74

 structure compared to Quartz and is also evidence of higher
 4
 impurity contents. The EDX data of Pyrope-Almandine
 3 Garnet also agree with our finding of higher values of
 Urbach energy and structural disorder. The value of Urbach
 2
 energy of Pyrope-Almandine Garnet found in this study is
 1 520 meV. That is, it might be due to the higher percentage of
 Fe by weight, i.e., ∼ 20% by weight (see Table 1). The reported
 0
 Ln[F (r)]

 results of Urbach energy for Fe oxide by Zhao et al. [27] are
 −1 in good agreement with our finding for this gemstone. The
 values of Urbach energy for Black tourmaline and Amethyst
 −2 are 0.46 and 0.43 eV, respectively. These values are also
 higher and evident by the presence of impurities within these
 −3
 samples. The value of Urbach energy for Black tourmaline
 −4 might belong to the Mg contents present in this sample as it
 is recently reported by Singh et al. [28] that the sample
 −5
 containing the 50% contents of Mg+2 has the value of
 1 2 3 4 5 6 7 Urbach energy to 0.46 eV. The values of Urbach energy for
 Energy hv (eV) Amethyst might be due to the Ca.
 Garnet Black tourmaline Direct bandgap energies of all gemstones were calculated
 Quartz Amethyst by plotting the [F(r)xhѵ]2 as a function of photon energy hѵ.
Figure 3: Plot of ln[F(r)] versus Photon energy (h]) for the cal- Afterward, extra plotting the vertical segments of the plot to
culation of Urbach energy. intercept the x-axes gave the bandgap energies shown in
 Figure 5. As the absorption coefficient is directly propor-
 tional to the absorbance F(r); therefore, here in this study,
Quartz, i.e., 0.21 eV reveals the fact that Quartz sample used F(R) is used for calculating the energy band gaps. The
in this study has the high crystalline structure with almost calculated values of bandgap energies of all gemstones are
negligible traces of impurities. Further, the observation is given in Table 3. Pyrope-Almandine Garnet showed a
consistent with the recently reported Urbach energy range of bandgap energy of 5.14 eV, which is attributed to SiO2 that is
SiOx for x < 2, i.e., 0.172–0.523 eV depending upon the the major component of garnet. The decrease in bandgap
contents of oxygen [26]. Pyrope-Almandine Garnet has a energy is due to the presence of impurities of Fe, Mg, and Ca,
higher value of Urbach energy which shows a low crystalline as found from EDX data. The value of bandgaps for Quartz
Journal of Spectroscopy 7

 5 5

 2925
 4 4

 3066

 3796
 3730
 3597
 2924
 Transmittance (a.u.)
 Transmittance (a.u.)

 3190

 3484
 3 3

 3310
 3379
 2 2

 2820

 2592
 2677
 1 1

 2488
 2351

 3673
 3740
 1034

 430
 657

 2327
 424

 0

 2260
 0

 496
 677

 1133
 0 1000 2000 3000 4000 0 1000 2000 3000 4000
 Wavenumber (cm−1) Wavenumber (cm−1)

 Pyrop-almandine garnet Quartz (colourless)
 (a) (b)
 0.30
 5.3
 0.25

 3920
 3797
 5.2
 Transmittance (a.u.)

 725
 0.20
 Transmittance (a.u.)

 678

 1285
 1389
 0.15

 1625
 582

 5.1
 1123

 3332
 2924
 422

 3455
 2412
 2289
 496

 2517
 449

 0.10
 5.0
 953
 467

 0.05
 545
 639

 4.9
 782

 1076

 0.00
 953
 1171

 1597

 3531
 3796
 1767

 3313
 1303

 3465

 0 1000 2000 3000 4000 0 1000 2000 3000 4000
 Wavenumber (cm−1) Wavenumber (cm−1)

 Black tourmaline Amethyst (light purple)

 (c) (d)

 Figure 4: FTIR spectra of (a) pyrope-almandine garnet, (b) Quartz, (c) Black tourmaline, and (d) Amethyst.

found in this study is 6.12 eV (see Table 3), which in total bands at 3673 and 3740 cm−1 are also there in the FTIR
agreement with the values reported in the literature, i.e., spectra of Pyrope-Almandine Garnet (see Figure 4). Vi-
6.3 eV [29, 30]. Black tourmaline revealed the bandgap brational peaks observed at 424 cm−1 and 657 cm−1 are at-
energy of 5.54 eV. As SiO2 is the major component of Black tributed to Fe-O. The peak at 1034 cm−1 occurred due to Si-
tourmaline; therefore this bandgap 5.54 eV is attributed to O stretching vibration. The stretching vibration of C�O
SiO2. Amethyst revealed a bandgap energy of 5.74 eV. observed at 2334 cm−1, while peaks at 2820 and 2925 cm−1
Amethyst is the purple color variety of Quartz due to the may be resulted due to O-H stretching vibrations or might
presence of Fe impurities. In this study, Amethyst revealed be caused by other impurities [25]. The smaller peaks ob-
the impurities of Au and Ca that caused the decrease in the served at 3673 and 3740 cm−1 might be due to Fe-OH-vi-
bandgap energy of Amethyst. The inverse proportion of brations [31].
Urbach energy with the direct band gaps energies is also in Figure 4 shows the FTIR spectra of Quartz, in which
agreement with the literature [29]. absorption peaks at 430, 496, and 677 cm−1 are attributed to
 FTIR spectra of all gemstones under investigation are Si-O bending vibrations, while the peak at 1113 cm−1 is
shown in Figure 4. Pyrope-Almandine Garnet revealed attributed to stretching vibration of Si-O [32, 33]. The
FTIR-vibrational bands at 424, 657, 1034, 2351, 2630, and bands that appeared at 2260 and 2327 cm−1 are attributed
2925 cm−1. In addition to these bands, very small absorption to weak Si-OH-vibrations [34]. Strong bands at 2488, 2592,
8 Journal of Spectroscopy

 3000

 2500

 2000

 [F (r) × hv]2
 1500

 1000

 500

 0

 1 2 3 4 5 6 7 8
 Energy hv (eV)
 Garnet Black tourmaline
 Quartz Amethyst

Figure 5: Plot of [F (r)xh]]2 versus photon energy shows the direct bandgap energies of the garnet, Quartz, Black tourmaline, and Amethyst.

and 2677 cm−1 are observed due to Si-O stretching. In Figure 4(d) shows the spectra of Amethyst. As Amethyst
addition to this, strong bands were observed at 2924 and is a purple color variety of Quartz due to the presence of iron
3066 cm−1, which are always present in Quartz according to impurities, therefore, some of its FTIR bands can be cor-
previous literature [35]. The origin of these bands might be related with Quartz and the bands may vary within
the O-H stretching vibration. The bands observed at 3190 10–20 cm−1. The less intense bands at 449, 496, 582, 678, and
and 3310 are attributed to Si-O stretching, the bands at 725 cm−1 are attributed to Si-O bending and some bands
3379 cm−1 and 3381 cm−1 are ascribed to Al-OH and AlSi- might be due to Ca-O stretching vibrations, while the intense
OH/Li-vibrations, respectively [36], since Al3+ and Fe3+ bands at 953 and 1123 cm−1 attributed to Si-O strong
replace the Si4+ in the center of SiO4 tetrahedron and stretching vibrations, the bands at 1285 and 1389 cm−1 are
designated as AlSi3+ or FeSi3+, the charge deficiency is attributed to Si-OH weak-vibrations, the band at 1625 cm−1
fulfilled by interstitial monovalent ions (H+, Li+ and Na+) might be resulted due to C�O stretching vibration, the bands
considered as charge compensators. The band at 3597 cm−1 appeared at 2289 cm−1 attributed to Si-OH weak-vibration,
is ascribed to AL-OH/Na stretching vibration [37]. Typical bands at 2412, 2517 and 2924 cm−1 are attributed to Si-O
noise was observed between regions of 3600 and 4000 cm−1 stretching vibrations. The band at 3332 cm−1 is attributed to
in accordance with previous literature [38]. It is also AlSi-OH-vibration, the band at 3455 cm−1 attributed to AlSi-
possible that the bands appeared at 3730 and 3796 cm−1 and OH/Na-vibration, the bands at 3579.1 to 3580.5 cm−1, 3395.2
in this region may be resulted due to the presence of Fe- to 3415.4 cm−1, and 3351.5 to 3354.4 cm−1 are probably
OH-vibration. related to iron according to previous literature [37], but
 Figure 4(c) shows the spectra of Black tourmaline, in these bands are not observed in Amethyst sample. The bands
which the main bands observed at 422, 467, 545, and 639 at 3787 and 3920 cm−1 may be attributed to Fe-OH
cm−1 are attributed to Si-O-Si bending vibrations, B-O stretching vibrations.
bending vibration, and M-O stretching vibrations (where M Absorption spectra measure the absorbed energy of
can be Fe or Al). The band at782 cm−1 is attributed to Si-O-Si electrons when they jump from lower energy states to higher
stretching vibration; the bands observed at 953, 1076, and energy states, while emission spectra measure the releasing
1171 cm−1 are attributed to Si-O stretching vibrations. The energy of electrons when they jump from higher energy
bands appearing at 1303 and 1397 cm−1 are attributed to B-O states to lower energy states as the absorption spectrum
stretching vibrations. The bands at 1597 and 1767 cm−1 encounters the excitation energy when electrons jump from
might be due to C�O stretching vibrations, while the band at ground state S0 to higher energy states S1, S2, S3, S4, etc. Thus,
3313 cm−1 is ascribed to O-H stretching vibration. The bands it reveals the absorption of higher energy states and lower
at 3465 and 3531 cm−1 are attributed to the stretching vi- energy states and exposes detailed information about the
brations of M-OH3 bonds in yFe zAl zAl environment optical properties and impurities content of a sample. On the
(where M represents Fe and Al). The band at 3796 cm−1 is other hand, PL spectroscopy takes a case of emitted light that
ascribed to strong stretching vibration of M-OH bond in yFe comes due to the transition of lowest energy state S1 to
y
 Fe yFe environment (where M represent Fe). All these ground state S0. When an atom or molecule is excited to
vibrations of Black tourmaline are in good agreement with higher energy states, it ends up in the lowest energy state S1
previous literature [39]. while emitting radiations, then the emission and absorption
Journal of Spectroscopy 9

 200000 Wavelength = 325.89 nm 200000 Wavelength = 325.89 nm
 BG = 3.805 eV BG = 3.805 eV

 150000 150000

 PL intensity (a.u.)
 Intensity (a.u.)

 100000 100000

 50000 50000

 0 0

 200 300 400 500 600 700 800 200 300 400 500 600 700 800
 Wavelength (nm) Wavelength (nm)

 Pyrop-almandine garnet Quartz
 (a) (b)

 325.89 nm
 200000 Wavelength = 325.89 nm 200000 BG = 3.805 eV
 BG = 3.805 eV 544 nm
 520 nm
 150000 150000
 PL intensity (a.u.)

 PL intensity (a.u.)

 100000 100000

 50000 50000

 0 0

 200 300 400 500 600 700 800 200 300 400 500 600 700 800
 Wavelength (nm) Wavelength (nm)
 Black tourmaline Amethyst
 (c) (d)

 Figure 6: Photoluminescence (PL) spectra of (a) pyrope-almandine garnet, (b) Quartz, (c) Black tourmaline, and (d) Amethyst.

spectrum will be the same. However, if an atom directly goes are found as compositional elements from UV-Vis spectra
to the ground state without ends up in the lowest energy shown in Figure 1, e.g., Fe and Mg in pyrope-almandine
state then it only reveals the lowest energy features. The garnet, Ca and Fe in Black tourmaline, while Mg and Ca in
absorption spectrum shows the S0–S1, S0–S2, S0–S3 bands Amethyst. A PL spectra only encounter the emission light
while the emission spectrum shows only S0- S1 band [40, 41]. due to the relaxation of electrons from lowest energy state S1
Mostly the colors of gemstones are caused by the transition to ground state So and reveal the lower energy features, and
elements due to the absorption of visible light, and these also the direct transition from higher energy states to ground
transition metals can be present as impurities or as com- state cannot be measured by PL spectroscopy. In addition to
positional parts of gemstones. Therefore, our UV-Visible this, some molecules absorb the radiations but do not emit
absorption spectra of all four gemstones: pyrope-almandine light. It is, therefore, the bands of Ca, Mg, and Fe in pyrope-
garnet, Quartz, Black tourmaline, and Amethyst have shown almandine garnet, Mg and Fe in Black tourmaline, and Ca in
the absorption bands of Ca, Mg, Fe, and Au both as im- Amethyst are not there in PL spectra. However, emission
purities and compositional constituents (see Figures 1(a)– bands of Au at the wavelength of 522 and 544 nm are there in
1(d)). However, for PL spectra, the situation is different as it PL spectra of Amethyst as an impurity due to the low energy
only encounters the emitted light due to the transition of feature of Au (see Figures 6(a)–6(d)). The bandgap energy is
electrons from lowest energy states S1 to the ground state So. calculated by converting the emission onset wavelength
The bands of Ca, Mg, and Fe in pyrope-almandine garnet, from the lower wavelength side into electron volts. It is
Mg and Fe in Black tourmaline, and Ca in Amethyst are not worth mentioning here that bandgap energy obtained by PL
present in PL spectra in spite of the fact that all of the above spectra is always less than the original band gap as it
10 Journal of Spectroscopy

measures only the lowest energy transition from S1 to So. 4. Conclusion
Therefore, it only reveals lower energy features. In Photo-
luminescence spectra of all four gemstones: pyrope-al- SEM/EDX was used to evaluate the chemical composition
mandine, Quartz, Black tourmaline, and Amethyst, the main and hence the trace elements of all gems. SEM/EDX results
emission bands are observed at the same wavelength revealed traces of Fe, Mg, and Ca in Pyrope-Almandine
325.89 nm that slightly shifted toward a longer wavelength garnet, Mg and Fe in Black tourmaline, Au and Ca in
compared to absorption bands shown in Figures 1(a)–1(d). Amethyst, whereas no impurities were detected in Quartz.
The main emission band at 325.89 nm is also responsible for The UV-Visible technique was successfully employed to
the bandgap of the gemstones and attributed to the SiO2 as identify the trace elements of all samples through their
all the samples contain SiO2 as a major component. Con- absorption spectra with their corresponding absorption
version of wavelength 325.89 nm into energy by E � hc/ʎ peaks, and to confirm the decency of EDX data of particular
gave the bandgap energy of 3.805 eV for each sample. All the importance, data on the Urbach and bandgap energies were
gemstones revealed the same bandgap energy due to SiO2 as reported for the first time, to the best of our knowledge, to
the dominant constituent. The most important observation explore the effects of impurities/trace elements on the
here is that emission bandgap energy is less than the ab- structural and electronic structure of these gemstones.
sorption bandgap energy which is due to the energy dif- Furthermore, FTIR spectroscopy is also successfully used to
ferences between the absorbed and emitted radiations. In characterize the gems to identify the functional group and
this case, both the emission and absorption spectra differ molecular vibrations by their respective band position with
from each other due to different transitions. The emission more reliable values. Photoluminescence results were suc-
spectra and absorption spectra can be the same only if a cessfully interpreted in correlation with UV-Visible spec-
molecule is excited to higher energy states and it often ends troscopy, and it also showed meaningful information about
up in the lowest energy state S1 and then returns to the the identification of gemstones.
ground state with the emission of light.
 Photoluminescence emission peaks of gold are observed Data Availability
in the range of 400–653 nm depending on the interfering
medium (ligand) and exciting wavelength. Ligand induces The data will be made available upon request to the cor-
little changes in the electronic structure of the gold, which responding author.
causes the ligand to metal charge transfer transition due to
which emission fundamentally arises from molecular gold
and few from the atoms. There are two major accepted Conflicts of Interest
explanations about the Photoluminescence mechanism:
 The authors declare that they have no conflicts of interest.
 (i) One is the pure metal quantum confinement effect
 Photoluminescence emission of pure metal origi-
 nated from sp-sp and sp-d transitions.
 Acknowledgments
 (ii) The other explanation is the charge transfer due to Dr. Malik Sajjad Mehmood would like to acknowledge the
 the interaction between functional ligand and metal, University of Engineering and Technology, Taxila and
 i.e., the ligand to metal charge transfer (LMCT) and Pakistan Institute of Engineering and Applied Sciences,
 ligand to metal-metal charge transfer (LMMCT). Islamabad, Pakistan, for providing the platform to complete
 this research work.
 Luminescence dominantly is ascribed to the LMCT effect
rather than the LMMCT effect. However, increasing the
electro positivity of metal can promote the interaction be-
 References
tween ligand and metal. Photoluminescence emission peaks [1] C. M. Breeding, A. H. Shen, S. Eaton-Magaña, G. R. Rossman,
position can be altered due to ligand to metal charge transfer J. E. Shigley, and A. Gilbertson, “Developments in gemstone
transition (LMCT) or metal to ligand charge transfer analysis techniques and instrumentation during the 2000s,”
(MLCT). The charge can be transferred from ligand to metal if Gems & Gemology, vol. 46, no. 3, pp. 241–257, 2010.
the ligand has field orbital and metal has the vacant orbital, [2] S. De Meo, A. Plutino, and A. Rizzi, “Assessing color of
while in other cases, the charge can be transferred from metal gemstones,” Color Research & Application, vol. 45, no. 2,
to ligand if the ligand has the vacant orbital and metal has the pp. 224–234, 2020.
 [3] B. Devouard and F. Notari, “The identification of faceted
field orbital. Here, in this study, for the case of Amethyst,
 gemstones: from the naked eye to laboratory techniques,”
Photoluminescence spectra emission peaks of gold were Elements, vol. 5, no. 3, pp. 163–168, 2009.
observed at 522 and 544 nm because SiO2 is the ligand for this [4] E. Fritsch and B. Rondeau, “Gemology: the developing science
case, which contains the electron-rich oxygen atom. It is, of gems,” Elements, vol. 5, no. 3, pp. 147–152, 2009.
therefore, the emissions peaks of gold at 522 and 544 nm [5] E. Fritsch and G. R. Rossman, “An update on color in gems.
might be assigned to the ligand to metal charge transfer part 1: introduction and colors caused by dispersed metal
transition, i.e., electron transfer from oxygen to gold [42–44]. ions,” Gems & Gemology, vol. 23, no. 3, pp. 126–139, 1987.
Journal of Spectroscopy 11

 [6] E. Fritsch and G. R. Rossman, “An update on color in gems. [23] D. Fisher, S. J. Sibley, and C. J. Kelly, “Brown colour in natural
 part 3: colors caused by band gaps and physical phenomena,” diamond and interaction between the brown related and other
 Gems & Gemology, vol. 24, no. 2, pp. 81–102, 1988. colour-inducing defects,” Journal of Physics: Condensed
 [7] R. J. Tilley, Colour and the Optical Properties of Materials, Matter, vol. 21, no. 36, Article ID 364213, 2009.
 John Wiley & Sons, Hoboken, NJ, USA, 2020. [24] N. Sultana and S. P. Podila, “Almandine gemstone-a review,”
 [8] T. W. Overton and J. E. Shigley, “A history of diamond 2018.
 treatments,” in The Global Diamond Industry, pp. 181–228, [25] S. Sangsawong, V. Raynaud, and V. Pardieu, Purple Pyrope-
 Springer, Berlin, Germany, 2008. Almandine Garnet from Mozambique, Gemological Inst Amer
 [9] S. Karampelas, B. Al-Shaybani, F. Mohamed, S. Sangsawong, 5345 Armada Dr, Carlsbad, CA 92008, USA, 2016.
 and A. Al-Alawi, “Emeralds from the most important oc- [26] J. O. Carneiro, F. Machado, L. Rebouta et al., “Compositional,
 currences: chemical and spectroscopic data,” Minerals, vol. 9, optical and electrical characteristics of SiOx thin films de-
 no. 9, p. 561, 2019. posited by reactive pulsed DC magnetron sputtering,”
[10] D. Skoog, F. J. Holler, and S. Crouch, Principles of Instru- Coatings, vol. 9, no. 8, p. 468, 2019.
 mental Analysis, Thomson Brooks Cole, San Francisco, CA, [27] Y. Zhao, M. E. Sadat, A. Dunn et al., “Photothermal effect on
 USA, 2007. Fe3O4 nanoparticles irradiated by white-light for energy-
[11] S. Karampelas, E. Fritsch, J.-P. Gauthier, and T. Hainschwang, efficient window applications,” Solar Energy Materials and
 “UV-Vis-NIR reflectance spectroscopy of natural-color salt- Solar Cells, vol. 161, pp. 247–254, 2017.
 water cultured pearls from Pinctada margaritifera,” Gems & [28] J. Singh, V. Verma, R. Kumar, and R. Kumar, “Influence of
 Gemology, vol. 47, no. 1, pp. 31–35, 2011. Mg2+-substitution on the optical band gap energy of Cr2−
[12] P. Mazzoleni, G. Barone, S. Raneri, E. Aquilia, D. Bersani, and xMgxO3 nanoparticles,” Results in Physics, vol. 13, Article ID
 R. Cirrincione, “Application of micro-Raman spectroscopy 102106, 2019.
 for the identification of unclassified minerals preserved in old [29] E. Güler, G. Uğur, Ş. Uğur, and M. Güler, “A theoretical study
 museum collections,” Pliniu, vol. 42, pp. 112–124, 2016. for the band gap energies of the most common silica poly-
[13] K. Chang, S. Lee, J. Park, and H. Chung, “Feasibility for non- morphs,” Chinese Journal of Physics, vol. 65, no. 1, 2020.
 destructive discrimination of natural and beryllium-diffused [30] E. Calabrese and W. B. Fowler, “Electronic energy-band
 sapphires using Raman spectroscopy,” Talanta, vol. 149, structure of α quartz,” Physical Review B, vol. 18, no. 6,
 pp. 335–340, 2016. pp. 2888–2896, 1978.
[14] S. M. Kassem, A. Rashad, G. Ahmed, R. A. Fahim, S. Salem, [31] T. Gonzalez-Carreño, M. Fernandez, and J. Sanz, “Infrared
 and electron microprobe analysis of tourmalines,” Physics and
 and S. Ebraheem, “Spectroscopic analysis of irradiated natural
 Chemistry of Minerals, vol. 15, pp. 452–460, 1988.
 quartz and ESR dating aspects,” Arab Journal of Nuclear
 [32] J. Hlavay, K. Jonas, S. Elek, and J. Inczedy, “Characterization
 Sciences and Applications, vol. 53, no. 3, p. 197, 2020.
 of the particle size and the crystallinity of certain minerals by
[15] C. Branca, A. Arcovito, E. Cosio et al., “Combining Fourier
 IR spectrophotometry and other instrumental methods-II.
 transform infrared and Raman spectroscopies with Gaussian
 investigations on quartz and feldspar,” Clays and Clay
 deconvolution: an improved approach for the characteriza-
 Minerals, vol. 26, no. 2, pp. 139–143, 1978.
 tion of emeralds,” Journal of Raman Spectroscopy, vol. 51,
 [33] T. H. Ko and H. Chu, “Spectroscopic study on sorption of
 no. 4, pp. 693–701, 2020. hydrogen sulfide by means of red soil,” Spectrochimica Acta
[16] F. Izzo, C. Germinario, C. Grifa, A. Langella, and
 Part A: Molecular and Biomolecular Spectroscopy, vol. 61,
 M. Mercurio, “External reflectance FTIR dataset (4000-400 no. 9, pp. 2253–2259, 2005.
 cm−1) for the identification of relevant mineralogical phases [34] U. Henn and R. Schultz-Güttler, “Review of some current
 forming Cultural Heritage materials,” Infrared Physics & coloured quartz varieties,” The Journal of Gemmology, vol. 33,
 Technology, vol. 2020, Article ID 103266, 2020. no. 1, pp. 29–43, 2012.
[17] M. S. Mehmood, A. Sanawar, N. Siddiqui, and T. Yasin, [35] F. S. Lameiras, “The relation of FTIR signature of natural
 “Quantification of silane grafting efficacy, weak IR vibration colorless quartz to color development after irradiation and
 bands and percentage crystallinity in post e-beam irradiated heating,” Infrared Radiation, pp. 41–56, InTech, Rijeka,
 UHMWPE,” Polymer Bulletin, vol. 74, no. 1, pp. 213–227, 2017. Croatia, 2012.
[18] M. S. Mehmood, I. Thira, A. Idris, T. Yasin, and M. Ikram, [36] E. H. M. Nunes, F. S. Lameiras, M. Houmard, and
 “UHMWPE bandgap properties -II: effect of post e-beam W. L. Vasconcelos, “Spectroscopic study of natural quartz
 irradiation real time shelf aging in air,” Radiation Physics and samples,” Radiation Physics and Chemistry, vol. 90, pp. 79–86,
 Chemistry, vol. 159, pp. 231–237, 2019. 2013.
[19] M. S. Mehmood, N. Siddiqui, S. A. Maqbool, M. A. Baluch, [37] F. S. Lameiras, E. H. M. Nunes, and W. L. Vasconcelos,
 S. S. Mukhtar, and T. Yasin, “Assessment of c-sterilization “Infrared and chemical characterization of natural amethysts
 and/or cross linking effects on orthopedic biomaterial using and prasiolites colored by irradiation,” Materials Research,
 optical diffuse reflectance spectroscopy,” Optik, vol. 144, vol. 12, no. 3, pp. 315–320, 2009.
 pp. 387–392, 2017. [38] E. H. Nunes, V. Melo, F. Lameiras et al., “Determination of the
[20] N. F. Mott and E. A. Davis, Electronic Processes in Non-crys- potential for extrinsic color development in natural colorless
 talline Materials, Oxford University Press, Oxford, UK, 2012. quartz,” American Mineralogist, vol. 94, no. 7, pp. 935–941,
[21] Y. Xu and M. A. A. Schoonen, “The absolute energy positions 2009.
 of conduction and valence bands of selected semiconducting [39] M. Mercurio, M. Rossi, F. Izzo et al., “The characterization of
 minerals,” American Mineralogist, vol. 85, no. 3-4, natural gemstones using non-invasive FT-IR spectroscopy: new
 pp. 543–556, 2000. data on tourmalines,” Talanta, vol. 178, pp. 147–159, 2018.
[22] J. Jasieniak, M. Califano, and S. E. Watkins, “Size-dependent [40] R. Paschott, “Photoluminescenc” in the Encyclopedia of Physics
 valence and conduction band-edge energies of semiconductor and Technology, Vol. 1, Wiley VCH, Weinheim, Germany,
 nanocrystals,” ACS Nano, vol. 5, no. 7, pp. 5888–5902, 2011. 2008.
12 Journal of Spectroscopy

[41] X. L. Wu, G. G. Siu, C. L. Fu, and H. C. Ong, “Photo-
 luminescence and cathodoluminescence studies of stoichio-
 metric and oxygen-deficient ZnO films,” Applied Physics
 Letters, vol. 78, no. 16, pp. 2285–2287, 2001.
[42] T.-Q. Yang, B. Peng, B.-Q. Shan et al., “Origin of the pho-
 toluminescence of metal nanoclusters: from metal-centered
 emission to ligand-centered emission,” Nanomaterials,
 vol. 10, no. 2, p. 261, 2020.
[43] M. Pattabi and R. M. Pattabi, “Photoluminescence from gold
 and silver nanoparticles,” Nano Hybrids, vol. 6, pp. 1–35, 2014.
[44] J. Liu, P. N. Duchesne, M. Yu et al., “Luminescent gold
 nanoparticles with size-independent emission,” Angewandte
 Chemie International Edition, vol. 55, pp. 1–6, 2016.
You can also read