Multiwavelength properties of a new Geminga-like pulsar: PSR J2021+4026
←
→
Page content transcription
If your browser does not render page correctly, please read the page content below
Mon. Not. R. Astron. Soc. 405, 1339–1348 (2010)                                                                       doi:10.1111/j.1365-2966.2010.16555.x

Multiwavelength properties of a new Geminga-like pulsar:
PSR J2021+4026

L. Trepl,1 C. Y. Hui,2,3 K. S. Cheng,3 J. Takata,3 Y. Wang,3 Z. Y. Liu4 and N. Wang4
1 AstrophysikalischesInstitut und Universitäts-Sternwarte, Universität Jena, Schillergäßchen 2-3, 07745 Jena, Germany
2 Department of Astronomy and Space Science, Chungnam National University, Daejeon 305-764, South Korea
3 Department of Physics, University of Hong Kong, Pokfulam Road, Hong Kong
4 Urumqi Astronomical Observatory, NAO-CAS, 40 South Beijing Road, Urumqi 830011, China

                                                                                                                                                             Downloaded from https://academic.oup.com/mnras/article/405/2/1339/1187263 by guest on 25 January 2021
Accepted 2010 February 15. Received 2010 February 11; in original form 2009 November 19

                                         ABSTRACT
                                         In this paper, we report on a detailed investigation of the multiwavelength properties of
                                         a newly detected γ -ray pulsar, PSR J2021+4026, in both observational and theoretical as-
                                         pects. We first identify an X-ray source in the XMM–Newton serendipitous source cat-
                                         alogue, 2XMM J202131.0+402645, located within the 95 per cent confidence circle of
                                         PSR J2021+4026. With an archival Chandra observation, this identification provides an X-
                                         ray position with arcsecond accuracy which is helpful in facilitating further investigations.
                                         Searching for the pulsed radio emission at the position of 2XMM J202131.0+402645 with a
                                         25-m telescope at Urumqi Astronomical Observatory resulted in null detection and places an
                                         upper limit of 0.1 mJy for any pulsed signal at 18 cm. Together with the emission properties
                                         in X-ray and γ -ray, the radio quietness suggests PSR J2021+4026 to be another member of
                                         Geminga-like pulsars. In the radio sky survey data, extended emission features have been
                                         identified in the γ -ray error circle of PSR J2021+4026. We have also re-analysed the γ -
                                         ray data collected by Fermi’s Large Area Telescope. We found that the X-ray position of
                                         2XMM J202131.0+402645 is consistent with that of the optimal γ -ray timing solution. We
                                         have further modelled the results in the context of the outer gap model, which provides us with
                                         constraints for the pulsar emission geometry such as the magnetic inclination angle and the
                                         viewing angle. We have also discussed the possibility of whether PSR J2021+4026 has any
                                         physical association with the supernova remnant G78.2+2.1 (γ -Cygni).
                                         Key words: stars: neutron – pulsars: individual: PSR J2021+4026 – supernovae: individual:
                                         G78.2+2.1).

                                                                                  located at the edge of the supernova remnant (SNR) G78.2+2.1
1 I N T RO D U C T I O N
                                                                                  (Green 2009; Abdo et al. 2009d). Using the first 6 months of the LAT
The successful launch of the Fermi Gamma-Ray Space Telescope                      data, the timing ephemerides of the pulsar were recently reported
has led us into a new era of high-energy astrophysics. The sensitivity            by Abdo et al. (2009c). It has a spin period of P = 265 ms and a
of the Large Area Telescope (LAT) on the spacecraft is much higher                spin-down rate of Ṗ = 5.48 × 10⁻¹⁴ s s−1 . These spin parameters
than that of its predecessor, the Energetic Gamma-Ray Experiment                  imply a characteristic age of τ sd ∼ 77 kyr, a surface magnetic field
Telescope on the Compton Gamma-Ray Observatory. This enables                      of ∼4 × 10¹² G and a spin-down luminosity of Ė ∼ 1035 erg s−1 .
very efficient searches for γ -ray pulsars. Shortly after its launch, it             Apart from studying the pulsar properties in the γ -ray regime, the
has already expanded the population of γ -ray pulsars considerably                effort in searching for the counterparts in other wavelengths is also
(Abdo et al. 2009a,b,c). Abdo et al. (2009a) have further reported                very important. The broad-band emission properties of pulsars, from
the detections of 16 pulsars with high significance in a blind search,            radio to γ -ray, are crucial in discriminating different competing
including PSR J2021+4026.                                                         models (e.g. see the recent reviews by Cheng 2009; Harding 2009).
   The γ -ray detection of PSR J2021+4026 was first reported in the               This will definitely shed detailed light on many unsettled debates,
Fermi bright source list with a signal-to-noise ratio of >10σ (Abdo               such as whether the high-energy emission and radio emission are
et al. 2009d). The nominal γ -ray position of PSR J2021+4026 is                   originated from the same accelerating region.
                                                                                     In this paper, we report the results from the investigation of the
                                                                                  multiwavelength properties of PSR J2021+4026. In Section 2, we
 E-mail: ltrepl@astro.uni-jena.de                                                describe the searches for the possible X-ray and radio counterparts


C   2010 The Authors. Journal compilation
                                          C 2010 RAS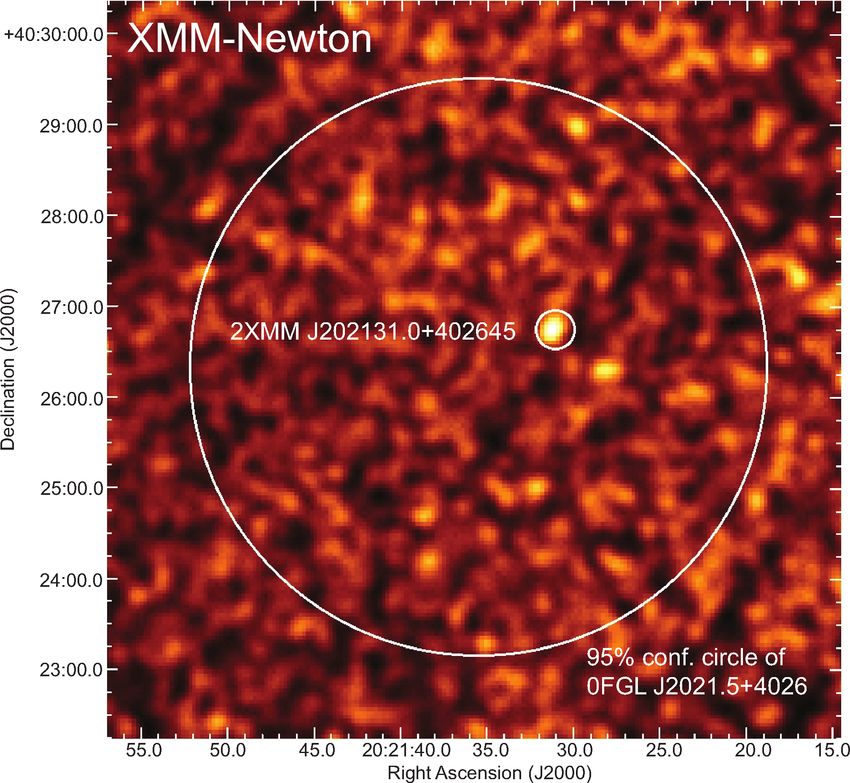
1340 L. Trepl et al.
for the pulsar with both archival and dedicated observations. We
have also analysed all the first-year γ -ray data collected by LAT
in order to constrain its spectral and temporal properties. In Sec-
tion 3, we model the emission properties of PSR J2021+4026 in the
context of the outer gap model. We have further discussed if it is pos-
sible that PSR J2021+4026 has any association with G78.2+2.1.
Finally, we summarize our results in Section 4.
2 DATA A N A LY S I S
2.1 X-ray analysis of the point sources in the error circle
of PSR J2021+4026
Downloaded from https://academic.oup.com/mnras/article/405/2/1339/1187263 by guest on 25 January 2021
In order to search for possible X-ray counterparts of
PSR J2021+4026 detected in a blind search with Fermi LAT, we first
cross-correlated the second XMM–Newton serendipitous source cat-
alogue (XMM SSC; Watson et al. 2009) with the Fermi LAT bright
γ -ray source list, in which PSR J2021+4026 is denoted as 0FGL
J2021.5+4026 (Abdo et al. 2009a). XMM SSC is the largest cata-
logue ever constructed in X-ray astronomy, which contains 221 012
unique sources.1 In particular, we search for all the X-ray sources
in XMM SSC which are located within its 95 per cent confidence
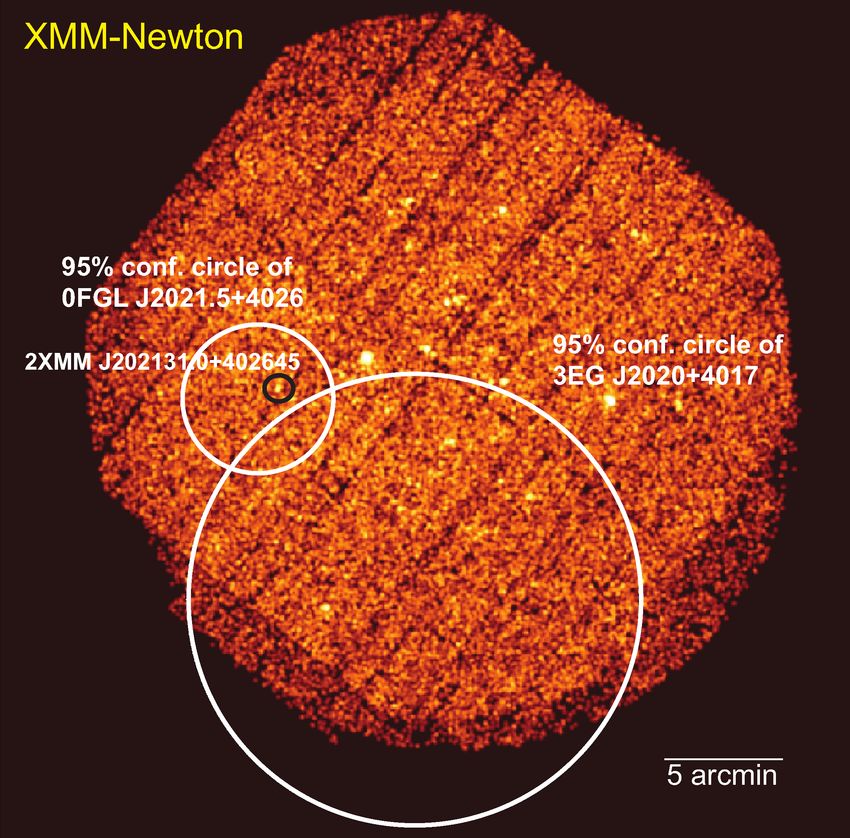
circle. Figure 1. The image as observed by XMM–Newton in the energy range of
In this search, we have identified only one X-ray object, 0.3–10 keV on 2003 December 1 with the MOS1/2 and PN data merged.
2XMM J202131.0+402645, in the 95 per cent error circle of The aim-point of this observation was towards the geometrical centre of
PSR J2021+4026 with a radius of 0.◦ 053. This X-ray source is lo- SNR G78.2+2.1. The 95 per cent confidence circles of the γ -ray sources
cated less than 1 arcmin away from the reported γ -ray position PSR J2021+4026 and 3EG J2020+4017 are illustrated as white circles. The
of the LAT pulsar. The corresponding XMM–Newton observation small black circle indicates the position of 2XMM J202131.0+402645.
was carried out on 2003 December 1 with MOS1/2 (Metal Ox-
ide Semiconductor) and EPIC-PN (the European Photon Imaging
Camera-Positive Negative) detectors operating in a full frame mode
(Obs. ID: 150960801). This observation was pointed to the geomet-
rical centre of SNR G78.2+2.1 with 2XMM J202131.0+402645 lo-
cated ∼8.5 arcmin off-axis. Examining this data set for times of high
background, we note that this observation was contaminated by soft-
proton flares. Cleaning the data by removing these flares results in
effective exposures of ∼5 and ∼2.6 ks in MOS1/2 and PN detectors,
respectively. The combined MOS1/2+PN image of the full field of
view is displayed in Fig. 1 with the error circles of PSR J2021+4026
and 3EG J2020+4017 illustrated. An 8 × 8 arcmin2 close-up view,
centred at the nominal position of PSR J2021+4026, is displayed
in Fig. 2. 2XMM J202131.0+402645 is located just outside the 95
per cent confidence circle of 3EG J2020+4017 (see Fig. 1) which
is the brightest unidentified γ -ray source discovered by EGRET
(Hartman et al. 1999).
Searches for X-ray counterparts of 3EG J2020+4017 have been
reported by Becker et al. (2004) and Weisskopf et al. (2006) with
Chandra Advanced CCD Imaging Spectrometer (ACIS) spectro-
imaging observations. The observation made by Weisskopf et al.
(2006) partly covered the error circle of PSR J2021+4026. This
Chandra ACIS-I observation took place on 2005 February 6 with Figure 2. The 8 × 8 arcmin2 XMM–Newton image in the energy range
an effective exposure time of ∼14 ks (Obs. ID: 5533). The ACIS-I of 0.3–10keV centred at the nominal γ -ray position of PSR J2021+4026.
2XMM J202131.0+402645 is the only source detected in the 95 per cent
image centred at the nominal γ -ray position of PSR J2021+4026 is
confidence circle of the pulsar.
displayed in Fig. 3, which has the same field of view as that in Fig. 2.
The position of source S21 (as labelled in Weisskopf et al. 2006) is
found to be consistent with that of 2XMM J202131.0+402645, and outside the error circle of 3EG J2020+4017, it did not receive
hence we concluded that they are the same object. As it is located enough attention in Weisskopf et al. (2006).
We note that two other X-ray sources detected by Weisskopf et al.
(2006), namely S25 and S28 in their paper, are also found to be lo-
1 The incremental version of this catalogue, used throughout this study, cated within the 95 per cent error circle of PSR J2021+4026 (see
is available at http://xmmssc-www.star.le.ac.uk/Catalogue/xcat_public_ Fig. 3). As a number of important parameters in characterizing these
2XMMi.html. sources, such as the estimate of the source extent and the spectral
C 2010 The Authors. Journal compilation
C 2010 RAS, MNRAS 405, 1339–1348Study of the γ -ray pulsar PSR J2021+4026 1341
counterpart (cf. Weisskopf et al. 2006). These properties make these
two sources very unlikely to have any association with a neutron
star/rotation-powered pulsar (see the discussion in Hui & Becker
2009). On the other hand, no optical counterpart has been identified
with S21 (cf. table 5 in Weisskopf et al. 2006). Also, we do not
find any convincing evidence of temporal/spectral variability for
this source. Therefore, with the existing data, S21 remains to be the
only promising X-ray counterpart of PSR J2021+4026 located in
the 95 per cent confidence circle of the γ -ray pulsar.
Utilizing the Chandra data, the X-ray position of S21 is con-
strained to be RA (J2000) = 20h 21m 30.s 553, Dec. (J2000) =
+40◦ 26 46. 89. The corresponding positional errors in each di-
rection reported by our source detection are δRA = 1. 11 and
δDec. = 0. 73, respectively. To avoid under-estimating the un-
Downloaded from https://academic.oup.com/mnras/article/405/2/1339/1187263 by guest on 25 January 2021
certainties, we have to further consider the nominal pointing un-
certainty of the spacecraft. The uncertainty can be estimated from
the distribution of aspect offset for a sample of point sources with
accurately known celestial positions.2 68 per cent of 70 sources
imaged on ACIS-I have offsets smaller than ∼0.4 arcsec. We
adopted this value as the astrometric uncertainty and added to the
aforementioned quoted errors in quadrature for each coordinate.
Figure 3. The 8 × 8 arcmin2 field centred at the nominal γ -ray position of This gives the resultant 1σ positional errors as δRA = 1. 18 and
PSR J2021+4026 which is partly covered by a Chandra observation. The δDec. = 0. 84.
displayed image is in the energy range of 0.5–8 keV. Three sources located
Although the search for the optical counterpart of S21 by
in the 95 per cent confidence circle of PSR J2021+4026 are labelled with
Weisskopf et al. (2006) yields null detection, we independently
the same designations as in Weisskopf et al. (2006).
looked for any optical identification of this X-ray source in the
United States Naval Observatory (USNC)-B1.0 catalogue (Monet
properties, were not reported by Weisskopf et al. (2006), we decided
et al. 2003) and the Digitized Sky Survey with the improved X-ray
to re-analyse this data set. We have independently performed the
position. Within our estimated 3σ X-ray positional uncertainty, we
source detection with the Chandra data by means of a wavelet algo-
cannot identify any optical counterpart of S21 down to the limiting
rithm. To constrain their source positions accurately, aspect offset,
magnitude of the USNO-B1.0 catalogue (i.e. 21; cf. Monet et al.
which is a function of the spacecraft roll angle, has been carefully
2003). This confirms the result reported by Weisskopf et al. (2006).
checked and corrected prior to the analysis. The source detection
To examine the X-ray emission nature of 2XMM J202131.0+
reports the signal-to-noise ratios of S21, S25 and S28 to be 5.8σ ,
402645 (S21), we make use of both XMM–Newton and Chandra
9.6σ and 2.5σ , respectively. All three sources are found to have
observations that cover it. We extract the source counts from a circle
their spatial extents comparable with the estimated size of the point
with radii of 15 and 20 arcsec in Chandra and XMM–Newton data
spread function (PSF) at their off-axis angles in the CCD. Therefore,
sets, respectively. The extraction regions are chosen to optimize the
based on this Chandra observation, no evidence for any extended
signal-to-noise ratio which corresponds to encircled energy frac-
structure is found to associate with these sources.
tions of > >
≈90 and ≈75 per cent at its location in the corresponding
We noted that the X-ray emission from S25 is found to be highly
detectors in Chandra and XMM–Newton, respectively. The back-
variable in the exposure of Chandra (see Fig. 4). Its long-term
ground spectrum is extracted from a nearby source-free circular
variability is further supported by the non-detection of any source
region with a radius of 40 arcsec in the corresponding detectors.
at its position in the XMM–Newton observation. S28 is a faint X-ray
After the background subtraction, there are 34 ± 6 and 24 ± 5 net
source close to the detection threshold and found to have an optical
source counts available from Chandra and XMM–Newton, respec-
tively. We compute the response files with the XMMSAS tasks RMFGEN
and ARFGEN for XMM–Newton and with the CIAO tools MKACISRMF
and MKARF for Chandra.
With the aid of PIMMS, we can compare the count rates from
different detectors. Adopting the best-fitting spectral parameters
(cf. Table 1), we found that the count rates obtained from different
detectors are consistent. However, as the parameters are poorly con-
strained, it is difficult to properly constrain the source variability.
While the nominal observed flux is about ∼2 × 10⁻¹⁴ erg cm−2 s−1 ,
the 1σ upper limit is at the level of ∼3 × 10⁻¹² erg cm−2 s−1 . There-
fore, ascribing to the limited photon statistics of the existing data,
we are not able to unambiguously conclude whether there is any
flux variability from 2XMM J202131.0+402645.
To further investigate whether this source is a promising pul-
sar candidate, we examined its hardness ratio and constrained its
Figure 4. The light curve of the X-ray source S25 detected by Chandra
2 http://cxc.harvard.edu/cal/ASPECT/celmon/
ACIS-I which has shown its variability during the observation.
C 2010 The Authors. Journal compilation
C 2010 RAS, MNRAS 405, 1339–13481342 L. Trepl et al.
Table 1. Spectral parameters inferred from fitting the Chandra and XMM–Newton observed
spectra of 2XMM J202131.0+402645.
Modela C-stat d.o.f. nH bX /kT f X (0.3-10 keV)
(1021 cm−2 ) (keV) (10−13 erg cm−2 s−1 )
BB 7.42 11 2.24+5.40
−2.24 0.38 ± 0.09 0.36+4.66
−0.32
BREMSS 7.64 11 6.16+5.60
−3.97 0.81+0.54
−0.31 1.09+6.98
−1.09
PL 8.09 11 9.99+8.17
−5.17 4.29+1.72
−1.09 9.21+184.31
−9.21
MEKAL 8.63 11 16.33+6.34
−3.25 0.51+0.17
−0.20 7.38+37.14
−7.38
a PL = power law; BB = blackbody; BREMSS = thermal bremsstrahlung; MEKAL = hot
diffuse gas model based on Mewe, Gronenschild & van den Oord (1985), Mewe, Lemen &
van den Oord (1986), Kaastra (1992) and Liedahl et al. (1995).
Downloaded from https://academic.oup.com/mnras/article/405/2/1339/1187263 by guest on 25 January 2021
of 2XMM J202131.0+402645 is unlikely to be non-thermal domi-
nant. The same inference is obtained from the spectral analysis (see
below).
Owing to the small numbers of collected photons, we adopt the
C-statistic (Cash 1979) for the spectral analysis which is insensitive
to binning. The spectral analysis is performed with XSPEC 12.5 in
the energy bands of 0.3–10 and 0.5–8 keV for the data obtained
from XMM–Newton and Chandra, respectively. In view of the small
photon statistics, we limited our spectral analysis with a simple
single component model. The best-fitting parameters of all the tested
models are tabulated in Table 1. All the quoted uncertainties of the
parameters are 1σ with one parameter of interest.
We found that a single power-law model yields a photon index
of that = 4.29+1.72
−1.09 , which is found to be too steep to be physically
reasonable. The large value does suggest that the X-ray emission
from 2XMM J202131.0+402645 is rather soft, which is consistent
with the inference that resulted from the aforementioned hardness
analysis.
We have also fitted the spectrum with thermal plasma
Figure 5. The hardness ratios of 2XMM J202131.0+402645 as shown in models, namely MEwe-KAstra-Liedahl (MEKAL) and thermal
an X-ray colour–colour diagram (filled circle). The bands are S = 0.5–1 keV, bremsstrahlung. MEKAL is the code that models the plasma in
M = 1–2 keV and H = 2–8 keV. The curves within the triangular boundary
collisional ionization equilibrium which is widely utilized to de-
are the calculated values for a power-law spectrum with the photon index
varying from = 1 (right end) to = 6 (left end) for different adopted
scribe the shock-heated plasma of early-type stars (e.g. Stelzer et al.
column densities. Each open circle along illustrates the position of from 2005; Sana et al. 2007). With the metal abundances fixed at solar
1 to 6 (from right to left) in increments of 1. values, the model yields a plasma temperature of kT = 0.51+0.17 −0.20
keV. However, we note that there are systematic fitting residuals
properties by means of a colour–colour diagram with the combined in ∼1–2 keV. Repeating the analysis with metal abundances at
net counts obtained from both satellites. Following Elsner et al. 50 and 25 per cent of the solar values, we found the systematic
(2008), we used three energy bands in this analysis S (0.5–1 keV), residuals still present. Furthermore, the inferred column density is
M (1–2 keV) and H (2–8 keV). Fig. 5 shows the plot of (H − nH = 1.63+0.63
−0.33 ×10 cm
22 −2
which is found to be higher than the total
S)/T versus M/T, where T is the energy band of 0.5–8 keV. The Galactic neutral hydrogen absorption of 1.4 × 1022 cm−2 (Dickey
filled circle with the 1σ error bars attached represents the location & Lockmann 1990), unless the metal abundance is below 25 per
of 2XMM J202131.0+402645 in this plot. We have also computed cent of the solar values. It is possible that the multiple temperature
the predicted values for a power-law spectrum with the photon in- model might improve the fitting. Nevertheless, the limited photon
dex varying from = 1 to = 6 for different values of hydrogen statistic does not allow us to do so with the existing data. In view of
column absorption. The results are plotted as curves in Fig. 5. By its inadequacy in modelling the X-ray spectrum, we will no longer
definition, all classes of X-ray sources should lie in the triangular consider this model in this paper.
boundary formed by S = M = H = 0. The soft sources which lie For the thermal bremsstrahlung model, it provides a better de-
close to the line H = 0 are most likely field stars in the Milky scription of the data in comparison with MEKAL. This model pro-
Way and the hard sources which lie close to the line S = 0 are vides the description of the continuum of the coronal emission from
likely the background active galactic nuclei (AGNs) or pulsars with a late-type star, which is presumably heated by the magnetic recon-
non-thermal dominant X-ray emission. 2XMM J202131.0+402645 nection (cf. Dopita & Sutherland 2003). It yields a plasma temper-
is marginally located on the right-hand side of the colour–colour ature of kT = 0.81+0.54 −0.31 keV. The unabsorbed flux inferred by the
diagram yet close to the centre. Its hardness is found to be too hard best-fitting model is 1.09+6.98−1.09 × 10
−13
erg cm−2 s−1 in 0.3–10 keV.
for a field star. On the other hand, its location in the colour–colour If the X-ray emission is indeed from a late-type star, the upper
diagram shows that it is modelled by a power law with the photon bound of its distance is estimated to be ∼280 pc by comparing the
index generally larger than 3. This suggests that the X-ray emission best-fitting flux to the saturated X-ray luminosity of ∼1030 erg s−1
C 2010 The Authors. Journal compilation
C 2010 RAS, MNRAS 405, 1339–1348Study of the γ -ray pulsar PSR J2021+4026 1343
constraining the spectral properties, variability as well as the flux
ratios with respect to the γ -ray and optical results.
normalized counts/sec/keV
Apart from yielding the physically reasonable temperature and
10
the flux for the interpretation of pulsar emission, the blackbody
model also provides relatively the least residuals among all the tested
models though they cannot be discriminated unambiguously with
10
the small number of counts. In view of these merits, we are going
to use the results inferred from this model for further discussion in
Section 3.
10
The robustness of the results quoted in this paper is checked by
repeating the analysis by incorporating the background spectrum
residuals
sampled from different source-free regions. It is found that within
the 68 per cent confidence intervals, the spectral parameters inferred
Downloaded from https://academic.oup.com/mnras/article/405/2/1339/1187263 by guest on 25 January 2021
1 2 5 from independent fittings are all consistent with each other.
channel energy (keV) Although the detection of X-ray pulsations at the location of
2XMM J202131.0+402645 would provide us an unambiguous ev-
Figure 6. X-ray spectrum of 2XMM J202131.0+402645 as observed with
MOS1/2, PN and ACIS-I2 and simultaneously fitted to an absorbed black-
idence that it is associated with a γ -ray pulsar, the small photon
body model (upper panel) with the fitting residual (lower panel). statistics and the large frame time of the existing data do not allow
any meaningful timing analysis.
2.2 Radio observations of PSR J2021+4026
for the late-type stellar population (Pizzolato et al. 2003).
Adopting this estimate, we convert the limiting magnitude, mV > 2.2.1 Coherent radio pulsation search
21, of the USNO catalogue to an absolute magnitude of MV > 14
which suggests that the star should not be more massive than an M The identification of 2XMM J202131.0+402645 as a possible X-
star. A deeper optical observation will certainly provide a key role ray counterpart of PSR J2021+4026 does provide us a position
in confirming or refuting this scenario. with arcsecond accuracy. This is very helpful in facilitating further
For the blackbody model, assuming that the source is a pulsar, multiwavelength investigations. With this precise position, we have
it provides a description for the polar cap heating from the return searched for any coherent radio pulse emission.
current in the outer gap (Cheng & Zhang 1999). The blackbody The radio pulsation search at the position of
model yields an effective temperature of kT = 0.38 ± 0.09 keV. 2XMM J202131.0+402645 has been carried out by using
Interestingly, this value is well consistent with the theoretical value the 25-m radio telescope at Nanshan, operated by Urumqi
of the polar cap temperature computed by the outer gap model (i.e. Astronomical Observatory (UAO). The observing system has a
equation 58 in Cheng & Zhang 1999), which is kT = 0.34 keV for the dual-channel cryogenic receiver that receives orthogonal linear
rotational period and the magnetic field of PSR J2021+4026. The polarizations at 18 cm. After mixing down to an intermediate
X-ray spectrum of 2XMM J202131.0+402645 with the best-fitting frequency, each of the two polarizations, with a width of 2.5 MHz,
absorbed blackbody model is displayed in Fig. 6. The best-fitting are fed into a filter bank of 128 contiguous channels. The outputs
parameters of the blackbody model yield an unabsorbed flux of from the channels are then square-law detected, filtered and 1 bit
f X = 0.36+4.66
−0.32 × 10
−13
erg cm−2 s−1 in 0.3–10 keV. Comparing the sampled at the 0.5 ms interval. The data streams of all 256 channels
best-fitting X-ray flux with the γ -ray flux (see below), the flux ratio are written to disc for subsequent off-line processing. For more
is found to be f X /f γ ∼ 2 × 10⁻⁵ which is consistent with the typical details about this system, please refer to Wang et al. (2001).
values of γ -ray pulsars (e.g. Geminga). On the other hand, with the In our observation, we did not find any convincing signal and
limiting magnitude of mV > 21, the nominal X-ray-to-optical flux placed an upper limit for any pulsed radio emission of 0.1 mJy at
ratio is f X /fV > 1. This appears to be higher than that of a field star the position of 2XMM J202131.0+402645.
which typically has a ratio f X /fV < 0.3 (Maccacaro et al. 1988).
However, simply on the basis of the X-ray-to-optical flux ratio, the
2.2.2 Search for the radio emission feature from NRAO/VLA
limit found for 2XMM J202131.0+402645 is too low to rule out
Sky Survey
the possibility of an AGN which typically has a ratio of f X /fV < 50
(Stocke et al. 1991). Therefore, a deep optical observation would We have also searched for any radio counterpart for
be important to tightly constrain its source nature. PSR J2021+4026 with the data from the NRAO/VLA Sky Sur-
Although the blackbody model can yield a physically reasonable vey (NVSS) data base (Condon et al. 1998). Interestingly, we
best-fitting temperature and the flux for the interpretation of pulsar have identified radio excesses within the γ -ray error circle of
emission, one should note that the spectral parameters and hence the PSR J2021+4026 (see Fig. 7). A 6 × 6 arcmin2 close-up view cen-
fluxes are poorly constrained. Therefore, f X /f γ and f X /fV cannot be tred on the nominal γ -ray position of PSR J2021+4026 reported in
tightly determined. Hence, we have to admit that the source nature of Abdo et al. (2009a) is displayed in Fig. 8. Radio contours calculated
2XMM J202131.0+402645 cannot be determined unambiguously. at the levels between 10 and 25 mJy beam−1 are overlaid. We have
In the spectral analysis, we are not allowed to discriminate the pulsar identified a feature with a size of about 3 × 1.5 arcmin2 in the cen-
interpretation from that of a star. As the flux variability cannot be tre of this radio map. The peak of this radio feature is found to be
well constrained with the existing data, we also cannot completely at the south-east from the position of 2XMM J202131.0+402645.
exclude the possibility of the source as an AGN. To further probe Apart from the aforementioned feature, another radio excess extends
its X-ray emission nature, besides the aforementioned deep optical for ∼3 arcmin from 2XMM J202131.0+402645 to the north-west.
observation, a dedicated X-ray observation is very important in Adopting the full width at half-maximum (FWHM) of the beam and
C 2010 The Authors. Journal compilation
C 2010 RAS, MNRAS 405, 1339–13481344 L. Trepl et al.
Very Large Array (VLA) can help us to confirm (or refute) this
suggested scenario.
2.3 γ -ray analysis of PSR J2021+4026
With the already publicly available data of the Fermi γ -ray LAT All-
Sky survey, we have carried out an analysis of PSR J2021+4026
centred at the accurate X-ray position derived by analysing Chan-
dra data (see Section 2.1). We have studied its γ -ray spectral and
temporal properties in detail. In order to obtain the most signifi-
cant results for the spectral analysis, we took all available events
of the LAT All-Sky Survey starting from 2008 August 4 until 2009
September 26, which leads to a total effective exposure time of
Downloaded from https://academic.oup.com/mnras/article/405/2/1339/1187263 by guest on 25 January 2021
13 246 ks as the observatory scans the entire sky once every 3 h.
Events have been chosen in the energy range from 100 MeV to
300 GeV because the effective area is changing rapidly with an
energy of less than 100 MeV and because of residual uncertain-
ties in the instrument response (Porter 2009). For general filtering
purposes of the extracted data, we used the LAT Pass6 Version
3(P6_V3) instrument response functions as we are interested in
Figure 7. The 1.4 GHz NVSS image of a 15 × 15 arcmin2 field centred at point source analysis. We extracted the events within a circle of 2.◦ 5
the nominal γ -ray position of 0FGL J2021.5+4026. The 95 per cent error
radius centred at 2XMM J202131.0+402645 in order to minimize
circle of the γ -ray source is illustrated.
the contamination by other sources and kept the photon containment
fraction 95 per cent for photons with energies of 0.5 GeV. We
have further excluded the events with a zenith angle larger than 105◦
as recommended by the standard filtering of the Fermi data group.3
This is due to the fact that the maximum zenith angle selection is
applied to exclude time periods when the region of interest is too
close to Earth’s limb, resulting in elevated background levels. We
finally ensured that only diffuse class photons were used by setting
event_class=3. Good time intervals have been chosen by using the
spacecraft data file to ignore all events acquired during the passage
of the South Atlantic Anomaly and allow only data_qual=1 events.
After filtering for diffuse background emission, there are 22 162
total source counts available.
As PSR J2021+4026 is the brightest of the 16 newly found pul-
sars by LAT, we were able to study its spectrum with superior
photon statistic (Abdo et al. 2009a). We note that the data above
10 GeV are highly fluctuated which can possibly be due to a non-
negligible background contamination from charged particles.4 With
these considerations, we choose an energy range of 0.1–10 GeV for
the spectral analysis. The response file was computed using the
GTRSPGEN task and the spectrum was grouped with a binning of 100
logarithmically uniform energy bins.
The γ -ray spectrum of PSR J2021+4026 can be well described
Figure 8. A 6 × 6 arcmin2 close-up view of Fig. 7. The field of view of by an exponentially cut-off model with χ 2ν of 0.9997 for 97 degrees
this image corresponds to the size of the γ -ray error circle. The position of
of freedom (d.o.f.; see Fig. 9). The best-fitting model yields a photon
2XMM J202131.0+402645 is also indicated. The radio contours are at the
levels between 10 and 25 mJy beam−1 .
index of γ = 1.85+0.03 +0.58
−0.04 with a cut-off energy E C = 3.86−0.48 GeV.
The given errors are at the 1σ confidence level for a single
parameter.
the rms fluctuation of the image of 45 arcsec and 0.45 mJy beam−1 ,
We have also computed the error contours to demonstrate the
respectively (cf. Condon et al. 1998), we estimated the flux densi-
relative parameter dependency of the photon index versus the cut-
ties at 1.4 GHz of the south-eastern and the north-western features
off energy and plotted this in Fig. 10. Taking these parameters into
to be 139 ± 4 and 85 ± 2 mJy, respectively. These correspond to
consideration, the γ -ray flux is found to be f γ = (1.45+2.30 −0.88 ) ×
(5.84 ± 0.17) × 10−17 and (3.57 ± 0.08) × 10−17 erg cm−2 s−1 for
10−9 erg cm−2 s−1 in the range of 0.1–10 GeV. The spectral prop-
an effective bandwidth of 42 MHz, respectively.
erties inferred from the whole-year LAT data are consistent with
It is interesting to note that 2XMM J202131.0+402645 is located
those reported by Abdo et al. (2009c) within 1σ .
approximately in between these two features. If such alignment is
confirmed, this will suggest a possible bipolar outflow from the
pulsar. Unfortunately, the limited angular resolution of NVSS data
does not allow us to conclude this possible alignment. Future ob- 3 Please refer to http://fermi.gsfc.nasa.gov/ssc/ for further details.
servation with the dedicated high-resolution aperture synthesis by 4 See http://fermi.gsfc.nasa.gov/ssc/data/analysis/LAT_caveats.html.
C 2010 The Authors. Journal compilation
C 2010 RAS, MNRAS 405, 1339–1348Study of the γ -ray pulsar PSR J2021+4026 1345
10
normalized counts s GeV
10
10
10
0
Downloaded from https://academic.oup.com/mnras/article/405/2/1339/1187263 by guest on 25 January 2021
0.2 0.5 1 2 5
Energy (GeV)
Figure 9. γ -ray spectrum of PSR J2021+4026 as observed with LAT and
Figure 11. χ 2 test statistic periodogram for PSR J2021+4026 showing the
fitted with an exponentially cut-off power-law model (upper panel) and the
most probable frequency of 3.769 08 Hz.
fitting residuals (lower panel).
et al. 1983; De Jager, Swanepoel & Raubenheimer 1989). With
this independent analysis, we reported the periodic signal with a
6
frequency equal to the aforementioned. Using the H test, we found
that H is maximized for two harmonics. The calculated Z 22 is 309.7
which implies a nominal chance probability of 4 × 10−62 .
5
We have also repeated the analysis with different positions
within the 95 per cent γ -ray error circle adopted for barycentric
correction. Among all the tested positions, the X-ray position of
2XMM J202131.0+402645 results in the best test statistics. For ex-
4
+
ample, the nominal γ -ray position provided by Abdo et al. (2009a)
results in a χ 2 of 280.9 which is lower than the value that resulted
from adopting the X-ray position. This provides another support for
3
the possible association between 2XMM J202131.0+402645 and
PSR J2021+4026.
1.75 1.8 1.85 1.9 1.95 The γ -ray pulse profile folded at the aforementioned period is
Photon Index
shown in Fig. 12. We found that PSR J2021+4026 has a double-
Figure 10. 1σ , 2σ and 3σ confidence contours for the cut-off power-law peaked light curve with a peak separation of 162◦ or 198◦ , depending
model fitted to the γ -ray spectrum of PSR J2021+4026. on which peak is leading. In computing the pulsed fraction of the re-
sultant light curve, we found that about ∼54 per cent of the collected
photons are pulsed. This light curve provides us a crucial input for
To further investigate the nature of PSR J2021+4026, we have
modelling the emission geometry of this pulsar (see below).
independently performed a temporal analysis. The results of this
With the data collected from a period somewhat longer than 1 yr,
analysis will be further taken as inputs for modelling in the context
it is also instructive to investigate if there is any unusual spin-down
of the outer gap model in Section 3. We have iterated the temporal
analysis with different sizes of the extraction region. We found that
the signal-to-noise ratio of the pulse profile is optimized with an
extraction radius of 1◦ ; therefore, we adopted this region for the
subsequent analysis. The retrieved event file was then processed in
the same way as aforementioned with events in the energy range of
0.1–300 GeV. For the barycentric correction, we adopt the precise
position provided by 2XMM J202131.0+402645. For the pulsation
search, the GTPSEARCH task of the Fermi analysis software was used
with the χ 2 test statistics. We used 10 phase bins for the χ 2 test
with a step size of 0.5 in units of the Fourier resolution that led
us to 5000 independent trials. By checking a frequency range from
3.768 858 246 397 21 to 3.769 299 993 731 75 Hz and using f˙ =
−7.78 × 10⁻¹³ Hz s−1 , we found the most probable frequency to be
3.769 083 89(3) Hz at a test statistic of χ 2 = 328.0 with nine d.o.f.
(see Fig. 11). The number in the parenthesis is the uncertainty of the
last digit of the quoted frequency which corresponds to the Fourier
resolution. We have also performed the analysis by combining the Figure 12. The γ -ray phase folded light curve of PSR J2021+4026 as
Z 2n test and H test, where n is the number of harmonics (Buccheri observed by LAT in the range of 0.1–300 GeV.
C 2010 The Authors. Journal compilation
C 2010 RAS, MNRAS 405, 1339–13481346 L. Trepl et al.
behaviour of PSR J2021+4026, such as glitches. We have divided depending on which peak is leading. With the phase separation of
the data into segments with equal time-span and analysed these sub 162◦ or 198◦ , the outer gap accelerator model predicts the viewing
data sets independently. Our inferred spin-down rate is found to be angle close to ξ ∼ 90◦ . For example, if we assume the inclination
steady and fully consistent with the value reported by Abdo et al. angle of α = 40◦ , the viewing angles of ξ (solid horizontal line in
(2009c). Therefore, we concluded that there is no evidence for any Fig. 13) and ξ (dashed horizontal line) provide the phase separation
unusual spin-down behaviour of PSR J2021+4026 in the last year. of 168◦ and 198◦ , respectively. For the inclination angle α = 60◦ ,
Therefore, the frequency derivative is fixed at −7.78 × 10⁻¹³ Hz s−1 the phase separation of 168◦ can be explained by the viewing angle
throughout the aforementioned analysis. of ξ , while the phase separation of 198◦ cannot be produced by
any viewing angle. Although the observed large phase separation
can constrain the viewing angle close to ξ ∼ 90◦ , a wide range
3 DISCUSSION
of the viewing angles is allowed. To resolve the ambiguity on the
inclination angle, it will require a more detailed study (in particular,
3.1 Viewing geometry
the spectrum) of the γ -ray emission, which will be a purpose of the
Downloaded from https://academic.oup.com/mnras/article/405/2/1339/1187263 by guest on 25 January 2021
Figs 13 and 14 represent the phase plots of the γ -ray emissions from subsequent theoretical paper.
the outer gap accelerator (e.g. Tang et al. 2008) for the inclination of
α = 40◦ and 60◦ , respectively. The colour represents the intensity of
the emissions. In the model, we assume that the outer gap extends
3.2 Association among PSR J2021+4026,
between radial distances of 10 times the stellar radius and the light
2XMM J202131.0+402645 and SNR G78.2+2.1
radius.
The γ -ray emission from PSR J2021+4026 is observed with PSR J2021+4026 is a very bright newly uncovered γ -ray pulsar.
double-peak structure with a wide phase separation between the The non-detection of any radio pulsed signal and its high-energy
two peaks (Fig. 12). On the other hand, because of the lack of radio emission properties suggest the pulsar to be another example of
pulses from PSR J2021+4026, there is an ambiguity on the phase Geminga-like pulsars. Recent observations with the Milagros γ -
separation of the two peaks in γ -ray emission, that is, 162◦ or 198◦ , ray Observatory have found a 4.2σ TeV excess in the error circle
of PSR J2021+4026 (Abdo et al. 2009e). The reported TeV flux
of this feature is (35.8 ± 8.5) × 10−17 TeV−1 cm−2 s−1 . The pres-
ence of the multiwavelength features from the radio to TeV regime
has further made it an interesting target. PSR J2021+4026 and an
X-ray source, 2XMM J202131.+402645, can be observed at the
vicinity of the edge of SNR G78.2+2.1, which may be the ori-
gin of the TeV emission. In the following, we will argue that the
present results of the X-ray and γ -ray analyses indicate an associa-
tion among PSR J2021+4026, 2XMM J202131.+402645 and SNR
G78.2+2.1.
First, we discuss the ages of SNR G78.2+2.1 and
PSR J2021+4026. Using ASCA observations, Uchiyama et al.
(2002) deduced the shock velocity of the shell of SNR G78.2+2.1
to be 800 km s−1 . Given the angular size of θ ∼ 30 arcmin and
distance d ∼ 1.5 ± 0.5 kpc (Landecker, Roger & Higgs 1980),
Figure 13. The phase-plot diagram of the emissions for the inclination angle
the adiabatic age gives 6.6(d/1.5 kpc) kyr, which is in agreement
of α = 40◦ . The colour represents the intensity of the emissions (arbitrary with the age deduced from the optical observations (Mavromatakis
unit). The solid and dashed horizontal lines are corresponding to the viewing 2003). We find that the age of SNR G78.2+2.1 is about one order
angle of ξ = 83◦ and ξ = 87◦ , respectively. of magnitude smaller than the spin-down age of τ ∼ 77 kyr for
PSR J2021+4026. However, the discrepancy between the real age
and the spin-down age may be expected, if PSR J2021+4206 was
born with a spin period close to the current one. It can be expected
that PSR J2021+4026 is much younger than the age inferred from
the spin-down age, such as PSR J0538+2817, which has a spin-
down age of 620 kyr, but its true age is 40 kyr (Ng et al. 2007).
Therefore, the discrepancy between the age of SNR G78.2+2.1
and the spin-down age of PSR J2021+4026 does not imply that
PSR J2021+4026 and SNR G78.2+2.1 are not associated with each
other.
In fact, we expect that SNR G78.2+2.1 and PSR J2021+4026
are associated with each other, as follows. First, adopting the dis-
tance d ∼ 1 kpc to PSR J2021+4026, the efficiency, η, which is
defined by the ratio of the γ -ray luminosity to the spin-down lu-
minosity, is provided as η ∼ 0.1δ(d/kpc)2 , where δ is the solid
Figure 14. The phase-plot diagram of the emissions for the inclination angle angle. This large efficiency with the distance is consistent with the
of α = 60◦ . The colour represents the intensity of the emissions (arbitrary typical value of the efficiency of the middle spin-down age pulsars
unit). The solid horizontal line is corresponding to the viewing angle of ξ = such as Geminga, which has η ∼ 0.07δ. Therefore, the distance to
85◦ . SNR G78.2+2.1 provides a consistent efficiency with the spin-down
C 2010 The Authors. Journal compilation
C 2010 RAS, MNRAS 405, 1339–1348Study of the γ -ray pulsar PSR J2021+4026 1347
age. Secondly, PSR J2021+4026 is located ∼7.8 arcmin off-axis of any pulsed radio signals, the high-energy emission properties of
from the geometrical centre of SNR G78.2+2.1. Assuming that the PSR J2021+4026 suggest it to be a new member of Geminga-like
off-axis of the location of PSR J2021+4026 is caused by the proper pulsars.
motion in the space, the space velocity of PSR J2021+4026 is esti-
mated to be v p ∼ 340(d/1 kpc) km s−1 , which is a typical velocity of
the observed pulsars (Hansen & Phinney 1997; Hobbs et al. 2005). AC K N OW L E D G M E N T S
On this ground, the association between PSR J2021+4026 and SNR
G78.2+2.1 is more likely. LT would like to thank DFG for financial support in SFB TR 7
Finally, we briefly discuss the association between Gravitational Wave Astronomy and the members of the neutron star
2XMM J202131.+402645 and PSR J2021+4026. First, only group at AIU for fruitful discussions and useful comments. KSC
2XMM J202131.+402645 is a persistent and relatively bright is supported by a GRF grant of Hong Kong Government under
X-ray source located within the 95 per cent γ -ray error circle HKU700908P. The authors would like to thank C. Y. Ng for useful
of PSR J2021+4026 (see Section 2). Secondly, the nominal discussion.
X-ray flux in 2–10 keV, f X ∼ 8 × 10⁻¹⁵ erg cm−2 s−1 , of
Downloaded from https://academic.oup.com/mnras/article/405/2/1339/1187263 by guest on 25 January 2021
2XMM J202131.+402645 provides an X-ray luminosity of LX ∼
1030 f erg s −1 , where f is the solid angle divided by 4π. REFERENCES
Comparing the X-ray luminosity of other pulsars (e.g. Possenti
Abdo A. A. et al., 2009a, Sci, 325, 840
et al. 2002), we find that the X-ray luminosity LX ∼ 1030 f erg s −1 Abdo A. A. et al., 2009b, Sci, 325, 848
of 2XMM J202131.+402645 is consistent with the typical values Abdo A. A. et al., 2009c, ApJS, submitted (arXiv:0910.1608)
of the pulsars which have a spin-down luminosity similar to that of Abdo A. A. et al., 2009d, ApJS, 183, 46
PSR J2021+4026, Ė ∼ 1035 erg s−1 . It is also found that the ratio Abdo A. A. et al., 2009e, ApJ, 700, L127
of the X-ray flux of 2XMM J202131.+402645 deduced from the Becker W. et al., 2004, ApJ, 615, 897
best-fitting blackbody model to the γ -ray flux of PSR J2021+4026, Buccheri R. et al., 1983, A&A, 128, 245
fX /fγ ∼ 2 × 10⁻⁵ , is consistent with the typical values of γ -ray Cash W., 1979, ApJ, 229, 939
pulsars with a middle spin-down age like Geminga. On this ground, Cheng K. S., 2009, in Becker W., ed., Astrophys. Space Sci. Libr. Vol. 357,
we suggest that 2XMM J202131.+402645 is the plausible X-ray Neutron Stars and Pulsars. Springer, Berlin, p. 481
Cheng K. S., Zhang L., 1999, ApJ, 515, 337
counterpart of PSR J2021+4026.
Condon J. J., Cotton W. D., Greisen E. W., Yin Q. F., Perley R. A., Taylor
Although the interpretation of the pulsar nature is tempting, we G. B., Broderick J. J., 1998, AJ, 115, 1693
have to emphasize that small photon statistics of the existing data De Jager O. C., Swanepoel J. W. H., Raubenheimer B. C., 1989, A&A, 221,
does not allow us to confirm this unambiguously. Specifically, we 180
cannot tightly constrain the aforementioned flux ratios, spectral pa- Dickey J. M., Lockmann F. J., 1990, ARA&A, 28, 215
rameters as well as the variability. Therefore, we have to admit Dopita M. A., Sutherland R. S., 2003, Astrophysics of the Diffuse Universe.
that we cannot exclude the possible nature of 2XMM J202131.0+ Springer, Berlin
402645 as a star or an AGN. Dedicated X-ray and optical observa- Elsner R. F. et al., 2008, ApJ, 687, 1019
tions are most important in discriminating these competing X-ray Green D. A., 2009, A Catalogue of Galactic Supernova Remnants (2009
emission scenarios. Obviously, if X-ray pulsations that are consis- March version). Mullard Radio Astron. Obser., Cambridge
Hansen B. M. S., Phinney E. S., 1997, MNRAS, 291, 569
tent with the rotational period of PSR J2021+4026 can be detected
Harding A. K., 2009, in Becker W., ed., Astrophys. Space Sci. Libr. Vol.
in the future, this will certainly provide the most decisive nature of 357, Neutron Stars and Pulsars. Springer, Berlin, p. 521
2XMM J202131.0+402645. Hartman R. C. et al., 1999, ApJS, 123, 79
Hobbs G., Lorimer D. R., Lyne A. G., Kramer M., 2005, MNRAS, 360,
974
Hui C. Y., Becker W., 2009, A&A, 494, 1005
4 S U M M A RY Kaastra J. S., 1992, An X-Ray Spectral Code for Optically Thin Plasmas,
In this study, we have investigated the multiwavelength emission Internal SRON-Leiden Report, updated version 2.0
nature of PSR J2021+4026 in detail. Searching for the X-ray coun- Landecker T. L., Roger R. S., Higgs L. A., 1980, A&AS, 39, 133
Liedahl D. A., Osterheld A. L., Goldstein W. H., 1995, ApJ, 438, L115
terparts of this new and bright γ -ray pulsar, we have identified
Maccacaro T., Gioia I. M., Wolter A., Zamorani G., Stocke J. T., 1988, ApJ,
2XMM J202131.0+402645 as a promising candidate. We have also
326, 680
examined the γ -ray data collected by Fermi LAT with an exposure Mavromatakis F., 2003, A&A, 408, 237
somewhat more than 1 yr and tightly constrained its spectral and Mewe R., Gronenschild E. H. B. M., van den Oord G. H. J., 1985, A&AS,
temporal properties in the MeV–GeV regime. We found that the X- 62, 197
ray position of 2XMM J202131.0+402645 is consistent with that Mewe R., Lemen J. R., van den Oord G. H. J., 1986, A&AS, 65, 511
of the optimal γ -ray timing solution. We have further modelled the Monet D. et al., 2003, AJ, 125, 984
γ -ray light curve in the context of the outer gap accelerator model Ng C.-Y., Romani R. W., Brisken W. F., Chatterjee S., Kramer M., 2007,
and provided constraints on its emission geometry. The nominal ApJ, 654, 487
X-ray-to -γ -ray flux ratio of PSR J2021+4026 is found to resemble Pizzolato N., Maggio A., Micela G., Sciortino S., Ventura P., 2003, A&A,
397, 147
that of Geminga. Furthermore, if PSR J2021+4026 was born with
Possenti A., Cerutti R., Colpi M., Mereghetti S., 2002, A&A, 387, 993
a spin period close to the current one, it is likely to be born in the
Porter T. A., 2009, preprint (arXiv:0907.0294)
explosion that created SNR G78.2+2.1 and has a projected kick ve- Sana H. et al., 2007, in St.-Louis N., Moffat A. F. J., eds, ASP Conf. Ser.
locity of a few hundred km s−1 which is typical for the known pulsar Vol. 367, Massive Stars in Interactive Binaries. Astron. Soc. Pac., San
population. At the distance of SNR G78.2+2.1, the conversion ef- Francisco, p. 109
ficiencies in the γ -ray and X-ray of this pulsar are both found to be Stelzer B., Flaccomio E., Montmerle T., Micela G., Sciortino S., Favata F.,
consistent with those of Geminga. Together with the non-detection Preibisch T., Feigelson E. D., 2005, ApJS, 160, 557
C 2010 The Authors. Journal compilation
C 2010 RAS, MNRAS 405, 1339–13481348 L. Trepl et al.
Stocke J. T., Morris S. L., Gioia I. M., Maccacaro T., Schild R., Wolter A., Watson M. G. et al., 2009, A&A, 493, 339
Fleming T. A., Henry J. P., 1991, ApJS, 76, 813 Weisskopf M. C. et al., 2006, ApJ, 652, 387
Tang A. P. S., Takata J., Jia J. J., Cheng K. S., 2008, ApJ, 676, 562
Uchiyama Y., Takahashi T., Aharonian F. A., Mattox J. R., 2002, ApJ, 571,
866
Wang N., Manchester R. N., Zhang J., Wu X. J., Yusup A., Lyne A. G.,
Cheng K. S., Chen M. Z., 2001, MNRAS, 328, 855 This paper has been typeset from a TEX/LATEX file prepared by the author.
Downloaded from https://academic.oup.com/mnras/article/405/2/1339/1187263 by guest on 25 January 2021
C 2010 The Authors. Journal compilation
C 2010 RAS, MNRAS 405, 1339–1348You can also read