Predicting pregnancy using large-scale data from a women's health tracking mobile application - arXiv
←
→
Page content transcription
If your browser does not render page correctly, please read the page content below
Predicting pregnancy using large-scale data
                                                            from a women’s health tracking mobile application

                                                                  Bo Liu†                                           Shuyang Shi†                             Yongshang Wu†
                                               Dept. of Computer Science, Stanford                    Dept. of Computer Science, Stanford           Dept. of Computer Science, Stanford

                                                            Daniel Thomas                                           Laura Symul                               Emma Pierson∗
                                                   Clue by BioWink GmbH, Berlin                      Dept. of General Surgery and Dept. of          Dept. of Computer Science, Stanford
                                                                                                               Statistics, Stanford
arXiv:1812.02222v2 [stat.AP] 27 Mar 2019

                                                                                                                   Jure Leskovec
                                                                                                      Dept. of Computer Science, Stanford
                                                                                                           Chan-Zuckerberg Biohub

                                           ABSTRACT                                                                           1   INTRODUCTION
                                           Predicting pregnancy has been a fundamental problem in women’s                     Predicting pregnancy is a fundamental problem in women’s health [11,
                                           health for more than 50 years. Previous datasets have been collected               13, 27, 41]. Modeling the probability of pregnancy, and identifying
                                           via carefully curated medical studies, but the recent growth of                    behaviors which affect it, allows for more efficient family planning.
                                           women’s health tracking mobile apps offers potential for reaching                  Identifying people with a very low chance of becoming pregnant is
                                           a much broader population. However, the feasibility of predicting                  important for targeting and treating infertility, which can be a dev-
                                           pregnancy from mobile health tracking data is unclear. Here we                     astating experience [18]. Because of the importance of predicting
                                           develop four models – a logistic regression model, and 3 LSTM                      and facilitating pregnancy, the fertility services market is predicted
                                           models – to predict a woman’s probability of becoming pregnant                     to grow to $21 billion by 2020 [38].
                                           using data from a women’s health tracking app, Clue by BioWink                        Attempts to predict pregnancy go back decades, often using
                                           GmbH. Evaluating our models on a dataset of 79 million logs from                   Bayesian methods [11, 13, 27, 41] to capture the complex dynamics
                                           65,276 women with ground truth pregnancy test data, we show that                   which govern fertility. Many factors influence fertility, including
                                           our predicted pregnancy probabilities meaningfully stratify women:                 age [12] and medical conditions [24, 30]. Fertility fluctuates over
                                           women in the top 10% of predicted probabilities have a 89% chance                  the course of the menstrual cycle (which averages 28-29 days in
                                           of becoming pregnant over 6 menstrual cycles, as compared to a 27%                 length, although this varies across women [8]), peaking during
                                           chance for women in the bottom 10%. We develop a technique for                     the “fertile window”, around 14 days before the end of the cycle.
                                           extracting interpretable time trends from our deep learning models,                For women with a regular cycle of 28-29 days, the fertile window
                                           and show these trends are consistent with previous fertility research.             occurs approximately midway through the cycle [3, 50]. Because
                                           Our findings illustrate the potential that women’s health tracking                 the timing of the fertile window varies, and intercourse during the
                                           data offers for predicting pregnancy on a broader population; we                   fertile window is much more likely to result in pregnancy, fertility
                                           conclude by discussing the steps needed to fulfill this potential.                 prediction methods often focus on detecting and predicting the
                                                                                                                              fertile window, using ovulation tests and measurements of cervical
                                           KEYWORDS                                                                           mucus and basal body temperature [5, 16].
                                           Pregnancy prediction; mobile health tracking                                          Previous studies of fertility have relied on carefully curated data
                                                                                                                              from medical studies [3, 11, 13, 27, 39–41, 43]: for example, partic-
                                           ACM Reference Format:                                                              ipants are generally asked to regularly monitor critical features
                                           Bo Liu† , Shuyang Shi† , Yongshang Wu† , Daniel Thomas, Laura Symul,               like basal body temperature and menstrual cycle starts and to take
                                           Emma Pierson∗ , and Jure Leskovec. 2019. Predicting pregnancy using large-         pregnancy tests after each menstrual cycle. Many people are un-
                                           scale data from a women’s health tracking mobile application. In Proceedings       willing or unable to engage in such careful monitoring, limiting the
                                           of the 2019 World Wide Web Conference (WWW’19), May 13–17, 2019, San
                                                                                                                              applicability of these methods to the general population.
                                           Francisco, CA, USA. ACM, New York, NY, USA, 7 pages. https://doi.org/10.
                                           1145/3308558.3313512
                                                                                                                                 In the last few years, the growing use of health tracking mobile
                                                                                                                              apps offers a new potential data source for predicting pregnancy in
                                                                                                                              broader populations. Health tracking apps have been recognized
                                           *To whom correspondence should be addressed: emmap1@cs.stanford.edu. † indicates
                                           co-first authorship.
                                                                                                                              as delivering a “data bounty” [19] for healthcare [32, 49]. Within
                                           ACM ISBN 978-1-4503-6674-8/19/05.                                                  women’s health specifically, health tracking apps are used by mil-
                                           https://doi.org/10.1145/3308558.3313512                                            lions of women worldwide [7, 15, 37], and have already been used
                                                                                                                              to study sexually transmitted infections [2], menstrual cycle fluctu-
                                                                                                                              ations [35, 47], and menstrual cycle lengths [21]. These apps allow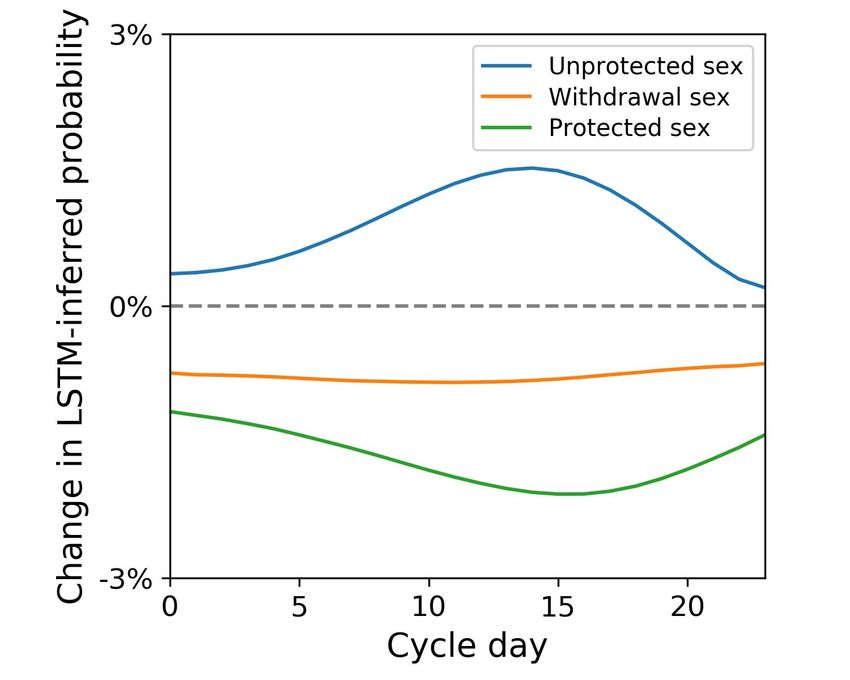
users to create profiles which include age and birth control infor-       2.1     Dataset
mation and keep daily logs of symptoms relevant to pregnancy,             We use data from the Clue women’s health tracking app [17]. The
including basal body temperature, period starts, and ovulation tests.     app has been rated the most accurate menstrual cycle tracking app
Crucially, they also allow women to log positive and negative preg-       by gynecologists [29] and previously used in studies which show
nancy tests, providing a ground truth source of pregnancy data.           that it reliably replicates known women’s health findings [2, 21, 35].
Pregnancy data collected by women’s health mobile apps differs            All data is de-identified and analysis was determined to be exempt
from that collected in medical studies in three ways:                     from review by the Stanford Institutional Review Board.
    (1) Larger datasets. The dataset we consider in this paper con-       Features. Our dataset consists of two types of features:
        tains tens of millions of observations from tens of thou-               • User features. Users can record age and birth control method
        sands of women, orders of magnitude more than previous                    (e.g., “None”, “Condoms”, “IUD”, or various types of birth
        datasets [14]. Complex models developed for these smaller                 control pill). We encode age using a two-element vector: a
        datasets, which often rely on computationally intensive tech-             binary element which indicates whether age data is missing,
        niques like MCMC sampling, will not scale to datasets from                and a continuous element which is the value of age if it is
        mobile health tracking apps, necessitating new methods.                   present, and 0 otherwise. We encode birth control using a
    (2) Broader populations. While previous fertility studies have                vector with indicator variables for each type of birth control;
        predominantly focused on filtered, mostly healthy or proven               the vector is all zeros if birth control data is missing.
        fertile populations that volunteer for research within a single         • Daily feature logs. Each row in this dataset consists of one
        country, health tracking apps can be used by anyone with a                log of one feature for one user on one date. Users can log 110
        smartphone, and are used by women all over the world.                     binary features, including positive/negative pregnancy tests
    (3) Missing data. Critical features like basal body temperature               (which we use to define ground truth, and do not include in
        (BBT) and pregnancy tests are less reliably recorded in mobile            the inputs to our model), period bleeding, mood and behavior
        health tracking datasets than in medical studies, making                  features (eg, happy mood or exercise:running), and taking
        missing data a pressing concern.                                          daily birth control. Users can also log 3 continuous features:
                                                                                  basal body temperature (BBT), resting heart rate, and body
   Mobile tracking datasets thus present new challenges but also
                                                                                  weight. We list all daily features in Table 1.
new opportunities for predicting pregnancy in a much broader
population. To this end, a number of companies have announced             Data filtering. To ensure that users are regularly using the app, we
initiatives to predict pregnancy or fertility using mobile tracking       filter for users who enter at least 300 daily feature logs. We apply
data [1, 28, 33, 42]. To date, however, it is unclear whether their       basic quality control filters to the three continuous features to
fertility prediction algorithms are reliable, because they are propri-    remove unreliable values (for example, BBT > 110◦ F ). To minimize
etary (so they cannot be compared to or independently assessed)           the chance that users are already pregnant, we filter out all cycles
and their efficacy has been disputed [26, 31, 46].                        after a user has logged a positive pregnancy test.
This work. Here we present what is to our knowledge the first             Defining menstrual cycle starts. Because fertility fluctuates over
study of pregnancy prediction using fully described methods ap-           the course of the menstrual cycle, defining menstrual cycle starts
plied to large-scale women’s health tracking app data. Using a            – when the period begins – is necessary to predict pregnancy. We
dataset from a women’s health tracking app which includes ground          define a cycle start as a start of bleeding after the user has not
truth data on pregnancy tests, we develop and assess four pregnancy       recorded any bleeding for at least 7 days. So, for example, if the
prediction models — an interpretable logistic regression model, and       user records bleeding on May 1, 2, and 29, the cycle starts would be
three LSTM models — which integrate traditional fertility modeling        May 1 and May 29. A user’s cycle day is the number of days since
methods and modern time series prediction methods. We first show          their most recent cycle start, with 0 denoting the day of cycle start.
that our models meaningfully stratify women by their probability
of becoming pregnant: women in the top 10% of predicted proba-            Encoding continuous features. We encode continuous features
bilities have a 89% chance of becoming pregnant over 6 menstrual          (eg, weight) using a two-element vector: a binary element which
cycles, while women in the bottom 10% have only a 27% chance. We          indicates whether data is present or missing, and a continuous
further provide an intuitive technique for extracting interpretable       element which is the value for the feature if present, and 0 otherwise.
time trends from our LSTM models, overcoming a common fail-               For each cycle and each user, we subtract off the mean for each
ing of deep learning models, and show that these time trends are          continuous feature (since the change in features like BBT is most
consistent with previous fertility research. Finally, we discuss the      indicative of cycle phase and therefore fertility [6]). We include
steps that should be taken to maximize the efficacy of pregnancy          each user’s average value of the three continuous features as a
prediction from women’s health tracking data.                             user-specific feature.

2    PROBLEM SETUP                                                        2.2     Prediction task
Our task is predicting, on the basis of the health tracking data a        Our task is predicting from the first 24 days of a user’s cycle whether
woman logs during a single menstrual cycle, whether she will log a        she will become pregnant in that cycle. We choose the 24-day inter-
positive pregnancy test at the end of that cycle. We first describe       val because most women are very unlikely to become pregnant past
our dataset and then describe our task in more detail.                    this interval [50]. Our prediction task is binary, and each example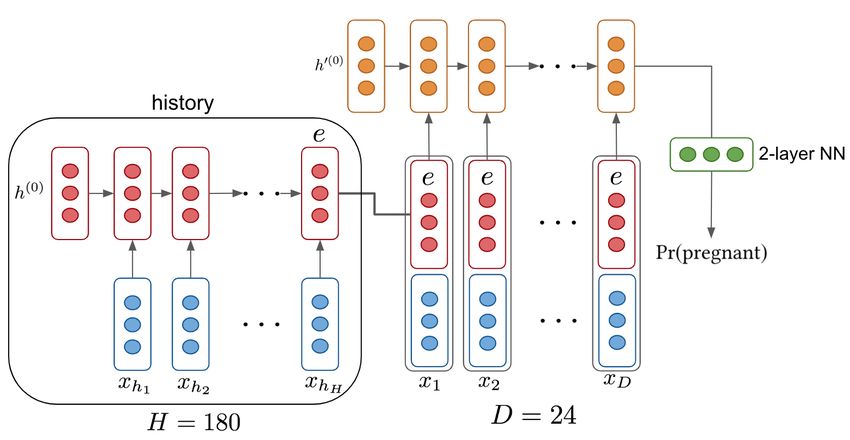
Table 1: All daily features which appear in our data. Each feature has both a category and a type. Features are binary except for
those in the “continuous” category. While pregnancy tests are included in the binary features, we do not use them as predictive
features. HBC=hormonal birth control; TNP=type not provided.

                        Category                     Type
                        Ailment                      Allergy, Cold/Flu Ailment, Fever, Injury
                        Appointment                  Date, Doctor, Ob Gyn, Vacation
                        Collection Method            Menstrual Cup, Pad, Panty Liner, Tampon
                        Continuous                   BBT, Resting Heart Rate, Weight
                        Craving                      Carbs, Chocolate, Salty, Sweet
                        Digestion                    Bloated, Gassy, Great Digestion, Nauseated
                        Emotion                      Happy, PMS, Sad, Sensitive
                        Energy                       Energized, Exhausted, High Energy, Low Energy
                        Exercise                     Biking, Running, Swimming, Yoga
                        Fluid                        Atypical, Creamy, Egg White, Sticky
                        Hair                         Bad, Dry, Good, Oily
                        Injection HBC                Administered, Type Not Provided
                        IUD                          Inserted, Removed, Thread Checked, TNP
                        Medication                   Antibiotic, Antihistamine, Cold/Flu Medication, Pain
                        Mental                       Calm, Distracted, Focused, Stressed
                        Motivation                   Motivated, Productive, Unmotivated, Unproductive
                        Pain                         Cramps, Headache, Ovulation Pain, Tender Breasts
                        Party                        Big Night Party, Cigarettes, Drinks Party, Hangover
                        Patch HBC                    Removed, Removed Late, Replaced, Replaced Late, TNP
                        Period                       Heavy, Light, Medium, Spotting
                        Pill HBC                     Double, Late, Missed, Taken, TNP
                        Poop                         Constipated, Diarrhea, Great, Normal
                        Ring HBC                     Removed, Removed Late, Replaced, Replaced Late, TNP
                        Sex                          High Sex Drive, Protected, Unprotected, Withdrawal
                        Skin                         Acne, Dry, Good, Oily
                        Sleep                        0-3 Hrs, 3-6 Hrs, 6-9 Hrs, 9 Hrs, TNP
                        Social                       Conflict, Sociable, Supportive, Withdrawn
                        Test                         Ovulation Neg, Ovulation Pos, Pregnancy Neg, Pregnancy Pos

                                                                                         predicting whether a test will be positive or negative is a diffi-
                                                                                         cult and useful prediction task, because it occurs in settings where
                                                                                         the woman herself is sufficiently uncertain about whether she is
                                                                                         pregnant that she believes taking a test is worthwhile. Our dataset
                                                                                         consists of 16,580 positive cycles, 88,685 negative cycles, 65,276
Figure 1: Prediction task. The model makes predictions us-                               women, and 79,423,281 symptom logs. The proportion of cycles
ing logs from the first 24 days of a cycle (green interval), and                         which are positive in our dataset (16%) is consistent with previous
the cycle is labeled using pregnancy tests taken after day 24                            work [10]. We use data from 90% of users for training/validation and
of the cycle and before day 24 of the next cycle (red inter-                             report results on a test set of the remaining 10% of users. We train
val). The vast majority of pregnancy tests in our dataset are                            on a dataset balanced for positive and negative examples by down-
taken near when the user’s cycle is supposed to start, con-                              sampling each training batch (a standard technique for training on
sistent with proper use of pregnancy tests, so any positive                              unbalanced data [23]). Following standard practice, we report all
pregnancy tests likely result from activity during the green                             results on the unbalanced test dataset.
interval, which will be included in the feature vector.
                                                                                         3     PREVIOUS WORK
                                                                                         Our predictive models rely on ideas both from the fertility mod-
is one cycle for one woman. We define positive examples as cycles                        eling literature and from the deep learning time series prediction
in which the woman logs a positive pregnancy test after day 24 of                        literature. We now summarize work in both areas.
the cycle and before day 24 of the next cycle (Figure 1); we define
negative examples as cycles with a negative pregnancy test and
                                                                                         is a negative example) is problematic for two reasons. First, some users may not bother
no positive pregnancy test. Thus, our dataset consists only of cy-                       to log positive tests, so the negative label is a false negative. Second, some users may
cles followed by positive or negative pregnancy tests1 . Importantly,                    not bother to log birth control, concealing the fact that they have very little chance of
                                                                                         getting pregnant—consistent with this, we find that the fraction of positive examples
1 We define positive and negative examples in this way to mitigate missing data con-     using this method, even for users who log no birth control, is far lower than the
cerns. The alternative (i.e. assuming that any cycle without a positive pregnancy test   previous literature would imply.
3.1 Fertility modeling Because they rely on more scalable backpropagation methods, they
We briefly summarize three main approaches in the extensive fer- also scale to large health-tracking datasets.
tility modeling literature; [14] provides a lengthier review.
4 MODELS
(1) Time-to-pregnancy (TTP) models [20, 36, 44, 48] assume
We develop four models. We select model hyperparameters – learn-
each individual menstrual cycle results in pregnancy with
ing rate, hidden size, number of layers, batch size, dropout rate, and
some probability µ which can vary across couples and over
regularization strength – using grid search. Our models are publicly
time. These models are useful for capturing the high level
available at https://github.com/AndyYSWoo/pregnancy-prediction.
covariates which influence µ (eg, age) but they do not cap-
ture detailed daily dynamics within a single cycle (eg, sex
during the fertile window is more likely to result in preg-
nancy). Therefore, they are less useful for modeling the
health-tracking datasets we consider, whose strength is their
detailed daily information.
(2) Barrett-Marshall and Schwartz (BMS) models [3, 11, 13,
39, 43, 45] allow for more detailed modeling of daily activity
within each cycle. They assume each act of sex contributes
independently to the probability a cycle results in pregnancy.
The probability that someone becomes pregnant in a cycle
is thus
Ö
1− (1 − fd )Sd ,
d
Figure 2: LSTM + BMS fertility model: we feed the daily fea-
where d is the cycle day, fd is the probability of getting tures x (blue) into an LSTM model to obtain the hidden state
pregnant by having sex only on day d, and Sd is a binary h (red). fd is then a function of the hidden state h parame-
variable indicating whether sex occurred on day d. The term terized by a neural network. The probability of becoming
inside the product is the probability that day d does not re- pregnant in a cycle is the function shown at bottom.
sult in pregnancy; it is 1 if Sd is 0, indicating that no sex
occurred, and 1 − fd if Sd is 1. Schwartz [43] extends this
model by assuming that the overall probability of pregnancy
also depends on a couple-specific parameter which captures,
for example, the fact that some couples are infertile irre-
spective of sexual activity patterns. However, this additional
parameter creates model identifiability problems.
(3) Extended Time-to-Pregnancy (ETTP) models [9, 40] pro-
vide an approximation to the BMS model by assuming that
only sex on the most fertile day contributes to the proba-
bility of pregnancy, and sex on other days has no effect. As
this model is only a pragmatic approximation to the true
generative process, we instead develop a computationally
efficient implementation of the BMS model.
Figure 3: LSTM + user embedding: we use the history fea-
All three of the above models were developed for datasets orders tures, xh , in the previous H = 180 days for the user and feed
of magnitude smaller than the one we consider. Consequently, they them into the “user history LSTM” (shown at left). The final
perform parameter inference by estimating the posterior distribu- hidden state becomes the user embedding vector e, which is
tion, often using computationally intensive techniques like MCMC, then concatenated with the daily features from the current
and will not scale to our dataset. Therefore, in this work, we extend cycle and fed into the pregnancy prediction LSTM (right).
the BMS model using a scalable deep-learning-based model. Our
extension scales to health-tracking datasets because it relies on
(1) Logistic regression. As an interpretable baseline, we use
more efficient backpropagation-based optimization.
logistic regression with coefficients for each feature and each
cycle day (for example, having unprotected sex on cycle
3.2 Deep learning for time series prediction day 14), and coefficients for each user-specific feature. Our
Long Short Term Memory (LSTM) neural networks [22] have been feature vector for each example consists of 2,771 features.
successfully used to model medical time series data [4, 25, 34]. They (2) LSTM. We use an LSTM network with 24 timesteps (one
maintain a hidden state at each timestep which can be used for for each cycle day). For each time-step, we feed as input the
prediction, and are a natural choice for prediction on time series observed features for that cycle day (binary features plus
with discrete timesteps (in our case, days of the menstrual cycle). continuous features, encoded as described in Section 2.1)along with the cycle averages for continuous features. The probability of pregnancy and that woman continues her current
final hidden state of the LSTM is concatenated with the pattern of behavior. For example, if a woman’s single-cycle ppreg is
user-specific features and fed into a fully connected layer to 0.2, her six-cycle ppreg is 1 − (1 − 0.2)6 .
produce the prediction.
Results. The LSTM with user embeddings has the highest AUC
(3) LSTM + BMS fertility model. We develop an LSTM-based
(0.67) (Table 2). This model is able to meaningfully stratify users by
extension of the BMS model. As described in Section 3.1, the
their probability of getting pregnant: for example, the top 10% of
BMS model assumes each act of sex contributes indepen-
users have an 89% chance of pregnancy over 6 cycles, whereas the
dently to the probability a cycle results in pregnancy. Thus,
bottom 10% have only a 27% chance. While the other three models
we model a user’s probability of becoming pregnant in a
have somewhat lower AUCs, all four models usefully stratify users
cycle as
sd t by pregnancy probability. The BMS model slightly worsens LSTM
ÖÖ performance, possibly because of the more restrictive assumptions
Pr(pregnant) = 1 − 1 − r t · fd
of its probability model – that is, that the overall probability of not
d t
getting pregnant in a cycle is the product of the probabilities of not
where d is cycle day, t the type of sex (protected, unpro- getting pregnant on each cycle day. This demonstrates that tradi-
tected, withdrawal, or none2 ), sdt indicates if sex of type tional fertility models may not yield optimal predictive performance
t was logged on day d, fd ∈ (0, 1) is the contribution of on mobile health datasets.
sex on cycle day d towards pregnancy, and r t ∈ (0, 1) is a
learned parameter capturing the risk of a kind of sex (eg, 5.2 Interpretability
r unprotected > r protected ). The term inside the product is the We next assess whether our models learn interpretable time trends
probability that an act of sex of type t on cycle day d does which are consistent with prior fertility research. Because sexual
not result in pregnancy. We model fd as a function of the activity is the feature most fundamentally associated with preg-
daily features xd using an LSTM, as illustrated in Figure 2. nancy, we examine time trends for the three types of sex logged in
(4) LSTM + user embeddings. Using only the user’s current Clue data: unprotected, protected, and withdrawal sex.
cycle does not account for their full history: eg, a user who
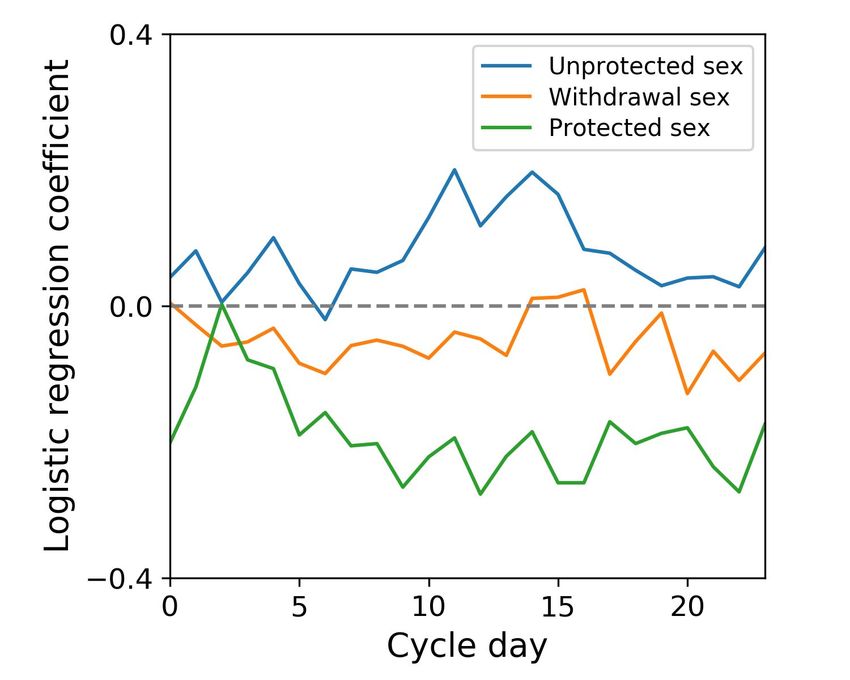
has frequently logged unprotected sex for a long time but has Interpreting the logistic regression model. Extracting time trends
not yet become pregnant may be less fertile. To incorporate from the logistic regression model is straightforward, because the
information prior to the current cycle, we use a “user history model is specifically developed to be interpretable. To understand
LSTM” to encode the 180 days of user history prior to the how a feature contributes to the probability of pregnancy, we sim-
user’s current cycle, then use this LSTM’s final state as a ply plot the coefficients for logging the feature on each day (Figure
user embedding vector which we concatenate onto the other 4, left). The daily feature which is most strongly associated with
features and feed into a second LSTM as before. We jointly positive pregnancy tests (averaging weights across all cycle days)
train both LSTMs. Figure 3 illustrates the model architecture. is unprotected sex; the feature which is most strongly associated
with negative pregnancy tests is protected sex.
5 RESULTS Interpreting the LSTM models. Interpreting deep learning mod-
els is much less straightforward, since they are high-dimensional
5.1 Predictive performance
and nonlinear and their coefficients do not have clear meanings.
Metrics. We evaluate model performance using AUC. Importantly, We use the following technique to quantify how logging binary
becoming pregnant is inherently a somewhat random process: it feature b on day d influences the model’s inferred probability of
is impossible to guarantee a woman will become pregnant in a pregnancy:
particular cycle. Consequently, achieving a very high AUC on our (1) For each example in our test set, we set binary feature b to 1
task is unlikely to be feasible, and we would not expect AUC to on day d, and compute the modeled probability of pregnancy
be very high. Nonetheless, we report AUC because it is a standard for the example, Pr(preg|xbd = 1).
metric. As a second metric, we compare the probability ppreg that a (2) For each example in our test set, we set binary feature b to 0
user will log a positive pregnancy test after a cycle for the users in on day d, and compute the modeled probability of pregnancy
the top 10% of predicted pregnancy probabilities and users in the for the example, Pr(preg|xbd = 0).
bottom 10% of predicted probabilities. (Note that ppreg is the true, (3) We compute Pr(preg|xbd = 1)−Pr(preg|xbd = 0), averaging
not the predicted, probability of a positive pregnancy test.) How- across examples. This corresponds to the average difference
ever, the goal of fertility counseling is not to guarantee a woman in modeled probabilities when the user does and does not
will get pregnant in a particular cycle, but rather that over some log feature b on day d.
reasonable time period (eg, 6 cycles) she has a good chance of be- Figure 4 (right) shows results for the LSTM model with the best
coming pregnant if she continues her current pattern of behavior. predictive performance (LSTM + user embeddings); results for the
Thus, we also compute the 6-cycle probability of becoming preg- other two LSTM models are qualitatively similar. Like the logistic re-
nant, assuming that each cycle contributes independently to the gression model, the LSTM model learns that unprotected sex (blue)
2 We
is more positively associated with positive tests than protected sex
allow the model to learn a non-zero probability of getting pregnant even if no
sex is logged to account for missing data, where users neglect to log sex but still get (green) or withdrawal sex (orange). Unprotected sex during the
pregnant; this significantly improves the BMS model’s predictive accuracy. middle of the cycle shows the strongest positive association.Table 2: Predictive performance of all models. The third column provides the probability a pregnancy test is positive for users
in the top 10% vs bottom 10% of pregnancy risk; the fourth column provides the probability over six cycles.
Model AUC Single cycle ppreg Six cycle ppreg
Logistic regression 0.63 28% vs 5% 86% vs 26%
LSTM 0.65 30% vs 4% 88% vs 23%
LSTM + BMS 0.64 29% vs 4% 87% vs 22%
LSTM + user embeddings 0.67 30% vs 5% 89% vs 27%
Figure 4: Model-learned time trends are interpretable for both the simple logistic regression model (left plot) and the best-
performing LSTM + user embedding model (right plot). The horizontal axis is the cycle day. The vertical axis in the left plot is
the logistic regression weight for logging a feature on that cycle day. The vertical axis in the right plot is how much logging a
feature on a cycle day affects the LSTM-inferred probability of pregnancy. In both plots, positive y-values indicate associations
with positive pregnancy tests, and negative y-values indicate associations with negative pregnancy tests. Both models learn
that protected sex (green line) is negatively associated with pregnancy, while unprotected sex (blue line) is positively associated,
particularly during the fertile window, and withdrawal sex (orange line) is intermediate.
Consistency with prior research. These modeled time trends extract time trends from our LSTM models which is more broadly
are consistent with previous fertility research, which finds that applicable to other time series datasets.
unprotected sex during the “fertile window” [50] is most likely to Based on our study, we recommend two steps to enable women’s
result in pregnancy. The modeled increase in pregnancy proba- health tracking apps to reach their full potential for pregnancy pre-
bility due to unprotected sex on a single day is fairly small (REFERENCES [26] Natasha Lomas. 2018. Clinic reports Natural Cycles app for 37 unwanted preg-
[1] 2017. Glow and National Institutes of Health Collaborate to Advance Fertility nancies since September. TechCrunch (2018).
Model. PR Newswire (2017). [27] Kirsten J Lum, Rajeshwari Sundaram, Germaine M Buck Louis, and Thomas A
[2] Alexandra Alvergne, Marija Vlajic Wheeler, and Vedrana Högqvist Tabor. 2018. Louis. 2016. A Bayesian joint model of menstrual cycle length and fecundity.
Do sexually transmitted infections exacerbate negative premenstrual symptoms? Biometrics 72, 1 (2016), 193–203.
Insights from digital health. Evolution, Medicine, and Public Health (2018). [28] Courtney Miller. 2013. How the Period and Fertility Prediction Feature Works.
[3] John C Barrett and John Marshall. 1969. The risk of conception on different days Kindara Blog (2013).
of the menstrual cycle. Population Studies 23, 3 (1969), 455–461. [29] Michelle L Moglia, Henry V Nguyen, Kathy Chyjek, Katherine T Chen, and
[4] Inci M Baytas, Cao Xiao, Xi Zhang, Fei Wang, Anil K Jain, and Jiayu Zhou. 2017. Paula M Castaño. 2016. Evaluation of smartphone menstrual cycle tracking
Patient subtyping via time-aware LSTM networks. In Proceedings of the 23rd ACM applications using an adapted APPLICATIONS scoring system. Obstetrics &
SIGKDD International Conference on Knowledge Discovery and Data Mining. ACM, Gynecology 127, 6 (2016), 1153–1160.
[30] Merry-K. Moos, Anne L. Dunlop, Brian W. Jack, Lauren Nelson, Dean V. Coonrod,
65–74.
Richard Long, Kim Boggess, and Paula M. Gardiner. 2008. Healthier women,
[5] Jamie L Bigelow, David B Dunson, Joseph B Stanford, René Ecochard, Christian
healthier reproductive outcomes: recommendations for the routine care of all
Gnoth, and Bernardo Colombo. 2004. Mucus observations in the fertile window:
women of reproductive age. American Journal of Obstetrics & Gynecology (2008).
a better predictor of conception than timing of intercourse. Human Reproduction
[31] Katie Morley. 2018. Advert for “Natural Cycles” contraceptive app banned for
19, 4 (2004), 889–892.
exaggerating effectiveness. The Telegraph (2018).
[6] Charles L Buxton and William B Atkinson. 1948. Hormonal factors involved
[32] Catherine J O’shea, Andrew D McGavigan, Robyn A Clark, Derek PB Chew, and
in the regulation of basal body temperature during the menstrual cycle and
Anand Ganesan. 2017. Mobile health: an emerging technology with implications
pregnancy. The Journal of Clinical Endocrinology 8, 7 (1948), 544–549.
for global internal medicine. Internal medicine journal 47, 6 (2017), 616–619.
[7] Shraddha Chakradhar. 2018. Discovery cycle. Nature Medicine (2018).
[33] Arielle Pardes. 2018. In Contraceptive Tech, the App’s Guess Is as Good as Yours.
[8] Leonard Chiazze, Franklin T Brayer, John J Macisco, Margaret P Parker, and
Wired (2018).
Benedict J Duffy. 1968. The length and variability of the human menstrual cycle.
[34] Trang Pham, Truyen Tran, Dinh Phung, and Svetha Venkatesh. 2016. Deepcare: A
JAMA 203, 6 (1968), 377–380.
deep dynamic memory model for predictive medicine. In Pacific-Asia Conference
[9] David Clayton and René Ecochard. 1997. Artificial insemination by donor: discrete
on Knowledge Discovery and Data Mining. Springer, 30–41.
time survival data with crossed and nested random effects. In Proceedings of the
[35] Emma Pierson, Tim Althoff, and Jure Leskovec. 2018. Modeling Individual
First Seattle Symposium in Biostatistics. Springer, 99–122.
Cyclic Variation in Human Behavior. In Proceedings of the 2018 World Wide Web
[10] Bernardo Colombo, Guido Masarotto, and Menstrual Cycle Fecundability Study
Conference on World Wide Web. International World Wide Web Conferences
Group. 2000. Daily fecundability: first results from a new data base. Demographic
Steering Committee, 107–116.
Research 3 (2000).
[36] Robert G Potter. 1960. Length of the observation period as a factor affecting the
[11] David B Dunson. 2001. Bayesian modeling of the level and duration of fertility
contraceptive failure rate. The Milbank Memorial Fund Quarterly 38, 2 (1960),
in the menstrual cycle. Biometrics 57, 4 (2001), 1067–1073.
140–152.
[12] David B. Dunson, Donna D. Baird, and Bernardo Colombo. 2004. Increased
[37] Roni Caryn Rabin. 2015. How Period Trackers Have Changed Girl Culture. New
Infertility With Age in Men and Women. Obstetrics & Gynecology (2004).
York Times (2015).
[13] David B Dunson and Joseph B Stanford. 2005. Bayesian inferences on predictors
[38] Rina Raphael. 2018. Can Silicon Valley Get You Pregnant? Fast Company (2018).
of conception probabilities. Biometrics 61, 1 (2005), 126–133.
[39] J Patrick Royston. 1982. Basal body temperature, ovulation and the risk of
[14] René Ecochard. 2006. Heterogeneity in fecundability studies: issues and modelling.
conception, with special reference to the lifetimes of sperm and egg. Biometrics
Statistical Methods in Medical Research 15, 2 (2006), 141–160.
(1982).
[15] Daniel A Epstein, Nicole B Lee, Jennifer H Kang, Elena Agapie, Jessica Schroeder,
[40] Patrick Royston and Alberto Ferreira. 1999. A new approach to modeling daily
Laura R Pina, James Fogarty, Julie A Kientz, and Sean Munson. 2017. Examining
probabilities of conception. Biometrics 55, 4 (1999), 1005–1013.
menstrual tracking to inform the design of personal informatics tools. In Proceed-
[41] Bruno Scarpa and David B Dunson. 2007. Bayesian methods for searching for
ings of the 2017 CHI Conference on Human Factors in Computing Systems. ACM,
optimal rules for timing intercourse to achieve pregnancy. Statistics in Medicine
6876–6888.
26, 9 (2007), 1920–1936.
[16] Richard J Fehring. 2002. Accuracy of the peak day of cervical mucus as a biological
[42] E Berglund Scherwitzl, O Lundberg, H Kopp Kallner, K Gemzell Danielsson, J
marker of fertility. Contraception 66, 4 (2002), 231–235.
Trussell, and R Scherwitzl. 2017. Perfect-use and typical-use Pearl Index of a
[17] Biowink GmbH. 2017. Clue by Biowink GmbH. helloclue.com
contraceptive mobile app. Contraception 96, 6 (2017), 420–425.
[18] Arthur L Greil. 1997. Infertility and psychological distress: a critical review of
[43] D Schwartz, PDM MacDonald, and V Heuchel. 1980. Fecundability, coital fre-
the literature. Social Science & Medicine 45, 11 (1997), 1679–1704.
quency and the viability of ova. Population Studies 34, 2 (1980), 397–400.
[19] Erika Check Hayden. 2016. Mobile-phone health apps deliver data bounty. Nature
[44] Mindel C Sheps. 1964. On the time required for conception. Population Studies
531, 7595 (2016), 422–423.
18, 1 (1964), 85–97.
[20] James J Heckman, Richard Robb, and James R Walker. 1990. Testing the mixture
[45] Joseph B Stanford and David B Dunson. 2007. Effects of sexual intercourse
of exponentials hypothesis and estimating the mixing distribution by the method
patterns in time to pregnancy studies. American Journal of Epidemiology 165, 9
of moments. J. Amer. Statist. Assoc. 85, 410 (1990), 582–589.
(2007), 1088–1095.
[21] Paula J Adams Hillard and Marija Vlajic Wheeler. 2017. Data from a Menstrual
[46] Olivia Sudjic. 2018. “I felt colossally naive”: the backlash against the birth control
Cycle Tracking App Informs our Knowledge of the Menstrual Cycle in Adoles-
app. The Guardian (2018).
cents and Young Adults. Journal of Pediatric and Adolescent Gynecology 30, 2
[47] Laura Symul, Katarzyna Wac, Paula Hillard, and Marcel Salathe. 2018. Assessment
(2017), 269–270.
of Menstrual Health Status and Evolution through Mobile Apps for Fertility
[22] Sepp Hochreiter and Jürgen Schmidhuber. 1997. Long short-term memory. Neural
Awareness. bioRxiv (2018).
Computation 9, 8 (1997), 1735–1780.
[48] Sara L Tietze and Richard Lincoln. 1987. Differential Fecundity and Effectiveness
[23] Nathalie Japkowicz. 2000. The class imbalance problem: Significance and strate-
of Contraception. In Fertility Regulation and the Public Health. Springer, 129–134.
gies. In Proceedings of the International Conference on Artificial Intelligence.
[49] John T Wilbanks and Eric J Topol. 2016. Stop the privatization of health data.
[24] Remah M Kamel. 2010. Management of the infertile couple: an evidence- based
Nature News 535, 7612 (2016), 345.
protocol. Reproductive Biology and Endocrinology (2010).
[50] Allen J Wilcox, David Dunson, and Donna Day Baird. 2000. The timing of the
[25] Zachary C Lipton, David C Kale, Charles Elkan, and Randall Wetzel. 2015.
“fertile window” in the menstrual cycle: day specific estimates from a prospective
Learning to diagnose with LSTM recurrent neural networks. arXiv preprint
study. British Medical Journal 321, 7271 (2000), 1259–1262.
arXiv:1511.03677 (2015).You can also read