Electrochemical Characterization and Inhibiting Mechanism on Calcium Leaching of Graphene Oxide Reinforced Cement Composites - MDPI
←
→
Page content transcription
If your browser does not render page correctly, please read the page content below
nanomaterials

Article
Electrochemical Characterization and Inhibiting
Mechanism on Calcium Leaching of Graphene Oxide
Reinforced Cement Composites
Wu-Jian Long , Tao-Hua Ye, Li-Xiao Li                 and Gan-Lin Feng *
 Guangdong Provincial Key Laboratory of Durability for Marine Civil Engineering, Shenzhen Durability Center
 for Civil Engineering, College of Civil Engineering, Shenzhen University, Shenzhen 518060, China;
 longwj@szu.edu.cn (W.-J.L.); 2172332301@email.szu.edu.cn (T.-H.Y.); lilixiao@szu.edu.cn (L.-X.L.)
 * Correspondence: 2172332349@email.szu.edu.cn; Tel.: +86-17620466312

 Received: 24 January 2019; Accepted: 15 February 2019; Published: 19 February 2019

 Abstract: Calcium leaching is a degradation progress inside hardened cement composites, where Ca2+
 ions in cement pore solution can migrate into the aggressive solution. In this work, calcium leaching
 of graphene oxide (GO) reinforced cement composites was effectively characterized by combined
 techniques of electrochemical impedance spectroscopy (EIS) and scanning electron microscope (SEM).
 Inhibiting mechanism of GO on calcium leaching of the composites was also examined. The obtained
 results show that the diameter of the semi-circle of the Nyquist curves of leached samples with GO
 addition decreased less than that of controlled samples. After leaching for 35 days, loss rate of model
 impedance RCCP of leached samples with 0, 0.05, 0.1, 0.15, and 0.2 wt.% GO addition was 94.85%,
 84.07%, 79.66%, 75.34%, and 68.75%, respectively. Therefore, GO addition can significantly mitigate
 calcium leaching of cement composites, since it can absorb Ca2+ ions in cement pore solution, as
 well as improve the microstructure of the composites. In addition, coupling leaching depth and
 compressive strength loss were accurately predicted by using the impedance RCCP .

 Keywords: graphene oxide; cement composites; calcium leaching; electrochemical impedance
 spectroscopy; scanning electron microscope; inhibiting mechanism

1. Introduction
     Cement composites are the most commonly used man-made materials worldwide and usually
exposed to aggressive environments where physical and chemical attacks impair the durability of
the composites [1–4]. Loss of durability further leads to the decrease of the service life of structures,
the increase of the environmental burdens, and the increase of the economic costs from maintenance.
In particular, calcium leaching is one of the most significant factors that affect the durability of the
composites, and generally occurs in infrastructures that have contacted with aqueous environments
with the pH value lower than 12.5 over long periods of time such as dams, harbors, cisterns, bridge
piers, underground pipes, and nuclear waste storage facilities [5,6].
     Calcium leaching is a combined diffusion-dissolution process inside hardened cement composites.
Aggressive environments around a structure can result in the concentration gradients of Ca2+ ions
in pore solution and surrounding environments, which leads to the diffusion of Ca2+ ions into
surrounding environments [7]. This transfer process modifies the chemical balance of Ca2+ ions
in cement system [8] and further results in the dissolution of calcium hydroxide (CH), ettringite, and
calcium silicate hydrate (C-S-H) [9], which leads to the microstructural changes of the composites.
The changes in the microstructure produce detrimental effects on the composites such as the decrease
in mechanical properties. According to Gaitero et al. [10], after 28-day curing and 9-day leaching

Nanomaterials 2019, 9, 288; doi:10.3390/nano9020288                        www.mdpi.com/journal/nanomaterials
Nanomaterials 2019, 9, 288                                                                        2 of 19

accelerated by 6 mol/L ammonium nitrate (NH4 NO3 ) solution, plain cement paste with water to
cement ratio (w/c) of 0.4 suffered a compressive strength reduction of approximately 75%. Similarly,
Arribas et al. [11] found that after 21-day leaching, plain cement paste with w/c of 0.5 suffered the
strength reduction of approximately 85%.
      To mitigate calcium leaching of cement composites, one effective approach includes the addition
of nanomaterials [10,12–14]. Among diverse nanomaterials, graphene oxide (GO) is a mono-layer of
mixed sp2 and sp3 hybridized carbon atoms with abundant functional oxygen groups such as carboxyl
(–COOH), hydroxyl (–OH), carbonyl (–C=O), and epoxy [15]. As the derivative of graphene, GO
shares some characteristics with graphene, such as super-high specific surface (~2600 m2 /g), high
Young’s modulus (~1100 GPa), and tremendous mechanical strength (~1060 GPa) [16]. Due to these
properties, GO has been generally used to reinforce the composites at the micro-molecular level [17–19].
In terms of calcium leaching, Long et al. [20] investigated the effect of GO on calcium leaching of
cement pastes by chemical composition analysis and microstructure analysis. The results indicate that
GO addition can decrease CH dissolution, refine the pore structure of leached pastes, and effectively
mitigate calcium leaching of the composites. Although the application of GO on leaching inhibition
of the composites has been reported, the studies about the inhibiting mechanism of GO on calcium
leaching have still been limited.
      Currently, a variety of traditional methods have been employed to characterize calcium leaching
of cement composites, including phenolphthalein solution test [21], thermo-gravimetric analysis [22],
chemical analysis [7], and porosity analysis [23]. However, these methods require samples to be
removed from the original structure and further manufactured. Thus, these methods are generally
used in laboratory settings, rather than applied in practice engineering, especially in the structure
where the timescale exceeds the designated service life such as cross-sea bridges. To monitor the
performance changes of infrastructures exposed to calcium leaching, electrochemical impedance
spectroscopy (EIS) has been used as an advanced non-destructive testing method to characterize
calcium leaching of plain cement pastes [24]. The principle of EIS method is by means of an applied
alternate current regime to detect the electrochemical impedance response of cement composites that
is affected by aggressive environments [25]. In addition, the relationship between electrochemical
impedance and leaching depth has been built. Although EIS method has been used to interpret
leaching behaviors of plain cement pastes, the application of EIS method to characterize calcium
leaching of GO reinforced cement composites has been still scarce. It should be noted that GO addition
makes the electrochemical behaviors of the composites more complicated. According to Long et al. [26],
GO addition can significantly increase the electrochemical impedance of the composites.
      Based on the aforementioned review, calcium leaching of cement composites reinforced with
GO (containing 0, 0.05, 0.1, 0.15, and 0.2 wt.% of cement) was systematically investigated in this
study. The experiments were conducted under 6 mol/L ammonium chloride (NH4 Cl) solution for
7, 14, 21, 28, and 35 days. EIS method was applied as a novel testing technology to characterize
calcium leaching of GO/cement composites. Scanning electron microscope (SEM) test was employed
to reveal the inhibiting mechanism of GO on calcium leaching of the composites. In addition,
macroscopic characterizations including leaching depth and compressive strength were used to explain
the feasibility of EIS method on practice engineering. Combined advanced characterizations from
the macroscopic, microstructural, and electrochemical perspectives contribute to not only reveal deep
insights on leaching behaviors of GO/cement composites, but also monitor the performance changes
of leached infrastructure incorporating GO.

2. Materials and Methods

2.1. Raw Materials
    Ordinary Portland cement (OPC, PI 42.5R) that conformed to the requirements of Chinese
Standard GB175 [27] was used in this research. The chemical composition and physical properties
Nanomaterials 2019, 9, 288 3 of 19
of OPC are given in Table 1. The particle-size distribution of OPC was determined using a laser
Nanomaterialsanalyzer,
particle-size 2019, 9, x FOR
as PEER
shown REVIEW
in Figure 1. Graphite oxide powder (Sixth Element Ltd., Changzhou, 3 of 19
China) was used for the preparation of the GO solution in the experiment. The properties of graphite
OPC are given in Table 1. The particle-size distribution of OPC was determined using a laser particle-
oxide powder are given in Table 2.
size analyzer, as shown in Figure 1. Graphite oxide powder (Sixth Element Ltd., Changzhou, China)
was used for the preparation of the GO
Table 1. Chemical solution inand
composition thephysical
experiment. The properties
properties of OPC. of graphite oxide
powder are given in Table 2.
Ingredient
Polycarboxylate-based CaOhigh-range
SiO2 Al2 O3 Fe2 O3 admixture
water-reducing MgO (PCE) SO3 wasKused 2O toNa 2O
improve LOI
the
Chemical
fluidity of the fresh
Composition Content cement composites,
64.42 20.52 conforming
5.62 to
3.78the requirements
2.11 of
2.10 Chinese
0.28 Standard
0.20 JG/T223
0.87
(mass %)
[28]. The maximum rate of water reduction was in the range of 30–35%. In addition, GO will become
agglomerate inSpecific
such asurface
high alkaline ρ0 environment like cement pore
Setting time (min)
Flexural strength
solution dueCompressive strength
to strong Van der
Physical area (m2 /g) (g/cm3 ) (MPa) (MPa)
Waal’s force and ionization interference. Therefore, PCE also served as a surfactant to disperse GO
properties Initial Final 3d 28 d 3d 28 d
in pore solution through 0.581 electrostatic
3.00 repulsion and steric stabilization. The characteristics of the
112 145 6.50 9.20 34.80 58.00
chemical admixtures are listed in Table 3.
100
Cement
90
80
70
Cum % Passing
60
50
40
30
20
10
0
0.00001 0.0001 0.001 0.01 0.1 1 10 100
Sieve (mm)
Figure1.1.Particle
Figure Particle size
size distribution
distribution of
ofOPC.
OPC.
Table 2.
Table 1. Chemical Propertiesand
composition of graphite
physical oxide.
properties of OPC.
Solid ContentCaO ViscosityAl2O3Absorbance
Fe2O3 Ratio Carbon
K2O Molar RatioLOI
Appearance Ingredient pH SiO 2 MgO SO 3 Na2O
Chemical (mass %) (Pa·s) A230/A600 (mass %) (O/C)
Content
composition
Brown paste 43 ± 1 64.42≥1.2 20.52
≥2000 5.62 3.78
≥45 2.11 2.10
47 ± 50.28 0.20
0.6 ±1 0.87
(mass %)
Flexural Compressive
Specific surface
Polycarboxylate-based ρ0
high-range water-reducing Setting time
admixture (PCE) was used strength
to improve the
strength
Physical area (m2/g) (g/cm3) (min)
fluidity of the fresh cement composites, conforming to the requirements (MPa) of Chinese
(MPa)Standard
properties
JG/T223 [28]. The maximum rate of water reduction Initial wasFinal
in the 3range
d ofd30–35%.
28 3 d In 28 addition,
d
0.581 in such a high
GO will become agglomerate 3.00 alkaline environment like cement pore solution due to
112 145 6.50 9.20 34.80 58.00
strong Van der Waal’s force and ionization interference. Therefore, PCE also served as a surfactant to
disperse GO in pore solution through electrostatic
Table repulsion
2. Properties and
of graphite steric stabilization. The characteristics
oxide.
of the chemical admixtures are listed in Table 3.
Solid content Viscosity Absorbance ratio Carbon Molar ratio
Appearance pH
(mass %) (Pa·s) A230/A600
Table 3. Characteristics of chemical admixtures. (mass %) (O/C)
Brown paste 43 ± 1 ≥1.2 ≥2000 ≥45 47 ± 5 0.6 ± 1
Designation State Density (g/m3 ) pH Solid Content (mass %)
RCM–3 Table 3. Characteristics
liquid 1.102 of chemical admixtures.
5.0 49.98
CP–WRM50 liquid 1.114 4.5 50.79
Designation State Density (g/m3) pH Solid content (mass %)
RCM–3 liquid 1.102 5.0 49.98
2.2. TestCP–WRM50
Methods liquid 1.114 4.5 50.79
2.2.1. Preparation and Characterization of GO Solution
2.2. Test Methods
A specified amount of graphite oxide powder was mixed with deionized water for 30 min
using a Preparation
2.2.1. and Characterization
magnetic stirrer. of GO Solution
The resulting aqueous suspension of graphite oxide with a concentration
A specified amount of graphite oxide powder was mixed with deionized water for 30 minutes
using a magnetic stirrer. The resulting aqueous suspension of graphite oxide with a concentration of
Nanomaterials 2019, 9, 288                                                                                 4 of 19

of 5 g/L was sonicated with an ultrasonic homogenizer (400 W, 25 Hz, model JY98-IIIN, Ningbo
Xinzhi Biotechnology Ltd., Ningbo, Zhejiang, China) for 2 h. The ultrasonicator was carried out in
cycles—an operation period of 2 s followed by an interval of 2 s—to avoid the suspension overheating.
After ultrasonication, the morphology of the obtained GO was scanned by atomic force microscopy
(AFM, type ICON-PT-PKG, Bruker, San Diego, CA, USA) and transmission electron microscopy (TEM,
type Talos F200X, FEI, Hillsboro, OR, USA). The chemical bonding characteristics of GO were examined
by Fourier transform infrared spectroscopy (FTIR, type AVANCE 600 MHz, Bruker, Switzerland).
In addition, GO was detected by Raman scattering (type inVia Reflex, Renishaw, London, UK).

2.2.2. Mix Proportioning and Sample Preparation
     The mix proportions of GO/cement composites are listed in Table 4. Different amounts of GO
used in this study were 0.00%, 0.05%, 0.10%, 0.15%, and 0.20% by weight of cement, respectively. It can
be generally accepted that GO is an excellent sorbent due to super-high specified surface area, which
results in the absorption of the maximum amount of free water. Thus, the PCE/GO ratio was selected
as 3.0 to ensure the adequate workability of the samples.

                                 Table 4. Mix proportions of GO/cement composites.

                Sample         Cement (g)       Water (g)       W/C Ratio          GO (g)         PCE/GO
                   R0              100              40               0.4               0             –
                   G1              100              40               0.4             0.05           3.0
                   G2              100              40               0.4              0.1           3.0
                   G3              100              40               0.4             0.15           3.0
                   G4              100              40               0.4              0.2           3.0
                             Note: the samples are represented according to the contents of GO.

     To achieve the good dispersion of GO in pore solution, GO was preferentially mixed with the
same content of PCE in this study [29]. Thus, the mixing procedure of the samples was as followed.
First, the GO solution with a specified dosage of PCE (represented as mixture 1) and the water with
the rest of PCE (represented as mixture 2) were thoroughly stirred, respectively. Then, cement was
added to the mixture 2 and mixed at low rotation speed (62 ± 5 r/min) for 30 s, followed by the
addition of the mixture 1 and mixed for 1 min and 30 s. Finally, it was mixed at high rotation speed
(125 ± 10 r/min) for another 1 min and 30 s. The obtained GO/cement paste was cast into two molds
(dimensions: 30 × 30 × 30 mm3 and 40 × 40 × 40 mm3 ) at 20 ± 2 ◦ C and >95% relative humidity,
and covered using a plastic film to prevent water loss. After demolding, the samples were cured in a
moisture room under the same conditions for 28 days, confirming to the requirements of the Chinese
standard GB/T 50081 [30].

2.2.3. Leaching Solution Selection
     Calcium leaching in nature is a slow process. It was reported that the leaching front of concrete
exposed to still field water for 100 years was only about 5 to 10 mm [31]. Therefore, most of
the researches have applied accelerated leaching methods, for example, using 6 mol/L NH4 NO3
solution [32], or 6 mol/L NH4 Cl solution [33], or deionized water [34], or using electrochemical
method [35]. Among these methods, 6 mol/L NH4 NO3 solution has been regarded as the most
effective method, which can accelerate the leaching speed two orders and still get the same end
products. However, this is also the raw materials for production of explosives. Considering the safety
of the experiments, the NH4 Cl (>99.5% purity, Meilune Biotechnology Ltd., Liaoning, China) was used
in this study. The accelerated principle of 6 mol/L NH4 Cl solution is to promote chemical reaction
between CH and NH4 Cl, which forms gaseous ammonia and calcium chloride that is highly soluble in
water (see Equation (1)).
Nanomaterials 2019, 9, 288 5 of 19
Ca(OH)2 +2NH4 Cl = Ca2+ +2OH− +2H+ +2NH3 (↑)+2Cl− = CaCl2 +2NH3 (↑)+2H2 O (1)
Nanomaterials 2019, 9, x FOR PEER REVIEW 5 of 19
2.2.4. Leaching Test
After curing for 28 days,
days, the
the samples
samples were
were placed
placed inin the
the sealed
sealed containers
containers filled
filled with
with 66mol/L
mol/L
NH44Cl
Cl solution
solution (solubility:
(solubility: 37.2
37.2g/100
g/100mlmL at at
20 20 2 ◦to
± 2±°C) C)undergo
to undergo calcium
calcium leaching
leaching for14,
for 7, 7, 21,
14, 28,
21,
28,
andand 35 days.
35 days. The volume
The volume ratio
ratio of of an
an NH 4Cl NH 4 Cl solution
solution to a was
to a sample sample
keptwas kept at
constant constant at 20 to
20 to observing
observing phenomena ◦ C and
± 2and
phenomena in a shortintime.
a short
In time. In addition,
addition, the leaching
the leaching tests performed
tests were were performed
at 20at± 202 °C the
the leachant was not renewed during the tests. After leaching, the samples
leachant was not renewed during the tests. After leaching, the samples were removed from were removed from the
containers, and further manufactured
manufactured forfor the
the next
next experiments.
experiments.
2.2.5. Leaching Depth
2.2.5. Leaching Depth Test
Test
In
In this
this experiment,
experiment, phenolphthalein
phenolphthalein pH pH indicator
indicator solution
solution was was applied
applied toto measure
measure the
the leaching
leaching
depth of a leached sample. It was prepared by diluting a mixture of 1 g of phenolphthalein
depth of a leached sample. It was prepared by diluting a mixture of 1 g of phenolphthalein and and 90 mL
90
of 95.0 V/V% ethanol aqueous solution to 100 mL with deionized water. First,
mL of 95.0 V/V% ethanol aqueous solution to 100 mL with deionized water. First, a leached sample a leached sample with
awith
dimension of 30of×30
30××3030 mm 3
a dimension × 30 mmwas transversely
3 was transversely split
splitinto
intotwo
twosections.
sections.Then,
Then, one
one of
of exposed
exposed
fresh surfaces was immediately cleaned and sprayed with the phenolphthalein
fresh surfaces was immediately cleaned and sprayed with the phenolphthalein solution. Finally, foursolution. Finally, four
leaching fronts of the sample were determined using a digital caliper with a measurement
leaching fronts of the sample were determined using a digital caliper with a measurement accuracy accuracy of
0.01 mm.
of 0.01 mm. Each
Eachfront was
front tested
was testedatatthree
threeappropriate
appropriatepoints
points(Figure
(Figure2)2)and
andthree
three samples
samples from
from each
each
group
group were examined. As a result, the leaching depth of a group was calculated by averaging the
were examined. As a result, the leaching depth of a group was calculated by averaging the
thirty-six
thirty-six tested
tested points.
points.
Figure 2.
Figure 2. Leaching
Leaching depth
depth test
test for
for the
the sample
sampleexposed
exposedto
to66mol/L
mol/L NH44Cl
Cl solution.
solution.
2.2.6. Compressive Strength
2.2.6. Compressive Strength Test
Test
Three leached samples
samples with
with aa dimension
dimensionof 40××4040
of40 × 40 mm 3 from each group were prepared
Three leached × 40 mm 3 from each group were prepared for
for the compressive strength test, which was performed at the computerized
the compressive strength test, which was performed at the computerized universal universal testing
testing machine
machine
(YHZ-300) with a loading rate of 2400 N/s, confirming to the Chinese standard GB/T 17671-1999
(YHZ-300) with a loading rate of 2400 N/s, confirming to the Chinese standard GB/T 17671-1999 [36]. [36].
Similarly,
Similarly, the
the strength
strength for
for each
each group
groupwas
wascalculated
calculatedbybyaveraging
averagingthe thethree
threetested
testedvalues.
values.
2.2.7. Electrochemical Impedance
2.2.7. Electrochemical Impedance Spectroscopy
Spectroscopy (EIS)
(EIS) Measurement
Measurement
To characterize
To characterize leaching process of the GO/cement
leaching process of the GO/cement composites, a leached
composites, a sample
leachedwith a dimension
sample with a
of 30 × 30 × 30 mm 3 was tested using the electrochemical workstation (type PARSTAT 4000, AMETET
dimension of 30 × 30 × 30 mm was tested using the electrochemical workstation (type PARSTAT
3
Ltd.,
4000, San Diego,Ltd.,
AMETET CA,SanUSA) over
Diego, theUSA)
CA, frequency range
over the of 1 Hz
frequency to 1ofMHz
range 1 Hzattoa1 sinusoidal potential
MHz at a sinusoidal
perturbation of 100 mV. It should be noted that leaching in 6 mol/L
potential perturbation of 100 mV. It should be noted that leaching in 6 mol/L NH 4 Cl solution can generate
NH4Cl solution can
unnecessary white crystals
generate unnecessary white oncrystals
the surface of surface
on the a leachedofsample (Figure
a leached sample3a).(Figure
The crystals
3(a)). can
The significantly
crystals can
increase the electrical
significantly conductivity
increase the of the sample,
electrical conductivity as shown
of the sample, inasthe comparison
shown of Figure 3b,d.
in the comparison To be
of Figures
3(b) and 3(d). To be consistent with real conditions on infrastructure, a leached sample was immersed
in the tap water (the volume ratio between a sample and the water was 1:3) before test and gently
shook to remove the white crystals. A new sample used for this test can be seen in Figure 3(c). After
the preparation for the samples, the test procedures are as followed. First, the moisture on the surface
of the sample need to be wiped. Then, the sample was placed between two parallel electrodes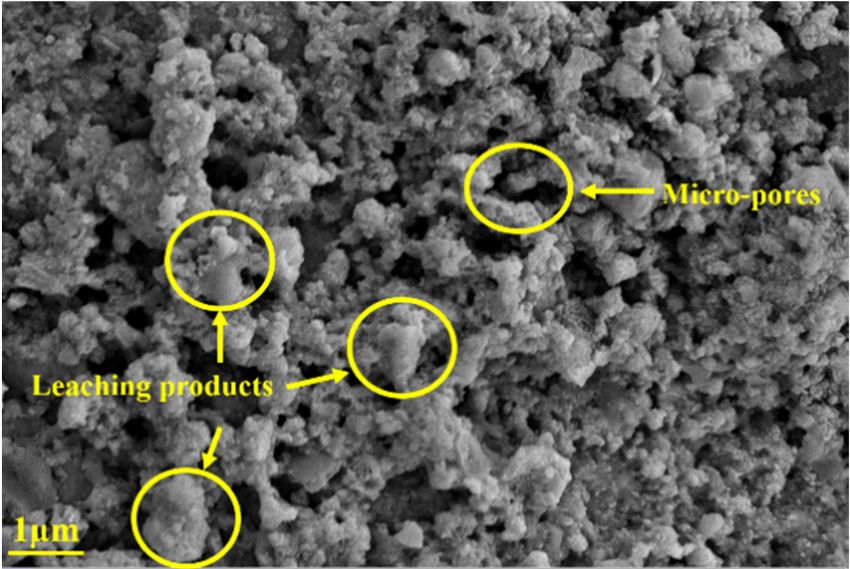
Nanomaterials 2019, 9, 288 6 of 19
consistent with real conditions on infrastructure, a leached sample was immersed in the tap water
(the volume ratio between a sample and the water was 1:3) before test and gently shook to remove
the white crystals. A new sample used for this test can be seen in Figure 3c. After the preparation
for the samples, the test procedures are as followed. First, the moisture on the surface of the sample
need to be wiped. Then, the sample was placed between two parallel electrodes mounted in a tested
mold, and directly contacted with the electrodes. Finally, the tested results were analyzed by using the
ZSimpWin
Nanomaterialssoftware.
2019, 9, x FOR PEER REVIEW 6 of 19
(a) (b)
(c) (d)
Figure3.3.Morphology
Figure Morphologyandandthe
theNyquist
Nyquistcurve
curveof
ofG1
G1after
afterleaching
leachingfor
for77days:
days:(a)
(a)morphology
morphologyofofG1G1
before immersion; (b) the Nyquist curve of G1 before immersion; (c) morphology of G1 after
before immersion; (b) the Nyquist curve of G1 before immersion; (c) morphology of G1 after immersion;
and (d) the Nyquist
immersion; and (d) curve of G1 after
the Nyquist curveimmersion.
of G1 after immersion.
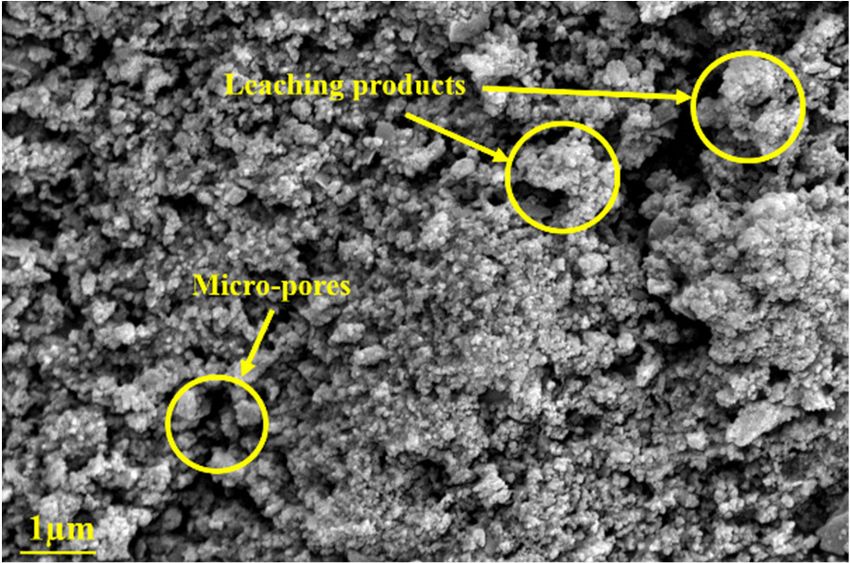
2.2.8. Microstructural Analysis
2.2.8. Microstructural Analysis
To characterize the microstructural changes of GO/cement composites exposed to calcium
To characterize the microstructural changes of GO/cement composites exposed to calcium
leaching, the leached samples were detected by scanning electron microscope (SEM) tests. Before test,
leaching, the leached samples were detected by scanning electron microscope (SEM) tests. Before test,
the leached samples were immersed in anhydrous ethanol to avoid carbonation and to replace cement
the leached samples were immersed in anhydrous ethanol to avoid carbonation and to replace cement
pore solution for further discussion. After that, the samples were cut from the original one based on a
pore solution for further discussion. After that, the samples were cut from the original one based on
specified region. Then, the sample was placed in an oven at a temperature of 60 ◦ C for 1 d, followed
a specified region. Then, the sample was placed in an oven at a temperature of 60 °C for 1 d, followed
by the SEM tests using a GeminiSEM 300 (Zeiss, Thuringia, Germany). In addition, an energy disperse
by the SEM tests using a GeminiSEM 300 (Zeiss, Thuringia, Germany). In addition, an energy
spectroscopy (EDS) was used to determine the elemental composition of the region of interest.
disperse spectroscopy (EDS) was used to determine the elemental composition of the region of
3.interest.
Results and Discussion
3. Results
3.1. and Discussion
GO Characterization
TheCharacterization
3.1. GO AFM image and spectra of GO are shown in Figure 4a,b, respectively. These results indicate
that GO possessed an irregular plane shape with a dimension of about 0.7 µm and a thickness of
aboutThe
1.8 AFM image 4c
nm. Figure andshows
spectratheofTEM
GO are shown
image of GOin Figure 4a and It
morphology. 4b,can
respectively. These
be found that GO results
was
indicate that
consisted GO possessed
of many wrinkled anandirregular planedue
folded areas shape with a dimension
to intercalating of about
abundant 0.7 μmoxygen
functional and a thickness
groups.
of about 1.8 nm.
Furthermore, Figure
FTIR 4c exhibits
spectra shows the theTEM imagebonds
chemical of GOofmorphology. It can
the functional be found
oxygen that
groups of GO
GO,was
as
consisted of many wrinkled and folded areas due to intercalating abundant functional oxygen
groups. Furthermore, FTIR spectra exhibits the chemical bonds of the functional oxygen groups of
GO, as shown in Figure 4d. The typical characteristic peaks of GO were 3400, 1720, 1634, and 1058
cm–1, corresponding to –OH, C=O, C=C, and C–O, respectively. These functional oxygen groups made
GO easily dispersible in aqueous solutions. In addition, Figure 4e presents the Raman spectrum of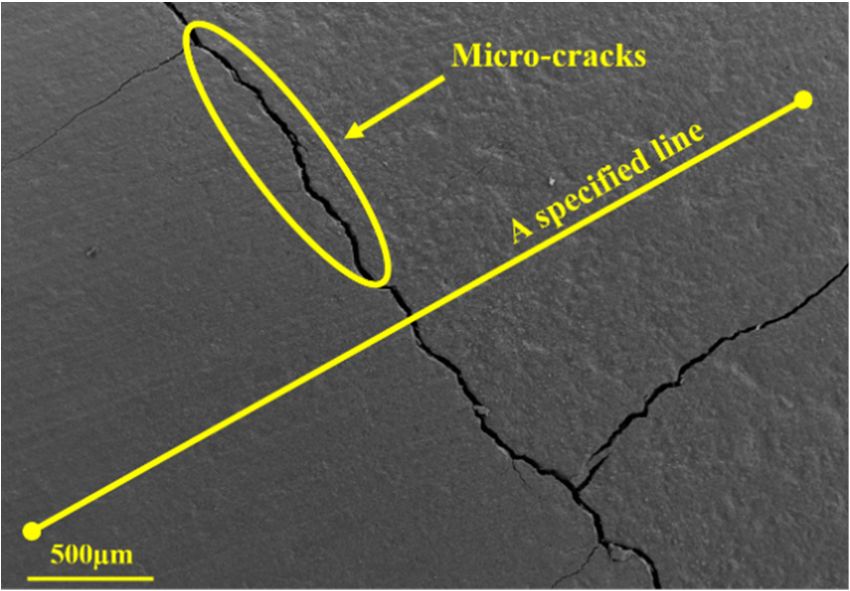
Nanomaterials 2019, 9, 288                                                                        7 of 19

shown in Figure 4d. The typical characteristic peaks of GO were 3400, 1720, 1634, and 1058 cm−1 ,
corresponding to –OH, C=O, C=C, and C–O, respectively. These functional oxygen groups made GO
easily dispersible in aqueous solutions. In addition, Figure 4e presents the Raman spectrum of GO,
where three dominant peaks can be observed. The first band (G-band, at 1620 cm−1 ) was due to the
stretching of C-C bond in the graphite mode. The second band (D-band, at 1380 cm−1 ) originated from
the diamondoid mode. The third band (2D–band, at 2900 cm−1 ) was the second order of the D peaks.
In particular, the ID /IG mass ratio of GO is higher than that of graphite, since GO has a disordered
structure  due
Nanomaterials    to 9,the
              2019,        presence
                        x FOR       of functional oxygen groups [37].
                              PEER REVIEW                                                       7 of 19

                               (a)                                 (b)

                               (c)                                 (d)

                                                   (e)
      Figure 4.
      Figure  4. Characterization
                 Characterization ofof GO:
                                       GO: (a) AFM image; (b) AFM spectra;
                                                                  spectra; (c) TEM
                                                                               TEM image;
                                                                                    image; (d)
                                                                                           (d) FTIR
                                                                                               FTIR
      transmittance spectra;
      transmittance spectra; and
                             and (e)
                                  (e) Raman
                                      Raman spectrum.
                                            spectrum.

3.2.
3.2. Macroscopic
     Macroscopic Characterizations
                 Characterizations for
                                   for Leached
                                       Leached GO/Cement
                                               GO/Cement Composites
                                                         Composites
3.2.1. Leaching Depth Analysis
3.2.1. Leaching Depth Analysis
      Leaching depth tests are carried out by spraying the phenolphthalein solution on the clean
      Leaching depth tests are carried out by spraying the phenolphthalein solution on the clean
surface of the leached samples. The experiments are based on the principle that when sprayed with
surface of the leached samples. The experiments are based on the principle that when sprayed with
phenolphthalein, the intact zone of the samples becomes pink due to the existence of alkali, while the
phenolphthalein, the intact zone of the samples becomes pink due to the existence of alkali, while the
degraded zone still keeps grey. Generally, leaching depth can be used to describe the leaching process
degraded zone still keeps grey. Generally, leaching depth can be used to describe the leaching process
of cement composites.
of cement composites.
      Figure 5 shows the average of the time-varying leaching depths for the samples exposed to 6
mol/L NH4Cl solution. As can be seen from the figure, the growth rate on the leaching depths for all
samples decreased progressively due to the reduction of the concentration gradients of Ca2+ ions
between cement pore solution and the surrounding environments [20]. Furthermore, leaching depths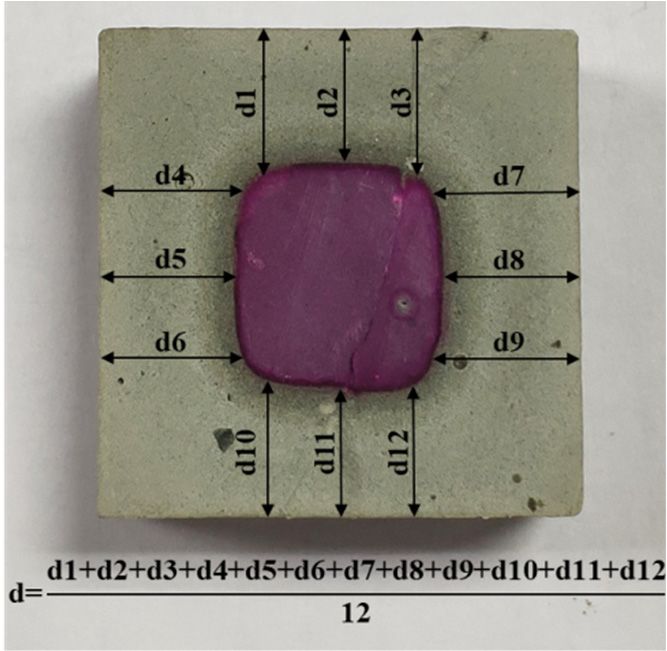
addition can restrict the diffusion of Ca2+ ions and detrimental ions such as NH4+ and Cl- ions, thus
mitigating calcium leaching of cement composites.
To further determine the relationship between the leaching depth and the exposure duration,
the test data
Nanomaterials from
2019, Figure 5 were fitted to the formula described by Fick’s law: d=k√t, where d is
9, 288 8 ofthe
19
leaching depth (mm), k is the leaching coefficient related to ionic diffusion coefficient, and t is the
leaching duration (day). Figure 6 shows the linear fitting on the leaching depth in relation to the
squareFigure
root5of shows the average
the leaching of the time-varying
duration. The leaching leaching depths
coefficients (k), for the samples
correlation exposed(R),
coefficient to
6determination
mol/L NH4 Cl solution. As can be seen from the figure, the growth rate on the leaching
coefficients (R ), and probability value (P-value) are also given in the figure, while the
2 depths
for all samples 2+
equations of thedecreased progressively
fitting curves are showndue to the
in the reduction
figure caption.ofItthe
canconcentration
be clearly seengradients
that all Rof Ca
2 of the
ions between
fitting curves cement pore solution
were higher than 0.980,andindicating
the surrounding
that the environments
curves were[20]. highlyFurthermore,
correlated leaching
with the
depths
measurement points. In this study, the leaching coefficients k of R0, G1, G2, G3, andfor
for the samples decreased with the increase of GO content. After leaching G435 days,
were the
1.642,
leaching depths
1.524, 1.438, 1.292, for
andR0,1.131,
G1, G2, G3, and G4
respectively. were 9.34,
According 8.66, 8.29,
to Forster et al.7.58, and 6.48leaching
[6], smaller mm, respectively.
coefficient
In
(k) indicated slower leaching process. In addition, Tang et al. [40] reported that the(7.55
particular, the leaching depth for G4 after leaching for 35 days was still lower than that mm)
leaching
for R0 aftercan
coefficient leaching for 21the
represent days. According
leaching to previous
rate of a sample.literature
Therefore,[38,39], GO addition
the leaching rate can
of R0generate
was the a
strong barrier effect on the chloride ion transport of cement composites. Therefore,
highest, followed by G1, G2, G3, and G4. In addition, the leaching rate of R0 was above 1.45 times it suggests that GO
addition 2+ ions and detrimental ions such as NH + and Cl− ions, thus
than thatcan restrict
of G4. These theresults
diffusion of Ca
further reveal that GO addition can effectively retard 4 leaching process
mitigating calcium leaching of cement composites.
of cement composites.
Figure 5. Time-varying
Figure 5. Time-varying leaching
leachingdepths
depthsfor
forthe
thesamples
samplesexposed
exposedto
to66mol/L
mol/L NH44Cl
Cl solution.
solution.
To further determine the relationship between the leaching depth and the exposure duration, the
√
test data from Figure 5 were fitted to the formula described by Fick’s law: d = k t, where d is the
leaching depth (mm), k is the leaching coefficient related to ionic diffusion coefficient, and t is the
leaching duration (day). Figure 6 shows the linear fitting on the leaching depth in relation to the square
root of the leaching duration. The leaching coefficients (k), correlation coefficient (R), determination
coefficients (R2 ), and probability value (p-value) are also given in the figure, while the equations of
the fitting curves are shown in the figure caption. It can be clearly seen that all R2 of the fitting curves
were higher than 0.980, indicating that the curves were highly correlated with the measurement points.
In this study, the leaching coefficients k of R0, G1, G2, G3, and G4 were 1.642, 1.524, 1.438, 1.292, and
1.131, respectively. According to Forster et al. [6], smaller leaching coefficient (k) indicated slower
leaching process. In addition, Tang et al. [40] reported that the leaching coefficient can represent the
leaching rate of a sample. Therefore, the leaching rate of R0 was the highest, followed by G1, G2, G3,
and G4. In addition,
Figure 6. Linear the leaching
fitting of the rate of R0depth
leaching was above
of the 1.45 times
samples in than thattoofthe
relation G4.square
Theseroot
results further
of the
reveal that GO
leaching addition
duration. canthe
Note: effectively
equationsretard
of theleaching process
fitting curves of G1,
of R0, cement composites.
G2, G3, and G4 are y=1.642x–
0.083, y=1.524x–0.156, y=1.438x–0.263, y=1.292x–0.204, and y=1.131x–0.300.
3.2.2. Compressive Strength Analysis
One of the most important tests from the practical engineering point of view is compressive
strength test [10]. As another macroscopic method used in this study, the test provided the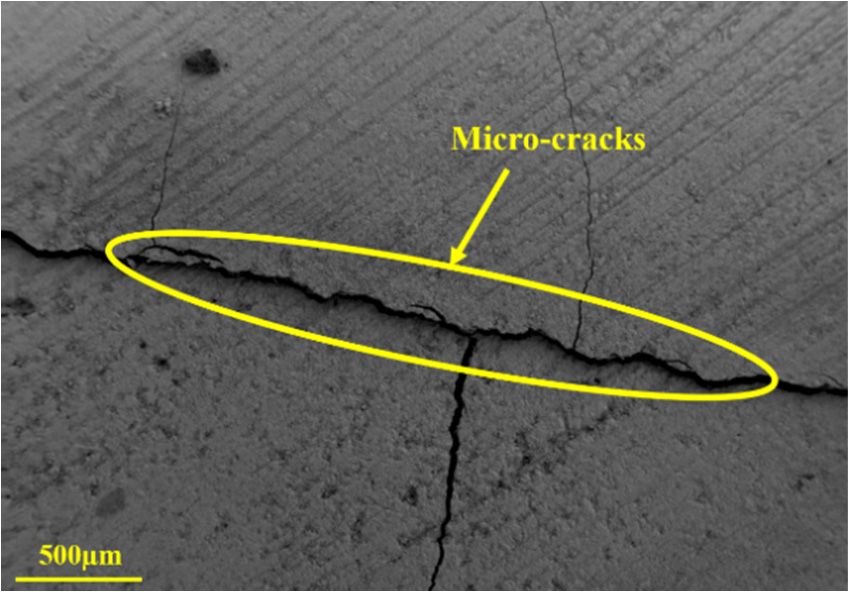
Nanomaterials 2019, 9, 288 9 of 19
Figure 5. Time-varying leaching depths for the samples exposed to 6 mol/L NH4Cl solution.
Nanomaterials 2019, 9, x FOR PEER REVIEW 9 of 19
parameters that assessed the validity of GO/cement composites for their application in infrastructure
exposed to calcium leaching.
Figure 7 shows the compressive strengths for the samples leached for 0, 7, 14, 21, 28, and 35 days
in 6 mol/L NH4Cl solution. Before leaching, the compressive strength of the samples increased with
the GO content. When compared to R0, the compressive strength of G1, G2, G3, and G4 increased by
6.60%, 15.80%, 17.92%, and 24.98%, respectively. It can be attributed to the super-high specified
surface area of GO which acted as nucleation sites to promote cement hydration, and the good
dispersion of GO which provided reinforcement at nano-micro structural level [17]. After leaching,
compressive strength of the samples decreased gradually with the leaching duration.
To reveal the effect of GO on calcium leaching of cement composites, compressive strength loss
of the leached samples in relation to leaching duration is shown in Figure 8. It can be clearly seen that
the compressive
Figure strength
Figure 6.6.Linear
Linear fitting
fitting loss
of of ofleaching
thethe the leached
leaching
depth samples
depth thedecreased
ofsamples
of the samples with
in
in relation tothe
theincrease
relation to the root
square of of
squareGO content.
root
the of theAfter
leaching
leaching for 35
leaching
duration. daysthe
duration.
Note: inNote:
6 mol/L
equations NH 4Clfitting
the equations
of the solution,
of the theofcompressive
fitting
curves curves
R0, G1,ofG2, strength
R0,G3,
G1,and
G2,G4 loss
G3, and
are of
y= R0,
G4 G1,
are
1.642x G2,
− G3, and
y=1.642x–
0.083,
0.083, −
y=1.524x–0.156,
0.156, y = 1.438x −
y=1.438x–0.263,
0.263, y=1.292x–0.204,
y = 1.292x − and
0.204, y=1.131x–0.300.
G4 was 78.54%, 76.33%, 72.10%, 70.80%, and 68.87%, respectively. In particular, the compressive
y = 1.524x and y = 1.131x − 0.300.
strength loss of R0 was above 1.14 times than that of G4. These results indicated that GO addition can
3.2.2.
3.2.2. Compressive
Compressive Strength
Strength Analysis
Analysis
significantly mitigate calcium leaching of cement composites. In addition, the loss rate on the
One
compressive of
One of thethe most
strength
most of important
the leached
important tests from
from the
samples
tests practical
practical engineering
progressively
the slowed down
engineering point
with
point of view
ofthe
view is
is compressive
leaching duration.
compressive
strength
This test [10].
phenomenon As another
can be macroscopic
explained by method
the used
dissolution in this
of
strength test [10]. As another macroscopic method used in this study, the test provided CHstudy,
and the test
C–S–H. provided
According the parameters
to previous
the
that assessed
literature the validity
[22,41], of GO/cement
the dissolution of CH composites
and C–S–H for their
can be application
divided in infrastructure
into three steps:exposed to
the quick
calcium
dissolutionleaching.
of CH, partial dissolution of C–S–H, and quick and total decalcification of the partially
Figure
leached 7 shows
C–S–H. the compressive
It suggests that calcium strengths for the
leaching samples
process leached
is firstly for 0, 7, 14,
dominated by21,the28, and 35 days
dissolution of
in 6 mol/L
CH, followed by NH Cl solution. Before leaching, the compressive strength
4 the dissolution of C–S–H. Moreover, the dissolution of CH results in the amount of the samples increased with
the GO content.
increase When compared
of the capillary pores (5 toto5000 R0, the
nm),compressive strength of G1,
while the decalcification of G2,
C–S–HG3, results
and G4inincreased
the amountby
6.60%,
increase 15.80%,
of gel 17.92%,
pores (0.5 andto24.98%,
10 nm).respectively.
When compared It can to
begel
attributed
pores, theto the super-high
capillary poresspecified surface
are responsible
area of GO
for the which in
reduction acted as nucleation
strength of cementsites to promote
composites cement
[5,42]. hydration, the
Consequently, andrapid
the good dispersion
reduction of
at early
GO
age which
can be provided
attributedreinforcement
to the additional at nano-micro
capillary pores structural
produced levelby[17].
the After leaching,
dissolution of CH, compressive
while the
strength
decelerationof the samples
can be duedecreased gradually
to the additional gelwith
poresthe leaching
formed duration.
by the decalcification of C–S–H.
Figure 7.
Figure 7. Compressive
Compressive strengths
strengths for
for the
the samples
samples leached
leached for
for 0,
0, 7,
7, 14,
14, 21,
21,28,
28,and
and35
35days
daysin
in66mol/L
mol/L
NH44Cl solution.
NH
To reveal the effect of GO on calcium leaching of cement composites, compressive strength
loss of the leached samples in relation to leaching duration is shown in Figure 8. It can be clearly
seen that the compressive strength loss of the leached samples decreased with the increase of GO
content. After leaching for 35 days in 6 mol/L NH4 Cl solution, the compressive strength loss of R0,
G1, G2, G3, and G4 was 78.54%, 76.33%, 72.10%, 70.80%, and 68.87%, respectively. In particular, the
compressive strength loss of R0 was above 1.14 times than that of G4. These results indicated that
GO addition can significantly mitigate calcium leaching of cement composites. In addition, the loss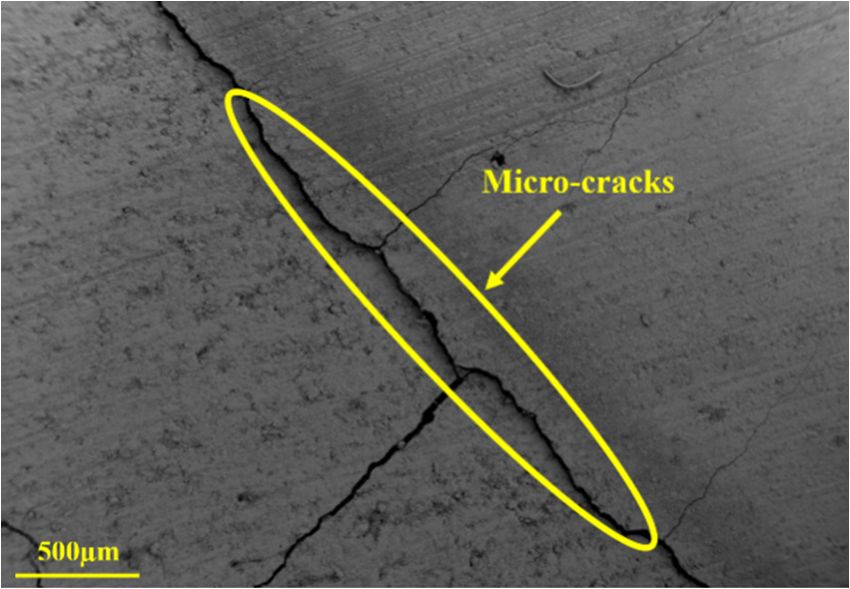
Nanomaterials 2019, 9, 288                                                                                  10 of 19

rate on the compressive strength of the leached samples progressively slowed down with the leaching
duration. This phenomenon can be explained by the dissolution of CH and C–S–H. According to
previous literature [22,41], the dissolution of CH and C–S–H can be divided into three steps: the quick
dissolution of CH, partial dissolution of C–S–H, and quick and total decalcification of the partially
leached C–S–H. It suggests that calcium leaching process is firstly dominated by the dissolution of
CH, followed by the dissolution of C–S–H. Moreover, the dissolution of CH results in the amount
increase of the capillary pores (5 to 5000 nm), while the decalcification of C–S–H results in the amount
increase of gel pores (0.5 to 10 nm). When compared to gel pores, the capillary pores are responsible
for the reduction in strength of cement composites [5,42]. Consequently, the rapid reduction at early
age can be attributed to the additional capillary pores produced by the dissolution of CH, while the
deceleration   can9,be
Nanomaterials 2019,    duePEER
                     x FOR to the additional gel pores formed by the decalcification of C–S–H. 10 of 19
                                REVIEW

                                          loss of
           Figure 8. Compressive strength loss of the
                                                  the leached
                                                      leached samples
                                                              samples in
                                                                      in relation
                                                                         relation to
                                                                                   to leaching
                                                                                       leaching duration.
                                                                                                duration.

3.3.
3.3. Electrochemical
     Electrochemical Characterizations
                      Characterizations forfor Leached
                                               Leached GO/Cement
                                                        GO/Cement Composites
                                                                     Composites
      To
      Tocharacterize
          characterizecalcium
                         calcium leaching
                                    leachingof GO  reinforced
                                                of GO           cement
                                                         reinforced     composites,
                                                                     cement           the EISthe
                                                                               composites,    method    was applied
                                                                                                  EIS method    was
as an  advanced    technique    in  this  study.  First,  three  modifications   of the equivalent
applied as an advanced technique in this study. First, three modifications of the equivalent circuit  circuit model
were
model  proposed.   Then, the
         were proposed.       effects
                           Then,   the of  leaching
                                        effects      duration
                                                of leaching      and GOand
                                                               duration   addition   on the on
                                                                             GO addition    Nyquist    curvescurves
                                                                                                the Nyquist   of the
leached  samples   were  discussed.     Finally, the model    impedance
of the leached samples were discussed. Finally, the model impedance       R CCP  were  used  to further  present
                                                                                       RCCP were used to further the
inhibiting
present the effect of GO on
              inhibiting       calcium
                           effect  of GO  leaching   of theleaching
                                             on calcium      composites,   andcomposites,
                                                                      of the    predict coupling    leaching
                                                                                            and predict       depth
                                                                                                           coupling
and  compressive    strength  loss   of the leached   samples.
leaching depth and compressive strength loss of the leached samples.
3.3.1. Modifications of Equivalent Circuit Model for Leached Samples
3.3.1. Modifications of Equivalent Circuit Model for Leached Samples
      According to Song et al. [24], a novel equivalent circuit model used to explain calcium leaching
      According to Song et al. [24], a novel equivalent circuit model used to explain calcium leaching
behaviors of plain cement pastes was proposed, as shown in Figure 9. However, there are several
behaviors of plain cement pastes was proposed, as shown in Figure 9. However, there are several
confusions in this model. Thus, this model is updated here through three modifications. First,
confusions in this model. Thus, this model is updated here through three modifications. First, cement
cement composites are an electrochemical system which has three current channels: continuous
composites are an electrochemical system which has three current channels: continuous conductive
conductive paths (CCPs) composed of continuously connected micro-pores, discontinuous conductive
paths (CCPs) composed of continuously connected micro-pores, discontinuous conductive paths
paths (DCPs) consisted of discontinuous micro-pores, and “insulator” conductive paths (ICPs) from
(DCPs) consisted of discontinuous micro-pores, and “insulator” conductive paths (ICPs) from
continuous cement matrix [43]. In the model, the CCPs, ICPs, and DCPs should be viewed as a resistor,
continuous cement matrix [43]. In the model, the CCPs, ICPs, and DCPs should be viewed as a
a capacitor, and a series connection of resistor and capacitor, respectively. Then, there are two regions
resistor, a capacitor, and a series connection of resistor and capacitor, respectively. Then, there are
in the leached samples: the degraded zone and the intact zone. In the degraded zone, the DCPs can
two regions in the leached samples: the degraded zone and the intact zone. In the degraded zone, the
be neglected rather than the ICPs since the DCPs are degraded in such a greater extent. Finally, the
DCPs can be neglected rather than the ICPs since the DCPs are degraded in such a greater extent.
description code of this model can be described as (Qmat (QDP RCP ) RCCP ) (QL RL ), and the modified
Finally, the description code of this model can be described as (Qmat (QDP RCP) RCCP) (QL RL), and the
equation of the total impedance Z of the model (Qmat (QDP RCP ) RCCP ) (QL RL ) can be expressed by
modified equation of the total impedance Z of the model (Qmat (QDP RCP) RCCP) (QL RL) can be expressed
Equation (2):
by Equation (2):
                                     RCCP (1 +
                                        RCCP    R CP
                                              (1+R   jωQ DP))
                                                   CP jωQDP                  RL RL
                    Z = Z=                                              + + 1 + R jωQ                           (2)
                                                                                                               (2)
                       (1 + R1+R jωQ
                             CCPCCP jωQ  )( 1 +
                                      matmat 1+RR   jωQ
                                                  CP jωQDP
                                                           )+ R    jωQDP 1+RL jωQ
                                                         DP +RCCP jωQDP
                                                 CP            CCP               LL   L

     Where j      √ 1 and ω is the angle frequency. The physical significance of each circuit elements
are captioned in Figure 9. Based on a novel model proposed by Song et al. [24], this modified one was
applied in this study for analyzing calcium leaching of GO reinforced cement composites.
Nanomaterials 2019, 9, 288 11 of 19
√
where j = −1 and ω is the angle frequency. The physical significance of each circuit elements are
captioned in Figure 9. Based on a novel model proposed by Song et al. [24], this modified one was
Nanomaterials 2019, 9,
9,xxFOR PEER REVIEW 11
11 of
of 19
applied in this
Nanomaterials 2019,study for
FOR analyzing
PEER REVIEWcalcium leaching of GO reinforced cement composites. 19
Figure
Figure 9.
Figure 9. Equivalent
9. Equivalent circuit
circuit model
model for
model for calcium
for leaching
calcium leaching
calcium of
leaching of cement
of cement composites,
cement composites, where
composites, where
where R RRCCP is the
the
CCP is the
CCP
resistance
resistance of
resistance of the
of the CCPs
the CCPs in
CCPs in the
in the intact
the intact zone;
intactzone;
zone;QQ DP is the double layer capacitance of the DCPs in the intact
QDPDP is the double layer capacitance of the DCPs in the intact intact
zone;
zone; R
zone; RCP
R is the resistance of the DCPs in
CP is the resistance of the DCPs in in the
the intact
the intact zone;
intact zone; Q
zone; Q mat is the double layer capacitance of the
mat is the double layer capacitance of the
Qmat the
CP
ICPs
ICPs in
ICPs in the
in the intact
the intact zone;
intact zone; R L is the resistance of the CCPs in the degraded zone; and QL is the double
zone; RRLL is the resistance
resistance ofof the
the CCPs
CCPs in
in the
the degraded
degraded zone;
zone; and
and QQLL is
is the
the double
double
layer
layer capacitance
layer capacitance of
capacitance ofthe
of theICPs
the ICPs in
ICPs in the
in the degraded
the degraded zone.
degraded zone.
zone.
3.3.2. Effect
3.3.2. Effect
Effect ofof Leaching
of Leaching
Leaching Duration
Duration on on the
the Nyquist
Nyquist Curve Curve of of Leached
Leached Samples
Samples
Figure 10
Figure 10shows
showsthe
shows theNyquist
the Nyquistcurves
Nyquist curves
curves ofof G2
of G2
G2samples
samples
samples exposed
exposed
exposed to different
to
to different
differentleaching
leaching
leachingdurations. It can
durations.
durations. ItIt
be
can found
can be that
be found
found thatthe diameters
that the
the diameters of
diameters ofthe semi-circles
of the
the semi-circles of
semi-circles of the Nyquist
of the
the Nyquist curves
Nyquist curves decreased
curves decreased with
decreased with the
with the increase
the increaseof
increase
leaching
of leaching duration.
duration. According
According to Long
to et
Long al.
et[26],
al. the
[26], diameters
the of
diameters the semi-circle
of
of leaching duration. According to Long et al. [26], the diameters of the semi-circle of the Nyquist the of
semi-circle the Nyquist
of the curves
Nyquist
are
curvesproportional
are to
proportional the density
to the degree
density of pore
degree structure
of pore of the
structure composites.
of the
curves are proportional to the density degree of pore structure of the composites. Thus, the decrease Thus,
composites. the
Thus,decrease
the on the
decrease
diameters
on
on the of
the diametersthe
diameters of semi-circles
of the can
the semi-circlesbe attributed
semi-circles can can be to the
be attributed increment
attributed to to the of the
the increment porosity
increment of of theof leached
the porosity
porosity of composites
of leached
leached
from the
composites dissolution
from the of ettringite
dissolution ofand CH,
ettringite andand the decalcification
CH, and the of C-S-H.
decalcification
composites from the dissolution of ettringite and CH, and the decalcification of C-S-H. In particular, In
of particular,
C-S-H. In there was
particular,
athere
sudden
there was areduction
was a sudden on the diameter
sudden reduction
reduction on
on the of the semi-circle
the diameter
diameter of
of the of the Nyquist
the semi-circle
semi-circle of
of the curve curve
the Nyquist
Nyquist for G2for
curve samples
for G2 after
G2 samples
samples
leaching
after for
after leaching 7
leaching fordays, when
for 77 days, compared
days, when to
when compared before
compared to leaching.
to before Combined
before leaching. with
leaching. Combined the
Combined with results from
with the macroscopic
the results
results from
from
characterizations,
macroscopic this phenomenon
characterizations, this can be
phenomenon explained can beby the evolution
explained
macroscopic characterizations, this phenomenon can be explained by the evolution of concentrationby of
the concentration
evolution of gradients of
concentration
Ca 2+ ions, and 2+
gradients
gradients of
ofCaCathe appearance
2+ions,
ions, and
andthe of additional
theappearance
appearance ofcapillary
of additional
additional pores at early
capillary
capillary poresage.at
pores atIn addition,
early
early age.
age.In Insame trends
addition,
addition, can
same
same
be found
trends
trends can
caninbethe
be Nyquist
found
found in
in thecurves
the of R0,
Nyquist
Nyquist G1, G3,
curves
curves of andG1,
of R0,
R0, G4,G3,
G1, as and
G3, shown G4,inas
and G4, asFigure
shown
shown S1.
inin Figure
Figure S1. S1.
Figure
Figure 10.
Figure 10. The
10. TheNyquist
The Nyquist curves
Nyquist curves of
curves of G2
of G2samples
G2 samplesundergoing
samples undergoing different
undergoing different leaching
different leachingdurations.
durations.
3.3.3. Effect
3.3.3. Effect of GOGO Addition on on the Nyquist
Nyquist Curve of of Leached Samples
Samples
3.3.3. Effect ofof GO Addition
Addition on the the Nyquist Curve
Curve of Leached
Leached Samples
To investigate
To the effect
effect of GO addition onon calcium leaching
leaching of cement
cement composites, the the Nyquist
To investigate
investigate the the effect of
of GO
GO addition
addition on calcium
calcium leaching of of cement composites,
composites, the Nyquist
Nyquist
curves
curves of R0, G2, and G4 before and after leaching for 28 days are shown in Figure 11. As can bebe seen
curves of of R0,
R0, G2,
G2, and
and G4G4 before
before and
and after
after leaching
leaching for
for 28
28 days
days are
are shown
shown in in Figure
Figure 11.
11. As
As can
can be seen
seen
from the
from the figure, the the diameters of of the semi-circle
semi-circle of the
the Nyquist curves
curves of the
the samples decreased
decreased after
from the figure,
figure, the diameters
diameters of thethe semi-circle ofof the Nyquist
Nyquist curves of of the samples
samples decreased after after
leaching for
leaching 28 days, when compared to before leaching. Furthermore, the diameters of the semi-circle
leaching for for 28
28 days,
days, when
when compared
compared to to before
before leaching.
leaching. Furthermore,
Furthermore, the the diameters
diameters of of the
the semi-
semi-
of the
circle Nyquist curves of the leached samples with GO addition decreased less than that of the samples
circle of the Nyquist curves of the leached samples with GO addition decreased less than that of
of the Nyquist curves of the leached samples with GO addition decreased less than that of the
the
samples without GO addition. This phenomenon became more obvious in
samples without GO addition. This phenomenon became more obvious in the case of the higher GO the case of the higher GO
content.
content. These
These results
results show
show that
that GOGO addition
addition can
can effectively
effectively inhibit
inhibit the
the impedance
impedance loss loss of
of leached
leached
composites. According to previous literature [16,44,45], GO can be agglomerate
composites. According to previous literature [16,44,45], GO can be agglomerate in Ca(OH)22 solution in Ca(OH) solution
due
dueto tothe
thereaction
reactionbetween
betweenthe thefunctional
functionaloxygen
oxygengroups
groupswithwithCa
Ca2+ions.
2+
ions.ItItsuggests
suggeststhat
thatGOGOaddition
addition
can absorb Ca 2+ ions in cement pore solution via its functional oxygen groups, therefore mitigating
can absorb Ca ions in cement pore solution via its functional oxygen groups, therefore mitigating
2+Nanomaterials 2019, 9, 288 12 of 19
without GO addition. This phenomenon became more obvious in the case of the higher GO content.
These results show that GO addition can effectively inhibit the impedance loss of leached composites.
According to previous
Nanomaterials 2019, literature
9, x FOR PEER REVIEW[16,44,45], GO can be agglomerate in Ca(OH)2 solution due12toofthe 19
reaction between the functional oxygen groups with Ca2+ ions. It suggests that GO addition can
absorb Ca 2+ ions in cement pore solution via its functional oxygen groups, therefore mitigating calcium
calcium leaching of cement composites. In addition, the diameters of the semi-circle of the Nyquist
leaching
curve of of
thecement
unleachedcomposites. In addition,
samples increasedthe diameters
with the GOofcontents.
the semi-circle
This isofdue
the Nyquist curve
to the fact thatofGO
the
unleached samples increased with the GO contents. This is due to the fact that
addition promoted the cement hydration, therefore forming a denser microstructure. More GO addition promoted
the cement hydration,
information about the therefore formingofathe
Nyquist curves denser microstructure.
samples after leachingMore
forinformation
0, 7, 14, 21, about the
28, and 35Nyquist
days is
curves of
shown in the samples
Figure S2. after leaching for 0, 7, 14, 21, 28, and 35 days is shown in Figure S2.
The Nyquist
Figure 11. The
Figure Nyquist curves
curves of
of R0, G2, and G4 before leaching and after leaching for 28 days.
3.3.4. Model Impedance RCCP Analysis and its Fitting Results
3.3.4. Model Impedance RCCP Analysis and its Fitting Results
The values of the model impedance RCCP from the equivalent circuit model (Qmat (QDP RCP )
The values of the model impedance RCCP from the equivalent circuit model (Qmat (QDP RCP) RCCP)
RCCP ) (QL RL ) at different leaching durations are listed in Table 5. It can be clearly seen that the value
(QL RL) at different leaching durations are listed in Table 5. It can be clearly seen that the value of RCCP
of RCCP decreased with increase of leaching duration. Moreover, the loss percentages of RCCP in R0, G1,
decreased with increase of leaching duration. Moreover, the loss percentages of RCCP in R0, G1, G2,
G2, G3, and G4 were 94.85%, 84.07%, 79.66%, 75.34%, and 68.75%, respectively. In particular, the loss
G3, and G4 were 94.85%, 84.07%, 79.66%, 75.34%, and 68.75%, respectively. In particular, the loss
percentage of R in R0 was almost 1.4 times than that in G4. These results quantitatively indicate
percentage of RCCP CCP in R0 was almost 1.4 times than that in G4. These results quantitatively indicate
that GO addition can inhibit calcium leaching of cement composites.
that GO addition can inhibit calcium leaching of cement composites.
In theory, the impedance values of the leached GO/cement composites can be used not only to
Table 5. Fitting results of RCCP based on the modified model (Qmat (QDP RCP ) RCCP ) (QL RL ) for the
reveal the inhibiting effect of GO on calcium leaching, but also to reflect the performance changes of
leached samples at different leaching durations (Ohms).
the composites. Figure 12(a) and 12(b) show the predictions of leaching depth and compressive
strength loss of G2
Leaching during(day)
Duration leaching for
R0 28 days,G1 respectively.G2 Predictions G3 of leachingG4 depth and
compressive strength 0 loss of R0, G1, G3,
970and G4 are given in Figure
1287 1421 S3. The1545 correlation1843
coefficient (R),
7
determination coefficients 320
(R2), and probability 556 (P-value)
value 660of the fitting
801 curves are
1012provided in
the figures, while the 14equations of the 255
fitting curves421are shown500 in the figure625caption. It883
can be clearly
21 182 289 401 481 710
seen from R2 that the 28
curves were highly
143
correlated
255
with the measurement
343 440
points. In addition, the
635
prediction of compressive
35 strength loss50is more accurate
205 than 289
that of leaching
381 depth. 576Tables 6 and 7
summarize the measured results and the predicted results of leaching depth and compressive
strength loss in all samples at leaching for 35 days. In particular, the maximum variation was only
In theory, the impedance values of the leached GO/cement composites can be used not only to
12.80%. Therefore, the application of EIS method for monitoring the leached infrastructure with GO
reveal the inhibiting effect of GO on calcium leaching, but also to reflect the performance changes
addition is reliable.
of the composites. Figure 12a,b show the predictions of leaching depth and compressive strength
loss of G2 during leaching for 28 days, respectively. Predictions of leaching depth and compressive
Table 5. Fitting results of RCCP based on the modified model (Qmat (QDP RCP) RCCP) (QL RL) for the
strength loss of R0, G1, G3, and G4 are given in Figure S3. The correlation coefficient (R), determination
leached samples at different leaching durations (Ohms).
coefficients (R2 ), and probability value (p-value) of the fitting curves are provided in the figures, while
Leaching
the equations of theduration (day) are shown inR0the figure
fitting curves G1caption. It G2can be clearly
G3 seen from G4 R2
that the curves were highly 0 correlated with the970measurement1287 points.1421In addition,1545 1843 of
the prediction
compressive strength7loss is more accurate than 320 556
that of leaching 660 Tables 6801
depth. 1012
and 7 summarize
14 255 421 500 625 883
21 182 289 401 481 710
28 143 255 343 440 635
35 50 205 289 381 576You can also read