PHOTOCATALYTIC AND ELECTROCATALYTIC PROPERTIES OF CU-LOADED ZIF-67-DERIVATIZED BEAN SPROUT-LIKE CO-TIO2/TI NANOSTRUCTURES - MDPI
←
→
Page content transcription
If your browser does not render page correctly, please read the page content below
nanomaterials

Article
Photocatalytic and Electrocatalytic Properties of Cu-Loaded
ZIF-67-Derivatized Bean Sprout-Like Co-TiO2/Ti Nanostructures
Hye Ji Jang 1,2 , So Jeong Park 1 , Ju Hyun Yang 1,2 , Sung-Min Hong 1,2 , Choong Kyun Rhee 1
and Youngku Sohn 1,2, *

                                          1   Department of Chemistry, Chungnam National University, Daejeon 34134, Korea;
                                              gpwldndud@naver.com (H.J.J.); jsjs5921@naver.com (S.J.P.); mil03076@naver.com (J.H.Y.);
                                              qwqe212@naver.com (S.-M.H.); ckrhee@cnu.ac.kr (C.K.R.)
                                          2   Department of Chemical Engineering and Applied Chemistry, Chungnam National University,
                                              Daejeon 34134, Korea
                                          *   Correspondence: youngkusohn@cnu.ac.kr; Tel.: +82-(42)-8216548

                                          Abstract: ZIF-derivatized catalysts have shown high potential in catalysis. Herein, bean sprout-like
                                          Co-TiO2 /Ti nanostructures were first synthesized by thermal treatment at 800 ◦ C under Ar-flow
                                          conditions using sacrificial ZIF-67 templated on Ti sheets. It was observed that ZIF-67 on Ti sheets
                                          started to thermally decompose at around 350 ◦ C and was converted to the cubic phase Co3 O4 . The
                                          head of the bean sprout structure was observed to be Co3 O4 , while the stem showed a crystal structure
                                          of rutile TiO2 grown from the metallic Ti support. Cu sputter-deposited Co-TiO2 /Ti nanostructures
                                          were also prepared for photocatalytic and electrocatalytic CO2 reduction performances, as well
                                          as electrochemical oxygen reaction (OER). Gas chromatography results after photocatalytic CO2

                                   reduction showed that CH3 OH, CO and CH4 were produced as major products with the highest
Citation: Jang, H.J.; Park, S.J.; Yang,
                                          MeOH selectivity of 64% and minor C2 compounds of C2 H2 , C2 H4 and C2 H6 . For electrocatalytic
J.H.; Hong, S.-M.; Rhee, C.K.; Sohn, Y.   CO2 reduction, CO, CH4 and C2 H4 were meaningfully detected, but H2 was dominantly produced.
Photocatalytic and Electrocatalytic       The amounts were observed to be dependent on the Cu deposition amount. Electrochemical OER
Properties of Cu-Loaded                   performances in 0.1 M KOH electrolyte exhibited onset overpotentials of 330–430 mV (vs. RHE)
ZIF-67-Derivatized Bean Sprout-Like       and Tafel slopes of 117–134 mV/dec that were dependent on Cu-loading thickness. The present
Co-TiO2 /Ti Nanostructures.               unique results provide useful information for synthesis of bean sprout-like Co-TiO2 /Ti hybrid
Nanomaterials 2021, 11, 1904. https://    nanostructures and their applications to CO2 reduction and electrochemical water splitting in energy
doi.org/10.3390/nano11081904              and environmental fields.

Academic Editor: Giuseppe Marcì
                                          Keywords: ZIF-67; Co-TiO2 /Ti; photocatalytic CO2 reduction; electrocatalytic CO2 reduction; oxygen
                                          evolution reaction; water splitting
Received: 5 July 2021
Accepted: 22 July 2021
Published: 24 July 2021

                                          1. Introduction
Publisher’s Note: MDPI stays neutral
with regard to jurisdictional claims in        Metal–organic frameworks (MOFs) including other materials have been extensively
published maps and institutional affil-   employed in diverse application areas such as environments, adsorbents, organic light emit-
iations.                                  ting displays, sensors and catalysts [1–10]. Among diverse MOFs, the zeolitic imidazolate
                                          framework (ZIF) exhibits zeolite-like topologies where imidazolate linkers are connected
                                          with tetrahedrally coordinated transition metal ions such as Co and Zn [1–27]. In this
                                          ZIF-class, ZIF-67 has Co-N tetrahedral coordination commonly synthesized with Co(II) pre-
Copyright: © 2021 by the authors.         cursor and 2-methylimidazole [5–10]. Many catalyst materials have been synthesized using
Licensee MDPI, Basel, Switzerland.        ZIF-67 and examined in diverse areas of hydrogen evolution reaction (HER), oxygen evolu-
This article is an open access article    tion reaction (OER), oxygen reduction reaction (ORR), CO2 hydrogenation reaction, energy
distributed under the terms and           storage and toluene oxidation [11–20]. For a synthetic strategy of Co3 O4 @TiO2 composite,
conditions of the Creative Commons        thermal decomposition of ZIF-67 followed by the liquid-phase deposition method was
Attribution (CC BY) license (https://     introduced [11]. The catalyst showed an overpotential of 269 mV at 10 mA cm−2 and a Tafel
creativecommons.org/licenses/by/          slope of 106 mV/dec for OER test in 2 M KOH electrolyte, and an overpotential of 153 mV
4.0/).

Nanomaterials 2021, 11, 1904. https://doi.org/10.3390/nano11081904                                 https://www.mdpi.com/journal/nanomaterials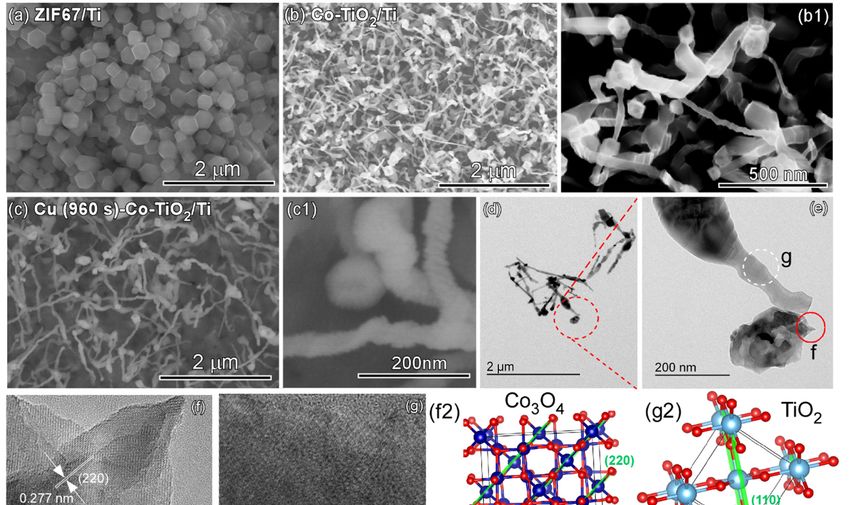
Nanomaterials 2021, 11, 1904                                                                                        2 of 19

                               and a Tafel slope of 81 mV/dec in HER test, respectively. Salahuddin et al. prepared nano-
                               porous carbon by thermal treatment of ZIF-67, hybridized with MnO2 , and demonstrated
                               ORR experiments for fuel cell applications [12]. Amorphous intermediate and crystalline
                               Co3 O4 was synthesized by thermal treatment of ZIF-67 [13], and the amorphous sample
                               showed an OER onset potential of 1.4 V (vs. reference hydrogen electrode, RHE), lower
                               than that (1.52 V) of a crystalline sample. For MXene-supported CoNi-ZIF-67 catalysts by
                               the coprecipitation method, the OER test showed an onset overpotential of 275 mV (vs.
                               RHE) and a Tafel slope of 65.1 mV/dec [15]. B-Co3 O4 @ZIF-67 nanocages were synthesized
                               by the hydrothermal method using a sacrificial template, and showed an overpotential of
                               334 mV at a current density of 10 mA cm−2 and a Tafel slope of 73.88 mV for OER [18].
                               Another work introduced bimetallic ZIF-8 and ZIF-67 to synthesize Ru-decorated Co/N-
                               codoped porous carbon catalysts, and the HER performance showed an overpotential of
                               30 mV at 10 mA cm−2 and a Tafel slope of 32.1 mV/dec. The stability was claimed to
                               be superior than a commercial 20 wt% Pt/C [20]. A MOF-derivatized Z-scheme catalyst
                               of Fe2 O3 @Ag–ZnO@C was also introduced to photodegrade tetracyclin and methylene
                               blue in wastewater [21]. The developed catalyst showed high light absorption and charge
                               transfer efficiency for higher photocatalytic performance. For an application area of CO2
                               reduction [25–27], CdS/ZIF-67 nanocomposites were synthesized by a simple wet reaction
                               method and tested for photocatalytic CO2 reduction reaction under a 300 W Xe lamp (with
                               420 nm cut-off filter) [23]. The catalysts showed CO and H2 as the main products, with
                               184 µmol g−1 ·h−1 and 1098 µmol g−1 h−1 , respectively, and a CO selectivity of 5–45%.
                                    As discussed in the literature, many strategies have been employed and the consequent
                               materials have been tested in various application areas [1–27]. Motivated by this, we
                               seek to further widen the synthesis of ZIP-derivatized catalyst materials and examine
                               new physicochemical properties of a newly synthesized material. Thus, we prepared
                               bean sprout-like Co-TiO2 /Ti nanostructures by the thermal treatment of ZIF-67/Ti hybrid
                               structure and demonstrated diverse catalytic applications of photocatalytic CO2 reduction,
                               electrochemical CO2 reduction and electrochemical oxygen evolution reaction. Although
                               ZIF-derivatized catalyst have been extensively studied for water splitting, few studies
                               have been reported related to CO2 reduction [25–27]. Therefore, the present study shows
                               some data sets for catalytic performances on CO2 reduction. ZIP-67 was chosen because
                               Co is in the structure, and consequent Co oxide-based catalysts have potentially high
                               applicability to water splitting reactions [28]. Cu and Ti were chosen because they have
                               been extensively used as substituent materials and catalyst supports in photocatalysis and
                               electrocatalysis [28–32]. Therefore, the present results provide a useful strategy for the
                               design of new catalyst materials with high efficiency for energy and environment fields via
                               CO2 reduction and water splitting.

                               2. Materials and Methods
                               2.1. Preparation of ZIF-67/Ti and Co-TiO2 /Ti Catalysts
                                    Chemicals were Co(NO3 )2 ·6H2 O (97.0%, Samchun Pure Chem., Kyoungki, Korea),
                               2-methylimidazole (99%, Sigma-Aldrich, Saint Louis, MO, USA) and methanol (MeOH,
                               99.9%, Samchun Pure Chem., Kyoungki, Korea). For the preparation of ZIF-67/Ti, a Ti sheet
                               was roughened by sandpaper followed by sonication in deionized water for 30 min, and
                               then dipped in 1% HNO3 solution for 1 min. After that, the sheet was finally washed with
                               deionized water and dried under an infrared (IR) lamp. For the preparation of ZIF-67/Ti, a
                               solution of Co(NO3 )2 ·6H2 O (2mmol) in 40 mL MeOH and a solution of 2-methylimidazole
                               (20 mmol) in 40 mL MeOH were fully mixed, and then the cleaned Ti sheet was dipped
                               in the mixed solution for 16 h to load ZIF-67. The consequent ZIF-67/Ti was then gently
                               washed with MeOH and dried under an IR lamp. After that, the as-prepared ZIF-67/Ti
                               sheet was placed in a tube furnace with Ar gas (99.999%) flow (80 mL/min). The furnace
                               temperature was then increased to 800 ◦ C with a ramp rate of 23 ◦ C/min, and once the
                               temperature reached 800 ◦ C, the power was turned off, and we let the furnace naturally
                               cool to room temperature. Finally, we obtained Co-TiO2 /Ti nanostructures. Cu deposition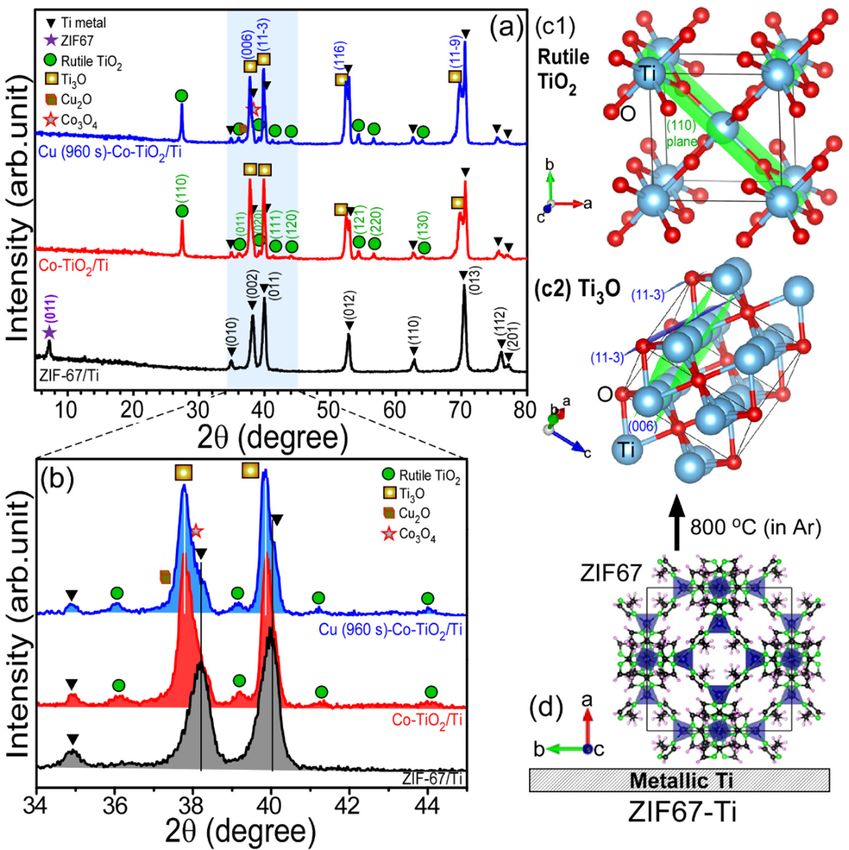
Nanomaterials 2021, 11, 1904                                                                                           3 of 19

                               on the nanostructures was performed using a SPT-20 ion sputter coater (COXEM Co.,
                               Daejeon, Korea) at an ionization current of 3 mA for 10 s, 30 s, 60 s, 120 s, 240 s, 480 s and
                               960 s, respectively.

                               2.2. Characterisation of the Catalyst Samples
                                     The crystal phases of the materials formed on Ti sheets were examined using a Mini-
                               Flex II X-ray diffractometer (Rigaku Corp., Tokyo, Japan) with a Cu Kα radiation source
                               (CNU Chemistry Core Facility). A VESTA software (ver. 3.5.7, free downloaded at
                               https://jp-minerals.org/vesta/en/download.html, accessed on 30 April 2021) was em-
                               ployed for crystal structure building and facet visualization [33]. A FEI Tecnai G2 F30
                               S-TWIN TEM (FEI-Philips, Hillsboro, OR, USA) at 300 kV was used to obtain high resolu-
                               tion transmission electron microscope (HR-TEM) images. The morphologies of the samples
                               were all examined using a S-4800 (Hitachi Ltd., Tokyo, Japan) scanning electron microscope
                               (SEM) at an acceleration voltage of 10.0 keV. Energy-dispersive X-ray spectroscopy (EDXS)
                               was employed to examine elemental compositions and mapping images using a SEM
                               (Merlin Compact, Carl Zeiss, Germany), coupled with an AZtec Energy X-MaxN EDXS
                               (OXFORD, Oxford, UK). A LabRAM HR-800 UV-Visible-NIR Raman spectrometer (Horiba
                               Jobin Yvon Kyoto, Japan) was used to take Raman spectra with a laser wavelength of
                               514 nm and a 100× objective, and the monochromator grating of 1800. X-ray photoelectron
                               spectra (XPS) were obtained using a K-alpha+ XPS spectrometer (Thermo-VG Scientific,
                               Waltham, MA, USA) with a hemispherical energy analyzer and a monochromated Al
                               Ka X-ray (E = 1486.6 eV) source. Temperature-programmed reaction spectrometry was
                               performed using a QGA quadrupole mass gas analyzer (Hiden Analytical Inc., Warrington,
                               United Kingdom). A ZIF-67/Ti (5 mm × 30 mm) sample was loaded in a U-tube quartz
                               reactor and heated at a temperature heating rate of 20 ◦ C/min under N2 gas (99.999%)
                               flow (80 mL/min). The gas products with temperature were real-time monitored using the
                               QGA analyzer.

                               2.3. Photocatalytic and Electrocatalytic CO2 Reduction Experiments
                                     Photocatalytic CO2 reduction tests were performed in a closed stainless-steel chamber
                               (volume ~40 mL) with a quartz window. A bare (or Cu-deposited) Co-TiO2 /Ti disc (a
                               diameter of 47 mm) was placed inside the chamber. Before being closed, the chamber was
                               flushed and filled with pure CO2 gas (99.999%) with 60 µL deionized water inside the
                               chamber. For CO2 reduction test, the sample was placed under UVC light (200–280 nm, a
                               power density of 5.94 mW/cm2 ) through the window for 6 h.
                                     For electrochemical CO2 reduction experiment, a three-electrode connection system
                               was used with a Pt counter electrode, a Ag/AgCl (3.0 M KCl) reference electrode and a
                               Co-TiO2 /Ti electrode (5 mm × 30 mm) working electrode. The electrochemical workstation
                               was a WPG100 Potentiostat/Galvanostat (WonATech Co., Ltd., Seoul, Korea). We used an
                               air-tight closed glass cell (100 mL) with 50 mL 0.1 M NaHCO3 electrolyte. Amperometry
                               was performed at a potential of −1.8 V (vs. Ag/AgCl) for 3 h.
                                     After the amperometry (or the photocatalytic reaction under UVC condition for
                               6 h), 0.5 mL volume of gas from the air-tight closed electrochemical cell (or the closed
                               stainless-steel chamber) was taken and injected into a YL 6500 gas chromatography (GC)
                               system (Young In Chromass Co., Ltd., Seoul, Korea) for the analysis of CO2 reduction gas
                               products. The GC system was equipped with a Ni catalyst methanizer assembly, a thermal
                               conductivity detector (TCD), a flame ionization detector (FID), two different columns of
                               40/60 Carboxen-1000 (Sigma-Aldrich, St. Louis, MO, USA) and HP-PlotQ-PT (Agilent
                               Technologies, Inc., Santa Clara, CA, USA).
                                     Electrochemical oxygen evolution reaction (OER) tests were also performed using
                               a three-electrode system (a Pt counter electrode, a Hg/HgO reference electrode and a
                               Co-TiO2 /Ti electrode working electrode). The electrochemical workstation was a WizECM-
                               1200 Premium potentiostat/galvanostat (WizMAC, Daejeon, Korea). Linear sweep voltam-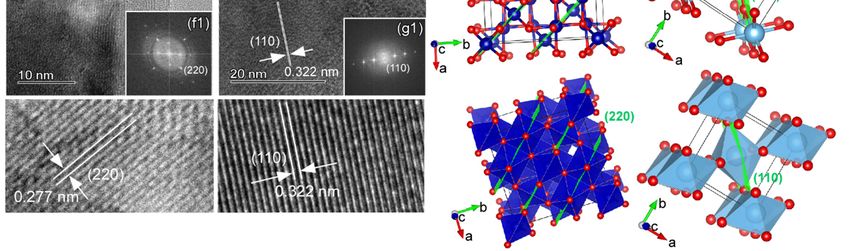
Nanomaterials 2021, 11, x FOR PEER REVIEW 4 of 20
Nanomaterials 2021, 11, 1904 4 of 19
Electrochemical oxygen evolution reaction (OER) tests were also performed using a
three-electrode system (a Pt counter electrode, a Hg/HgO reference electrode and a Co-
TiO2/Ti electrode working electrode). The electrochemical workstation was a WizECM-
1200 Premium
metry (LSV) waspotentiostat/galvanostat
carried out at a scan rate(WizMAC,
of 20 mV/sDaejeon,
in 0.1 M Korea). Linear sweep
KOH electrolyte volt-
(a volume
ammetry
of 50 mL),(LSV)
with awas carriedrange
potential out at a scan
from rateVofto20
−0.05 mV/s
+1.5 V. in 0.1 M KOH electrolyte (a vol-
ume of 50 mL), with a potential range from −0.05 V to +1.5 V.
3. Results and Discussion
3. Results
Figureand Discussion
1a shows the sample preparation method and photos of the samples at each
stage.Figure
The polished
1a showsTithe sheet appeared
sample bright gray
preparation methodandandbecame
photosviolet
of theupon loading
samples ZiF-
at each
67. Upon
stage. Thethermal
polishedtreatment at 800 ◦ C,bright
Ti sheet appeared the color
grayfinally became
and became uniform
violet uponblue-gray. This
loading ZiF-67.
indicates that surface
Upon thermal treatmentmorphology andcolor
at 800 °C, the crystal phase
finally became
became changed
uniform after theThis
blue-gray. thermal
indi-
treatment. Figure 1b displays temperature-programmed reaction
cates that surface morphology and crystal phase became changed after the thermal (TPR) profiles fortreat-
the
as-prepared ZIF-67 on Ti sheet to examine thermal decomposition of
ment. Figure 1b displays temperature-programmed reaction (TPR) profiles for the as-pre-the ZIF-67 on the
Ti surface. It was observed that TPR signal of
pared ZIF-67 on Ti sheet to examine thermal decompositionCO 2 (mass = 44 amu) started to increase
of the ZIF-67 on the Ti surface.
at around
It was 350 ◦ C,that
observed maximize at 490
TPR signal
◦ C and return to the background signal above 510 ◦ C.
of CO 2 (mass = 44 amu) started to increase at around 350
This indicates that
°C, maximize ZIF-67
at 490 °C anddecomposed
return to theat around 490 ◦ C.
background Thisabove
signal result 510
is consistent with the
°C. This indicates
literature [34].
that ZIF-67 decomposed at around 490 °C. This result is consistent with the literature [34].
Figure 1. Schematic of a reaction setup and photos
Figure 1. photos of the
the samples
samples at
at each
each stage
stage (a);
(a); temperature-
temperature-
programmed
programmed reaction profiles (b) of H22,,CO
CO22and
andCH
CH4 4for
forZIF-67/Ti
ZIF-67/Ti sheet;
sheet; and
and SEMSEM images
images (c) (c) of
of as-
prepared ZIF-67/Ti
as-prepared andand
ZIF-67/Ti after thermal
after treatments
thermal of 550
treatments °C ◦and
of 550 °C,◦respectively.
800800
C and C, respectively.
The TPR signal (Figure 1b) of H2 (mass = 2 amu) started to increase at 700 ◦ C, which
was attributed to the association of adsorbed H, followed by H2 release. The CH4 signal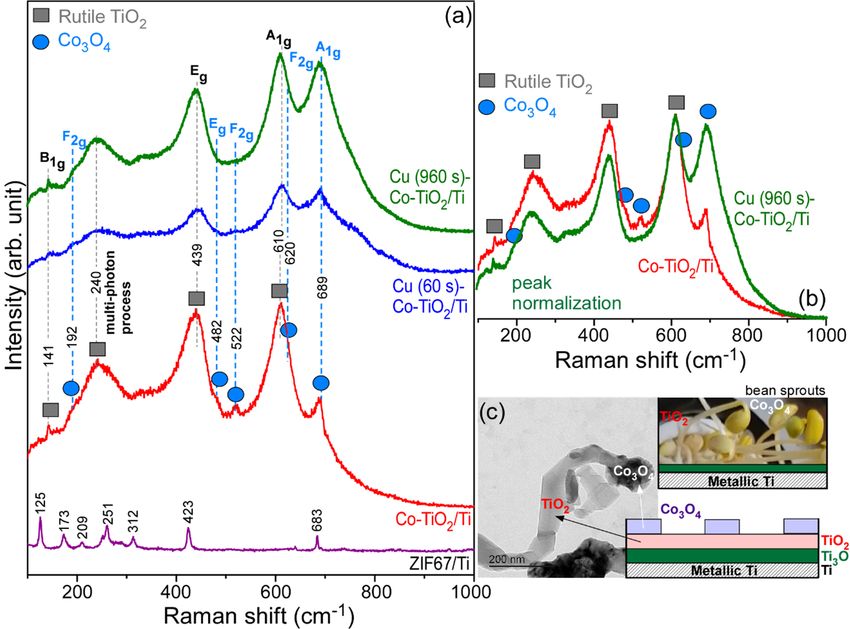
Nanomaterials 2021, 11, 1904 5 of 19
showed no critical change. The corresponding SEM images (Figure 1c) at each stage (as-
prepared, 550 ◦ C and 800 ◦ C conditions) clearly showed different morphologies. For the
SEM image of the as-prepared ZIF-67/Ti, the morphology appeared to be polyhedron
shape with sizes of 30–40 nm. This is consistent with the literature regarding ZIF-67 [15].
After thermal treatment up to 550 ◦ C, ZIF-67 became shrunken and hollow, which was
attributed to the thermal decomposition at 490 ◦ C, as discussed above. Interestingly, the
morphology drastically changed after thermal treatment up to 800 ◦ C. The corresponding
SEM image appeared as bean sprouts with head and stem. The head appeared to be grown
from the surface of Ti surface. This is further discussed below.
Three samples of ZIF-67/Ti, Co-TiO2 /Ti, Cu(960 s)-Co-TiO2 /Ti were selected, and
their XRD profiles were obtained and displayed in Figure 2. For the XRD patterns of a
ZiF-67 loaded Ti sheet, several major peaks were observed at 2 θ = 35.2◦ , 38.5◦ , 40.2◦ , 53.1◦ ,
63.1◦ and 70.8◦ , assigned to the (010), (002), (011), (012), (110) and (013) planes of hexagonal
metallic Ti (ICSD ref. # 98-004-3614), respectively. These speaks were commonly observed
for all the samples attributed to metallic Ti support. A sharp peak around 2 θ = 8.5◦ was
attributed to the crystal phase of ZIF-67 [13–15]. For the XRD patterns of Co-TiO2 /Ti
sample, several peaks newly appeared at 2 θ = 27.4◦ , 36.0◦ , 39.1◦ , 41.2◦ , 44.0◦ , 54.2◦ , 56.5◦
and 63.9◦ , and were assigned to the (110), (011), (020), (111), (120), (121), (220) and (130)
crystal planes of tetragonal rutile TiO2 (ICSD ref. # 98-003-3838), respectively. Other strong
peaks were observed at 2 θ = 29.1◦ , 39.8◦ , 52.3◦ and 69.5◦ , and matched the crystal plans
of (006), (11-3), (116) and (11-9) for hexagonal Ti3 O (ICSD ref. # 98-003-6055), respectively.
The expanded XRD profiles between 2 θ = 34◦ and 45◦ clearly show that metallic Ti and
hexagonal Ti3 O coexist in the thermal (800 ◦ C)-treated samples [35]. The XRD patterns of
Co and Cu oxides were hardly seen in the XRD profiles. This is further discussed below.
Figure 3 shows the SEM images of the as-prepared ZIF-67/Ti (Figure 3a) and Co-
TiO2 /Ti (Figure 3(b,b1)) and Cu (960 s)-Co-TiO2 /Ti (Figure 3(c,c1)) samples. As discussed
above, the polyhedron shape in Figure 3a was due to ZIF-67, and was commonly reported
in the literature [15]. For the SEM image of Co-TiO2 /Ti, the morphology appeared to be
bean sprouts with head and stem. For Cu (960 s)-Co-TiO2 /Ti (Figure 3(c,c1)) samples, the
head and the stem appeared to be fully covered by Cu. For the TEM images of the bean
sprout nanostructures in Figure 3d,e, two regions (f = head and g = stem) were selected
to obtain HRTEM images. For the HRTEM image of the head (Figure 3f), clear lattice
firings were seen with a distance of 0.277 nm. This is in good agreement with the lattice
spacing of the (220) plane of cubic phase Co3 O4 [36]. The corresponding fast-Fourier-
transform (FFT) pattern (Figure 3(f1)) shows high crystallinity of the head. For the HRTEM
image of the stem (Figure 3g), a clear lattice spacing of 0.322 nm was observed, and the
corresponding FFT pattern (Figure 3(g1)) showed high single crystalline nature of the stem.
The lattice spacing was consistent with the (110) plane of tetragonal rutile TiO2 [37], which
was observed by the XRD, discussed above. For visual understating of the crystal phase
and the facet, the crystal structure projections with the crystal planes are displayed in
Figure 3(f2,g2) for Co3 O4 and TiO2 , respectively.
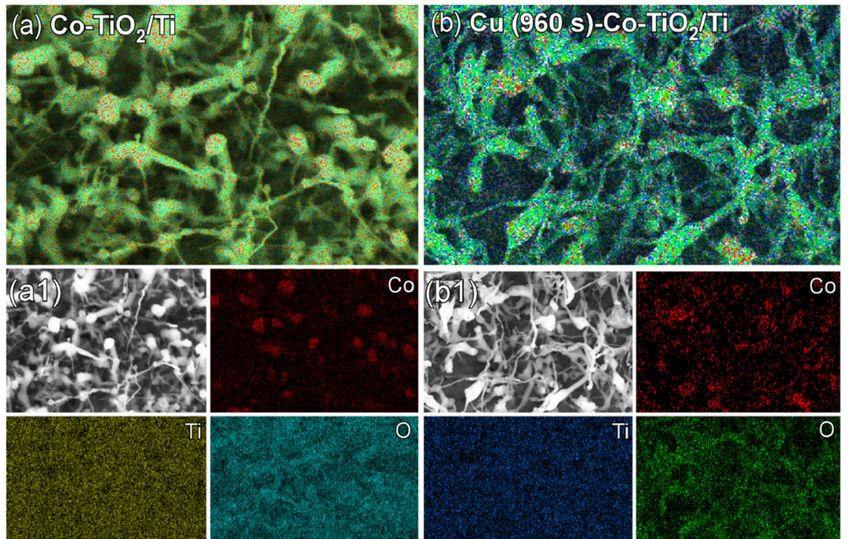
Figure 4 shows layered and single elemental (Co, Ti, O, and Cu) EDXS mapping
images and EDXS profiles of Co-TiO2 /Ti and Cu (960 s)-Co-TiO2 /Ti samples. As discussed
above in the above SEM images (Figure 3(b,b1,c,c1)) and the SEM images in Figure 4(a1,b1),
Co-TiO2 /Ti nanostructures appeared to be bean sprouts with head and stem. To confirm the
chemical elements of the head and stem, elemental EDXS mapping images were obtained.
On the basis of the images, Co EDXS signal was mainly localized on the head, indicating
that the head was mainly due to Co elements while others were mainly due to Ti oxides.
This is in good agreement with the TEM/HRTEM results discussed above. The Co and Ti
oxide were originated from the ZIP-67 and Ti support, respectively. Upon Cu-deposition,
Cu EDXS signal was newly detected. The EDXS profiles (Figure 4(a2,b2)) clearly confirmed
the elements of Ti, Co, surface C and Cu (after Cu-deposition), Ti (0.395, 0.452, 4.511, and
4.932 keV), O (0.525 keV), C (0.277 keV), Co (0.678, 0.694, 0.776, 6.93 and 7.65 keV) and Cu
(0.811, 0.832, 0.93, 8.048 and 8.905 keV) [38]. For the Co-TiO2 /Ti sample, the atomic % ratios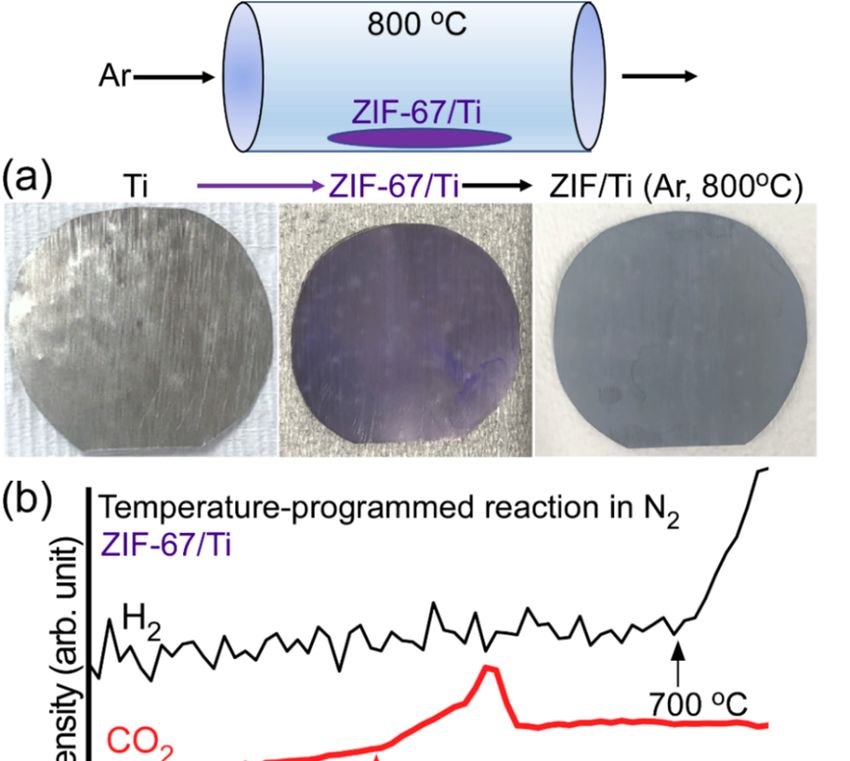
Nanomaterials 2021, 11, 1904 6 of 19
of C, Ti O, and Co were estimated to be 3.7%, 28.9%, 64,8% and 2.6%, respectively. The
Co/Ti ratio (%) was estimated to be 2.6%/28.9% = 9.0/100. For the Cu (960 s)-Co-TiO2 /Ti
Nanomaterials 2021, 11, x FOR PEER REVIEW 6 of 20
sample, the atomic % ratios of C, Ti, O, Co and Cu were estimated to be 2.6%, 35.2%, 58.6%,
2.5% and 1.0%, respectively. The Co/Ti ratio (%) was estimated to be 2.5%/35.2% = 7.1/100.
Figure 2.
Figure 2. XRD
XRDdiffraction
diffractionpatterns
patterns(a)
(a)ofofas-prepared
as-preparedZIF-67/Ti,
ZIF-67/Ti,Co-TiO
Co-TiO 2/Ti, Cu (960 s)-Co-TiO2/Ti
2 /Ti, Cu (960 s)-Co-TiO2 /Ti
samples; expanded
samples; expanded XRD
XRD regions
regions (34–45
(34°–45°) (b);crystal
◦ ) (b); crystalstructure
structureprojections
projectionsofofrutile
rutileTiO
TiO2 (c1);
(c1); and
and
2
Ti 3O (c2); and a cartoon of ZIF67 loaded on Ti support (d).
Ti O (c2); and a cartoon of ZIF67 loaded on Ti support (d).
3
Figure 53displays
Figure shows the the SEM
Raman images
spectra offor
theZIF-67/Ti,
as-prepared ZIF-67/Ti
Co-TiO (Figure 3a) and Co-
2 /Ti, Cu (60 s)-Co-TiO2 /Ti
TiO2Cu
and /Ti (960
(Figure 3(b,b1))2 /Ti
s)-Co-TiO andsamples.
Cu (960 s)-Co-TiO 2/Ti (Figure
For the spectrum 3(c,c1)) samples.
of ZIF-67/Ti, several As discussed
sharp peaks
the polyhedron −
shape in Figure − 3a was due−
were observed at 125 cm , 173 cm , 209 cm , 251 cm , 312 cm , 423 cm 1 and
above, 1 1 1 to ZIF-67, − 1
and was − 1
commonly −
reported
in the
683 −1 . These [15].
cmliterature peaks Forarethe SEM image
attributed of Co-TiO
to ZIF-67 2/Ti, the
commonly morphology
reported in theappeared
literatureto be
[39].
beanthe
For sprouts
Raman with head and
spectrum of astem.
Co-TiOFor2 /Ti
Cu (960
sample,s)-Co-TiO 2/Ti (Figure
very broad 3(c,c1))
and strong samples,
Raman the
peaks
head observed
were and the stem at 270 cm−1 , 439
appeared to be −1 and
cmfully covered
610 cmby −1Cu. For the TEM
, in addition imagesand
to weaker of the bean
sharper
sprout nanostructures
Raman peaks at 141 cmin −1Figure
, 192 cm −1 , 482
3d,e, twocm −1 , 522
regions (fcm −1 , 620
= head andcm g −=1stem)
and 689 were −1 . Three
cmselected to
obtain HRTEM
characteristic images.
Raman Forpeaks
active the HRTEM
at 141 cm −
image 1 of the
, 439 −
cmhead 1 and(Figure − 1
610 cm3f), clear
couldlattice firings
be assigned
were
to theseen
B1g ,with
Eg anda distance
A1g modes of 0.277 nm. This
of rutile TiOis2 ,inrespectively
good agreement with
[40,41]. The thecorresponding
lattice spacing
of theat(220)
peak 240 cm − 1
planeisofdue cubic phase
to the Co3O4 [36]. scattering
multi-phonon The corresponding
process [41].fast-Fourier-transform
In addition to the
(FFT) pattern
Raman peaks of (Figure
TiO2 , 3(f1)) shows
five other high active
Raman crystallinity
peaks were of theobserved
head. Foratthe cm−1 , 482
192HRTEM imagecm−of1,
the stem
522 − 1
cm (Figure − 1
, 620 cm3g),and a clear
689lattice − 1
cm ,spacing
assigned of to
0.322F2g ,nmEg ,was
F2g ,observed,
F2g and Aand the correspond-
1g modes of Co3 O4 ,
ing FFT pattern
respectively (Figure
[42,43]. 3(g1))
On the basisshowed
of the high single
results, it wascrystalline
concluded nature
that of thethe stem.
major wasThe lat-
TiO 2
tice stem)
(the spacing was
and minorconsistent
was Cowith O
3 4 the
(the (110)
head) plane
in the of tetragonal
bean sprout rutile TiO
nanostructures.2 [37], which was
observed by the XRD, discussed above. For visual understating of the crystal phase and
the facet, the crystal structure projections with the crystal planes are displayed in Figure
3(f2,g2) for Co3O4 and TiO2, respectively.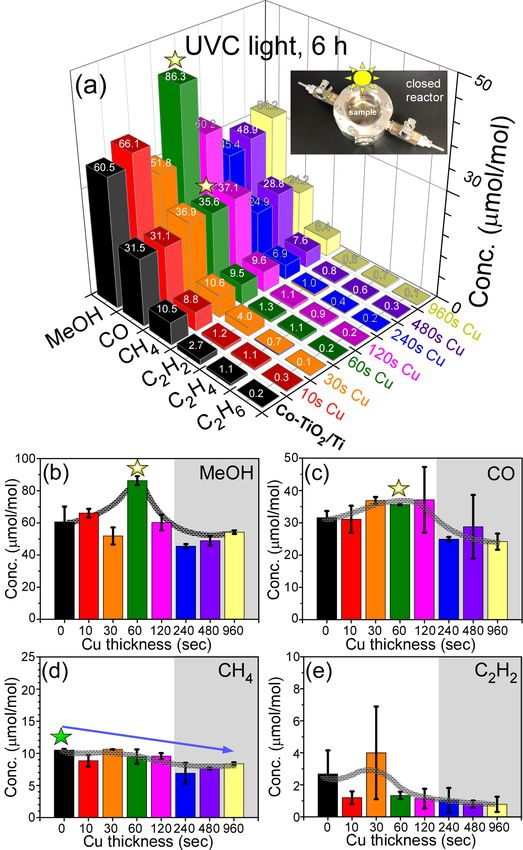
Nanomaterials 2021, 11, 1904 7 of 19
Nanomaterials 2021, 11, x FOR PEER REVIEW 7 of 20
Figure3.3.SEM
Figure SEMimages
imagesofofZIF67-Ti
ZIF67-Ti(a),
(a),Co-TiO
Co-TiO 2/Ti (b,b1), Cu (960 s)-Co-TiO2/Ti (c,c1). TEM (d,e) and HRTEM (f,g) images
2 /Ti (b,b1), Cu (960 s)-Co-TiO2 /Ti (c,c1). TEM (d,e) and HRTEM (f,g) images
of Co-TiO 2/Ti. Insets show the corresponding FFT patterns (f1,g1) and the structure projection (f2,g2) of the (220) and (110)
of Co-TiO2 /Ti. Insets show the corresponding FFT patterns (f1,g1) and the structure projection (f2,g2) of the (220) and (110)
planesfor
planes forCoCo3OO4 (f2) and rutile TiO2 (g2), respectively.
3 4 (f2) and rutile TiO2 (g2), respectively.
FigureCu
Upon 4 shows layered
deposition for and
60 s,single elemental (Co,
no characteristic of Cu Ti,species
O, andwas Cu)observed.
EDXS mappingHowever, im-
ages and EDXS profiles of Co-TiO /Ti− and
1 Cu (960 s)-Co-TiO
interestingly, the A1g mode at 689 cm was substantially increased relative to the other
2 2 /Ti samples. As discussed
above in
Raman the Furthermore,
peaks. above SEM images (Figure 3(b,b1,c,c1))
in the normalized Raman peaks and of the SEM images
ZIF-67/Ti (red line)inand
Figure
Cu
4(a1,b1),
(960 Co-TiO
s)-Co-TiO 2/Ti(green
2 /Ti nanostructures
line) samples appeared
(Figure to 5b),
be bean
the A sprouts
1g mode with head substantially
became and stem. To
confirm the
enhanced chemical
after elementsfor
Cu deposition of 960
the s.head TheandRamanstem,peaks
elemental
for theEDXS mapping
Cu species wereimages
not
were obtained.
clearly detected On the basis
[44,45]. of the images,
As depicted in Figure Co5c,EDXS
it maysignal
appear wasthat
mainly
Ti3 Olocalized
was formed on the
at
head,
the indicating
interface of Ti that
and the
TiOhead
2 , and was
Co mainly
O
3 4 was due
grown to Co
as aelements
head duringwhile others
thermal were mainly
deposition of
due to as
ZIF-67, Ti discussed
oxides. This is in good
in Figure 1b above.agreement with the TEM/HRTEM results discussed
above. The Co
Figure and Ti oxide
6 displays Ti 2pwere originated
(Figure 6a), Co from the ZIP-67
2p (Figure 6b), and
Cu 2p Ti support,
(Figure 6c) respectively.
and O 1s
(Figure 6d) XPS profiles
Upon Cu-deposition, CuforEDXSbare Co-TiO
signal was 2 /Ti newly
and Cudetected.
deposited The(10EDXS
s, 60 sprofiles
and 240(Figure
s) Co-
TiO 2 /Ti samples
4(a2,b2)) before and the
clearly confirmed afterelements
UVC photocatalytic CO2 reduction
of Ti, Co, surface C and Cu tests.
(after The elements of
Cu-deposition),
Ti,
Ti Co, C and
(0.395, O were
0.452, 4.511,commonly
and 4.932observed
keV), O (0.525as expected,
keV), C and the Cu
(0.277 element
keV), was additionally
Co (0.678, 0.694, 0.776,
observed
6.93 and 7.65afterkeV)
Cu and
deposition.
Cu (0.811, On0.832,
the basis
0.93, of theand
8.048 Ti 2p andkeV)
8.905 Co 2p XPS
[38]. Forintensities
the Co-TiOand 2/Ti
sensitivity factors, the Co/Ti XPS ratio was estimated to be
sample, the atomic % ratios of C, Ti O, and Co were estimated to be 3.7%, 28.9%, 64,8%5.3/100 for bare Co-TiO 2 /Ti.
The
andCo/Ti XPS ratio became
2.6%, respectively. 3.7/100
The Co/Ti after(%)
ratio Cuwas
deposition
estimated forto240bes.2.6%/28.9%
As discussed above, the
= 9.0/100. For
decrease
the Cu (960in Co/Ti was 2also
s)-Co-TiO observed
/Ti sample, theinatomic
the EDXS data, of
% ratios which
C, Ti,is O,
consistent
Co and with the XPS
Cu were esti-
data.
matedThis indicates
to be that the
2.6%, 35.2%, head 2.5%
58.6%, of Coand is covered more by Cu The
1.0%, respectively. compared to the(%)
Co/Ti ratio stemwasof es-
Ti.
For to
timated thebeTi2.5%/35.2%
2p XPS profiles of bare Co-TiO2 /Ti (Figure 6a), the Ti 2p3/2 and Ti 2p1/2
= 7.1/100.
peaks were observed at binding energies (BEs) of 457.7 eV and 463.4 eV, respectively, with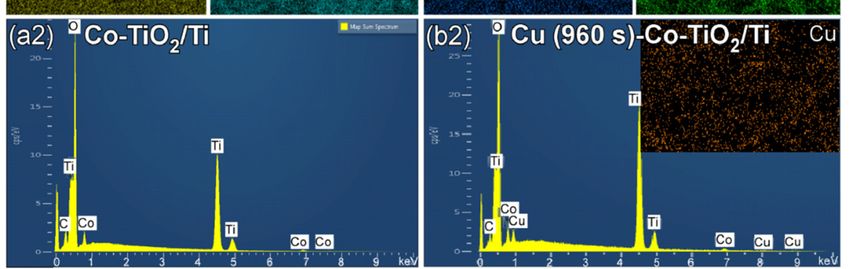
Nanomaterials 2021, 11, 1904 8 of 19
a spin-orbit (S-O) splitting energy of 5.7 eV. These peaks were attributed to Ti(IV) state of
TiO2 [30]. The Ti 2p BE peaks showed no critical change with an increasing Cu deposition
time, but the intensity was somewhat decreased due to overlayer Ti. Furthermore, the
asymmetry of the Ti 2p peak was increased with an increasing Cu deposition (Supplemental
Information, Figure S1a). The Ti 2p XPS signal appeared to increase around 459 eV and
465 eV. The asymmetry of Ti 2p XPS peak could be a change in either chemical state or
physical nature [46].
In Figure 6b, the corresponding Co 2p3/2 and Co 2p1/2 peaks were observed at 779.3 eV
and 794.7 eV, respectively, with an S-O splitting energy of 15.4 eV. These peaks could be
assigned to Co3 O4 , as expected from the HRTEM and Raman spectra. The Co 2p peak
showed no substantial change with increasing Cu deposition time based on the normalized
Nanomaterials 2021, 11, x FOR PEER REVIEW
Co 2p XPS spectra with Cu deposition time (Supplemental Information, Figure S1b), 8 of 20
but
the intensity decreased because of the overlayer Cu.
Figure 4.
Figure 4. Layered (a,b) and
Layered (a,b) and elemental
elemental (Co,
(Co, Ti,
Ti, O
O and
and Cu
Cu (a1,b1))
(a1,b1)) mapping
mapping images
images and
and EDXS
EDXS profiles
profiles
(a2,b2) of Co-TiO2/Ti (a,a1,a2) and Cu (960 s)-Co-TiO2/Ti (b,b1,b2).
(a2,b2) of Co-TiO2 /Ti (a,a1,a2) and Cu (960 s)-Co-TiO2 /Ti (b,b1,b2).
Figure
The 5 displays the
corresponding O 1sRaman
XPS peaksspectra for ZIF-67/Ti,
(Figure 6d) showed Co-TiO 2/Ti, Cu
two broad (60 s)-Co-TiO
peaks 528.8 eV and2/Ti
and Cu
530.7 eV,(960 s)-Co-TiO
attributed 2/Ti samples.
to lattice oxygen For the )spectrum
(Olattice of ZIF-67/Ti,
of metal oxide several
and surface sharpspecies
oxygen peaks
were O
(e.g., observed
ad : OH/H at 2
125
O cm
and −1, 173 cm−1, 209 cm−1, 251 cm−1, 312 cm−1, 423 cm−1 and 683 cm−1.
defects), respectively [30]. With increasing Cu deposition time,
These peaks are attributed to ZIF-67 commonly reported in the
the higher BE peak at 530.7 eV was observed to be enhanced (Supplemental Information, literature [39]. For the Ra-
man spectrum of a Co-TiO /Ti sample, very broad and strong
Figure S1c), which was attributed to increase in surface oxygen species. For the bare
2 Raman peaks were observed
at 270 cm
Co-TiO 2 /Ti, 439
−1 cm−1 the
sample, andXPS610 O cm −1, in addition to weaker and sharper Raman peaks at 141
ad /O lattice ratio was measured to be 17.4%/82.6% and the
cm , 192
−1
ratios cm , 16.0%/84.0%,
became −1 482 cm , 522 cm
−1 −1 , 620 cm−1 and
24.7%/75.2% and689 cm−1. Threeafter
50.5%/49.5% characteristic Raman
Cu deposition foractive
10 s,
peaks
60 s and at 240
141 s,cm −1 , 439 cm and 610 cm could be assigned to the B1g, Eg and A1g modes of
respectively. −1 −1
rutile TiO2, respectively [40,41]. The corresponding peak at 240 cm−1 is due to the multi-
phonon scattering process [41]. In addition to the Raman peaks of TiO2, five other Raman
active peaks were observed at 192 cm−1, 482 cm−1, 522 cm−1, 620 cm−1 and 689 cm−1, assigned
to F2g, Eg, F2g, F2g and A1g modes of Co3O4, respectively [42,43]. On the basis of the results,
it was concluded that the major was TiO2 (the stem) and minor was Co3O4 (the head) in
the bean sprout nanostructures.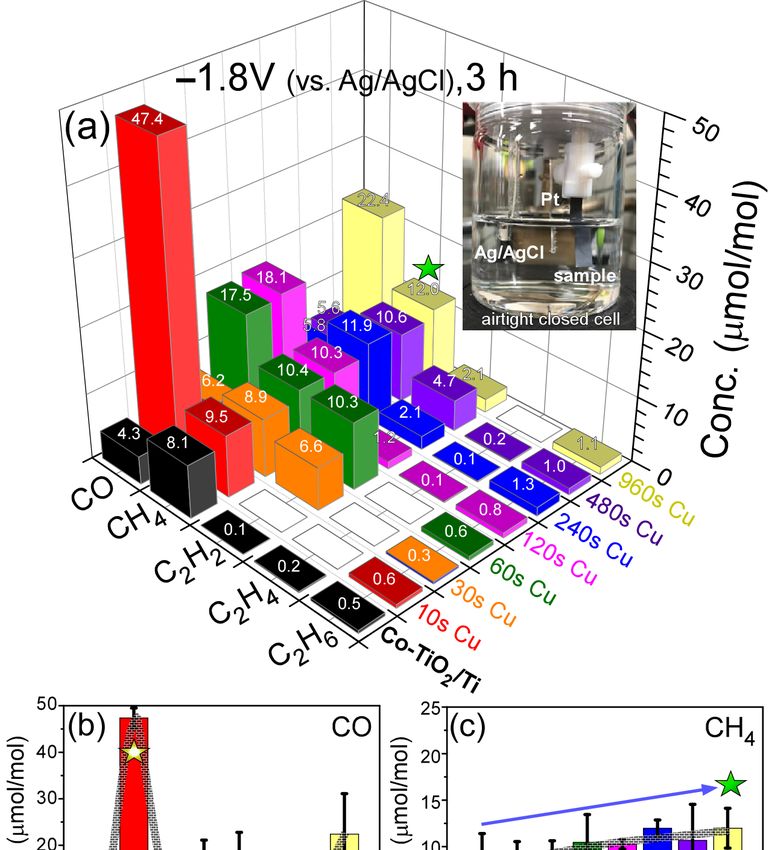
Nanomaterials 2021, 11, 1904 9 of 19
For the Cu 2p XPS profile of Cu-deposited (10 s and 60 s) Co-TiO2 /Ti samples
(Figure 6c), the Cu 2p3/2 and Cu 2p1/2 peaks were commonly observed at 932.0 eV and
256: bbding Stars, Flowers, and Similar Shapes
951.5 Table
eV, respectively, with an S-O splitting energy of 19.5 eV. These peaks could be as-
N P 2
A 8 3
\Asterisk signed to Cu O and/or \FiveFlowerPetal
metallic Cu [46–48]. \JackStar
For the bare Co-TiO2 /Ti sample, no Cu XPS
2
B ; O
\AsteriskBold \FiveStar \JackStarBold
signal was observed, as expected. For the Cu 2p XPS profile of Co-TiO2 /Ti sample after
X ? U
\AsteriskCenterOpen \FiveStarCenterOpen \SixFlowerAlternate
Cu-deposition for 240 s, additional Cu 2p3/2 and Cu 2p1/2 peaks were observed at 933.7 eV
C 7 M
\AsteriskRoundedEnds \FiveStarConvex \SixFlowerAltPetal
and 952.8 eV, respectively, with an S-O splitting energy of 19.1 eV. Moreover, broad shake-
D 9 Q
\AsteriskThin \FiveStarLines \SixFlowerOpenCenter
up structures ( ) were newly observed around 942 eV and 962 eV. These new Cu 2p peaks
0 : L
\AsteriskThinCenterOpen \FiveStarOpen \SixFlowerPetalDotted
Nanomaterials 2021, 11, x\DavidStar and the characteristic
FOR PEER REVIEW shake-up features have commonly been attributed to CuO (cupric
9 of 20
/ < [
\FiveStarOpenCircled \SixFlowerPetalRemoved
Z = G
\DavidStarSolid
oxide) [46–48]. \FiveStarOpenDotted \SixFlowerRemovedOpenPetal
S > K
\EightAsterisk \FiveStarOutline \SixStar
Y @ `
\EightFlowerPetal \FiveStarOutlineHeavy \SixteenStarLight
H 1 ^
\EightFlowerPetalRemoved \FiveStarShadow \Snowflake
I V _
\EightStar \FourAsterisk \SnowflakeChevron
F W ]
\EightStarBold \FourClowerOpen \SnowflakeChevronBold
E 5 \
\EightStarConvex \FourClowerSolid \Sparkle
R 6 J
\EightStarTaper \FourStar \SparkleBold
\FiveFlowerOpen \FourStarOpen \TwelweStar
Table 257: pifont Stars, Flowers, and Similar Shapes
A \ding{65} J \ding{74} S \ding{83} \ \ding{92} e \ding{101}
B \ding{66} K \ding{75} T \ding{84} ] \ding{93} f \ding{102}
C \ding{67} L \ding{76} U \ding{85} ^ \ding{94} g \ding{103}
D \ding{68} M \ding{77} V \ding{86} _ \ding{95} h \ding{104}
E \ding{69} N \ding{78} W \ding{87} ` \ding{96} i \ding{105}
F \ding{70} O \ding{79} X \ding{88} a \ding{97} j \ding{106}
G \ding{71} P \ding{80} Y \ding{89} b \ding{98} k \ding{107}
H \ding{72} Q \ding{81} Z \ding{90} c \ding{99}
I \ding{73} R \ding{82} [ \ding{91} d \ding{100}
Table 258: fourier Ornaments
o \aldine X \decoone c \floweroneright
m \aldineleft ] \decosix g \leafleft
n \aldineright Y \decothreeleft f \leafNE
j \aldinesmall Z \decothreeright h \leafright
[ \decofourleft a \decotwo d \starredbullet
\ \decofourright b \floweroneleft
Figure 5. Raman
Figure 5. Raman spectra
spectra (a)
(a) of
ofZIF-67/Ti,
ZIF-67/Ti, Co-TiO
Co-TiO2/Ti,
/Ti, Cu (60 s)-Co-TiO
Cu (60 s)-Co-TiO2/Ti
/Ti and
and Cu (960 s)-Co-TiO
Cu (960 s)-Co-TiO2/Ti
/Ti corresponding
corresponding to
to
2 2 2
normalized Raman spectra (b) before and after Cu deposition, and a schematic (c) of the material growth mode on metallic
normalized Raman spectra (b) before andTable after Cu
259:deposition, and a schematic
wasysym Geometric Shapes (c) of the material growth mode on metallic
Ti surface upon thermal treatment.
Ti surface upon thermal treatment.
7 \hexagon 8 \octagon D \pentagon 9 \varhexagon
Upon
For theCuXPSdeposition
profilesfor 60 s,
after no characteristic
photocatalytic COof Cu species was observed. However,
2 reduction tests, Ti 2p peaks of bare
interestingly, the A 1g mode at 689 cm−1 was substantially increased relative to the other
and Cu (10 s)-Co-TiO2 /Ti samples were decreased, while the Co 2p signal was relatively
Raman
increased. peaks. Furthermore,
At higher Cu coveragesin theofnormalized
60 s and 240 Raman
s, Ti 2ppeaks
signalofwas
ZIF-67/Ti (redasline)
enhanced, wasand
the
Cu (960 s)-Co-TiO 2 /Ti (green line) samples (Figure 5b), the A 1g mode
Co 2p signal. The normalized Ti 2p peaks showed no critical difference with Cu thickness became substantially
enhanced
after CO2 after Cu deposition
reduction (Supplemental for 960 s. The Raman
Information, peaks
Figure for the Cu
S1(a1–a3). speciesfor
However, were
the not
Co
clearly detected [44,45]. As 78depicted in Figure 5c, it may appear that Ti3O was formed at
2p XPS of Cu (240 s)-Co-TiO2 /Ti sample (Figure 6b), satellite peaks at 786 eV and 802 eV
the
wereinterface
enhanced of Ti andthe
after TiO 2, and Co3O4 was
photocatalytic CO2 grown as a which
reduction, head during thermal to
was attributed deposition of
an increase
ZIF-67,
in CoO as discussed
state in Figure
(Supplemental 1b above. Figure S1(b1–b3) [15,27,43,48]. For the O 1s XPS
Information,
Figure
profiles, the6XPS
displays
Oad /O Tilattice
2p (Figure 6a), Co
ratios were 2p (Figure changed
substantially 6b), Cu 2p (Figure
after 6c) and O 1s
the photocatalytic
(Figure 6d) XPSThe
CO2 reduction. profiles
Oad /Oforlattice
bareratios
Co-TiO
were2/Ti51.9%/48.1%,
and Cu deposited (10 s, 6019.6%/80.4%
49.2%/50.8%, s and 240 s) and
Co-
TiO /Ti samples before and after UVC photocatalytic CO reduction tests.
53.9%/46.1% for bare, Cu(10 s)-, Cu (60 s)- and Cu (240 s)-Co-TiO2 /Ti samples, respectively.
2 2 The elements of
Ti, Co, C and O were commonly observed as expected, and the Cu
Except for the Cu (60 s)-Co-TiO2 /Ti sample, the Oad XPS peak was significantly enhancedelement was addition-
ally
afterobserved after Cu deposition.
the photocatalytic CO2 reduction On the basis of the Ti
(Supplemental 2p and Co 2p
Information, XPS S1(c1)).
Figure intensities
Forand
the
sensitivity factors, the Co/Ti XPS ratio was estimated to be 5.3/100 for bare Co-TiO2/Ti.
The Co/Ti XPS ratio became 3.7/100 after Cu deposition for 240 s. As discussed above, the
decrease in Co/Ti was also observed in the EDXS data, which is consistent with the XPS
data. This indicates that the head of Co is covered more by Cu compared to the stem of Ti.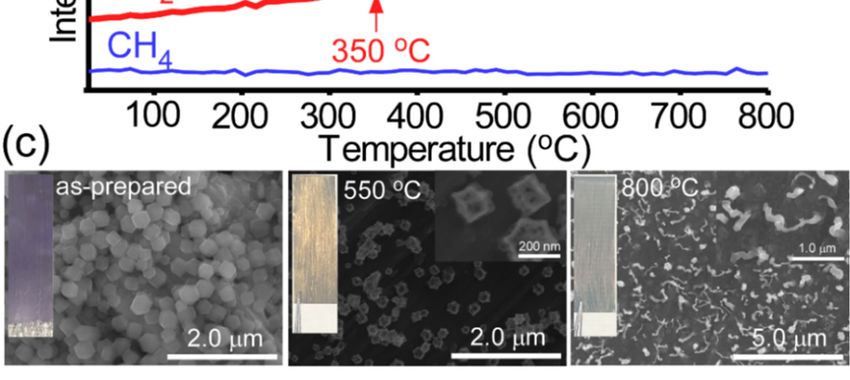
Nanomaterials 2021, 11, 1904 10 of 19
Cu 2p XPS profile of the Cu (240 s)-Co-TiO2 /Ti sample after the reduction test, the intensity
was somewhat decreased (Supplemental Information, Figure S1d), which was possibly due
to agglomeration of smaller Cu particles forming larger Cu particles. In addition, the Cu
2p3/2 (Cu 2p1/2 ) peak at 933.7 eV (952.8 eV) became stronger than the peaks at 932.0 eV
(951.5 eV). This is mainly due to CuO species being more present than Cu2 O species.
Carbon signals were somewhat increased both at 284 eV and 288 eV after photocatalytic
CO2 reduction (Supplemental Information, Figure S1e), which was attributed to an increase
Nanomaterials 2021, 11, x FOR PEER REVIEW 10 of 20
in C–C and C=O species.
Table 256: bbding Stars, Flowers, and Similar Shapes
N \Asterisk P \FiveFlowerPetal 2 \JackStar
A \AsteriskBold 8 \FiveStar 3 \JackStarBold
B \AsteriskCenterOpen ; \FiveStarCenterOpen O \SixFlowerAlt
X \AsteriskRoundedEnds ?10s, U \SixFlowerAlt
C and 7 M \SixFlowerOpe
\FiveStarConvex
Figure 6.
Figure 6. Ti 2p (a),
Ti 2p (a), Co
Co 2p
2p (b),
(b), Cu
Cu 2p
2p (c)
(c) and
and O
O 1s
1s (d)
(d) XPS
XPS profiles
profiles for
for bare
bare Co-TiO
Co-TiO /Ti
2
/Ti and
2 10s, 60
60 ss and
and 240
240 s-Cu-deposited
s-Cu-deposited
D UVC 9 II ndicates Q \SixFlowerPet
\AsteriskThin \FiveStarLines
Co-TiO /Ti
Co-TiO /Ti samples
2
samples before
before (thin
(thin lines)
lines) and
and after
after (thick
(thick lines)
lines) UVC photocatalytic reaction. ☆
photocatalytic reaction. ndicates shake-up
shake-up structures.
structures.
0 \DavidStar : \FiveStarOpenCircled L \SixFlowerPet
2 \AsteriskThinCenterOpen \FiveStarOpen
For the Ti 2p XPS
Photocatalytic / \DavidStarSolid
COprofiles of bare
2 reduction Co-TiO /Ti
experiments 2 (Figure
[30,48–52] .were to Ti(IV) K
\EightAsterisk \FiveStarOutline
Y commonly @with\FiveStarShadow ` \Snowflake
spin-orbit (S-O) splitting
CO,energy of2 H5.7 \FiveStarOutlineHeavy \SixteenStarL
served to be MeOH, 4, C 2 , eV.
C2 HThese
4 and peaks The attributed
yields (µmol/mol =state
ppm)of
H 1 ^ \SnowflakeChe
TiO \EightFlowerPetalRemoved
of the[30].
2 Themajor
three Ti 2p products
BE peaks showed no critical
showedchangethe order anCH
of increasing
4 < CO Cu deposition
< MeOH. For
H2Iwas V were _ \SnowflakeChe
\EightStar \FourAsterisk
time, but the
the minor intensity
products, C2was somewhat
also decreased
detected in thedue to
range overlayer
of 1.0–4.0 Ti.
ppm.Furthermore,
Although the
F \EightStarConvex 2 W6 \FourClowerSolid ] \Sparkle
\EightStarBold \FourClowerOpen
production amounts
asymmetry of the Ti were
2p peakbelowwas 1 ppm,
increasedC H
2 4 and
with anC H
increasing meaningfully
Cu deposition detected
(Supple-in
the gas Information,
mental chromatography Figure E S1a).
(GC) profiles.
The TiNo 2pHXPS
2 was 5appeared
detected
signal in thetoGC \ et\SparkleBold
profile.around
increase Choi al.
459
RCO\FiveFlowerOpen 6Cobe3\FourStarOpen J \TwelweStar
\EightStarTaper \FourStar
performed
eV and 465aeV. photocatalytic
The asymmetry 2 reduction
of Ti 2p XPS test peak
for a bare
could Oa4 change
powderin sample
eitherunder the
chemical
sameor
state experimental conditions
physical nature [46]. as in the present study, except for a reaction time of 13 h vs.
In Figure 6b, the corresponding Co 2p3/2 and Co 2p1/2 peaks were observed at 779.3
eV and 794.7 eV, respectively, with an S-O splitting energy of 15.4 eV. These peaks could
Table 257: pifont Stars, Flowers, and Similar Shapes
be assigned to Co3O4, as expected from the HRTEM and Raman spectra. The Co 2p peak
A \ding{65} J \ding{74} S \ding{83} \ \ding{92} e \di
showed no substantial change with increasingKCu\ding{75}
B \ding{66} depositionTtime based on
\ding{84} ] the normal-
\ding{93} f \didropped below 1 ppm when Cu deposition was above 60 s. CO2 re
were estimated to be 50–64%, 27–35% and 7–10% for MeOH, CO and
Details are shown in the Supplemental Information, Figure S2. The 60
Nanomaterials 2021, 11, 1904
TiO2/Ti sample showed the highest selectivity of 64% for photocatal 11 of 19
tion.
Conclusively, photocatalytic CO2 reduction activity became evi
6 h [52]. They reported that three major products showed the order of CH4 (17.1 ppm) <
Cu deposition
MeOH above
(19.1 ppm) < CO 240fors,13 which
(83.2 ppm) was
h. Lin et al. attributed
reported to photocatalytic
CO as a major less light absor
CO2 reduction product for [Co(bipy)3 ]2+ -embedded TiO2 hollow spheres [53]. On the basis
film. However, Cu deposition between 30 s and 120 s showed mean
of the literature and the present study, MeOH production was highly enhanced in the
in CO2 reduction
developed activity.
Co-TiO2 /Ti nanostructure.
Figure
Figure 7. Photocatalytic CO2 reduction
7. Photocatalytic COyields: (a) for bare Co-TiO /Ti and 10s, 60 s, 120 s, 240 s, 480 s
2 reduction yields:2 (a) for bare Co-TiO2/Ti and 10s
and 960 s-Cu-deposited Co-TiO2 /Ti samples, and MeOH (b), CO (c), CH4 and (d) C2 H2 (e) yields
s and 960 s-Cu-deposited Co-TiO2/Ti samples, and MeOH (b), CO (c), CH4 a
(µmol/mol) with error bars. Photo is a closed stainless reactor with a Co-TiO2 /Ti disc inside. The
(μmol/mol)
asterisk with
indicates the errorpoint.
maximum bars. Photo is a closed stainless reactor with a Co-Ti
asterisk indicates the maximum point.
For the bare Co-TiO2 /Ti sample, MeOH, CO, CH4 , C2 H2 , C2 H4 and C2 H6 were
observed to be 60.5 ppm, 31.5 ppm, 10.5 ppm, 2.7 ppm, 1.1 ppm and 0.2 ppm. MeOH
Electrochemical
production (Figure 7b) showedCO reduction
the2highest experiments
production [30,49,54,55]
a
of 86.3 ppm after Cu depositionwere
for 60 s. Above Cu deposition of 240 s, MeOH production was observed to be lower than
the amounts of reduction products are displayed in Figure 8a. In this
gaseous products were only measured by GC and no MeOH was
phase. The reproducibly detected gaseous products include CO, C
C2H6. The amounts were much less than 50 ppm. However, H2 was siNanomaterials 2021, 11, 1904 12 of 19
that in the bare Co-TiO2 /Ti sample. CO production (Figure 7c) was somewhat increased
upon Cu deposition for 30 s–120 s. Upon Cu deposition above 240 s, CO production was
also observed to be lower than that in the bare Co-TiO2 /Ti sample. For CH4 production
(Figure 7d), the bare Co-TiO2 /Ti sample showed the highest amount of 10.5 ppm, and
the yield was gradually decreased with an increasing Cu deposition amount. For C2 H2
production (Figure 7e), the amount was higher when Cu amount was below 30 s, but
the amount dropped below 1 ppm when Cu deposition was above 60 s. CO2 reduction
selectivities were estimated to be 50–64%, 27–35% and 7–10% for MeOH, CO and CH4 ,
respectively. Details are shown in the Supplemental Information, Figure S2. The 60 s-Cu-
deposited Co-TiO2 /Ti sample showed the highest selectivity of 64% for photocatalytic
MeOH production.
Conclusively, photocatalytic CO2 reduction activity became evidently poorer upon
Cu deposition above 240 s, which was attributed to less light absorption by thicker Cu film.
However, Cu deposition between 30 s and 120 s showed meaningful enhancement in CO2
reduction activity.
Electrochemical CO2 reduction experiments [30,49,54,55] were also performed, and
the amounts of reduction products are displayed in Figure 8a. In this experimental setup,
gaseous products were only measured by GC and no MeOH was detected in the gas phase.
The reproducibly detected gaseous products include CO, CH4 , C2 H2 , C2 H4 and C2 H6 . The
amounts were much less than 50 ppm. However, H2 was significantly detected with the
amounts up to 13,325 ppm. Faradaic efficiency (FE, %) for H2 production was estimated to
be about 6–10% in the NaHCO3 electrolyte condition. CO and CH4 productions over the
bare Co-TiO2 /Ti sample were observed to be 4.3 ppm and 8.1 ppm, and C2 H2 , C2 H4 and
C2 H6 were merely detected with 0.1 ppm–0.5 ppm.Nanomaterials 2021, 11, x FOR PEER REVIEW 13 of 20
with the amounts up to 13,325 ppm. Faradaic efficiency (FE, %) for H2 production was
Nanomaterials 2021, 11, 1904 estimated to be about 6–10% in the NaHCO3 electrolyte condition. CO and CH4 produc-
13 of 19
tions over the bare Co-TiO2/Ti sample were observed to be 4.3 ppm and 8.1 ppm, and
C2H2, C2H4 and C2H6 were merely detected with 0.1 ppm–0.5 ppm.
Figure 8.
Figure 8. Electrocatalytic
Electrocatalytic CO
CO2 reduction
reduction product
product yields
yields (a)
(a) for
for bare
bare Co-TiO
Co-TiO2/Ti
/Ti and
and 10s, 30 s,
10s, 30 s, 60
60 s,
s,
2 2
120 s, 240 s, 480 s and 960 s-Cu-deposited Co-TiO2/Ti samples, and CO (b), CH4 (c), C2H2 (d) and H2
120 s, 240 s, 480 s and 960 s-Cu-deposited Co-TiO2 /Ti samples, and CO (b), CH4 (c), C2 H2 (d) and
(e) yields (μmol/mol) with error bars. Photo is the electrochemical 3-electrode air-tight closed cell.
H2 (e) yields (µmol/mol) with error bars. Photo is the electrochemical 3-electrode air-tight closed
The asterisk indicates the maximum point for CH4.
cell. The asterisk indicates the maximum point for CH4 .
When Cu was sputter-deposited for 10 s, CO was substantially increased to 47.4 ppm
When Cu was sputter-deposited for 10 s, CO was substantially increased to 47.4 ppm
(Figure 8b); this is an 11× increase compared with that in the bare Co-TiO2/Ti sample.
(Figure 8b); this is an 11× increase compared with that in the bare Co-TiO2 /Ti sample.
Upon Cu deposition above
Upon Cu deposition above 30
30 s,
s, the
the CO
CO production
production was
was less
less than
than that
that for
for the
the Cu
Cu (10
(10 s)-
s)-
Co-TiO2 /Ti sample, but higher than in the bare Co-TiO2 /Ti sample. In Figure 8c, the CH4
production was gradually increased with an increasing Cu deposition, reaching 12.0 ppm
upon Cu deposition for 960 s. Inversely, as discussed above (Figure 7d), CH4 production
decreased with increasing Cu deposition in the photocatalytic CO2 reduction. For C2 H2Nanomaterials 2021, 11, 1904 14 of 19
production in Figure 8d, the production was ≤0.1 ppm when the Cu deposition was
less than 10 s. However, the amounts were increased and detected with 6.6 ppm and
10.3 ppm upon Cu deposition for 30 s and 60s, respectively. Above 60 s and up to 960 s,
the amounts were somewhat decreased and detected with 1.2 ppm–4.7 ppm. The C2 H4
productions were less than 0.2 ppm for all samples. C2 H6 was meaningfully detected in the
range of 0.5–1.3 ppm and generally increased with increasing Cu amounts. H2 was more
substantially produced, as mentioned above. Above 60 s and up to 960 s, H2 productions
were detected with 14,275 ppm–15,732 ppm with FE (%) of 6.5–7.5%. H2 production was
dominant and all the catalysts showed an H2 production selectivity of >99%. For the Cn
compounds with a total of less than 1% selectivity, the relative selectivities are shown in
the Supplemental Information, Figure S3.
We also tested the effect of applied potential for a selected sample of Cu (120 s)-Co-
TiO2 /Ti (Supplemental Information, Figure S4). Interestingly, H2 production was increased
by 4.6× at −1.8 V compared with that at −1.5 V (vs. Hg/HgO). However, CO and C2 H2
productions were higher at −1.5 V (vs. Hg/HgO). CO was detected with 30.4 ppm and
18.1 ppm at −1.5 V and −1.8 V, respectively. C2 H2 was detected with 6.7 ppm and 1.2 ppm
at −1.5 V and −1.8 V, respectively.
In the CO2 reduction reaction [32,49], productions of Cn products and H2 are competi-
tively observed. When the electrode in an aqueous electrolyte, H2 production is expected
to be significant on the electrode surface via the association (Had + Had → H2 ) of adsorbed
H atoms or Had + H3 O+ + e− → H2 + H2 O [30], as observed in the present experi byment.
The Had is known to be formed via H+ + e− → Had , where H2 O → H+ + OH− [30]. CO2
reduction is a multielectron process, where electrons are either provided by photogenera-
tion or are applied by potential electrochemistry. The generally important mechanism is
demonstrated below [28,45].
Co-TiO2 /Ti + hν → Co-TiO2 /Ti (VB, h+ ) + Co-TiO2 /Ti (CB, e− ) under UV light
H2 O + h+ → OH + H+
OH + H2 O + 3h+ → O2 + 3H+
CO2 + 2H+ + 2e− → CO + H2 O
CO2 + 8H+ + 8e− → CH4 + 2H2 O
CO2 + 6H+ + 6e− → CH3 OH + H2 O
2CO2 + 10H+ + 10e− → C2 H2 + 4H2 O
The production of C2 compounds requires more electrons that appear to be dependent
on overlayer Cu. This needs to be studied further.
Electrochemical oxygen evolution reaction (OER) was also performed to further extend
the application area of the bean sprout-like Co-TiO2 /Ti nanostructures. As observed above
in the electrochemical CO2 reduction tests, H2 was significantly produced in the NaHCO3
electrolyte media, indicating that the Co-TiO2 /Ti nanostructure had a high potential
applicability to water splitting. Figure 9a displays linear sweep voltammetry (LSV) curves
between 1.0 V and 2.4 V (vs. RHE) in 0.1 M KOH electrolyte at a scan rate of 20 mV/s. The
X-axis was rescaled from EHg/HgO using ERHE = EHg/HgO + 0.059pH + E0 ,Hg/HgO , where
EHg/HgO is the measured potential and E0 ,Hg/HgO = 0.098 V [56].
For the bare Co-TiO2 /Ti sample, the OER onset potential was observed at around
+1.65 V (vs. RHE). The onset potential showed no significant difference, with onlyNanomaterials 2021, 11, 1904 15 of 19
The Tafel plot was obtained using the equation: η = a + b log A, where η is the overpotential,
a is the intercept, b is the Tafel slope and A is the current density (mA/cm2 ). As shown
in Figure 9b, the Tafel slopes were estimated to be 124.2 mV/dec and 117.7 mV/dec for
bare
Nanomaterials 2021, 11, and
x FOR240
PEERs REVIEW
Cu-deposited Co-TiO2 /Ti nanostructures, respectively. When the Cu was16 of 20
deposited for 240 s, the OER performance was observed to be further enhanced.
Figure 9.Figure
Linear sweep voltammetry
9. Linear profiles (a) for
sweep voltammetry bare Co-TiO
profiles (a) for2/Ti and
bare 10s, 30 /Ti
Co-TiO s, 60and
s, 120 s, 240
10s, 30 s,s,60
480s,s120
ands,960
240s-Cu-
s,
2
deposited Co-TiO2/Ti samples and the corresponding Tafel plots (b). Inset photos show the electrochemical cell with the
480 s and 960 s-Cu-deposited Co-TiO /Ti samples and the corresponding Tafel plots (b). Inset photos
three electrodes and oxygen bubbles on a catalyst2surface.
show the electrochemical cell with the three electrodes and oxygen bubbles on a catalyst surface.Nanomaterials 2021, 11, x FOR PEER REVIEW 17 of 20
Nanomaterials 2021, 11, 1904 16 of 19
In the OER, the Co oxide head in the bean sprout-like structure may play a more
In therole
important OER,in the Co oxide
enhancing head inasthe
activity, beanonsprout-like
based structure
the literature and themay play a of
findings more
the
important role in enhancing activity, as based on the literature
present study [15,18,20,28]. The overall OER is written as M + 4OH and
− →the
M findings
+ O of the
2 (g) + 2H2O
present study − → M + O (g) + 2H O
+ 4e−
− [28]. The[15,18,20,28].
elementary The overallare
reactions OER is written
included as Mand
below + 4OHthe scheme is2 depicted2 in
+Figure
4e [28]. Thethese
10. All elementary reactionsappeared
OER processes are included below
to occur andefficiently
more the schemeonisthe
depicted
Co oxidein
Figure 10. All these OER processes appeared to occur more efficiently on the Co oxide head.
head. The detailed roles of the Co oxide head and TiO2 stem need to be investigated fur-
The detailed roles of the Co oxide head and TiO2 stem need to be investigated further.
ther.
− −
In In
(1),(1),
MM + OH→
+ OH →MM- OH + +e−e−
– OH
− −
In (2), M − OH + OH
In (2), → M+ =
M − OH OH 2 O=+Oe + H2O + e−
O−+→HM
−
In (3), M =InO(3),
+ OHM=O→+M
OH−−OOH
→M+ e − + e−
− OOH
−
In (4) MOOH In
+ OH → M ++ H
(4) MOOH 2 O− →
OH + OM ) +2Oe−+ O2 (↑) + e−
2 (+↑H
In (5), M =In + MM==OO→
O(5), M=
+M +O
M→ M2 +(↑M
+O ) + O2 (↑)
OER
10. OER
Figure 10. mechanism
mechanism occurring
occurring on theonCothe Co head
oxide oxide
in head in sprout-like
the bean the bean sprout-like
Co-TiO2/Ti
nanostructures.
Co-TiO2 /Ti nanostructures.
4. Conclusions
In summary,
summary, we we have
have synthesized
synthesized bean
bean sprout-like
sprout-likeCo-TiO
Co-TiO22/Ti
/Ti nanostructures using
sacrificial ZIF-67 templated on Ti sheets by thermal treatment at 800 ◦°C C under Ar-flow
conditions. The physicochemical properties of the newly synthesized nanostructures were
examined by X-ray diffraction analysis, scanning electron microscopy, microscopy, high-resolution
high-resolution
electron microscopy,
microscopy,Raman
Ramanspectroscopy,
spectroscopy, energy-dispersive
energy-dispersive X-ray spectroscopy
X-ray spectroscopy andand X-ray
X-
photoelectron
ray photoelectron spectroscopy.
spectroscopy. OnOnthethe
basis
basisof of
thetheresults,
results,the
thehead
headandandthe the stem
stem were
observed to to be
beCoCo3O
3O
44 andrutile
and rutile TiO
TiO 2 , respectively.
2, respectively. TheThe interface
interface of Tiofsupport
Ti support and TiOand2
TiO appeared
appeared
2 to form a Ti
to form a Ti3O crystal3 O crystal phase. Photocatalytic and electrochemical
phase. Photocatalytic and electrochemical CO2 reduction CO 2
reduction experiments
experiments were demonstrated,
were demonstrated, as well as electrochemical
as well as electrochemical OER for bare OER and forCu-depos-
bare and
Cu-deposited
ited Co-TiO2/TiCo-TiO 2 /Ti nanostructures.
nanostructures. The catalytic The catalytic performances
performances were observedwere toobserved
be depend- to
be dependent
ent on the Cuamount.
on the Cu deposition deposition amount.
In the In the photocatalytic
photocatalytic CO2 reduction,CO GC reduction, that
2 confirmed GC
confirmed
CH 3OH, CO thatand
CH3CHOH,4 CO
wereandmajor
CH4 were major with
products, products, with
yields ofyields
45–86ofμmol/mol,
45–86 µmol/mol, 24–37
μmol/mol and 7–11 μmol/mol, respectively. Minor C2 compounds of C2H2, C2H4 andCC22H
24–37 µmol/mol and 7–11 µmol/mol, respectively. Minor C 2 compounds of C 2 H 2 , H46
and C H were
were meaningfully
2 6 meaningfully detected under 5 µmol/mol. The highest selectivity
detected under 5 μmol/mol. The highest selectivity of 64% for photo- of 64% for
photocatalytic
catalytic MeOH MeOH production
production was achieved
was achieved for 60 fors-Cu-deposited
60 s-Cu-deposited Co-TiO
Co-TiO /Ti sample.
2/Ti 2sample. For
For electrocatalytic CO reduction,
electrocatalytic CO2 reduction,
2 CO, CH
CO, CH4 and and C
4 C2H42were H were meaningfully produced
4 meaningfully produced under under
50Nanomaterials 2021, 11, 1904 17 of 19
50 µmol/mol, but H2 was dominantly produced with 6000 to 16,000 µmol/mol. The bean
sprout-like Co-TiO2 /Ti nanostructures were observed to show high OER performances
with onset overpotentials of 330–430 mV (vs. RHE), Tafel slopes of 117–134 mV/dec and
the highest performance at Cu deposition for 240 s. The present demonstration tests using
ZIF-67 as a sacrificial template on metallic Ti sheet provide valuable information about the
synthesis of new nanostructures, as well as potential applications regarding CO2 reduction
and OER for energy and the environmental management.
Supplementary Materials: The following are available online at https://www.mdpi.com/article/10
.3390/nano11081904/s1, Figure S1: XPS profiles, Figure S2: Photocatalytic CO2 reduction selectivities,
Figure S3: Electrocatalytic CO2 reduction selectivities, Figure S4: Electrochemical CO2 reduction
product yields.
Author Contributions: H.J.J. performed materials synthesis and CO2 reduction; S.J.P. performed
XPS; J.H.Y. performed HRTEM; S.-M.H. performed EDXS; C.K.R. designed the experimental concepts;
Y.S. designed the experiments and wrote the paper. All authors have read and agreed to the published
version of the manuscript.
Funding: This research was supported by a National Research Foundation of Korea (NRF) grant
funded by the Korean government (MEST) (2016R1D1A3B04930123 and 2021R1A2C2003929).
Data Availability Statement: The data presented in this study are available in the article and
Supplementary Material.
Conflicts of Interest: The authors declare no conflict of interest.
References
1. Duan, C.; Zhang, Y.; Li, J.; Kang, L.; Xie, Y.; Qiao, W.; Zhu, C.; Luo, H. Rapid Room-Temperature Preparation of Hierarchically
Porous Metal–Organic Frameworks for Efficient Uranium Removal from Aqueous Solutions. Nanomaterials 2020, 10, 1539.
[CrossRef]
2. Ryu, U.; Jee, S.; Rao, P.C.; Shin, J.; Ko, C.; Yoon, M.; Park, K.S.; Choi, K.M. Recent Advances in Process Engineering and Upcoming
Applications of Metal-Organic Frameworks. Coord. Chem. Rev. 2021, 426, 213544. [CrossRef]
3. Shellaiah, M.; Sun, K.-W. Progress in Metal-Organic Frameworks Facilitated Mercury Detection and Removal. Chemosensors 2021,
9, 101. [CrossRef]
4. Tang, H.; Li, W.; Jiang, H.; Lin, R.; Wang, Z.; Wu, J.; He, G.; Shearing, P.R.; Brett, D.J.L. ZIF-8-Derived Hollow Carbon for Efficient
Adsorption of Antibiotics. Nanomaterials 2019, 9, 117. [CrossRef] [PubMed]
5. Zhao, H.; Wang, Y.; Zhao, L. Magnetic Nanocomposites Derived from Hollow ZIF-67 and Core-Shell ZIF-67@ZIF-8: Synthesis,
Properties, and Adsorption of Rhodamine B. Eur. J. Inorg. Chem. 2017, 35, 4110–4116. [CrossRef]
6. Sun, W.; Thummavichai, K.; Chen, D.; Lei, Y.; Pan, H.; Song, T.; Wang, N.; Zhu, Y. Co-Zeolitic Imidazolate Framework@Cellulose
Aerogels from Sugarcane Bagasse for Activating Peroxymonosulfate to Degrade P-Nitrophenol. Polymers 2021, 13, 739. [CrossRef]
[PubMed]
7. Ethiraj, J.; Palla, S.; Reinsch, H. Insights into High Pressure Gas Adsorption Properties of ZIF-67: Experimental and Theoretical
studies. Microporous Mesoporous Mater. 2020, 294, 109867. [CrossRef]
8. Song, E.; Moon, J.; Lee, J.Y.; Lee, C.O.; Chi, W.S.; Park, J.T. High-voltage solar energy conversion based on ZIF-67-derived binary
redox-quasi-solid-state electrolyte. J. Electroanal. Chem. 2021, 893, 115264. [CrossRef]
9. Yu, Y.; You, S.; Du, J.; Zhang, P.; Dai, Y.; Liu, M.; Jiang, B.; Ren, N.; Zou, J. Ti3+ -self-doped TiO2 with multiple crystal-phases
anchored on acid-pickled ZIF-67-derived Co3 O4 @ N-doped graphitized-carbon as a durable catalyst for oxygen reduction in
alkaline and acid media. Chem. Eng. J. 2021, 403, 126441. [CrossRef]
10. Chang, P.-H.; Lee, Y.-T.; Peng, C.-H. Synthesis and Characterization of Hybrid Metal Zeolitic Imidazolate Framework Membrane
for Efficient H2 /CO2 Gas Separation. Materials 2020, 13, 5009. [CrossRef]
11. Shaikh, Z.A.; Laghari, A.A.; Litvishko, O.; Litvishko, V.; Kalmykova, T.; Meynkhard, A. Liquid-Phase Deposition Synthesis of
ZIF-67-Derived Synthesis of Co3 O4 @TiO2 Composite for Efficient Electrochemical Water Splitting. Metals 2021, 11, 420. [CrossRef]
12. Salahuddin, U.; Iqbal, N.; Noor, T.; Hanif, S.; Ejaz, H.; Zaman, N.; Ahmed, S. ZIF-67 Derived MnO2 Doped Electrocatalyst for
Oxygen Reduction Reaction. Catalysts 2021, 11, 92. [CrossRef]
13. Zhou, H.; Zheng, M.; Tang, H.; Xu, B.; Tang, Y.; Pang, H. Amorphous Intermediate Derivative from ZIF-67 and Its Outstanding
Electrocatalytic Activity. Small 2019, 16, 1904252. [CrossRef]
14. Dong, Z.; Zhao, J.; Tian, Y.; Zhang, B.; Wu, Y. Preparation and Performances of ZIF-67-Derived FeCo Bimetallic Catalysts for CO2
Hydrogenation to Light Olefins. Catalysts 2020, 10, 455. [CrossRef]
15. Wen, Y.; Wei, Z.; Ma, C.; Xing, X.; Li, Z.; Luo, D. MXene Boosted CoNi-ZIF-67 as Highly Efficient Electrocatalysts for Oxygen
Evolution. Nanomaterials 2019, 9, 775. [CrossRef] [PubMed]You can also read