RISK FACTORS OF SARS-COV-2 INFECTION: GLOBAL EPIDEMIOLOGICAL STUDY - XSL FO
←
→
Page content transcription
If your browser does not render page correctly, please read the page content below
JMIRx Med                                                                                                                              Barletta

     Original Paper

     Risk Factors of SARS-CoV-2 Infection: Global Epidemiological
     Study

     William Alphonse Barletta, PhD
     Department of Physics, Massachusetts Institute of Technology, Cambridge, MA, United States

     Corresponding Author:
     William Alphonse Barletta, PhD
     Department of Physics
     Massachusetts Institute of Technology
     77 Massachusetts Avenue
     Cambridge, MA, 02142
     United States
     Phone: 1 510 282 0240
     Email: barletta@mit.edu

     Related Articles:
     Preprint (medRxiv): https://www.medrxiv.org/content/10.1101/2020.09.30.20204990v1
     Preprint: https://preprints.jmir.org/preprint/28843
     Peer-Review Report by Anonymous: https://med.jmirx.org/2021/3/e31926/
     Peer-Review Report by Palash Banik (Reviewer D): https://med.jmirx.org/2021/3/e31927/
     Authors' Response to Peer-Review Reports: https://med.jmirx.org/2021/3/e31910/

     Abstract
     Background: Since the first recognition of the pandemic characteristics of SARS-CoV-2 infection, and before substantial case
     fatality data were available worldwide, public health agencies warned the public about the increased dangers of SARS-CoV-2 to
     persons with a variety of underlying physical conditions, many of which are more commonly found in persons over 50 years of
     age or in certain ethnic groups.
     Objective: To investigate the statistical rather than the physiological basis in support of the abovementioned warnings, this
     study examines correlations globally on a nation-by-nation basis between the statistical data concerning COVID-19 fatalities and
     the statistics of potential comorbidities that may influence the severity of infection.
     Methods: This study considers the statistics describing the populations of the 99 countries with the greatest numbers of
     SARS-CoV-2 infections at the time of the data cutoff. As national compilations of direct measures of immune system strength
     are not publicly available, the frequency of fatalities in those countries due to a variety of serious diseases is used as a proxy for
     the susceptibility of those populations to those same diseases.
     Results: The analysis produces plots and calculations of correlations and cross-correlations of COVID-19 case fatality rates
     and the risks of other potential cofactors. It exposes some reasons that may underlie the degree to which advanced age increases
     the risk of mortality of infection with SARS-CoV-2. In contrast with the strong influences of comorbidities on the seriousness
     of consequences of influenzas and their associated pneumonias, the correlations of the same set of risk factors with SARS-CoV-2
     infection are considerably weaker. The general characteristics of the observed correlations strengthened through 3 cycles of
     analysis, starting in September 2020. The strongest correlations were with chronic kidney disease and coronary disease
     (approximately 0.28 and 0.20, respectively).
     Conclusions: This study confirms early clinical observations that infection with SARS-CoV-2 presents an increased risk to
     persons over the age of 65 years. It does not support the suggestions presented by government agencies early in the pandemic
     that the risks are much greater for persons with certain common potential comorbidities.

     (JMIRx Med 2021;2(3):e28843) doi: 10.2196/28843

     KEYWORDS
     COVID-19; pandemic; public health; mortality; infection; risk; risk factors; age; epidemiology; infectious disease

     https://med.jmirx.org/2021/3/e28843                                                                JMIRx Med 2021 | vol. 2 | iss. 3 | e28843 | p. 1
                                                                                                             (page number not for citation purposes)
XSL• FO
RenderX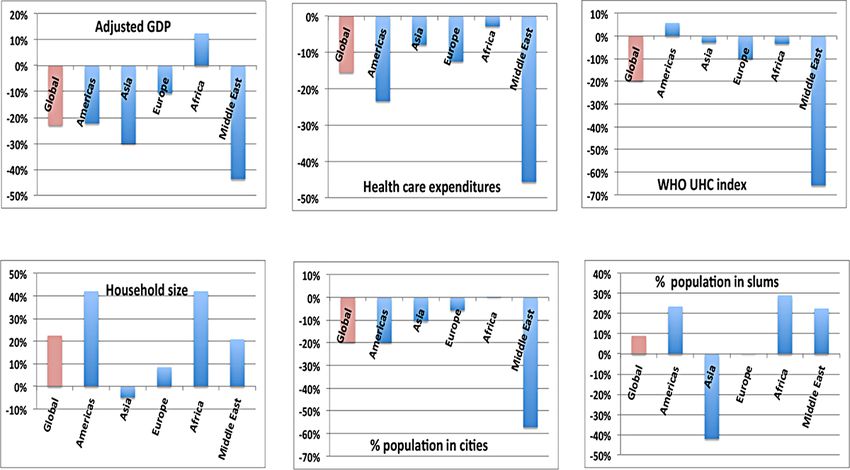
JMIRx Med                                                                                                                                Barletta

                                                                          (Singapore) to almost 30% (Yemen). Moreover, in most (but
     Introduction                                                         not all) countries, by December 2020, the integrated average
     Background                                                           case fatality rate had declined significantly from the high levels
                                                                          seen in March and April of 2020.
     Only a few months after its disclosure by Chinese health
     authorities, SARS-CoV-2 had spread worldwide. By late winter         Objective
     of 2020, the World Health Organization (WHO) had designated          For a less anecdotal (and less speculative) assessment of risk
     the disease caused by the virus, COVID-19, to be a worldwide         factors for serious consequences of COVID-19, a data-driven
     epidemic [1]. As can be seen from the effects of the                 examination of worldwide national statistics seems to be in
     approximately 80 million infections reported by the end of 2020,     order, with the goal of identifying strong correlations of
     COVID-19 can manifest as mild, influenza-like symptoms or,           mortality due to COVID-19 with other potential comorbidities
     far more seriously, as a severe and often deadly respiratory         and even with ethnically specific biological and economic
     disease with pneumonia.                                              factors. Based on a global investigation of the statistical
     From the outset of the COVID-19 pandemic, the public has             correlations on a nation-by-nation basis between the statistical
     been exposed to numerous speculations about the degrees to           data concerning reported COVID-19 fatalities and potential
     which age and various underlying morbidities may amplify the         comorbidities, this paper presents a set of calculations of linear
     risk of intensifying the severity of infection with SARS-CoV-2.      and multivariate correlations that may influence the severity of
     Authoritative sources such as the US Centers for Disease Control     the infection.
     and Prevention (CDC) [2] have issued warnings. Conditions
     cited by the CDC as increasing risk include cancer, chronic          Methods
     kidney disease, obesity, coronary disease, type 2 diabetes
                                                                          The analysis that follows has not been based on clinical or
     mellitus (DM), and sickle cell disease. The CDC also warns
                                                                          physiological considerations but rather on national
     that asthma, hypertension, and liver disease, among other
                                                                          epidemiological statistics as reported to international authorities.
     conditions, may subject a person to increased risk. In some
                                                                          Unless otherwise indicated, the following assumptions underlie
     countries, such as the United States, the incidence of COVID-19
                                                                          the subsequent calculations:
     has been more prevalent in some ethnic groups than others [3],
     leading to speculations that this disparity may be due to biology    1. The apparent mortality outcomes (case fatality rates) defined
     rather than behavior. Such differences are not unknown; for          in Equation 1 serve as a reliable proxy for actual rates of
     example, sickle cell disease is most commonly found among            infection, death, and correlation with comorbidities:
     persons whose ancestors come from Africa and Mediterranean
     countries, where malaria is a prevalent affliction [4].
     As many of the diseases cited by the CDC are more common
     in persons in late middle age and older, a common warning            The apparent mortality and case number data used in the
     early in the pandemic was that SARS-CoV-2 presented a                following analysis are accurate as of December 30, 2020. This
     particular danger to persons over 50 years of age. In the initial    analysis does not and cannot account for any uncertainty due
     wave of cases in China [5] and in the strong wave of cases in        to differing national practices in distinguishing between deaths
     Italy, the probability of death due to COVID-19 was judged to        with COVID-19 and deaths due to COVID-19.
     be a strong function of a patient’s age, being only a few percent    2. The sample of 99 countries across all continents is
     for those aged less than 50 years and rising to nearly 20% for       representative of potential correlations between COVID-19
     patients older than 80 years. The large number of fatalities [6]     case fatality rates and potential comorbidities or ethnicity. The
     in care homes in New York, the United Kingdom, and elsewhere         number of COVID-19 cases in the countries that are not included
     have fueled speculations about the risks that comorbidities          was not statistically significant at the data cutoff date.
     frequently seen in older people will increase the fatality rate of   Nevertheless, outliers with relatively small statistical
     COVID-19. An alternative explanation is the decrease in              significance can skew calculated correlations.
     immune functions with aging [7].
                                                                          3. Linear correlations are examined on the basis of national
     Why is COVID-19 more dangerous to older than to younger              data for COVID-19 for the year 2020 and comorbidities for the
     persons? Complicating the answer to this question, the actual        year 2018. The sources that describe the prevalence of disease
     mortality rate of COVID-19 remains highly uncertain, as the          are the WHO, as reported by World Life Expectancy [9], and
     prevalence of asymptomatic and unreported infections has been        Worldometer [10], and the economic data are sourced from the
     estimated to be from 2 to 5 times greater than that of infections    World Bank as reported by Trading Economics [11]. This
     with clearly defined symptoms. An early exemplary source of          analysis assumes that the published WHO data concerning the
     testing-based data was provided by the passengers aboard the         fatalities ascribed to diseases in a given country constitute valid
     Princess Line cruise ship, the Diamond Princess, on which half       proxies for the prevalence of those maladies in national
     of the passengers who tested positive for COVID-19 were              populations. In the case of obesity, the reported number is the
     asymptomatic or at least presymptomatic [8]. To some degree,         percentage of the population with a BMI exceeding a
     that uncertainty may explain the very wide distributions of          WHO-established standard for a person of that sex.
     reported (or apparent) rates of mortality (case fatality rates) of
     COVID-19 in different countries, ranging from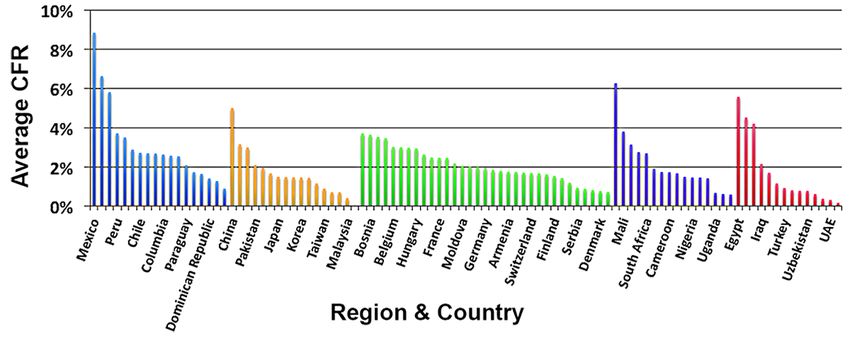
JMIRx Med                                                                                                                                            Barletta

     •      Demographics: geographical region, population, and                    The 99 countries sampled in this study were selected as those
            national median age                                                   reporting the largest numbers of COVID-19 infections. The
     •      SARS-CoV-2: number of COVID-19 tests, confirmed cases                 countries listed in Table 1 represent 5 geographical regions: the
            of COVID-19 as reported by government authorities, and                Americas, Asia, Europe, Africa, and Middle East plus Central
            the apparent case fatality rate                                       Asia. Regional populations were included. The combined
     •      Medical factors: incidence of influenza, lung disease,                population of nearly 5.5 billion persons accounts for the strong
            asthma, obesity, heart disease, common cancers,                       preponderance of all cases reported worldwide. The data cutoff
            hypertension, chronic kidney disease, diabetes, and                   date was December 30, 2020.
            malnutrition
                                                                                  The SARS-CoV-2–related data are aggregated by sex because
     •      Economics: gross domestic product–purchasing power
                                                                                  many countries still do not report sex-disaggregated data (or
            parity (GDP-PPP), average household size, percentage of
                                                                                  make these data available publicly). Therefore, the frequently
            the population living in slums, health expenditures per
                                                                                  reported sex-based disparities in contagion and in the case
            capita, and WHO Universal Health Coverage (UHC) index
                                                                                  fatality rate could not be examined with respect to sex-based
     •      One random (or pseudorandom) variable in the range from
                                                                                  differences in occurrences of potential comorbidities.
            0 to 100
                                                                                  Figure 1 plots the case fatality rates and random numbers that
     Examination of the data began with computing linear
                                                                                  are uncorrelated by construction. The Pearson coefficient for
     correlations between variables. The evaluation of the linear
                                                                                  this set of 99 values is 0.053.
     correlation herein uses the Pearson product moment correlation
     (Equation 2) to evaluate linear relationships between data sets:             A potential limitation of this approach is that all mortality data
                                                                                  have equal weight in the calculation of the correlation. One
                                                                                  check of whether this ansatz introduces a bias is the correlation
                                                                                  between apparent national mortality rates and national
                                                                                  populations. Calculating this correlation yields a value of –0.014
     One may estimate the statistical significance of calculated                  which is close to the Pearson coefficient for uncorrelated
     correlations by computing r for two variables that are                       variables. Another possible way to attribute a rational weighting
     uncorrelated by construction (ie, apparent COVID-19 mortality                is to plot the variation of COVID-19 deaths per capita against
     and a random variable in the range from 1 to 100). Once linear               the possible risk factor. However, the number of fatalities per
     correlations have been computed, the next step is evaluating                 capita depends strongly on national public health policies,
     cross-correlations among variables and performing a                          national efforts to prevent the spread of SARS-CoV-2, the GDP,
     multivariate analysis.                                                       and other nonmedical considerations. The differences in
                                                                                  COVID-19 statistics between Norway and Sweden [10] are
                                                                                  cases in point.

     Table 1. Countries sampled grouped into 5 regions. Note that as Yemen is a statistical outlier in apparent mortality, many plots omit its data point for
     visual clarity.
         Region                 Population (million) Countries
         Americas               977                 Argentina, Bolivia, Brazil, Canada, Chile, Columbia, Costa Rica, Dominican Republic, Ecuador, El
                                                    Salvador, Guatemala, Honduras, Mexico, Panama, Paraguay, Peru, United States, Venezuela
         Asia                   2504                Australia, Bangladesh, China, India, Indonesia, Japan, Kazakhstan, Kyrgyzstan, Korea, Malaysia, Nepal,
                                                    New Zealand, Pakistan, Philippines, Singapore, Thailand, Taiwan
         Europe                 725                 Albania, Armenia, Austria, Azerbaijan, Belarus, Belgium, Bosnia, Bulgaria, Croatia, Czechia, Denmark,
                                                    Estonia, Finland, France, Germany, Greece, Hungary, Ireland, Italy, Macedonia, Moldova, Netherlands,
                                                    Norway, Poland, Portugal, Romania, Russia, Serbia, Spain, Sweden, Switzerland, Ukraine, United
                                                    Kingdom
         Africa                 768                 Algeria, Cameroon, Congo, Ethiopia, Ghana, Ivory Coast, Kenya, Libya, Madagascar, Mali, Morocco,
                                                    Nigeria, South Africa, Sudan, Uganda, Zambia
         Middle East            487                 Afghanistan, Bahrain, Egypt, Iran, Iraq, Israel, Lebanon, Kuwait, Oman, Qatar, Saudi Arabia, Turkey,
                                                    United Arab Emirates, Uzbekistan, Yemen

     https://med.jmirx.org/2021/3/e28843                                                                              JMIRx Med 2021 | vol. 2 | iss. 3 | e28843 | p. 3
                                                                                                                           (page number not for citation purposes)
XSL• FO
RenderX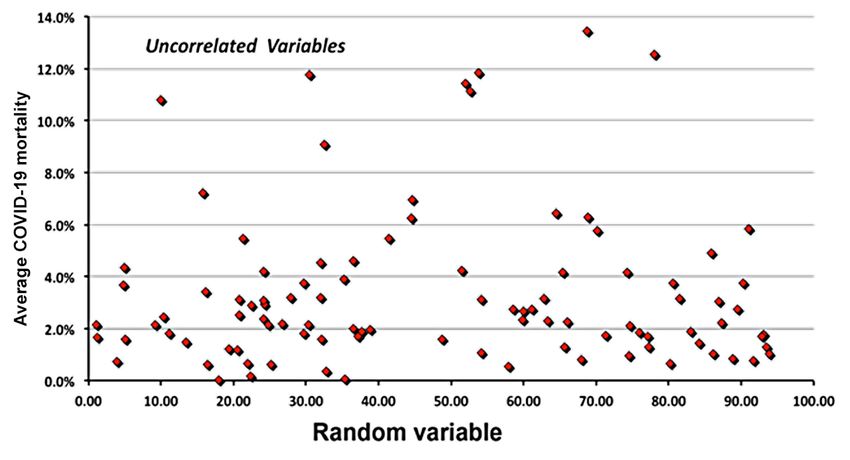
JMIRx Med Barletta
Figure 1. A plot of the variables uncorrelated by construction.
malnutrition and national wealth measured by GDP corrected
Results for purchasing power (GDP-PPP). The relatively strong (0.455)
Examination of Linear Correlations correlation is driven by the high rates of malnutrition in Africa,
Central America, and the less economically advantaged
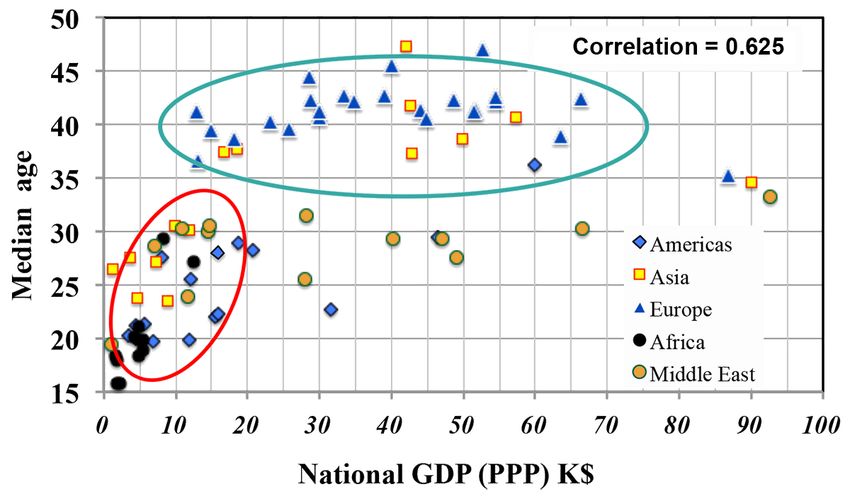
To gain confidence in this statistical approach, one can plot two countries of Asia. No such effect is apparent in Europe.
variables for which one may expect to see a correlation:
GDP-PPP and median age (Figure 2). Here, the linear correlation From the outset of the pandemic, national health authorities
is quite high (0.625). Closer examination of Figure 2 suggests warned the public about the increased risk of mortality for
a limitation of considering only linear correlations. The countries persons 60 years of age and older. Figure 4 shows an early
circled in red show a strong correlation, while those in the green example of the basis for these warnings in the data provided by
ellipses show scarcely any correlation of a nation’s wealth with the UK Office of National Statistics in September 2020 [12]
the age of its population. Clearly, a refinement of the statistical and also in reference [13]. The UK government website notes
approach is needed. Identifying the data underlying each point several caveats: (1) the figures include deaths of nonresidents
with each country’s region in Figure 3 reveals that median age of the United Kingdom; (2) they are based on the date that a
and national wealth are essentially uncorrelated for European death was registered rather than when it occurred; (3) they are
nations but strongly correlated for countries in Africa and Asia. provisional and use the tenth edition of the International
Regional grouping was thus adopted throughout this study. Classification of Diseases for definitions of the coronavirus
(COVID-19). Again, the question arises of why the severity of
To illustrate the utility of this refinement, Figure 3 shows the COVID-19 infection should be a function of age.
correlation between deaths per 100,000 persons due to
https://med.jmirx.org/2021/3/e28843 JMIRx Med 2021 | vol. 2 | iss. 3 | e28843 | p. 4
(page number not for citation purposes)
XSL• FO
RenderX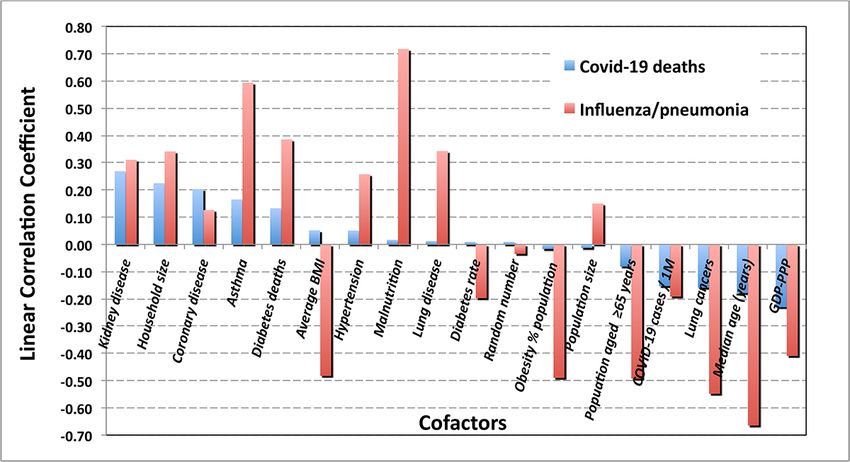
JMIRx Med                                                                                                                                      Barletta

     Figure 2. The plot of GDP-PPP corrected for purchasing power versus median age in countries from the 5 regions under study. GDP(PPP): gross
     domestic product corrected for purchasing power parity; K$: US $1000.

     Figure 3. Correlation of poverty with malnutrition. 1K: 100,000 persons; GDP(PPP): gross domestic product corrected for purchasing power parity;
     K$: US $1000.

     https://med.jmirx.org/2021/3/e28843                                                                        JMIRx Med 2021 | vol. 2 | iss. 3 | e28843 | p. 5
                                                                                                                     (page number not for citation purposes)
XSL• FO
RenderX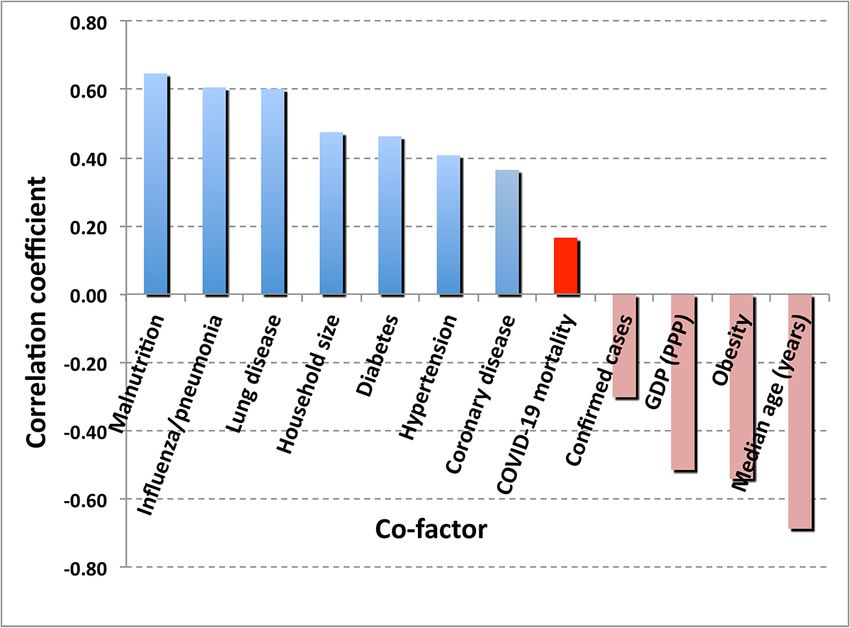
JMIRx Med                                                                                                                                     Barletta

     Figure 4. Deaths attributed to COVID-19 by the UK Office of National Statistics [9,10].

     From these data, one might expect a strong correlation between             One may hypothesize that the “care home effect,” as in, the
     the apparent national case fatality rate and the median age of a           large numbers of deaths seen in nursing homes in Italy, the
     country’s population. Even accepting the hypothesis of                     United Kingdom, and the US state of New York, was more the
     universality for the data in Figure 4, one should first multiply           result of overcrowding and poor hygienic practices compounded
     these rates by the demographics of a nation’s population                   with the general infirmity and the reduced immune function of
     normalized to the UK population grouped into the same age                  nursing home residents than of any extreme dependence of the
     bins. Such a plot (Figure 5) shows a surprising result. The                lethality of COVID-19 on individual, specific, underlying
     overall linear correlation is negative, –0.181, partially due to           medical disorders. The linear correlations of age with potential
     the disparity among the regions: –0.258 for the Americas, 0.052            causal factors, shown in Figure 7, suggest the strength of
     for Asia, 0.141 for Europe, 0.02 for Africa, and –0.608 for the            candidate cofactors to explain the care home effect. In addition
     Middle East and Central Asia.                                              to specific cofactors, the care home effect also reflects a
                                                                                generally very weakened physical condition of many occupants
     Rather than plotting the COVID-19 case fatality rate versus the
                                                                                of care homes, which could render any pneumonia-inducing
     national median age, one might examine the dependence on the
                                                                                disease potentially lethal. The data in Figure 7 show no evidence
     percentage of the population of people aged 65 years or greater.
                                                                                that age alone influences the probability of a person becoming
     In that case, the overall correlation (–0.081) is negative,
                                                                                infected with SARS-CoV-2.
     consistent with reference [14]; however, this is mostly the result
     of regional variations, with a larger but still relatively low             Figure 7 may explain what appears to be a startling result,
     correlation (approximately 0.19) in Europe and Africa.                     namely, the globally negative correlation of the COVID-19 case
                                                                                fatality rate with the age of the national population. The negative
     As a measure of the influence of the age of a population on
                                                                                value is due to the strong correlations between the national
     SARS-CoV-2 contagion, the national rate of confirmed cases
                                                                                median age and the combination of adjusted GDP (0.64),
     of COVID-19 per 1 million persons with respect to the
                                                                                national health care expenditures (0.48), and the WHO Universal
     percentage of the population aged older than 65 years (Figure
                                                                                Health Care Index. Nations with the oldest populations are
     6) displays a moderate correlation of 0.447.
                                                                                generally those that are the wealthiest and in which health care
                                                                                services are the most robust, thus reducing the level of mortality.

     https://med.jmirx.org/2021/3/e28843                                                                       JMIRx Med 2021 | vol. 2 | iss. 3 | e28843 | p. 6
                                                                                                                    (page number not for citation purposes)
XSL• FO
RenderX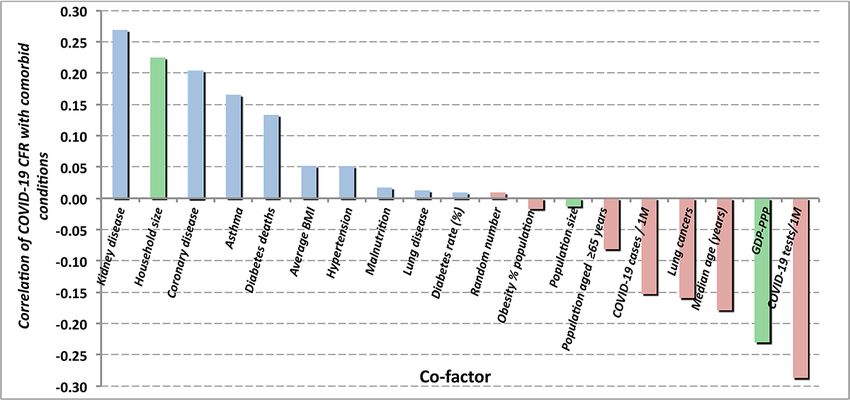
JMIRx Med                                                                                                                                       Barletta

     Figure 5. National median age versus case fatality rate for the 5 regions under study.

     Figure 6. Confirmed COVID-19 cases per 1 million persons as a function of the percentage of the population aged 65 years and older.

     https://med.jmirx.org/2021/3/e28843                                                                         JMIRx Med 2021 | vol. 2 | iss. 3 | e28843 | p. 7
                                                                                                                      (page number not for citation purposes)
XSL• FO
RenderX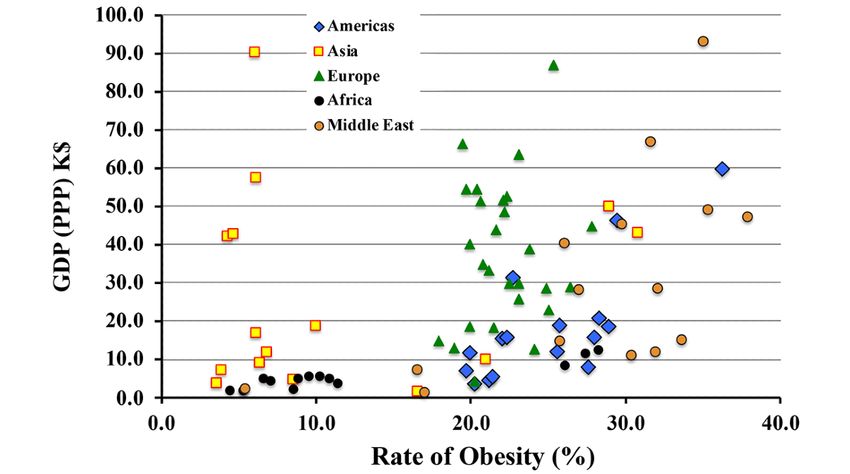
JMIRx Med                                                                                                                                    Barletta

     Figure 7. Correlations of potential risk factors with national median age. GDP: gross domestic product; UHC: Universal Health Coverage; WHO:
     World Health Organization.

     In contrast with infections due to SARS-CoV-2, fatalities from             This result for influenza suggests the hypothesis that because
     influenza-induced pneumonia (Figure 8) are highly correlated               COVID-19 typically presents as a severe respiratory disease,
     (–0.652) with the median age of the population. The correlation            the severity of COVID-19 infection may correlate with the
     also displays a strong regional dependence. The correlation is             incidence of asthma. The global value (Figure 9) is small but
     negative for the same reasons previously explained for                     not negligible (0.165), largely driven by the strong correlation
     COVID-19.                                                                  (0.68) in the Middle East.

     Figure 8. Incidence of influenza-related pneumonia deaths as a function of national median age.

     https://med.jmirx.org/2021/3/e28843                                                                      JMIRx Med 2021 | vol. 2 | iss. 3 | e28843 | p. 8
                                                                                                                   (page number not for citation purposes)
XSL• FO
RenderX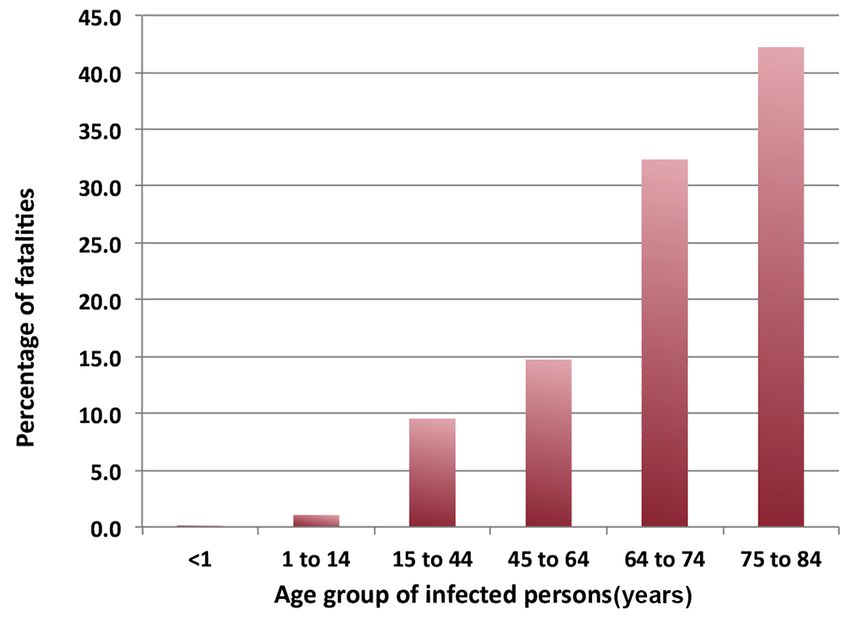
JMIRx Med                                                                                                                                   Barletta

     Figure 9. Correlation of severe asthma with the COVID-19 case fatality ratio. GDP(PPP): gross domestic product corrected for purchasing power
     parity.

     For asthma as a cofactor, the contrast with influenza-related           and body fat percentage varies considerably from country to
     pneumonia is striking. A relatively high overall correlation of         country (10% to 20%).
     0.594 for influenza was observed in all regions. Hence, any
                                                                             The contribution of obesity to the outcome of other pulmonary
     reference to COVID-19 as a “flu-like” infection or as a
                                                                             disorders is significantly different from that of COVID-19, as
     “superflu” is grossly misleading.
                                                                             is displayed in Figure 11. Obesity does have a significant
     The CDC issued a warning early in 2020 that obesity represented         correlation (0.516) with the risk of contracting SARS-CoV-2
     a comorbidity that could potentially lead to severe consequences        infection, although not with the apparent outcome of the
     of a COVID-19 infection. However, once again, the actual                infection. Observation of increased risk of infection (although
     national data (Figure 10) essentially display no correlation            not its outcome) was previously reported in [13]. Reference
     (–0.017) of a country’s COVID-19 case fatality rate with the            [14] reports an increased risk of infection (0.329) for people
     percentage of its population that is considered obese. A better         with chronic kidney disease. That correlation of risk of infection
     metric of national obesity may be the average BMI (in kg/m2)            is not seen in the statistics of this study, which consistently
     of the population. With BMI as the metric of the national               found a temporally increasing negative correlation (–0.046).
     prevalence of obesity, the correlation increases to 0.052, which        However, as shown in Figure 10, this study does confirm an
     is still very small. Moreover, that figure may itself be misleading     increased risk of mortality (0.269) for persons with chronic
     when comparing regions, as the correspondence between BMI               kidney disease who do develop COVID-19.

     https://med.jmirx.org/2021/3/e28843                                                                     JMIRx Med 2021 | vol. 2 | iss. 3 | e28843 | p. 9
                                                                                                                  (page number not for citation purposes)
XSL• FO
RenderX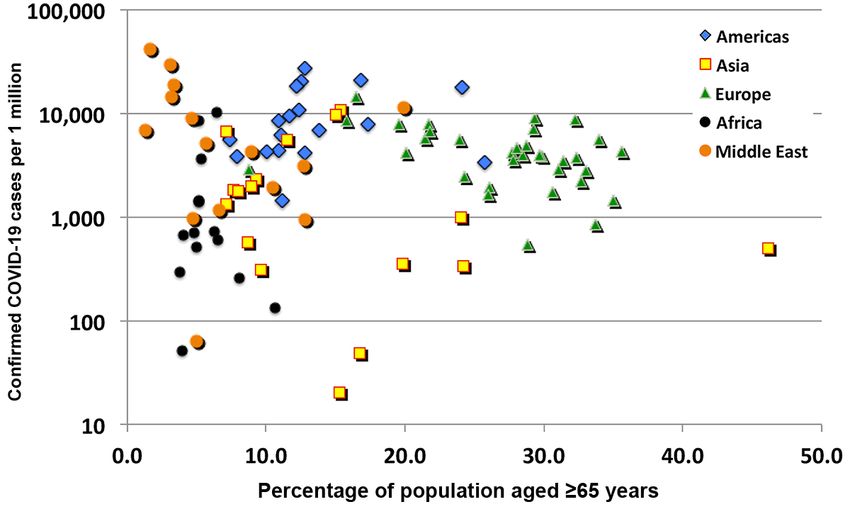
JMIRx Med                                                                                                                                          Barletta

     Figure 10. Summary of linear correlations with national COVID-19 case fatality ratio data. 1M: 1 million; CFR: case fatality rate; GDP: gross domestic
     product.

     Figure 11. Correlations of obesity rates with COVID-19 mortality and other conditions. For most conditions, rates are based on deaths per 100,000
     persons. GDP (PPP): gross domestic product corrected for purchasing power parity.

     One might speculate that as a chronic respiratory disorder                  their effects on patients with underlying conditions, influenza
     involving pulmonary airways, asthma would increase the                      and COVID-19 are very different diseases.
     seriousness of the consequences of COVID-19 and its induced
                                                                                 Another early warning to persons with underlying conditions
     pneumonias; this analysis shows no such significant correlation
                                                                                 concerned DM. That suspicion is echoed by the strong increase
     (0.053). Examining the correlation of COVID-19 mortality with
                                                                                 of incidence of diabetic conditions with age. Whether one
     other lung diseases also showed a very small correlation (0.013).
                                                                                 measures the incidence of diabetes by deaths due to diabetes or
     In contrast, the relationship of influenza-induced pneumonias
                                                                                 to the reported national rates of diabetes in adults (20-79 years
     with asthma and other lung diseases presents correlations that
                                                                                 of age), the correlation with COVID-19 mortality is similarly
     are quite high, 0.594 and 0.348, respectively. With respect to
                                                                                 low (0.109). In otherwise healthy persons, diabetes does not

     https://med.jmirx.org/2021/3/e28843                                                                           JMIRx Med 2021 | vol. 2 | iss. 3 | e28843 | p. 10
                                                                                                                         (page number not for citation purposes)
XSL• FO
RenderX
JMIRx Med Barletta
appear to be a significant risk factor with respect to the serious poor health care management played a very large role in the
complications of infection with SARS-CoV-2. care-home effect.
Figure 10 and Table 2 summarize the linear correlations and Figure 10 shows a strong negative correlation of the case fatality
their time variations, respectively, of the COVID-19 case fatality rate with both COVID-19 tests per million persons and with the
rate with underlying medical and economic conditions (green number of cases per million persons. More tests mean earlier
bars in the figure) considered herein. As the percentage of the detection, more detection of mild and weakly symptomatic
population over 65 years of age correlates at best weakly with cases, and better triage followed by earlier and more effective
the apparent COVID-19 case fatality rate, one may surmise that clinical treatments.
Table 2. Correlations with national values of apparent COVID-19 case fatality rates.
Potential cofactor Correlations with COVID-19 case fatality rate statistics by date
December 30 November 20 October 16
Kidney disease 0.269 0.289 0.176
Household size 0.225 0.228 0.126
Heart disease 0.204 0.194 0.099
Asthma 0.165 0.168 0.091
Diabetes deaths 0.133 0.148 0.05
COVID-19 deaths per 1 million persons 0.092 0.07 0.17
Percentage of the population living in slums 0.090 0.072 0.059
Hypertension 0.051 0.049 –0.011
Influenza/pneumonia 0.034 0.040 –0.020
Malnutrition 0.017 0.002 –0.037
Lung disease 0.013 0.024 –0.112
Random number 0.009 –0.024 0.026
Percentage of the population with diabetes 0.009 0.046 –0.043
Population –0.013 0.000 –0.014
Percentage of the population with obesity –0.017 –0.006 0.014
Percentage of the population aged ≥65 years –0.081 –0.103 0.028
COVID-19 cases per 1 million persons –0.153 –0.163 –0.086
Health care expenditure –0.155 –0.143 –0.02
Lung cancers –0.159 –0.179 –0.098
Life expectancy –0.163 –0.152 –0.055
Median age –0.179 –0.191 –0.074
World Health Organization Universal Health Coverage index –0.197 –0.168 –0.076
Percentage of the population living in cities –0.197 –0.177 –0.121
Adjusted gross domestic product –0.23 –0.215 –0.119
COVID-19 tests per 1 million persons –0.287 –0.257 –0.111
coronary disease with deaths due to influenza and its associated
Cross-Correlations and Multivariate Analysis pneumonia yields a stronger correlation of 0.359. Replacing
Before investigating cross-correlations for root causes, one hypertension with asthma in the DM, hypertension, and coronary
should perform a multivariate analysis of the COVID-19 case disease trio reduces the coefficient of multivariate correlation
fatality rate against a common trio of risk factors commonly for COVID-19 mortality to 0.121. In contrast, analogous analysis
found in patients in nursing and convalescent homes–namely for influenza increases the multiple correlation coefficient to
DM, hypertension, and coronary disease. For that trio, the 0.627, demonstrating once again (see Table 3) that influenza
coefficient of multiple correlation is 0.171, which is not and COVID-19 are very different diseases.
negligible but is unlikely to be the root cause of the care home
effect. Computing the correlation of DM, hypertension, and Other calculations of multivariate correlations with the apparent
national mortality rates of COVID-19 are presented in Table 4.
https://med.jmirx.org/2021/3/e28843 JMIRx Med 2021 | vol. 2 | iss. 3 | e28843 | p. 11
(page number not for citation purposes)
XSL• FO
RenderXJMIRx Med Barletta
Table 3. Multivariate correlations for a trio of input variables: diabetes mellitus, hypertension, and coronary disease.
Output variable Regression coefficient Pearson r values
Diabetes mellitus Hypertension Coronary disease
COVID-19 0.123 0.035 0.053 –0.041
Influenza/ pneumonia 0.439 0.386 0.147 0.247
Table 4. Multivariate correlations with national COVID-19 mortality data.
Multiple variables Regression coefficient Pearson r values
Gross domestic product and household size 0.07 –0.059, 0.056
Obesity and diabetes 0.035 0.035, –0.071
Influenza and lung disease 0.117 –0.064, –0.148
Diabetes, heart, and hypertension 0.123 0.035, 0.053, –0.041
Median age and number of cases 0.138 0.004, –0.137
Influenza deaths and diabetes 0.107 –0.064, 0.035
Influenza deaths and hypertension 0.068 –0.064, –0.041
Obesity, asthma, and diabetes 0.142 0.035, 0.053, 0.035
most influence. Already, in the case of contagion, regional
Cross-Correlations differences represent a substantial fraction of the apparent effect.
The previous section argues and Figure 12 illustrates that there The regional differences could be due to factors such as national
is a striking contrast between the correlations of COVID-19 median age, or they may be influenced by national wealth
with those of influenza/pneumonia with respect to other potential reckoned in terms of per capita GDP-PPP, as shown in Figure
underlying conditions. 13.
Although obesity appears to be correlated with SARS-CoV-2 As is the case with asthma, DM (Figure 14) shows significant
contagion, it appears uncorrelated with the outcome of correlations with several medical and economic conditions,
COVID-19 infections, contrary to the findings of reference [15]. such as age, household size, and mortality due to
Understanding the correlations of obesity calls for a deeper look influenza/pneumonia. Once again, no correlation with
at the relationship of obesity with the conditions that show the COVID-19 mortality (red bar) is evident.
Figure 12. Contrast between correlations of COVID-19 with influenza-induced pneumonia. GDP: gross domestic product.
https://med.jmirx.org/2021/3/e28843 JMIRx Med 2021 | vol. 2 | iss. 3 | e28843 | p. 12
(page number not for citation purposes)
XSL• FO
RenderXJMIRx Med Barletta
Figure 13. Correlation of regional wealth with obesity. GDP(PPP): gross domestic product corrected for purchasing power parity; K$: US $1000.
Figure 14. Correlations of national rates of diabetes mellitus with other medical and economic conditions. The red bar represents the correlation with
COVID-19 mortality. GDP (PPP): gross domestic product corrected for purchasing power parity.
large, ranging over one order of magnitude, as illustrated in
Regional Analysis Figure 15.
A key assumption of this study is the high degree of country
dependence of the COVID-19 case fatality rate. Even though The size of the regional data sets is obviously much smaller and
the case fatality rate has fallen dramatically in many countries the uncertainties in computed correlations are much higher than
with rates originally greater than 10%, after nearly one year of those of the aggregated world data. However, examining the
the pandemic, the disparity by country and by region remains regional dependence of the COVID-19 case fatality rates on the
most commonly cited comorbidities is instructive. (See Table
S1 of Multimedia Appendix 1.)
https://med.jmirx.org/2021/3/e28843 JMIRx Med 2021 | vol. 2 | iss. 3 | e28843 | p. 13
(page number not for citation purposes)
XSL• FO
RenderXJMIRx Med Barletta
Figure 15. Average case fatality rate by country and region. CFR, case fatality rate; UAE: United Arab Emirates.
influence (–0.446) on the rate of deaths due to malnutrition.
Factors Related to National Economics and Public That observation is hardly surprising. One might also ask
Health Policies whether per capita GDP-PPP would have a similar impact on
The differences in the magnitudes, outcomes, and characteristics mortality due to COVID-19 infections. The distribution of
of the waves of infections among national subregions with COVID-19 mortality with national wealth shows essentially no
roughly equivalent medical factors indicates that economics correlation (–0.059). The politics of poverty does not, of itself,
and public health policies makes a significant difference in the explain the observed national rates of COVID-19 mortality.
severity of SARS-CoV-2 infection. This section examines
The distribution of contagion of SARS-CoV-2 over the global
dependencies on GDP-PPP, average household size, percentage
data set is noticeable and positive (0.299). However, as shown
of the population living in slums, percentage of the population
in Figure 16, that value is entirely driven by the strong
living in cities, health expenditures per capita, and the WHO
dependence of the rising contagion on rising income in African
UHC index.
countries. If one removes the African countries from the sample,
Figure 3 has already shown an example of economic impact on the correlation disappears (0.028).
medical outcomes; the per capita GDP-PPP has a strong
Figure 16. (a) The distribution of COVID-19 cases with national GDP-PPP. (b) The degree of urbanization with increasing GDP. GDP-PPP: gross
domestic product–purchasing power parity; K$: US $1000.
The differing behavior in Africa, which can be observed in and apparent COVID-19 mortality) is presented in Table 5. As
Figure 16 (a), may be due to the increase in urbanization with the mortality rate varies in time and seems to decline as the
increasing national wealth. One might further suspect that the pandemic progresses (at least in the northern hemisphere), the
increase in urbanization is also likely to increase the fraction of mortality rate was benchmarked on December 30, 2020. The
the national population living in slums. In fact, the percentage surprising negative correlation in contagion with the percentage
of people living in slums actually decreases with the urbanized of the urban population living in slums is likely due to the trend
fraction of the population. in Africa that the smaller the fraction of the population living
in cities, the more likely it is that they live in slums (World
The correlation of economic and policy factors with contagion
Bank data).
(measured in confirmed COVID-19 cases per 1 million persons
https://med.jmirx.org/2021/3/e28843 JMIRx Med 2021 | vol. 2 | iss. 3 | e28843 | p. 14
(page number not for citation purposes)
XSL• FO
RenderXJMIRx Med Barletta
Table 5. Correlations of economic and political factors with numbers of cases of COVID-19 infection (contagion) and apparent COVID-19 mortality.
Factor Correlation
Contagion Mortality
Percentage of population living in cities 0.476 –0.085
Testing for COVID-19 0.438 –0.099
Gross domestic product–purchasing power parity 0.32 –0.059
World Health Organization Universal Health Coverage index 0.303 –0.02
Health spending 0.24 0.046
Household size 0.172 0.056
Percentage of urban population living in slums –0.407 0.041
An examination by region of the impact of economic cofactors with testing results from the obvious fact that the more one
in the COVID-19 case fatality rate is shown in Figure 17. The looks, the more one sees. The correlation of contagion with the
negative correlations with national wealth and with national percentage of urban population is due to the cross-correlation
health care expenditures are to be expected. Nonetheless, these of GDP with percentage of urban population (0.648) and the
effects are weaker in Africa than in other regions. More detailed high cross-correlation of urban population with testing for
investigation of these effects would require examination of COVID-19 (0.497). The values for average health care
underlying conditions on a country-by-country basis. expenditures and the UHC index of the WHO are similarly
explained. The data that underlie the value of case fatality rate
The correlation with respect to GDP is explained by the
versus the percentage of the urban population that live in slums
correlation of the GDP with the percentage of the population
appears in Figure 18.
aged over 65 years. The substantial correlation of contagion
Figure 17. The impact of economic cofactors on case fatality rates, showing a strong variation by region. GDP: gross domestic product; UNC: Universal
Health Coverage; WHO: World Health Organization.
https://med.jmirx.org/2021/3/e28843 JMIRx Med 2021 | vol. 2 | iss. 3 | e28843 | p. 15
(page number not for citation purposes)
XSL• FO
RenderXJMIRx Med Barletta
Figure 18. Correlation of COVID-19 mortality with the percentage of the urban population living in slums. The 3 outlying nations are identified.
Index” proposed by J Han [17]; however, that metric would
Discussion require genetic sequencing of large, representative samples of
Although this study covering statistics from countries with individuals over a broad range of countries. Consequently, at
approximately 70% of the world’s population confirms the early present, the possibility that such a database of immune system
clinical observation that infection with SARS-CoV-2 presents readiness will be generated seems highly doubtful.
an increased risk to persons over the age of 65 years, it does not Governmental actions can reduce the consequences of
support the suggestions offered by government agencies early SARS-CoV-2 infection. Comparing the cases of Germany and
in the pandemic that the risks are much greater for persons with Italy may be instructive in this regard. By mid-October 2020,
certain common potential comorbidities. Many of the early Italy had 150% of the numbers of confirmed cases of COVID-19
deaths of older patients early in the pandemic occurred in in Germany [10]. However, the case fatality rate in Italy was
circumstances that likely promoted rather than impeded roughly triple that in Germany. In early 2020, Germany had
contagion among persons already in a generally poor state of established an extensive network of triage and early treatment
health, likely accompanied by compromised immune functions. centers outside of hospitals. Germany also moved quickly to
Reference [7] and the analysis of Koff and Williams [16] secure adequate supplies of personal protective equipment [18].
provide plausible explanations for these findings. Namely, the Hence, infected patients were identified early in the course of
virulence of COVID-19 in older people is strongly driven by the disease and were treated in a manner that did not overwhelm
the decrease in adaptive and innate immune responses with the central intensive care facilities in hospitals, as happened in
aging. Koff and Williams recommend that more longitudinal the Italian region of Lombardy.
studies be performed in aging populations, including assessing A similar lesson may come from comparing the experience in
the potential of a decrease in the efficacy of vaccines as being the United States in California and New York through the fall
“critical to the future of global health.” of 2020. The early lockdown in California more than doubled
Many persons who object to strict measures to prevent the the duration of the first wave of infections compared with New
spread of SARS-CoV-2 commonly claim that COVID-19 is York, leading to 60% more cases in California; however, the
similar to influenza, is only slightly more lethal, and should be death rate in California was half that in the State of New York,
treated in the same manner as influenza as a matter of public where medical resources were badly stressed [10].
policy. In fact, comparing the severity of medical outcomes of At the data cutoff date of this study, authoritative statistics on
COVID-19 with those caused by influenza strains and their a worldwide, country-to-country basis were not publicly
resulting pneumonias displays dramatic differences. available to evaluate the effectiveness of either prevention or
Promulgating the idea that COVID-19 is a “flu-like disease” treatment modalities. However, clinical trials of multiple
spreads gross misinformation, to the detriment of public health vaccines had been completed with highly promising results.
worldwide. Also unavailable over the full range of those countries included
A broader comparative assessment of SARS-CoV-2 and in this analysis are the full range of statistics related to
influenza strains against an overall measure of immune system COVID-19 disaggregated with respect to sex. When and if such
responsiveness to infection would require a global database of data become available, expanding the analysis with respect to
an appropriate metric. One potential candidate is the “Wellness
https://med.jmirx.org/2021/3/e28843 JMIRx Med 2021 | vol. 2 | iss. 3 | e28843 | p. 16
(page number not for citation purposes)
XSL• FO
RenderXJMIRx Med Barletta
sex-based differences in testing, contagion, and mortality would B.1.351, P.1 and B.1.617 began to propagate. Initial evidence
prove useful. suggests that these new strains are somewhat more virulent than
the original strain. Examining the national CFR averaged over
The rollout of large-scale vaccination programs during a time
the duration of the pandemic during early 2021 shows a
when the vaccines are in short supply necessitates schemes for
troubling slight but statistically significant increase in several
prioritizing recipients. If probability of severe illness is a
countries, including the United States. Indeed, based on [10],
primary consideration, then the early guess about the risks
over the period from November 1, 2020, to June 18, 2021, the
connected with potential comorbidities should be replaced with
apparent case fatality rate in the United States looks significantly
data such as those presented here along with detailed clinical
higher (Figure 19) than that before the appearance of the B.1.1.7
evaluations accumulated throughout 2020.
and B.1.617 strains. Similar behavior is observed in the data
A word of caution: Data used in this study were accumulated from Germany and Canada.
before the variants of concern of SARS-CoV-2, B.1.1.7,
Figure 19. The apparent daily case fatality rate in the United States, showing a disturbing increasing trend after the appearance of the B.1.1.7 and
B.1.617 strains. CFR: case fatality rate.
Admittedly, these recent data are much noisier than earlier data of increased susceptibility and physical and psychological stress
through all of 2020 due to the marked decrease in the daily on so-called essential workers, or whether it is a result of some
reports of the number of new cases and deaths. Despite the form of COVID-19–related weariness among large portions of
reduced statistical significance, the trend is troubling. It is too national populations. Differences in virulence of the several
soon to judge whether the increase is a reflection of increased variant strains now circulating will complicate the interpretation
virulence in variants of SARS-CoV-2, whether it is an indication of national data collected in 2021.
Acknowledgments
The author acknowledges his colleagues in the World Federation of Scientists for their encouragement to continue, expand, and
report this research. The author’s work has been completely self-supported, without any outside funding or other material support.
Conflicts of Interest
None declared.
Multimedia Appendix 1
Regional variation of COVID-19 case fatality rate correlations.
[DOCX File , 20 KB-Multimedia Appendix 1]
References
1. WHO Director-General's opening remarks at the media briefing on COVID-19 - 11 March 2020. World Health Organization.
2020 Mar 11. URL: https://www.who.int/director-general/speeches/detail/
who-director-general-s-opening-remarks-at-the-media-briefing-on-covid-19---11-march-2020 [accessed 2021-07-27]
2. COVID-19: people with certain medical conditions. US Centers for Disease Control and Prevention. 2020 Aug 14. URL:
https://www.cdc.gov/coronavirus/2019-ncov/need-extra-precautions/people-with-medical-conditions.html, [accessed
2021-07-26]
https://med.jmirx.org/2021/3/e28843 JMIRx Med 2021 | vol. 2 | iss. 3 | e28843 | p. 17
(page number not for citation purposes)
XSL• FO
RenderXJMIRx Med Barletta
3. Risk for COVID-19 infection, hospitalization, and death by race/ethnicity. US Centers for Disease Control and Prevention.
URL: https://www.cdc.gov/coronavirus/2019-ncov/covid-data/investigations-discovery/hospitalization-death-by-race-ethnicity.
html [accessed 2021-07-27]
4. Malaria. World Health Organization. URL: https://www.who.int/data/gho/data/themes/malaria [accessed 2021-07-27]
5. Li H, Wang S, Zhong F, Bao W, Li Y, Liu L, et al. Age-dependent risks of incidence and mortality of COVID-19 in Hubei
Province and other parts of China. Front Med (Lausanne) 2020 Apr 30;7:190 [FREE Full text] [doi:
10.3389/fmed.2020.00190] [Medline: 32426363]
6. Risk for COVID-19 infection, hospitalization, and death by age group. US Centers for Disease Control and Prevention.
2020 Aug 18. URL: https://www.cdc.gov/coronavirus/2019-ncov/covid-data/investigations-discovery/
hospitalization-death-by-age.html, [accessed 2021-07-26]
7. Montecino-Rodriguez E, Berent-Maoz B, Dorshkind K. Causes, consequences, and reversal of immune system aging. J
Clin Invest 2013 Mar 1;123(3):958-965. [doi: 10.1172/jci64096] [Medline: 23454758]
8. Mizumoto K, Kagaya K, Zarebski A, Chowell G. Estimating the asymptomatic proportion of coronavirus disease 2019
(COVID-19) cases on board the Diamond Princess cruise ship, Yokohama, Japan, 2020. Euro Surveill 2020;25(10) [FREE
Full text] [doi: 10.2807/1560-7917.es.2020.25.10.2000180] [Medline: 32183930]
9. World Health Rankings. World Life Expectancy. URL: https://www.worldlifeexpectancy.com/world-health-rankings
[accessed 2021-07-26]
10. COVID-19 coronavirus pandemic. Worldometer. 2021 Jul 26. URL: https://www.worldometers.info/ [accessed 2021-07-26]
11. Trading Economics. URL: https://tradingeconomics.com/ [accessed 2021-07-26]
12. Coronavirus (COVID-19) latest insights. UK Office for National Statistics. 2020 Mar 26. URL: https://www.ons.gov.uk/
peoplepopulationandcommunity/healthandsocialcare/conditionsanddiseases/articles/coronaviruscovid19/latestinsights
[accessed 2021-07-26]
13. Ioannidis JP, Axfors C, Contopoulos-Ioannidis DG. Population-level COVID-19 mortality risk for non-elderly individuals
overall and for non-elderly individuals without underlying diseases in pandemic epicenters. Environ Res 2020 Sep;188:109890
[FREE Full text] [doi: 10.1016/j.envres.2020.109890] [Medline: 32846654]
14. de Lusignan S, Dorward J, Correa A, Jones N, Akinyemi O, Amirthalingam G, et al. Risk factors for SARS-CoV-2 among
patients in the Oxford Royal College of General Practitioners Research and Surveillance Centre primary care network: a
cross-sectional study. Lancet Infect Dis 2020 Sep;20(9):1034-1042 [FREE Full text] [doi: 10.1016/S1473-3099(20)30371-6]
[Medline: 32422204]
15. Tamara A, Tahapary DL. Obesity as a predictor for a poor prognosis of COVID-19: a systematic review. Diabetes Metab
Syndr 2020 Jul;14(4):655-659 [FREE Full text] [doi: 10.1016/j.dsx.2020.05.020] [Medline: 32438328]
16. Koff WC, Williams MA. Covid-19 and immunity in aging populations - a new research agenda. N Engl J Med 2020 Aug
27;383(9):804-805. [doi: 10.1056/NEJMp2006761] [Medline: 32302079]
17. Han J. Wellness Index: measuring the readiness of our immune system. J Immunol 2016 May 01;106(1 Supplement):54.33.
18. Emerging COVID-19 success story: Germany’s push to maintain progress. Our World in Data. URL: https://ourworldindata.
org/covid-exemplar-germany [accessed 2021-07-27]
Abbreviations
CDC: US Centers for Disease Control and Prevention
DM: diabetes mellitus
GDP-PPP: gross domestic product–purchasing power parity
UHC: Universal Health Coverage
WHO: World Health Organization
Edited by E Meinert; submitted 15.03.21; peer-reviewed by P Banik, H Akram; comments to author 15.05.21; revised version received
22.06.21; accepted 24.06.21; published 26.08.21
Please cite as:
Barletta WA
Risk Factors of SARS-CoV-2 Infection: Global Epidemiological Study
JMIRx Med 2021;2(3):e28843
URL: https://med.jmirx.org/2021/3/e28843
doi: 10.2196/28843
PMID:
https://med.jmirx.org/2021/3/e28843 JMIRx Med 2021 | vol. 2 | iss. 3 | e28843 | p. 18
(page number not for citation purposes)
XSL• FO
RenderXJMIRx Med Barletta
©William Alphonse Barletta. Originally published in JMIRx Med (https://med.jmirx.org), 26.08.2021. This is an open-access
article distributed under the terms of the Creative Commons Attribution License (https://creativecommons.org/licenses/by/4.0/),
which permits unrestricted use, distribution, and reproduction in any medium, provided the original work, first published in
JMIRx Med, is properly cited. The complete bibliographic information, a link to the original publication on https://med.jmirx.org/,
as well as this copyright and license information must be included.
https://med.jmirx.org/2021/3/e28843 JMIRx Med 2021 | vol. 2 | iss. 3 | e28843 | p. 19
(page number not for citation purposes)
XSL• FO
RenderXYou can also read