The Covid-19 Infection in Italy: A Statistical Study of an Abnormally Severe Disease - Preprints
←
→
Page content transcription
If your browser does not render page correctly, please read the page content below
Preprints (www.preprints.org) | NOT PEER-REVIEWED | Posted: 6 April 2020 doi:10.20944/preprints202004.0049.v1

 The Covid-19 Infection in Italy: A Statistical Study of an Abnormally Severe
 Disease

 Giuseppe De Natale1,2,*, Valerio Ricciardi3,4, Gabriele De Luca5, Dario De Natale6, Giovanni
 Di Meglio6, Antonio Ferragamo6, Vito Marchitelli7, Andrea Piccolo6, Antonio Scala8, Renato
 Somma1,9, Emanuele Spina10, Claudia Troise1,2

 1
 INGV, Osservatorio Vesuviano, Naples, Italy
 2
 CNR-INO, Pozzuoli (NA), Italy
 3
 Universitàdella Campania 'L.Vanvitelli', Dept. Medicina Sperimentale, Naples, Italy
 4
 Istituto Nazionale di Fisica Nucleare – Sezione di Napoli, Naples, Italy
 5
 University of Zurich, Dept. Physics, Zurich, Switzerland
 6
 CoronaVerus, Naples, Italy
 7
 Puglia Region Government, Dept. Mobility, Pub. Works, Ecology, Env., Bari, Italy
 8
 Universitàdegli Studi di Napoli "Federico II", Dept. Physics ”Ettore Pancini”, Naples, Italy
 9
 CNR-IRISS, Naples, Italy
 10
 Universitàdegli Studi di Napoli "Federico II", Dept. Neurosciences, Reproductive and
 Odontostomatology, Naples, Italy
 *Correspondence: giuseppe.denatale@ingv.it; Tel.: +39 0816108510

 Abstract
 We statistically investigate the Coronavirus Disease 19 (hereinafter Covid-19) epidemics, which is
 particularly invasive in Italy. We show that the high apparent mortality (or Case Fatality Ratio, CFR)
 observed in Italy, as compared with other countries, is likely biased by a strong underestimation of
 infected cases. To give a more realistic estimate of the mortality of Covid-19, we use the most
 recent estimates of the IFR (Infection Fatality Ratio) of epidemic, based on the minimum observed
 CFR, and furthermore analyse data obtained from the ship Diamond Princess, a good representation
 of a ‘laboratory’ case-study from an isolated system in which all the people have been tested. From
 such analyses we derive more realistic estimates of the real extension of the infection, as well as
 more accurate indicators of how fast the infection propagates. We then point out from the various
 explanations proposed, the dominant factors causing such an abnormal seriousness of the disease in
 Italy. Finally, we use the deceased data, the only ones estimated to be reliable enough, to predict the
 total number of infected people and the interval of time when the infection in Italy could stop.

 1

 © 2020 by the author(s). Distributed under a Creative Commons CC BY license.
Preprints (www.preprints.org) | NOT PEER-REVIEWED | Posted: 6 April 2020 doi:10.20944/preprints202004.0049.v1

 Introduction

 The infection of Covid-19, recently declared pandemic by WHO, represents perhaps one of the
 most serious worldwide emergencies, potentially able to destroy social order and economies and to
 deeply change our lifestyle in the near future. Since the first appearance of this new Coronavirus
 (SARS-CoV-2) (Worldometers, 2020), however, the Covid-19 infection has been treated with very
 mixed feelings: from just a disease a little more serious than a seasonal flu, to a very severe and
 troubling infection. The epidemics was firstly detected in China, in the city of Wuhan, at the end of
 December 2019. After some interlocutory days, the government of China showed serious concern
 and implemented very severe measures in the Hubei province, the centre of the epidemics, to
 contain the epidemic spreading of the infection. About 45 days after the first detection (mid-
 February 2020), the epidemics started to seriously affect several other countries (South Korea
 among the firsts, being a rather natural candidate that borders with China). Since the end of
 February, it flared up in Italy and Iran for less clear reasons and, since mid-March 2020, the
 epidemics has spread all over Europe, in the USA, and many other countries (Worldometers, 2020).
 Here we want to focus on the Covid-19 epidemic in Italy that shows some peculiar features,
 distinguishing its evolution from the one observed in other countries. The epidemic appears very
 aggressive, both in terms of spread rate and mortality, which are however very uncertain parameters
 for this new virus. In Italy, the infection is mainly focused in the Lombardia Region and the area
 around the Po river. The most affected regions are Lombardia, Emilia-Romagna and Veneto, which
 also represent the richest and more productive parts of Italy. In Italy the infection grew very fast,
 overcoming South Korea in the number of infected people as early as 30 March 2020 reaching
 101.739 total infections. Moreover, it showed an average Case Fatality Ratio (CFR) over 11%, well
 above any other country and more than double with respect to the Hubei Region in China, where
 the new virus first appeared, and where CFR was significantly higher than in other parts of the
 China and higher than several countries in the world.
 In this paper, we will show statistical analyses of data associated to the Italian Covid-19 epidemics.
 The aim is to estimate a possible slowdown of the infection and also to verify our statistical
 predictions in relation with the severe containment measures taken by the Italian Government. We
 discuss alternative explanations for the very high CFR observed. To confront with the important
 problem of determining the true mortality (Infection Fatality Ratio, IFR) of the epidemics, we use
 the study of an isolated, well-calibrated test case, represented by the infection spread on the
 Diamond Princess cruise ship. Mortality (IFR) estimates obtained within the Diamond Princess are
 an ‘unbiased’ value, not affected by the underestimation of the number of infected people; also IFR

 2
Preprints (www.preprints.org) | NOT PEER-REVIEWED | Posted: 6 April 2020 doi:10.20944/preprints202004.0049.v1

 values computed by the University of Oxford (Oke and Henegan, 2020) were checked. Using
 various IFR estimations, we predict a much larger number of infected people in Italy with respect to
 the official one, suggesting that the CFR highly overestimates true mortality. We also discuss the
 likelihood of alternative hypotheses, often claimed to explain the high impact of Covid-19 in Italy,
 based on the influence of old average age of population, high antibiotic resistance, high number of
 smokers, pollution in the Po plain (e.g. Oke and Henegan, 2020). Finally, we identify the best data
 set to analyse the statistical evolution of the epidemics in Italy, also comparing it with its
 prototypical behaviour obtained from the China dataset, to try to forecast the time of saturation of
 the infection.

 The Covid-19 in Italy

 The Covid-19 epidemic in Italy presents some peculiarities that make it very intriguing to analyse
 and understand. Initially it was thought that two independent focuses started in Codogno (15.962
 inhabitants, Lodi province, Lombardia Region) and Vo’ Euganeo (3.416 inhabitants, Padua
 province, Veneto Region) towns, but it is now generally understood that the virus started circulating
 earlier in the whole north of Italy. The epidemic rapidly blew up all over Italy, but particularly
 around the Po Valley, in Lombardia, Veneto and Emilia-Romagna. These Regions are the richest
 ones in Italy, for their industries, agriculture in the Po Valley and international commerce. The
 Lombardia and the Po Valley, the most hit by the infection, are also the most polluted areas in Italy
 and probably also the most polluted in the whole Europe by the fine air particulate matter (PM10,
 PM2.5) and Ozone (Martuzzi et al., 2006; Stafoggia et al., 2009).
 The beginning and evolution of Covid-19 infection in Italy, and more specifically in Lombardia
 Region, is from many points of view anomalous and highly lethal, with respect to all other countries
 worldwide, including China where the infection was born. Although all the media (and also many
 specialists interviewed by media) highlight the velocity of infection in Italy as ‘exponential’, the
 number of infected people has never followed an exponential distribution, except in the very first
 few days. Figure 1a shows the number of recorded infections as a function of time (in days since 24
 February 2020) in a semi-logarithmic scale.

 3
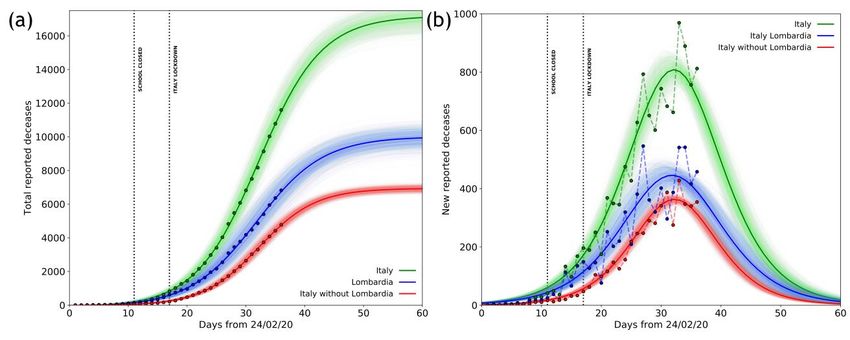
Preprints (www.preprints.org) | NOT PEER-REVIEWED | Posted: 6 April 2020 doi:10.20944/preprints202004.0049.v1

 Figure 1. Total Covid-19 reported cases in Italy from 24 February to30 March 2020 according to
 Protezione Civile (black dots) with the logistic (blue solid line), exponential (red solid line) and
 cubic (green solid line). Dotted black vertical lines mark the dates of Italian school lockdown and
 Italy total lockdown; the asterisk indicates that the exponential and cubic fit are based on data til
 March, 12th: score from AIC test (not reported) on the logistic, cubic and exponential fit shows
 higher reliability of the first two after this date, and for the logistic against the cubic after 25March
 2020a) fits obtained from the data in semi-logarithmic scale; B) same data and fits shown in linear
 1+
 scale. Fit parameters: Logistic( = ; = (135 ± 2) ∙ 103 , = −1.4 ± 0.2, = 170 ±
 1+

 9, = 0.174 ± 0.003) ; Exponential ( = ; = 410 ± 30, = 0.2 ± 0.01; = +
 + 2 + 3 ; = −40 ± 20, = 36 ± 8, = −6.7 ± 0.9, = 0.44 ± 0.03).

 It is evident that the distribution is markedly different from a straight line, typical of an exponential
 distribution in such a scale, and it’s rather well fitted by a cubic polynomial, which is much slower
 than an exponential. The cubic polynomial fit and the exponential one present in the figure are both
 carried out using the data up to 18 days from the date of acknowledgment of the first cases (from
 24February to 12 March 2020); starting from that date the cubic fit scores, according to an Akaike
 information criterion (AIC) test, better than the exponential one. In the figure we also show the fit
 obtained from a logistic function for comparison; logistic fit scores (AIC test; Akaike, 1974)
 become better than the exponential one from 12March2020 and definevely better of the cubic one
 after 25March 2020. Figure 1b shows the same quantity in a linear scale, together with the three
 mentioned fitting functions.
 Although the number of infected people is the main parameter taken into account by the authorities,
 and the most highlighted by media, its real value is largely uncertain and surely underestimated. In
 fact, it critically depends from the number of laboratory tests made on people to ascertain the

 4
Preprints (www.preprints.org) | NOT PEER-REVIEWED | Posted: 6 April 2020 doi:10.20944/preprints202004.0049.v1

 infection, which is anyway limited and very small as compared with the number of inhabitants.
 Furthermore, the procedure to test people are highly variable within the different Regions of Italy
 and have changed over time in the last weeks; because of this inconsistency, this number is
 statistically very inhomogeneous and unfit to to interpret the actual evolution of the infection.
 The number of tests in Italy, highly fluctuating but generally increasing in time except in the last
 days, ranged from about 2.427 (27 February 2020) to 26336 (21 March2020), and decreased again
 to 25180 (22 March2020) and 17.066 (23 March2020). More recently, it reached a peak value of
 36615 on March 26th but then it decreased in the next days (Il Sole 24 Ore, 2020). A very important
 quantity, namely the CFR, defined as the ratio of number of people deceased divided by number of
 total recorded infections, is extremely high in Italy (about 11%). Such a high value is dominated by
 the mortality in Lombardia, where about 50% of all the Italian infections have been recorded, with a
 CFR of about 16%. CFR is a generally overestimated value of the true mortality (IFR), given the
 likely underestimation of the real number of infection cases (i.e. including asymptomatic and pauci-
 symptomatic cases, which are easily overlooked by the small number of tests). IFR is the parameter
 which measure the percentage of deceases over the total population infected (including the
 generally unknown number of non recorded cases). Table 1 (Oke and Henegan, 2020) reports the
 number of infections, deaths and CFR observed in several countries in the world as of 30
 March2020. It is possible to note that the mortality rate for different countries is very variable,
 going from a minimum of 0.4% (i.e. Australia, Israel) to a maximum of 11.3% in Italy.

 Country Cases Deaths CFR (%)
 Lombardia (Italy) 42.161 6.818 16,.1
 Italy 101.739 11.591 11,3
 Spain 87.956 7.716 8,77
 Netherlands 11.750 864 7,35
 France 44.550 3.024 6,78
 Iran 41.495 2.757 6,64
 UK 22.141 1.408 6,35
 Belgium 11.899 513 4,.31
 China 81.518 3.305 4,.05
 Sweden 4.028 146 3,.62
 Denmark 2.577 77 3,.53
 Japan 2.178 57 2,61

 5
Preprints (www.preprints.org) | NOT PEER-REVIEWED | Posted: 6 April 2020 doi:10.20944/preprints202004.0049.v1

 Switzerland 15.922 359 2,.25
 USA 16.3788 3.141 1,91
 Ireland 2.910 54 1,.80
 South Korea 9.661 158 1,.63
 Turkey 10.827 168 1,.55
 Canada 7.448 89 1,19
 Austria 9.618 108 1,12
 Portugal 6.408 140 1,11
 Germany 66.885 645 0,96
 Norway 4.445 32 0,71
 Australia 4.460 19 0,42
 Israel 4.695 16 0,34

 Table 1. Numbers of recorded infected people and deaths in several countries, as on March 30th
 2020. Also indicated is the CFR (Case Fatality Ratio) defined as the ratio between the number of
 deaths and the number of recorded cases.

 Several observations are however around 1-2% (Germany, USA, Austria, Portugal, Ireland, etc.). It
 appears evident, therefore, that the CFR of Italy, and even more of Lombardia Region, is absolutely
 extreme when compared to any other country. This CFR is more than double of the CFR obtained
 in China, where the epidemic first appeared. Therefore, besides CFR, it is important to obtain a
 reasonable estimation of the IFR already during the epidemic spread, to understand the real hazard
 of the disease and/or to determine the real amount of infected people.

 6
Preprints (www.preprints.org) | NOT PEER-REVIEWED | Posted: 6 April 2020 doi:10.20944/preprints202004.0049.v1

 The IFR for Covid-19 and the mortality in Italy

 The problem of unbiased estimation of the IFR for Covid-19 is complicated by the complex
 laboratory procedures that are necessary to identify the infected cases, ultimately limiting the total
 number of tested individuals. Since the IFR is the ratio between the number of deceased due to the
 disease and the total number of infected, the CFR, which is computed on the number of ‘known’
 infected is an upper limit of IFR. Normally, CFR (and hence IFR) should be determined at the end
 of epidemic, because decease occurs at the end of the epidemic cycle, delayed with respect to the
 infection. Usually, at the very beginning of an epidemic, the CFR can be underestimated just
 because the outcome of the disease (recovered or deceased) has not yet been reached. For Covid-19,
 however, it was noted in China (and in South Korea too) that CFR was generally higher in the first
 phase of the infection spreading. A further problem is that the amount of underestimated infected
 cases is generally variable and could become progressively more critical as the real number of
 infected rapidly rises with time, while the number of tests remains stationary. Furhtermore, mass-
 testing in the village of Vo’ Euganeo suggested that the number of asymptomatic persons infected
 by the Covid-19 is at least 50% (La Repubblica, 2020). From Table 1 we observe that each country
 has a very variable CFR associated to the Covid-19 infection. Since the IFR is intrinsically
 overestimated by the CFR, presuming the virus strain is the same in every country, we can assume
 the minimum value of the observed CFR as the minimum upper limit for IFR. Following this
 procedure, the University of Oxford used one of the minimum CFR values (around 0.4%), namely
 from Israel, Australia and recently also Iceland, and to properly account for the undetected
 asymptomatics, halved it to obtain an IFR = 0.2% (Oke and Henegan, 2020). On the other hand,
 Italian CFR is very similar to what is observed in hospital casistic (11%) (Chen N. et al, Lancet
 2020), which attest the attitude to test especially in-hospital and severe cases, being unaware of
 mild and asyntomatic patients.
 For the Covid-19 epidemics, moreover, there is an independent way to obtain a rather unbiased
 estimate of IFR using the only ‘laboratory-like’ case study: the Diamond Princess, the cruise ship
 anchored in the port of Yokohama from February 4th to March 2nd. Here, all the 3711 passengers
 and crew were tested and 712 (19.2%) persons had positive test results. Of these, 331 (46.5%) were
 asymptomatic at the time of testing, a similar value to the one obtained in Vo’ Euganeo. Among
 381 symptomatic patients, 37 (9.7%) required intensive care, and 9 died (Moriarty L.F. et al., 2020).
 Because the Diamond Princess is a perfectly isolated case in which all the people have been tested,
 the total number of infected is perfectly known and we can assume that IFR=CFR. The crude IFR
 computed from the Diamond Princess is then 1.3%. Because this number is statistically affected by

 7
Preprints (www.preprints.org) | NOT PEER-REVIEWED | Posted: 6 April 2020 doi:10.20944/preprints202004.0049.v1

 a rather large uncertainty due to the small number of deceased, we can then assume that the IFR of
 Covid-19 is less than 1.3%; indeed, the observation of a CFR significantly smaller than 1% in some
 countries (i.e. Australia, Norway, Israel) indicate that lower values are more probable than larger
 ones. In the light of such derived mortality range, it appears very abnormal the observed CFR in
 Italy (11.3%), and even more the CFR in the Lombardia Region (16.1%).
 In the following, we will try to point out the possible explanations for such an extremely anomalous
 outcome. We will, again, assume that the virus strain is the same in every country, since there are
 not contrary evidences till now. The first, more obvious reason to explain such a high mortality, is
 to hypothesize that the number of infected cases is substantially underestimated. A clear sign of this
 is the fact that mortality increases during time, from around 2% at the beginning (20 February 2020)
 to 11% on 30 March2020. During this period the number of detected cases rose from few units to
 around 100.000, whereas the daily number of laboratory tests changed from few hundreds to about
 30.000.
 Besides the CFR, which is only linked to the recorded infection cases, what is really interesting to
 understand is a ‘local’ IFR estimation for Italy, in order to derive the real total number of infected
 people. Lacking evidence for the existence of a different virus strain, more aggressive and lethal in
 Italy, we firstly assume that IFR is the same as in other places, and a distinctive trait of this
 epidemic. We could then choose between the University of Oxford estimate of IFR=0.2% or the
 Diamond Princess laboratory-like estimation of IFR=1.3%. If the extreme mortality observed would
 be only due to the underestimation of the number of infected people, assuming a ‘true’ IFR ranging
 between 0.2% and 1.3%, to correct for the Italian 11.3% CFR, we should multiply, respectively, by
 56.5 or by 8.7 the official number of infected cases (101.739 on 30 March 2020); the resulting
 number would then range between about 885.000 and 5.7 million infected people.
 We cannot exclude, however, the true IFR in Italy to be significantly higher than in other countries
 because of several concurrent reasons. For instance, the higher average age of Italian people has
 often been indicated as a possible explanation for the high Covid-19 CFR. Among all the countries
 of the world, Italy is actually in the second position for higher average age; however, the first
 position (oldest population) is occupied by Japan, which showed a very low number of infections
 and CFR (see Table 1) so that this possibility appears unlikely.
 Another possible cause of comorbidity could be related to the high level of pollution in Lombardia
 Region that is likely the most polluted region in Europe by fine particulate (PM10, PM2.5) and
 Ozone. As shown in several papers (e.g. Chen et al., 2010; Ye et al., 2016; Chen et al., 2017; Setti
 et al., 2020) there is a correlation between the diffusion of viruses and the pollution by fine
 particulate. Furthermore, exposition to fine powders contributes to enhance the severity for

 8
Preprints (www.preprints.org) | NOT PEER-REVIEWED | Posted: 6 April 2020 doi:10.20944/preprints202004.0049.v1

 respiratory viral infections (Dominici et al., 2006; Ciencewicki and Jaspers, 2007). The incidence of
 fine particulate pollution could hence, in principle, be one of the reasons for the high mortality rate
 observed in Lombardia (and partially in Emilia-Romagna, around the Po Valley). Although an
 effect of this kind of pollution in amplifying the mortality observed for a severe pulmonary disease
 seems reasonable, it is actually very difficult to quantify its incidence. It is also very difficult to
 believe it can be so strong with respect to other highly industrialized areas of Europe (e.g. Germany,
 France, Netherlands, etc.). Moreover, a recent document issued by the Italian Aerosol Society,
 signed by about 60 scientists of various disciplines, rejects various hypotheses (Setti et al., 2020),
 pointing out that there is no clear evidence for a correlation between fine particulate and Covid-19
 disease amplification (Contini et al., 2020).
 Other tentative explanations for the extreme mortality could be the high number of smokers in Italy
 and the antibiotic-resistance of Italian people. Regarding the percentage of smoking people,
 however, Italy’s 23% is lower than the European average, 29% (WHO, 2016); regarding the
 antibiotic-resistance, on the contrary, Italy has actually the most critical position in Europe. Among
 about 33.000 yearly deceases in EU due to antibiotic-resistant bacteria, about 10.000 occur in Italy
 alone (ISS, 2019). Since generally therapies used against the SARS-CoV-2 involve one or more
 antibiotics, this issue could, in principle, result in higher mortality. Also in this case, however, it is
 not easy to quantify this effect, which however appears marginal in seasonal flu, since in this case
 CFR for Italy does not differ too much with respect to other European countries (ISS, 2019).
 Moreover, Covid-19 antibiotics administration aims to avoid bacterial superinfection, whose
 mortality is negligible; so even if there was a more pronounced antibiotic resistance and this
 mechanism would be implied in higher mortality, this would probably account for only a very little
 part of the deaths. The remaining possibility is that the healthcare was unprepared for such an
 emergency due to a respiratory syndrome; actually, we just note that in Italy (60 M people), there
 were, before Covid-19 epidemic, about 5.090 places in Intensive Care Units (ICU); for comparison
 in Germany (82 M people) such places were 28.000. Actually, in terms of number of ICU divided
 by population, Italy occupies the 19th position among 23 European Countries. We observe indeed
 high pressure on ICU by severe/critical cases, mainly in Lombardia, where the number of ICU
 before the crisis was 900; this number increased to over 1.000 during the last weeks, but, as of 30
 March2020, the patients hosted in ICU are more than 1.300. Indeed, already on March 14th, the
 Government of Lombardia declared that available ICU were almost over. Another indication that
 something went wrong during the first phase of management of the infection by the Lombardia
 Hospitals is the very high number (6.414) of infected medical staff (ISS daily Info, March 30th). So,

 9
Preprints (www.preprints.org) | NOT PEER-REVIEWED | Posted: 6 April 2020 doi:10.20944/preprints202004.0049.v1

 the Hospitals could have been the most effective carriers for the epidemic in the first phase in
 Lombardia, when a very fast increase was observed.

 Possible forecast of future behaviour of infection

 In order to forecast the evolution and the end of the Covid-19 epidemic in Italy, we could in
 principle use three kinds of data. The most obvious would be the daily infection data. However,
 such data are particularly unreliable, because too much dependent from the daily number of tests.
 They are generally very variable and inhomogeneous, both from a Region to another, and also in
 time. Since, as we noted, the real number of infected people is likely much higher (orders of
 magnitude) with respect to the sampled one, the inhomogeneous sampling can strongly condition
 the number of infections, making them not useful for a statistical study. Another possible indicator
 of the epidemic evolution is the number of people in ICU. Contrarily to the number of infected, the
 number of people in ICU should be objective, because who has serious breathing problems must
 necessarily be hospitalized in ICU. However, in this phase of the epidemic crisis, this number has
 two major problems: the first one is that ICU places are mostly full, at least in Lombardia which
 dominates the Italian statistics, so not all people requiring them can be allocated. The second
 problem is that the daily numbers given by Italian Civil Protection just mention the total number of
 people hosted in ICUs in that day, and not the daily incremental number. Hence, it is not possible to
 know the real cumulative number of people hosted in ICUs, because we don’t know how many
 people each day came out from them, due to recovering or death.
 The only quantity which has a rather rigorous statistical meaning, then, is the daily cumulative
 number of deceases. We then choose to use this number in order to statistically analyse the
 evolution of epidemic and to predict its end. Obviously, since we are particularly interested in
 determining the time at which the epidemic ends and the total number of infected people cumulated
 at the end of the epidemic, we have to correctly consider the relation of the daily cumulative
 number of deceases with the cumulative number of infected people. The number of deceased people
 is linked to the number of infected one by the IFR=D/I (D= deceased, I=infected); then, correcting
 the number of deceases for the constant factor represented by the inverse of IFR (I/D) gives the
 number of infected people. However, we must also consider that infection and decease are just the
 two temporal limits of the disease: it starts with infection, proceeds with the symptoms, and then
 ends with one of the two possibilities: recovering or death. To account for this, we must consider
 the shift in time between the infection and the decease. For Covid-19, it has been estimated that the
 average time from infection to death is 16 days, with this value being about the median in the

 10
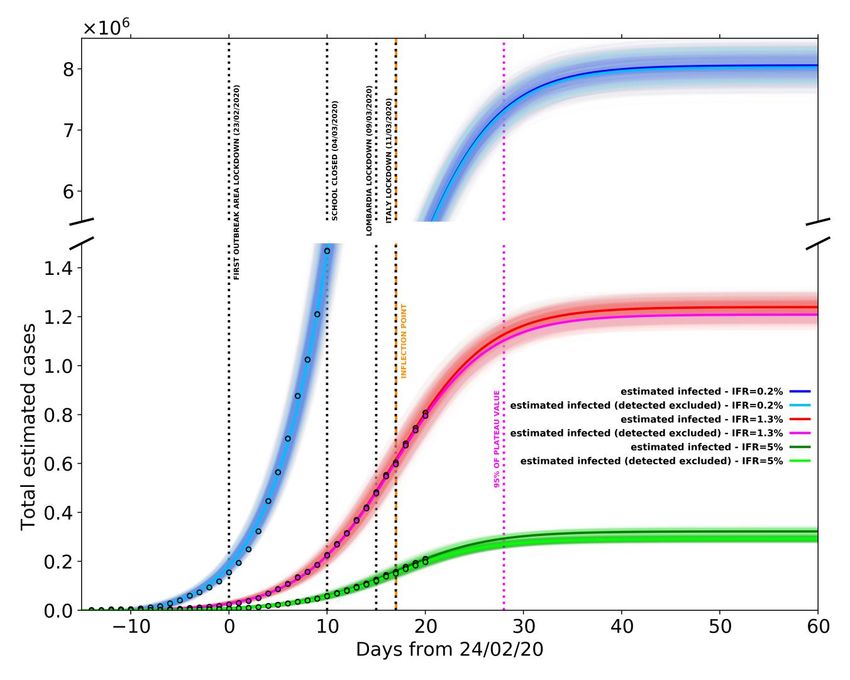
Preprints (www.preprints.org) | NOT PEER-REVIEWED | Posted: 6 April 2020 doi:10.20944/preprints202004.0049.v1

 interval of confidence [13.1 – 17.7] (Jung et al., 2020). With such relations in mind between
 infected and deceased people, we fit the decease data to a logistic function of the general form:
 1+ −
 ( ) = .
 1+ −

 To validate the use of this function, in Figure 2 we show the fit made using a logistic function, to
 the epidemic curve of the cumulative daily number of cases (infections) reported in the whole China,
 Hubei province and China without Hubei province.

 Figure 2. Total Covid-19 cases reported in China from 22 Januaryto25 February2020 according to
 Johns Hopkins University repository. Circles, squares and triangles represent total Covid-19 cases
 registered in China, region of Hubei and China without Hubei, respectively while red, black and
 blue dashed lines are the associated logistic fits. Shaded areas represent the family of curves
 obtainable by making the fit parameters vary within their confidence intervals. Fit parameters:
 1+ −
 Logistic( = ; ℎ : = (811 ± 3) ∙ 102 , = −0.9 ± 0.6, = 53 ± 9, = 0.214 ±
 1+ −

 0.008) ; : = 678 ± 3, = −0.4 ± 1.2, = 100 ± 20, = 0.232 ±

 11
Preprints (www.preprints.org) | NOT PEER-REVIEWED | Posted: 6 April 2020 doi:10.20944/preprints202004.0049.v1

 0.01) ; ℎ ℎ : = (131.6 ± 0.3) ∙ 103 , = −1.4 ± 0.11, = 14 ± 1.4, =
 0.208 ± 0.006).

 It is clear that, after the epidemic spread is over, the whole epidemic behaviour from the start to the
 end can be well described by the logistic function.
 To describe the evolution of the epidemic in Italy, as we explained, we decided to use the
 cumulative daily number of deceases to fit the logistic function, simply because is a much more
 reliable quantity when compared to the total reported cases. Figure 3a-b shows the fits of the
 deceased data reported in Italy (green), Lombardia (blue) and Italy without Lombardia (red), until
 30 March 2000th, with a logistic function and its derivative. From the derivative of the logistic
 function, we observe that the model gives a rather good fit to the data until 26 March 2020 h,
 whereas, after such a date, the number of deceases remains high, so perturbing the data around the
 peak, which does not decrease as the curve would previously predict. However, if we separate the
 data of Lombardia from the rest of Italy we see that the result is much more regular (red line).

 Figure 3. Deceases reported by Italian Civil Protection. a) Total deceases reported in Italy (green
 dots), Lombardia (blue dots) and Italy without Lombardia (red dots). from 24 February to 30 March
 2020 and the corresponding logistic fit in solid lines. Dotted vertical lines mark the dates of Italian
 school lockdown and Italy total lockdown. b) Same as in a) using the new reported deceases and
 fitting the derivate of the logistic curve. Shaded areas represent the family of curves obtainable by
 making the fit parameters vary within their confidence intervals. Fit parameters: Logistic( =
 1+ − ( − ) −
 1+ −
 ; ′ : ( + )2
 ; : = (178 ± 4) ∙ 102 , = −3.1 ± 0.5, = 380 ±

 30, = 0.183 ± 0.004) ; : = (100 ± 4) ∙ 102 , = −2.8 ± 0.5, = 270 ± 30, =

 12
Preprints (www.preprints.org) | NOT PEER-REVIEWED | Posted: 6 April 2020 doi:10.20944/preprints202004.0049.v1

 0.176 ± 0.006); ℎ : = (74 ± 2) ∙ 102 , = −4.0 ± 0.8, = 740 ±
 60, = 0.201 ± 0.004).

 The curves, logistic and its derivative, are in this case both well constrained, and the peak value
 seems to have occurred on March 27th. The anomaly of the data of Lombardia is even more evident
 by considering the data of Emilia Romagna Region, which is the second most affected region
 according to the official reports. Figure 4a-b shows in red the logistic fit (and its derivative) to the
 cumulative (and new) number of deaceases in Emila Romagna.

 Figure 4. Deceases reported by Italian Civil Protection for Emilia Romagna and Calabria regions. a)
 Total, cumulative deceases reported in Emilia Romagna (red dots) and in Calabria (blue dots) from
 24 February to 30 March2020 according to Italian Civil Protection and the corresponding logistic
 fit obtained from the data. Dotted vertical lines mark the dates of Italian school lockdown and Italy
 total lockdown. b) Same as in a) using the new reported deceases and fitting the derivate of the
 logistic curve. Shaded areas represent the family of curves obtainable by making the fit parameters
 vary within their confidence intervals. Fit parameters: Logistic ( =
 1+ − ( − ) −
 ; ′ : ; ; − : = 1970 ± 40, = −3.0 ±
 1+ − ( + )2

 0.6, = 360 ± 30, = 0.197 ± 0.004) ; : = 100 ± 20, = −30 ± 13, =
 (12 ± 3) ∙ 103 , = 0.208 ± 0.006).

 13
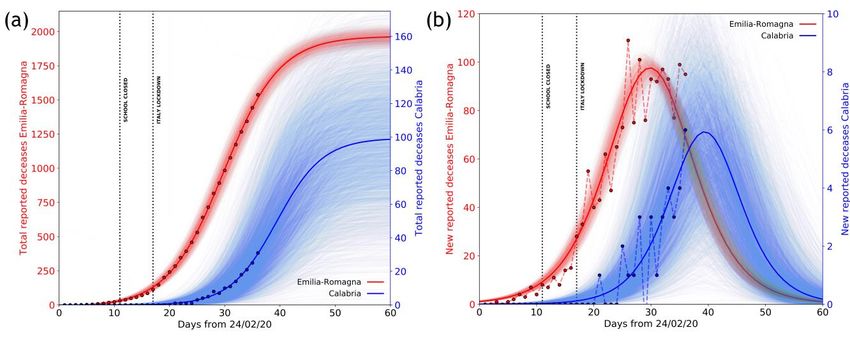
Preprints (www.preprints.org) | NOT PEER-REVIEWED | Posted: 6 April 2020 doi:10.20944/preprints202004.0049.v1

 Also in this case, it is evident the data are well fitted and the curves well constrained. The peak
 value occurs around 24 March 2020, coherently with this region being among the first ones where
 the infection began. Besides Emilia-Romagna, which represents a good example of a region in
 which the epidemic is already ‘mature’ (in the sense that the peak of deceases has already been
 overcome), it is interesting to see what happens in one of the Southern Italy regions, for example
 Calabria, where the infection presumibly started later. This data is also shown in Figure 4 for
 comparison, in blue. It is clear that, since the epidemic here has not reached yet the peak value, the
 curves are poorly constrained and the future evolution is still very uncertain. The difference
 between Emilia Romagna and Calabria curves illustrates well the different behaviour of the
 epidemic in the different Regions, and mainly between the Northern and the Southern ones.
 To estimate now the cumulative number of infections, we decided to use several tentative values of
 IFR: the one computed from the University of Oxford, IFR=0.2%; the one computed from the
 mortality on the Diamond Princess, IFR=1.3%; and one much larger, in case the IFR for Italy
 would be much larger than in other countries, IFR=5%. This high percetange can take into account
 the hospital saturation issues that could have locally amplified the IFR. Such a large range of IFRs
 for conversion is useful to check the final amount of total infected but also to determine the portion
 of unreported cases in respect to the official numbers.
 In order to estimate the total number of infected cases, we take the less-noisy data from Italy
 without Lombardia but we normalize the number of deceases to be equal to the total Italian
 deceases (including the Lombardia ones) at the last date (30 March 2020). This procedure is used in
 order to remove some data scattering introduced by the Lombardia reported number of deceases
 without, on the other hand, underestimating the total number of infected. In Figure 5, we report the
 fit of the estimated amount of total cases in whole Italy with the procedure that we just described.

 14
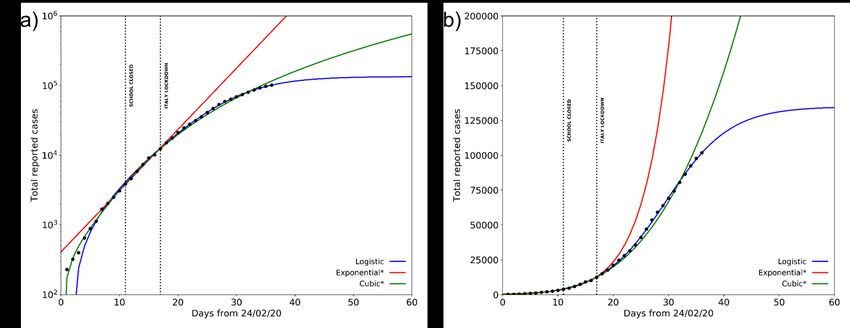
Preprints (www.preprints.org) | NOT PEER-REVIEWED | Posted: 6 April 2020 doi:10.20944/preprints202004.0049.v1

 Figure 5. Estimated (total and undetected) Covid-19 cases in Italy based on three different IFR
 hypotheses: 0.2% (blue and light blue dots), 1.3% (red and pink dots) and 5% (green and light green
 dots). Blue and sky blue solid lines represent logistic fits of total and undetected estimated cases
 with IFR=0.2%, respectively. Red and pink solid lines represent logistic fits of total and undetected
 estimated cases with IFR=1.3%, respectively. Green and light green solid lines represent logistic
 fits of total and undetected estimated cases with IFR=5%, respectively. Black dotted vertical lines
 mark the dates of Codogno area lockdown, Italian schools’ lockdown, Lombardia lockdown and
 Italy lockdown. Dark orange dashed vertical line marks the inflection points of the three curves
 representing the total infected estimates; magenta dotted vertical line marks the 95% of the plateau
 of the three curves. Shaded areas represent the family of curves obtainable by making the fit
 parameters vary within their confidence intervals. Best fit parameters are listed in Table 2.

 15
Preprints (www.preprints.org) | NOT PEER-REVIEWED | Posted: 6 April 2020 doi:10.20944/preprints202004.0049.v1

 The different logistic curves (blue, red and green), present in the figure, are the estimated number of
 contagious people for the different IFR values of 0.2%, 1.3% and 5%, respectively. From these
 values we also subtract the number of cases reported by Italian Civil Protection to estimate the
 number of unreported contagious cases (light blue, pink, light green); the parameters obtained from
 the best fits are reported in Table 2.

 Total estimated cases (IFR 0.2 %)
 K: (81 ±1,6)∙105 m:-3,7 ±0,7 q:860 ±60 r:0,211 ±0,003
 Total undetected cases (IFR 0,2 %)
 K: (80 ±1,6)∙105 m:-3,7 ±0,7 q:860 ±60 r:0,211 ±0,003
 Total estimated cases (IFR 1,3 %)
 K: (137 ± 3)∙104 m: -3,1 ±0,5 n:380 ±30 r: 0,184 ±0,004
 Total undetected cases (IFR 1,3 %)
 K: (132 ± 3)∙104 m: -3,1 ±0,5 n: 380 ±30 r: 0,183 ±0,004
 Total estimated cases (IFR 5 %)
 K: (357 ± 9) ∙103 m: -3,1 ±0,5 n: 380 ±30 r: 0,183 ±0,004
 Total undetected cases (IFR 5 %)
 K: (302 ± 6) ∙103 m: -3,0 ±0,5 n: 370 ±30 r: 0,188 ±0,004
 1+ −
 Table 2, Logistic fit ( = ) parameters for the estimated (total and undetected) Covid-19
 1+ −

 cases in Italy based on three different IFR hypotheses: 0,2% (blue and light blue dots), 1,3% (red
 and pink dots) and 5% (green and light green dots) (see Fig, 5),

 It is evident that the number of reported cases is only a minor fraction of the estimated number of
 contagious people, In particular, for an IFR of 0,2%, 1,3% and 5% we estimate in the whole Italy a
 total number of cases at 30 March2020 (35 days from the first declared red zone) of about 8 milions,
 1,2 M and 300,000, depending on the 0,2, 1,3 and 5 % IFR value, respectively, With a total number
 of reported cases of about 100,000, Italy might be strongly underestimating the total number of
 infected people (including asymptomatic and pauci-symptomatic persons) of 98,75%, 91,6% or
 66,6% depending on the IFR, From the time dependence of the logistic function, we observe that
 the inflections of the respective curves are now exceeded by the data points, whatever the
 conversion factor IFR is used, This probably means that Italy as a whole have already overcome the
 maximum number of new daily infections, In particular, the peak value of the infections should
 have been reached around 11 March 2020, one week after the closing of schools and just after the

 16
Preprints (www.preprints.org) | NOT PEER-REVIEWED | Posted: 6 April 2020 doi:10.20944/preprints202004.0049.v1

 lockdown of Italy, Moreover, our results predict that the point of 95% of the maximum value of the
 best fitting logistic curves has been already reached on the last week of March, and that, within the
 first week of April, the real number of contagious people will be already well within the saturation,
 so that it practically will not increase anymore,
 It is possible that after the epidemic spread in Italy will be over, growth functions different from the
 logistic like Gompertz (1832), Janoschek (1957) or Richards (1959) sigmoids could be more suited
 to describe the epidemic spread because they allow their derivative to be non-symmetric and
 therefore can result in a more generalized integral function, A non symmetric integral curve, with a
 slower derivative in the descending part after the peak, could result for instance by a differential
 shift of epidemic curves for different Regions (and particularly for the Southern ones), due to the
 delay of the infection starting with respect to Lombardia, the first nucleus of infection spreading,
 When compared to the logistic function, a typical variation of these more generalized growth
 functions is the shift of the inflection point a few days later and the increase of the saturation value,
 Because here we are highlighting an extreme underestimation of the reported cases in Italy already
 with a simple logistic function, our main result would be even more inflated by the use of other
 growth functions, Nevertheless, despite this inherent limitation of the logistic function, as of 30
 March2020, data which overcome the inflexion point are reasonably well constrained, also if they
 do not cover the higher part of the curve, This, together with the test on the infection curve of China
 already shown in Figure 2, demonstrates that the logistic curve provides a robust approximation of
 the epidemic, at least during its spread,

 Discussion

 The Covid-19 epidemic in Italy shows very abnormal features, in terms of severity of disease and,
 particularly, mortality, The CFR (defined as the ratio between the number of deceased and the
 number of recorded infected) reaches here very high values, disproportioned with respect to any
 other country: about 11%, rising to about 16% in the Lombardia Region, which alone represents
 half of the total number of infected people in Italy, Estimating a reliable value of the IFR (the ratio
 between the number of deceases and the total number of infected people) during the epidemic, for a
 virus hard to diagnose and requiring complex laboratory procedures, is very difficult, In this case,
 we considered two approaches: the first one, used by University of Oxford (Oke and Henegan, 2020)
 is based on the minimum reliable CFR values, The other one benefits of the possibility to study a
 very peculiar laboratory-like case study, namely the case of Diamond Princess, the cruise ship
 remaining at anchor in Japan (in the port of Yokohama) in which all the passengers and crew (3,771

 17
Preprints (www.preprints.org) | NOT PEER-REVIEWED | Posted: 6 April 2020 doi:10.20944/preprints202004.0049.v1

 people) were tested for Covid-19, University of Oxford assumed a 50% of non recorded infected; in
 this way, they computed a value of IFR=0,2%, In the alternative approach, we considered that in the
 Diamond Princess cruise ship 712 infected were detected, and 9 of them died, So, the mostly
 unbiased value of IFR=CFR=1,3% can be computed, We have then considered these values as the
 limiting values defining the range of IFR, If we assume that the infection number underestimation is
 the only reason for the large overestimation of the mortality rate, in order to determine the real
 number of infected cases able to correct the apparent mortality to the true value, we should multiply
 the ‘official’ number of recorded infections by the ratio between the CFR=11,3% and the IFR (=0,2%
 or 1,3%), In this way, we obtain a real number of infected people in Italy (today, 30 March 2020)
 ranging between about 885,000 and 5,7 M people infected,
 Even if this number appears very high (mainly with respect to the total number of reported cases of
 less than 90,000 in China, where however, using the same assumption, this amount should be
 multiplied by 4), it is not unreasonable for several reasons, Firstly, besides the high number of tests
 made in Italy (about 500,000), this is still only a small fraction of the total population (60 M people),
 and does not take into account the number of asymptomatic and pauci-symptomatic cases, This is
 confirmed by observing that CFR in Italy is very similar to percent of death detected in hospital
 case series (Chen at al,, 2020), The large number of potential daily infections in Italy during
 mobility for work or study can be also independently estimated by the statistics of the use of public
 transportation (the most likely to cause infection due to the high number of people assembled in
 small space), It results that 30 million people moves in Italy each day for work or study, with peak
 values in Lombardia (ISTAT report, 2017): about 56% of these people use public transportation;
 two thirds of the total travel for more than 15 minutes, So, considering only such a number of
 assembled people, and neglecting the likely high incidence of student assemblage in schools, of
 people in work places, and the more or less occasional frequentations of restaurants, clubs, pubs,
 sport matches, theatres, supermarkets etc,, we get a minimum estimate of about 11M people staying
 in close contact each day, A final indication that such number of effective infected cases is not
 unrealistic comes from the exponential fit of the first days of infection (Fig, 1); by extrapolating that
 exponential curve till 30 March2020 it would predict about 1 million infected cases, Obviously,
 such a hypothesis would assume that the exponential increase lasted till 30 March2020 (or however
 till few days before) and that the real exponential curve was missed because the limited number of
 tests progressively sampled a smaller and smaller percentage of the true daily number, From any
 point of view, in conclusion, a real number of 0,9-5,7 M infected people today does not appear
 unrealistic,

 18
Preprints (www.preprints.org) | NOT PEER-REVIEWED | Posted: 6 April 2020 doi:10.20944/preprints202004.0049.v1

 Other reasons could however equally affect the very high mortality observed (as CFR): discarding
 the existence in Italy of a virus strain significantly different and more aggressive (hypothesis
 actually impossible to verify because there is not yet the Italian genome available), a possible
 contribution could come from the relative high air pollution (from particulate matter PM10, PM2,5
 and Ozone) of the zone around the Po Valley, where more than 50% of counted infections are
 clustered, Among the other hypothesized causes, the high average age (however lower than Japan,
 which showed a much lower CFR) is not likely to play a fundamental role; nor it is the number of
 smoking people (lower than the EU average), The observed high antibiotic-resistance, the highest
 one in Europe, has been also indicated as a possible contributing factor, However, although such
 problem causes in Italy about one third (10,000 cases; the double of France, and fourfold of
 Germany) of the total deceases for antibiotic resistance in the whole EU (33,000 cases), it does not
 appear to significantly affect the mortality (CFR) associated to seasonal flu (the most reliable
 comparison we can do, to infer the possible effect on Covid-19 mortality), which seems not
 significantly higher with respect to other European countries, We can compare, for instance, the
 number of deaths directly or indirectly associated to seasonal flu (the number of indirect deaths is
 much more significant in this case, because it is mostly linked to bacteria super-infections) in Italy
 and in Germany (where Covid-19 CFR is about 1%), The average yearly number of such deaths in
 Italy is around 8,000 (ISS, 2020); in Germany, the deaths associated with the 2017-2018 flu,
 although very severe that year, totalled 25,000 (Koch Institute, 2019), Another issue that often
 comes out as a possible bias in the mortality estimates for Italy is the way of counting equally
 people dead ‘with’ or ‘by’ the infection, Actually, we do not think this question can seriously affect
 the data, provided only infected people dead for pulmonary collapse (or else for collapse of other
 organs following a serious pulmonary disease) are counted, as likely, On the contrary, an interesting
 issue, given the high selectivity of the disease towards old and/or multi-pathology people, will be to
 understand, at the end of the year, the total deaths caused, cumulatively, by all the seasonal diseases
 (flu, infections from antibiotic-resistant bacteria, walking pneumonia, Covid-19),
 A significant contribution to the increase of the “local” IFR could, on the contrary, have come from
 the saturation of the public Hospitals, and in particular from the limited number (as compared for
 instance to Germany) of ICU, Italy, before the Covid-19 epidemic, had in fact 8,4 ICU per 10,000
 citizens (5,090 ICU total), whereas Germany had 34 of them (28,000 ICU total), Also, some wrong
 actions taken by the public Hospitals in managing the first days of infection (testified by many
 media and by a dramatic percentage of infected medical staff), could have significantly enhanced
 the infection, As of 30 March 2020, 51 doctors died and 6,414 people from the medical staff have
 been infected (ISS daily Info, 30 March2020), Moreover, the anomalous behaviour (with a

 19
Preprints (www.preprints.org) | NOT PEER-REVIEWED | Posted: 6 April 2020 doi:10.20944/preprints202004.0049.v1

 persisting high number of deceases) in Lombardia, whereas the trend of deceases for the whole Italy
 excluding Lombardia is much more regular, also suggests some problems in that region, which has
 the most critical numbers and where the infection started, Such problems would likely involve
 insufficience of the sanitary system, stressed above the critical point, by the extreme numbers of
 people hospitalized (11,883) or in ICUs (1,324),
 In this paper, we also use an indirect procedure, based on the analysis of the cumulative number of
 deceases which is the only reliable datum, in order to forecast the short-term evolution of the
 epidemic in Italy, As we have discussed, the number of recorded infections is not statistically
 reliable for such analyses, since inhomogeneous in time and in space (among different Regions),
 Considering correctly the average time shift of the death with respect to the infection (16 days used
 here) we show that decease data, converted to infection data using a large range of possible IFR, are
 well fitted by logistic functions, all of them indicating the time of 95% of total infection (i,e, the
 starting of the flat part of the function, which represents the end of infection), is expected around
 the last days of March, The point of inflection of the logistic best fitting functions, which
 corresponds to the peak of the infections in Italy, occurred around 11 March 2020 given the interval
 of confidence over the delay time from sympthomps to death (Jung et al 2020), Looking at Figure 5,
 this date occurs just after the lockdown of the whole Italy and it demonstrates the high mitigating
 impact of the lockdowns; however, since it also occurs only from 4 to 10 days after the closing of
 the schools, it probably indicates that this measure has also been effective in containing the
 infection, Indeed, the high effectiveness of the closure of schools for containing epidemic spread
 has been specifically assessed by a number of epidemiologic studies (i,e, Adda, 2016),
 Our results also put in evidence the shift of the infections curves between the Northern regions
 where the infection started (i,e, Emilia Romagna) and the Southern Italy regions (i,e, Calabria)
 where the peak is not reached yet, and therefore the fitting curves are still unconstrained and the
 future trends very uncertain, These results, based on the trend of the number of casualties, further
 confirm that the infection data we record today are only dependent on the variable and
 inhomogeneous sampling and have nothing to do with the true statistical evolution of the epidemic,
 Looking at these very inhomogeneous data, it is very clear that, since several days, the increase or
 decrease of new daily infections just depend on the number of tests, This is an obvious consequence
 of the fact, demonstrated here, that the true number of infections is much larger than the small
 sample tested: so, more tests you do, more cases you record, The information that the epidemic in
 the whole Italy is reaching the saturation (and hopefully end, as forecasted, within the first half of
 April), although not apparent from the tested number of new infections, should be seriously

 20
Preprints (www.preprints.org) | NOT PEER-REVIEWED | Posted: 6 April 2020 doi:10.20944/preprints202004.0049.v1

 considered in order to decide how to tune and eventually release the next measures for the
 containment of the infection,

 Conclusions

 We analysed the Covid-19 epidemic in Italy, which showed to be the largest and most lethal in the
 world, We discussed the causes of such anomalous behaviour of the disease in Italy, where
 mortality appears much higher than in other countries, Among the various hypotheses made till now
 to explain such an anomalous behaviour, it appears that neither the old age of population, nor the
 observed antibiotic-resistance of population (by far the highest one in Europe), nor even the
 smoking level, should have significant effects on the observed mortality, The most reasonable effect
 would involve a strong underestimation of the extension of the infection (implying a factor 8,7 to
 56,5 more cases than the tested ones), A possible, further contribution could be given by the very
 high fine powder (and Ozone) pollution (one of the highest ones in Europe), which on one hand
 could facilitate the virus transmission, on the other hand could make more vulnerable and stressed
 the lung, causing heavier damages upon impact with virus, Another factor emerging from our
 analyses (as well as from media) that likely amplified mortality, could have been the scarse
 preparedness and possible initial faults of the sanitary system, mainly in Lombardia where the
 epidemic first blew up in few days,
 The problem of underestimation of the number of infections, coupled with a non homogeneous
 sampling and testing of the positive cases, makes these data unreliable to use for statistics aimed to
 forecast the epidemic evolution, We then use here the cumulative daily number of deceases,
 corrected for an appropriate IFR, to simulate the evolution of the epidemic by a logistic function,
 When corrected for IFR and time shift between infection and death, these data can be well fitted by
 a logistic function, and show that actually the peak of infection has been overcome more than two
 weeks ago, and the saturation of the curve (end of epidemic) is expected within the first week of
 April or few days later, For the Southern Italy regions, the saturation of the curve will be most-
 likely delayed of a few days, The information here obtained about the possible evolution of the
 epidemic and its likely end, which is not at all evident from the very inhomogeneous sampling of
 infections actually performed, should be seriously considered in order to decide what measures to
 undertake or relax in the next future, Moreover, considering the likely effectiveness of the school’s
 closure, which is probably the minimally invasive measure in a social and economic sense, it should
 be considered as a primary measure when the lockdown will end, The study of this unprecedented
 medical catastrophe will hopefully give robust indications to avoid, in the future, the same errors

 21
Preprints (www.preprints.org) | NOT PEER-REVIEWED | Posted: 6 April 2020 doi:10.20944/preprints202004.0049.v1

 and understatements, It will also help to seriously consider the need to improve health system both
 in hospital and primary health care settings, whose capability should be considered invaluable, also
 using a purely economic criterion,

 References

 Adda, J,, 2016, Economic Activity and the Spread of Viral Diseases: Evidence from High
 Frequency Data , The Quarterly Journal of Economics, 131, 2, 2016, 891-
 941, https://doi,org/10,1093/qje/qjw005

 Akaike, H,, New look at Statistical-Model identification, IEE Trans, on Autom, Contr,, 1974 19, 6,
 716-723

 Chen, R,, Chu, C,, Tan, J,, Cao, J,, Song, W,, Xu, X,, Jing, C,, Ma, W,, Yang, C,, Chen, B,, Gui, Y,,
 Kan, H, 2010, Ambient air pollution and hospital admission in Shangai, China, Journal of
 Hazardous Material, Volume 181, Issues 1-3, 15 September 2010, pp, 234-240
 https://doi,org/10,1016/j,jhazmat,2010,05,002
 Chen, K,, Horton R,M,, Bader D,A,, Lesk C,, Jiang L,, Jones B,, Zhou L,, Chen X,, Bi J,, and
 Kinney P,L,, 2017, Impact of climate change on heat-related mortality in Jiangsu Province, China,
 Environ, Pollut,, 224, no, 317, doi:10,1016/j,envpol,2017,02,011,

 Chen N,, Zhou M,, Dong X,, Qu J,, Gong F,, Han Y,, Qiu Y,, Wang J,, Wei Y,, Xia J,, Yu T,,
 Zhang X,, Zhang L, Epidemiological and Clinical Characteristics of 99 cases of 2019 novel
 coronavirus pneumonia in Wuhan, China: a descriptive study, Lancet 2020; 395: 507-13, Published
 online January 29, 2020 https://doi,rog/10,1016/S0140-6736(20)30211-7

 Ciencewicki, J, & Jaspers,I, 2007 Air Pollution and Respiratory Viral Infection, Inhalation
 Toxicology, 19:14, 1135-1146, doi: 10,1080/08958370701665434

 Contini et al,, 2020, Societàitaliana di aerosol Informativa sulla relazione tra inquinamento
 atmosferico e diffusione del COVID-19, pp, 4 (in Italian)
 http://www,iasaerosol,it/attachments/article/96/Nota_Informativa_IAS,pdf (accessed on 4 April
 2020)

 22
Preprints (www.preprints.org) | NOT PEER-REVIEWED | Posted: 6 April 2020 doi:10.20944/preprints202004.0049.v1

 Dominici F, Peng R,D,, Bell M,L,, et al,, 2006, Fine Particulate Air Pollution and Hospital
 Admission for Cardiovascular and Respiratory Diseases, JAMA, 2006;295(10):1127–1134,
 doi:10,1001/jama,295,10,1127

 Il Sole 24 Ore, 2020, (in Italian) https://lab24,ilsole24ore,com/coronavirus/#box_6 (accessed on 4
 April 2020)

 ISS, Infografica March 25th, 2020,
 https://www,epicentro,iss,it/coronavirus/bollettino/Infografica_25marzo%20ITA,pdf (accessed on
 4 April 2020)

 ISTAT, 2018, Spostamenti quotidiani e nuove forme di mobilita’ pp, 20 (in Italian)
 https://www,istat,it/it/files//2018/11/Report-mobilit%C3%A0-sostenibile,pdf(accessed on 4 April
 2020)

 ISS report, 2020 Epidemia COVID-19 pp, 12 (in Italian)
 https://www,epicentro,iss,it/coronavirus/bollettino/Bollettino-sorveglianza-integrata-COVID-
 19_23-marzo%202020,pdf(accessed on 4 April 2020)

 La Repubblica, 2020, Coronavirus: "Il 50-75% dei casi a Vo' sono asintomatici, Una formidabile
 fonte di contagio" (in Italian) https://www,repubblica,it/salute/medicina-e-
 ricerca/2020/03/16/news/coronavirus_studio_il_50-
 75_dei_casi_a_vo_sono_asintomatici_e_molto_contagiosi-251474302/ (accessed on 4 April 2020)

 Janoschek, A,, 1957, Das reaktionskinetische Grundgesetz und seine Beziehungen zum
 Wachstums- und Ertragsgesetz, Stat, Vjschr, 10, 25-37,

 Jung, S,M,, Andrei R, Akhmetzhanov, A,R,, Hayashi, K,, Linton, N,M,, Yang,Y,, Yuan, B,,
 Kobayashi, T,, Kinoshita, R,, Nishiura, H, 2020, Real-Time Estimation of the Risk of Death from
 Novel Coronavirus (COVID-19) Infection: Inference Using Exported Cases, medRxiv, doi:
 10,1101/2020,01,29,20019547

 23
Preprints (www.preprints.org) | NOT PEER-REVIEWED | Posted: 6 April 2020 doi:10.20944/preprints202004.0049.v1

 Gompertz, B,, 1832 On the Nature of the Function Expressive of the Law of Human Mortality, and
 on a New Mode of Determining the Value of Life Contingencies, Phil, Trans, Roy, Soc,
 London 123, 513-585, 1832,

 Koch Institute, 2019, Report 2018-2019
 https://www,rki,de/EN/Content/infections/epidemiology/inf_dis_Germany/influenza/summary_201
 8-19,html, (accessed on 4 April 2020)

 Martuzzi M,, Mitis F,, Iavarone I,, Serinelli M,, 2006, Health impact of PM10 and Ozone in 13
 Italian cities, World Health Organization Regional Office for Europe ISBN 92 890 2293 0
 WHOLIS number E88700 World, Pp, 147

 Moriarty L, F, et al,, 2020, Public Health Responses to COVID-19 Outbreaks on Cruise Ships —
 Worldwide, February–March 2020, MMWR, Volume 69, 12 (27 March 2020), doi:
 10,15585/mmwr,mm6912e3

 Oke, J,, Heneghan, C,, 2020, Global COVID-19 Case Fatality Rates by CEBM and University of
 Oxford https://www,cebm,net/global-covid-19-case-fatality-rates/(accessed on 4 April 2020)

 Richards, F, J,, 1959, A Flexible Growth Function for Empirical Use, Journal of Experimental
 Botany, Volume 10, Issue 2, June 1959, Pages 290–301, doi: 10,1093/jxb/10,2,290

 Setti, L, et al,, 2020, Relazione circa l’effetto dell’inquinamento da particolato atmosferico e la
 diffusione di virus nella popolazione (in italian):
 http://www,simaonlus,it/wpsima/wp-content/uploads/2020/03/COVID19_Position-
 Paper_Relazione-circa-l%E2%80%99effetto-dell%E2%80%99inquinamento-da-particolato-
 atmosferico-e-la-diffusione-di-virus-nella-popolazione,pdf(accessed on 4 April 2020)

 Stafoggia M,, Faustin A,, Rognin M,, Tessari R,, Cadum E,, Pacelli B,, Pandolfi P,, Miglio R,,
 Mallone S,, Vigotti M,A,, Serinelli M,, Accetta G,, Dessi M,P,, Cernigliaro A,, Galassi C,, Berti G,,

 24
You can also read