On the Protein Fibrillation Pathway: Oligomer Intermediates Detection Using ATR-FTIR Spectroscopy - MDPI
←
→
Page content transcription
If your browser does not render page correctly, please read the page content below
molecules
Article
On the Protein Fibrillation Pathway: Oligomer Intermediates
Detection Using ATR-FTIR Spectroscopy
Jelica Milošević, Radivoje Prodanović                  and Natalija Polović *

                                          Department of Biochemistry, Faculty of Chemistry, University of Belgrade, Studentski trg 12,
                                          11000 Belgrade, Serbia; jelica@chem.bg.ac.rs (J.M.); rprodano@chem.bg.ac.rs (R.P.)
                                          * Correspondence: polovicn@chem.bg.ac.rs; Tel.: +38-1113-336-657

                                          Abstract: Oligomeric intermediates on the pathway of amyloid fibrillation are suspected as the main
                                          cytotoxins responsible for amyloid-related pathogenicity. As they appear to be a part of the lag
                                          phase of amyloid fibrillation when analyzed using standard methods such as Thioflavin T (ThT)
                                          fluorescence, a more sensitive method is needed for their detection. Here we apply Fourier transform
                                          infrared spectroscopy (FTIR) in attenuated total reflectance (ATR) mode for fast and cheap analysis
                                          of destabilized hen-egg-white lysozyme solution and detection of oligomer intermediates of amyloid
                                          fibrillation. Standard methods of protein aggregation analysis— Thioflavin T (ThT) fluorescence,
                                          atomic force microscopy (AFM), and 8-anilinonaphthalene-1-sulphonic acid (ANS) fluorescence were
                                          applied and compared to FTIR spectroscopy data. Results show the great potential of FTIR for both,
                                          qualitative and quantitative monitoring of oligomer formation based on the secondary structure
                                          changes. While oligomer intermediates do not induce significant changes in ThT fluorescence, their
                                secondary structure changes were very prominent. Normalization of specific Amide I region peak
                                   intensities by using Amide II peak intensity as an internal standard provides an opportunity to use
Citation: Milošević, J.; Prodanović,    FTIR spectroscopy for both qualitative and quantitative analysis of biological samples and detection
R.; Polović, N. On the Protein           of potentially toxic oligomers, as well as for screening of efficiency of fibrillation procedures.
Fibrillation Pathway: Oligomer
Intermediates Detection Using             Keywords: ATR FTIR; oligomer intermediates; amyloid fibrillation; HEWL; secondary structure per-
ATR-FTIR Spectroscopy. Molecules          turbation
2021, 26, 970. https://doi.org/
10.3390/molecules26040970

Academic Editors: Paola Taddei,           1. Introduction
Michele Di Foggia and
                                                Amyloid fibrils are highly ordered protein aggregates with monotonous cross-β struc-
Daniel Cozzolino
                                          ture independent of the sequence [1]. Proteins occupy different intermediate states upon
Received: 24 December 2020
Accepted: 5 February 2021
                                          their amyloid fibrillation. These states show diverse degrees of stability as they repre-
Published: 12 February 2021
                                          sent local minima on the way to ultimate stabilization in the form of amyloid fibrils [2].
                                          In the first, lag stage of amyloid misfolding, the native state of a protein is destabilized
Publisher’s Note: MDPI stays neutral
                                          and transformed into nuclei for fibrillation. Once formed they can proceed to metastable
with regard to jurisdictional claims in
                                          oligomers which are considered the actual toxic form inducing misfolding-related patho-
published maps and institutional affil-   logical states [3]. There is a discrepancy in the use of the term oligomers. A certain group of
iations.                                  authors takes some forms of protofibrils as oligomeric intermediates, while others reserve
                                          this term for spherical intermediates that precede fibrillar forms. The widest definition
                                          takes oligomers as smaller aggregates containing 2–20 monomer units [1]. Thus, oligomer
                                          is used as a term for a state that excludes 50% of protein molecules in a monomer state
Copyright: © 2021 by the authors.
                                          and the other case where more than 50% is part of a big cluster [4]. They continue their
Licensee MDPI, Basel, Switzerland.
                                          route to fibrils by occupying protofibril form—wormlike filamentous late intermediate
This article is an open access article
                                          stage without periodicity in their structure [5,6]. Protofibrils assemble into protofilaments
distributed under the terms and           which represent single-stranded fibrils that twist helically to form mature fibrils.
conditions of the Creative Commons              As oligomers are proved to be toxic species either when in vitro formed [7], or in vivo
Attribution (CC BY) license (https://     formed in many misfolding diseases [8], their detection is of high importance. Unlike fibrils
creativecommons.org/licenses/by/          that grow very fast once their structural form is constructed, oligomers grow slowly [1].
4.0/).                                    Depending on the starting protein characteristics and fibrillation procedure, the time scale

Molecules 2021, 26, 970. https://doi.org/10.3390/molecules26040970                                         https://www.mdpi.com/journal/molecules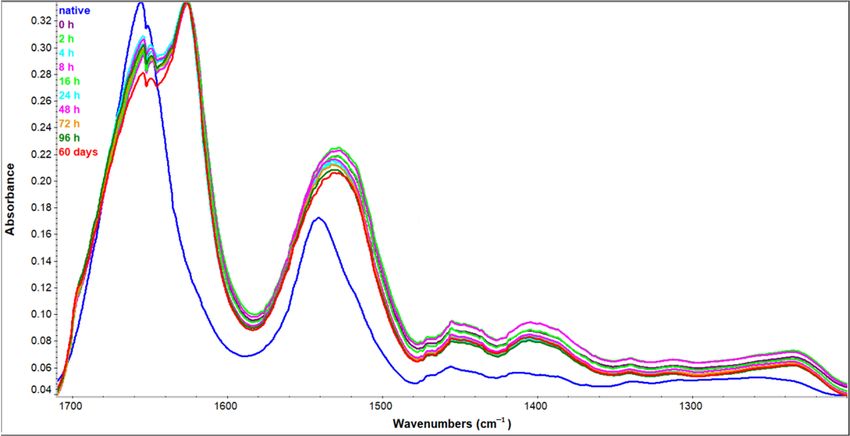
Molecules 2021, 26, 970                                                                                           2 of 15

                          of this process varies from hours to weeks. Lysozyme from chicken egg white in the
                          high-ethanol condition is an example of a slow fibrillating model system [9] suitable for
                          oligomer detection and analysis.
                                Lysozyme (3.2.1.17) is a diverse group of antimicrobial enzymes with N-acetylmuramide
                          glycanhydrolase activity. By catalyzing the hydrolysis of 1,4-beta-linkages between N-
                          acetylmuramic acid and N-acetyl-D-glucosamine, it protects animals from gram-positive
                          bacteria [10]. Hen egg-white lysozyme (HEWL) is serving its protective role during chick
                          embryonic development. It is a globular protein with only 14.3 kDa molecular weight.
                          The secondary structure content of native HEWL is described as mostly α-helicoidal
                          (about 40%) with a significant part of unordered regions and the presence of a small β-
                          sheet (12%) [10,11]. A unique property of HEWL is its extremely high pI value due to
                          8% of arginine among amino acid residues. This protein can be destabilized in many
                          different ways, so there are a variety of different protocols for its aggregation in both,
                          non-ordered and ordered form. Nevertheless, it appears to be quite soluble even when it
                          occupies different nonnative forms, which increases its propensity for directing misfolding
                          intermediates toward ultimate stabilization in the form of amyloid fibrils. Conditions
                          favoring amyloid state vary from extremely acidic (about pH 2) [12–14] common for
                          many different proteins, to extremely alkaline of pH above 12 [15–17]. Among different
                          fibrillation protocols are incubations in the presence of high concentrations of ethanol or
                          chaotropic agents [18]. Nonnative forms of this protein can stay soluble in a high ethanol
                          concentration of about 90% [19], while most proteins get quantitatively precipitated in
                          ethanol higher than 60% regardless of their conformation. Macroscopic precipitation of
                          HEWL in 90% ethanol does not take place even in a high protein concentration of about 6
                          mg/mL for days.
                                Among standard techniques for amyloid fibrillation monitoring, the highest appli-
                          cation goes to spectroscopy techniques based on the properties of specific fluorescent
                          dyes that interact with a cross-β-sheet structure—Thioflavin T (ThT) and Congo Red. Mi-
                          croscopy techniques are also useful, especially in determining fibril length, together with
                          dynamic light scattering (DLS). As the amyloid state is characterized by uniform β-sheet
                          structure, secondary structure analysis by circular dichroism (CD) or infrared (IR) spec-
                          troscopy also plays a significant role in fibrillation monitoring. Infrared spectroscopy has a
                          very high potential for the analysis of protein aggregation, including amyloid forms [20,21]
                          as it is more suitable than CD for turbid samples. It was previously applied for the analysis
                          of different stages of amyloid formation [21,22]. Deconvolution of the Amide I region
                          provides the exact determination of secondary structure content [23] but requires a lot
                          of operations in the spectral processing so it has never acquired wide application for nu-
                          merous sample analyses, such as biological samples for oligomer presence screening [24].
                          We have previously published a study introducing a simple and fast method for mature
                          fibrils detection based on attenuated total reflectance—Fourier transform infrared spec-
                          troscopy (ATR-FTIR) [25]. The method eliminates complicated spectra processing and
                          offers reliable fibrillation monitoring by only calculating the ratio of characteristic Amide
                          I band intensities and Amide II maximum intensity. Our aim here was to examine the
                          application of ATR-FTIR spectroscopy and this simple method for spectral analysis for the
                          monitoring of misfolding oligomer formation. This aim was set as the standard method
                          for amyloid monitoring—ThT fluorescence is not sensitive enough for this application
                          due to poor interactions between oligomer states and the dye [26]. The toxicity of the
                          oligomeric state makes it highly important to establish a sensitive, fast, and cheap method
                          for their detection, as oligomers are targets for potential treatments of neurodegenerative
                          misfolding diseases that are under extensive investigation.

                          2. Results and Discussion
                               In order to study protein structural transitions that precede fibrillation using ATR-
                          FTIR, we chose HEWL as a model protein for slow fibrillation. Many studies are published
                          regarding HEWL amyloid fibrillation—protocols and analysis of fibrils formed. It appears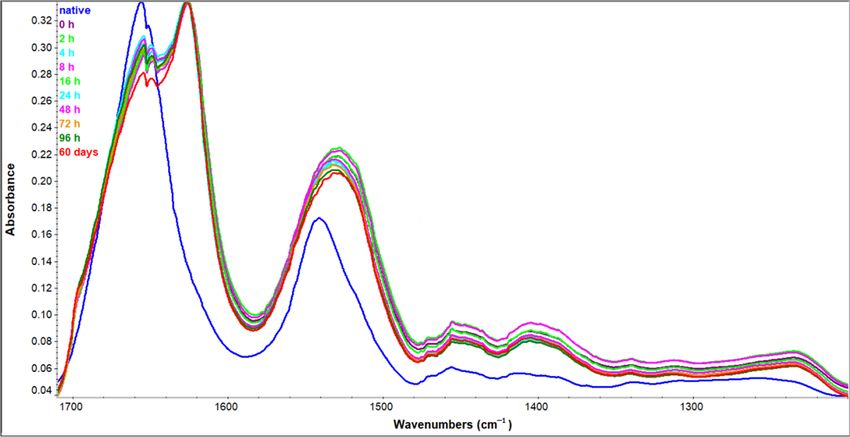
Molecules 2021, 26, x FOR PEER REVIEW 3 of 16
2. Results and Discussion
Molecules 2021, 26, 970 3 of 15
In order to study protein structural transitions that precede fibrillation using ATR-
FTIR, we chose HEWL as a model protein for slow fibrillation. Many studies are published
regarding HEWL amyloid fibrillation—protocols and analysis of fibrils formed. It appears
that
thatHEWL
HEWL is is
ananextraordinary
extraordinary protein
proteinwith
with increased
increased solubility
solubility ininvarious
various (destabilizing)
(destabilizing)
conditions.
conditions. Prolonged
Prolonged solubility
solubilityin the presence
in the presenceof a ofvery high high
a very percentage
percentageof organic sol-
of organic
vents such such
solvents as ethanol favorsfavors
as ethanol slow andsloworganized aggregation
and organized in the form
aggregation in the ofform
amyloid fibrils
of amyloid
[9]. As a[9].
fibrils result
As aofresult
its high
of itsavailability and high
high availability andpropensity
high propensity to amyloid and amyloid-like
to amyloid and amyloid-
states, HEWL
like states, HEWLproved to betoamong
proved proteins
be among proteinswithwith
great importance
great importance forforestablishing
establishing a new
a new
methodology regarding amyloid formation
methodology regarding amyloid formation monitoring, monitoring, including analysis of intermedi-
analysis of intermediate
ate fibrillation
fibrillation forms
forms [21,22].
[21,22].
We Weincubated
incubated HEWL HEWL ininconditions
conditions favoring
favoring amyloid
amyloid formation—90%
formation—90% ethanol,ethanol,
6 mg/mL 6
mg/mL
proteinprotein concentration
concentration at room at temperature
room temperature[19,27,28].[19,27,28].
It was It was previously
previously shown shown
that fib-
rillation
that in high
fibrillation ethanol
in high conditions
ethanol is a is
conditions nucleation-dependent
a nucleation-dependent polymerization
polymerization pathway
path-
characterized
way characterized by aby sigmoidal
a sigmoidal curvecurve
with with
an initial lag phase
an initial [9]. Different
lag phase studiesstudies
[9]. Different report a
long fibrillation
report processprocess
a long fibrillation in high-ethanol conditions
in high-ethanol taking over
conditions takinga week
over aatweekroomat tempera-
room
ture [28]. Based
temperature on theon
[28]. Based different methodology
the different methodologyapplied, they propose
applied, they proposevarious timescale
various time-of
the of
scale fibrillation process,
the fibrillation but many
process, paperspapers
but many agree that
agree the complete
that formation
the complete of longofmature
formation long
fibrils, fibrils,
mature detectable by sophisticated
detectable microscopy
by sophisticated techniques,techniques,
microscopy takes one totakes two months
one to [9,27].
two
Holley[9,27].
months and coworkers
Holley and reported
coworkersthe aggregation
reported thekinetics study kinetics
aggregation where the initial
study lag phase
where the
took between five and nine days for individual experiments [9]
initial lag phase took between five and nine days for individual experiments [9] while the while the formation of long
mature fibrils that occupy the upper plateau of the sigmoidal
formation of long mature fibrils that occupy the upper plateau of the sigmoidal curve took curve took about 30 days.
Scheme
about 1 is based
30 days. Scheme on1these
is basedprevious studies
on these [9,19,27,28]
previous that have described
studies [9,19,27,28] that have carefully
describedin
much detail HEWL fibrillation dynamics, supporting the
carefully in much detail HEWL fibrillation dynamics, supporting the formation of formation of oligomers after four
oligo-
days’
mers incubation
after four days’ period and completely
incubation period mature fibrils after
and completely 60 days.
mature It shows
fibrils after the represen-
60 days. It
tation of HEWL fibrillation kinetics under conditions that we
shows the representation of HEWL fibrillation kinetics under conditions that we applied applied for the design of our
experiments
for the design of focused on oligomerfocused
our experiments analysisonby ATR-FTIR.
oligomer analysis by ATR-FTIR.
Scheme
Scheme 1. 1. Schematic
Schematic representation
representation ofofhen
henegg-white
egg-whitelysozyme
lysozyme(HEWL)
(HEWL)fibrillation
fibrillationinin90%
90%etha-
ethanol
nol solution.
solution.
2.1.Formation
2.1. Formation of of Oligomers:
Oligomers: ThT
ThT and
and ANS
ANS Fluorescence
Fluorescence
Theformation
The formationofofoligomers
oligomersisismonitored
monitoredbyby measuring
measuring ThT
ThT binding
binding and
and hydrophobic
hydropho-
region exposure. Figure 1A shows ThT emission spectra of completely
bic region exposure. Figure 1A shows ThT emission spectra of completely native nativeHEWL
HEWL
dissolved in 100 mM Tris-HCl buffer of pH 8 and samples obtained during the
dissolved in 100 mM Tris-HCl buffer of pH 8 and samples obtained during the first four first four
days of incubation in 90% ethanol solution. For comparison, the ThT fluorescence of a
days of incubation in 90% ethanol solution. For comparison, the ThT fluorescence of a
mature amyloid fibril obtained after 60-day incubation is presented as well. Within the first
mature amyloid fibril obtained after 60-day incubation is presented as well. Within the
four days, a moderate increase in ThT fluorescence was detected. To show that differences in
first four days, a moderate increase in ThT fluorescence was detected. To show that dif-
ThT fluorescence between the samples incubated for four days in the presence of ethanol are
ferences in ThT fluorescence between the samples incubated for four days in the presence
not significant and all correspond to the lag phase, we present ThT fluorescence dependence
of ethanol are not significant and all correspond to the lag phase, we present ThT fluores-
on the incubation time (Figure 1B). The data shown are based on the fluorescence intensity
cence dependence on the incubation time (Figure 1B). The data shown are based on the
at the maximum of emission spectra (484 nm). A large increase of ThT fluorescence was
detected after two months following complete HEWL fibrillation. The detected changes
in ThT fluorescence are in concordance with previously published results using the same
methodology [9], as well as literature data about HEWL fibrillation based on analog
techniques [9,28].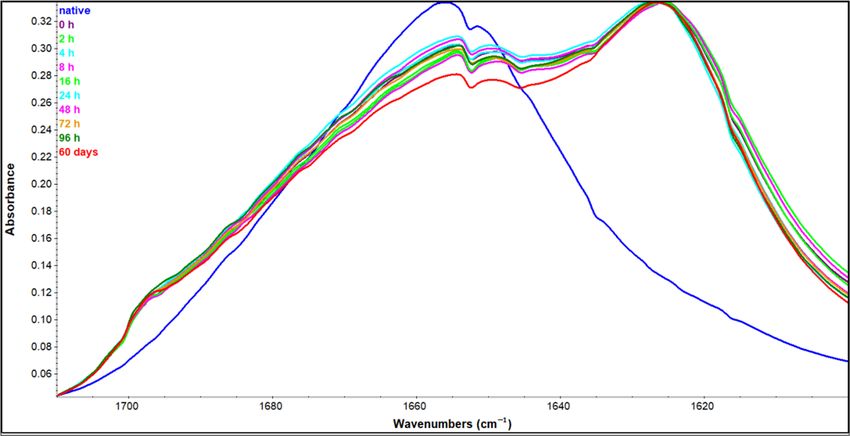
Molecules 2021, 26, 970                                                                                                        4 of 15

                                                                                                                                   .
                                     Figure 1. (A) Thioflavin T (ThT) fluorescence spectra during four day’s HEWL incubation in 90%
                                     ethanol and after a 60-day incubation period. (B) Time-dependent change of ThT fluorescence over
                  Figure 1.
                                     four days’ incubation of HEWL in 90% ethanol solution.

                                          To get an insight into the exposure of hydrophobic regions, we monitored 8-anilinonap
                                     hthalene-1-sulphonic acid (ANS) fluorescence as well, and similar trends were observed
                                     (Figure 2A,B). Spectra gathered during the first four days of incubation does not show
                                     significant change while prolonged incubation in a high concentration of ethanol results in
                                     a more than a twofold increase of the total ANS fluorescence intensity indicating higher ex-
                                     posure of the hydrophobic patches. When presented as time-dependent ANS fluorescence
                                     based on emission maximum at 500 nm (Figure 2B), results also indicate a good correlation
                                     with ThT fluorescence data showing that HEWL stays in a lag phase over the time course
                                     of 4 days. The correlation of ThT and ANS fluorescence trends is not surprising taking
                                                                                                                               .
                                     into account fibrillation conditions of decreased solvent polarity that prevent hydrophobic
                                     collapse for additional stabilization of fibrils.
                  Figure 1.
                                                                                                                                    .

                  fIGURE 2

                                                                                                                                   .
                                     Figure 2. (A) 8-anilinonaphthalene-1-sulphonic acid (ANS) fluorescence spectra during four days’
                                     HEWL incubation in 90% ethanol and after a 60-day incubation period. (B) Time-dependent change
                  fIGURE 2
                                     of ANS fluorescence during four days’ incubation of HEWL in 90% ethanol solution.

                                     2.2. Oligomer Morphology: Atomic Force Microscopy (AFM)
                                          In order to get an insight into the morphology and structure of the HEWL state
                                     formed during the lag phase of incubation, we applied AFM microscopy. It is a suitable
                                     method for discrimination between the oligomer and other protein states on the fibrillation
                                     pathway [24,29]. After four days of incubation, there is a heterogeneous population of.
                                     HEWL states mostly including misfolded oligomers but also some short fibrils as captured
                  Figure 4           together in the scan presented in Figure 3. Rare forms of 1–3 nm width indicate a slow
                                     transition to further states of fibrillation, but most of the molecules are part of the smaller
                                     thin fibrillar forms that can be attributed to misfolded oligomer intermediates [22]. These
                                     aggregates do not appear to be fully grown amyloid fibrils according to their length and

                  Molecules 2021, 26, x. https://doi.org/10.3390/xxxxx                                                www.mdpi.com/journal/mo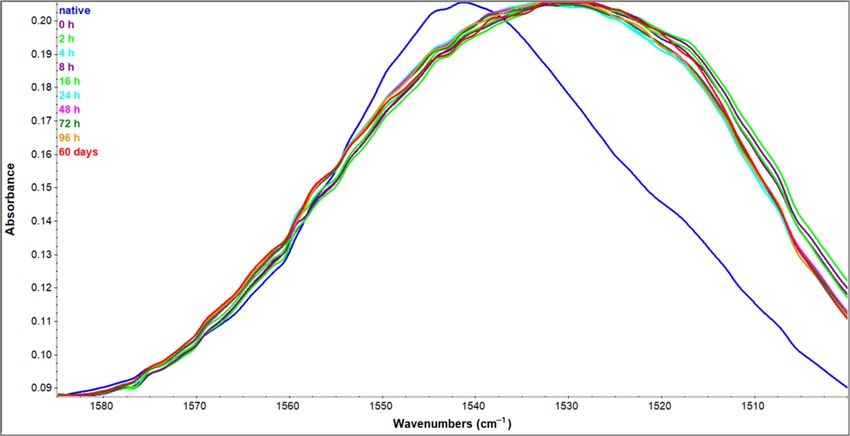
method for discrimination between the oligomer and other protein states on the fibrilla-
tion pathway [24,29]. After four days of incubation, there is a heterogeneous population
of HEWL states mostly including misfolded oligomers but also some short fibrils as cap-
Molecules 2021, 26, 970
tured together in the scan presented in Figure 3. Rare forms of 1–3 nm width indicate a
5 of 15
slow transition to further states of fibrillation, but most of the molecules are part of the
smaller thin fibrillar forms that can be attributed to misfolded oligomer intermediates [22].
These aggregates do not appear to be fully grown amyloid fibrils according to their length
diameter
and estimated
diameter estimatedbased on on
based thethe
AFM,
AFM, as as
mature fibrils
mature fibrilsrequire
requireatatleast
least100
100nm
nm length
length
and 10 nm diameter [26]. Even though the oligomer-specific antibodies were not applied
here, the morphology of aggregates formed during four-day incubation suggests it is an
oligomeric state
stateshown
shownalso
alsoininthe case
the of ataxin
case andand
of ataxin named
named misfolded
misfoldedoligomers [24]. This
oligomers [24].
result is in concordance with the dynamics of amyloid formation published
This result is in concordance with the dynamics of amyloid formation published previ- previously and
discussed
ously and above [9]. above [9].
discussed
.
Figure 3. AFM microscopy of HEWL oligomer intermediates.
Figure 1.
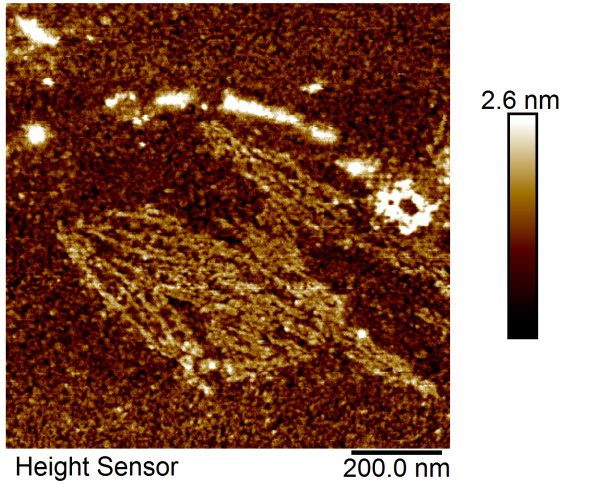
2.3. Qualitative
2.3. Qualitative Analysis
Analysis of
of FTIR
FTIR Spectra:
Spectra: Amide
Amide II region
Region
For structural
For structural analysis
analysis of these intermediate
of these intermediate states,
states, we
we applied
applied ATR-FTIR.
ATR-FTIR. DueDue to
to the
the
conformation dependence of infrared light absorption, amide regions of infrared spectra
conformation dependence of infrared light absorption, amide regions of infrared spectra provide
a useful tool
provide for both
a useful toolqualitative and quantitative
for both qualitative analysis of protein
and quantitative secondary
analysis structures.
of protein secondary
Figure 4 shows the three most important amide regions for protein structural analysis—
structures.
Amide I, Amide II, and Amide III region spanning from 1700 to 1200 cm−1 . Spectra presented
Figure 4 shows the three most important amide regions for protein structural analy-
in the figure include a sample of native HEWL in H2 O solution, as well as samples −1incubated
sis—Amide I, Amide II, and Amide III region spanning from 1700 to 1200 cm . Spectra
in 90% ethanol (C2 H5 OH) solution for the time period indicated in the figure legend (up
presented in the figure include a sample of native HEWL in H2O solution, as well as sam-
to four days and 60 days for comparison to fully amyloid state). Even a brief inspection
ples incubated in 90% ethanol (C2H5OH) solution for the time period indicated in the fig-
of spectra suggests significant perturbations at the higher wavenumbers. Those are the
ure legend (up to four days and 60 days for−comparison to fully amyloid state). Even a
changes in the Amide I region (1600–1700 cm 1 ), the one with the highest conformational
brief inspection of spectra suggests significant perturbations at the higher wavenumbers.
dependence and sensitivity among all amide regions. Changes in the adjacent Amide. II region
Those are the changes in the Amide I region (1600–1700 cm−1), the one with the highest
(1600–1500 cm−1 ) appear to be less dependent on the secondary structure content and are
fIGURE 2 conformational dependence and sensitivity among all amide regions. Changes in the ad-
the consequence of the drastic solvent change. In order to explore the complete potential of
jacent Amide II region (1600–1500 cm−1) appear to be less dependent on the secondary
ATR-FTIR spectra, individual Amide regions were analyzed separately.
structure content and are the consequence of the drastic solvent change. In order to ex-
plore the complete potential of ATR-FTIR spectra, individual Amide regions were ana-
lyzed separately.
Figure 4 Figure 4. Amide I—Amide III regions of HEWL ATR-FTIR spectra. Native—HEWL in H2 O, 0 h–60
days—HEWL samples incubated in 90% C2 H5 OH for the time period indicated.
Molecules 2021, 26, x. https://doi.org/10.3390/xxxxx www.mdpi.com/journal/molecules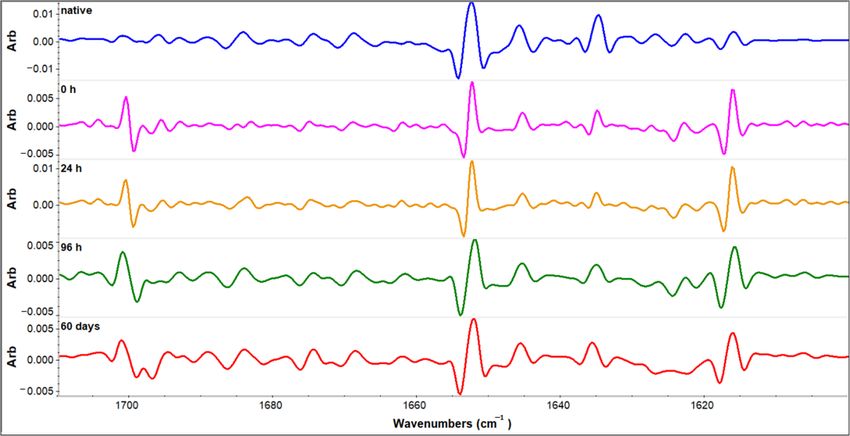
Molecules 2021, 26, 970                                                                                            6 of 15

                                Amide I region arises mainly from C = O stretching vibrations and out-of-phase
                          CN stretching vibrations of polypeptide backbone [30]. Between 1600–1700 cm−1 each
                          secondary structure contributes to the absorption in a certain wavenumber range. Upon
                          amyloid fibrillation, due to prominent secondary structure change, spectral differences are
                          very pronounced. The most characteristic band of amyloid IR spectra has a maximum in
                          the range from 1611 cm−1 [31] to 1628 cm−1 [32] depending on the (poly)peptide sequence
                          and fibrillation conditions [33]. These maxima arise on the count of nativelike secondary
                          structure peaks in the starting protein sample. Figure 5 shows all the spectra—native
                          HEWL in H2 O, and those incubated in 90% ethanol solution in the Amide I region. The
                          spectrum of native HEWL shows prominent bands at about 1650 cm−1 corresponding
                          to α-helix and random coil, and a less prominent band at 1634 cm−1 corresponding to
                          intramolecular β-sheet [20]. The transition of HEWL to 90% ethanol solution induced
                          significant spectral changes. There is a redshift accompanied by disproportionation of
                          particular bands leading to completely different spectra. The intermolecular β-sheet bands
                          at about 1620 cm−1 and 1700 cm−1 arise drastically while secondary structures present
                          in the native HEWL, including α-helix and random coil, decrease. This decrease is not
                          complete as a certain pool of protein still retains these secondary structures. Nevertheless,
                          an increase in low-frequency (about 1620 cm−1 ) [22] and, to a lesser extent, high frequency
                          (1700 cm−1 ) [25] β-sheet band is indicative of amyloid pathway intermediates. The first
                          spectrum obtained immediately after the transition of HEWL to ethanol-rich conditions has
                          these characteristic features and they do not seem to change significantly over time. Spectra
                          collected for the samples incubated in the period of zero to four days (0 to 96 h in the figure
                          legend) at increased ethanol concentration are quite overlapped in the Amide I region.
                          Even the sample incubated for 60 days does not seem to change extremely, but it shows a
                          further drop in native-like secondary structures that is not negligible. This indicates that
                          almost all secondary structure changes take place immediately after stressing HEWL by
                           Molecules 2021, 26, x FOR PEER REVIEW
                          the lowered polarity of the solution, suggesting that monitoring of oligomer formation
                          using FTIR could be more sensitive than ThT fluorescence.

                          Figure 5. Amide I region of native HEWL sample in H2 O solution and HEWL samples incubated in
                           Figure
                          90% C2 H55 OH for the time period indicated.

                                Oligomer to fibril transition during HEWL acid fibrillation was monitored by Zou
                          et al. [23]. In those conditions, they also acquired spectra with a similar overall shape for
                          oligomers and fibrils, but they found out a slight redshift from 1622 cm−1 to 1618 cm−1
                          for aggregation β-sheet band also reported in other researches [34]. In the case of ethanol-
                          induced fibrillation, such change was not detected suggesting that almost complete rear-
                          rangement of the secondary structure takes place during the lag phase.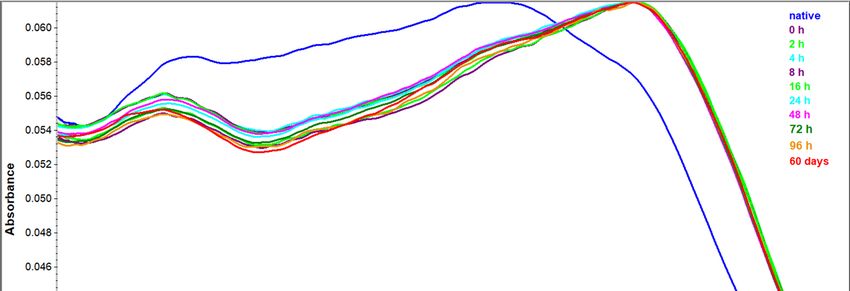
Molecules 2021, 26, 970                                                                                            7 of 15

                                For more in-depth analysis of this region, second derivative spectra are calculated
                          for the native sample in an aqueous solution, starting sample in ethanol solution (0 h),
                          intermediates incubated one and four days in the ethanol solution, and the amyloid sample
                          obtained by 60 days’ incubation in the same conditions. The second derivative spectra are
                          presented in Figure 6. They show more clearly that a slight decrease in the α-helix band
                          takes place (1654 cm−1 ), together with a random coil decrease (1644 cm−1 ) giving rise to
                          an aggregation-specific band at 1618 cm−1 [20,22,25]. To get a quantitative assessment of
                          these changes, the correlation coefficient was calculated to compare the initial spectrum of
                          native HEWL and the other four spectra obtained for the samples incubated—0 h, 24 h,
                          96 h, and 60 days in 90% ethanol. Correlation coefficients for these incubation periods are
                          0.68, 0.68, 0.65 and 0.64, respectively. These results prove that the most significant level of
                          secondary structure changes takes place in the short time frame upon solvent shift, and
                           Figure secondary
                          further  5          structure changes are slow.

                          Figure 6. Second derivative spectra of native HEWL sample in H2 O solution and HEWL samples
                           Figure 6 in 90% C H OH for the time period indicated.
                          incubated         2 5

                          2.4. Qualitative Analysis of FTIR Spectra: Amide II Region
                                Regardless of complete perturbations in the Amide I region, HEWL spectra in the Amide
                          II region show only a slight shift of spectral maximum (from 1550 cm−1 to 1540 cm−1 ) due
                          to transition to less polar conditions (from H2 O to 90% ethanol solution) (Figure 7). This
                          change in maximum position of about 10 cm−1 is far less than a change characteristic for
                          H-D exchange that results in a shift of about 100 cm−1 [35]. The Amide II region arising
                          from NH in-plane bending and CN stretching is far less dependent on specific secondary
                          structures presence than the Amide I region [30,36]. The low sensitivity to secondary
                          structure change makes this region suitable for use as an internal standard for comparison
                          of Amide I band intensities of different samples [25,37–39].

                          2.5. Qualitative Analysis of FTIR Spectra: Amide III Region
                               The Amide III region is generally regarded as a low-sensitive region of the protein
                          IR spectrum. The main contribution to its bands comes from the NH bending and the
                          CN stretching vibrations which appear to be conformational dependent [30]. Structural
                          transition on the way to amyloid fibrils results in prominent changes in this region as
                          well. Spectra presented in Figure 8 are analyzed according to ranges of Amide III band
                          positions examined thoroughly by Cai and Singh [40,41]. Native HEWL has peaks that
                          can unambiguously be attributed to α-helix (1310 cm−1 ), random coil (1257 cm−1 ), and
                          β-sheet (1236 cm−1 ). Along with the change of conditions, the spectrum is transforming
                          into a β-sheet rich one. Judged by the Amide III region, it seems that the increase in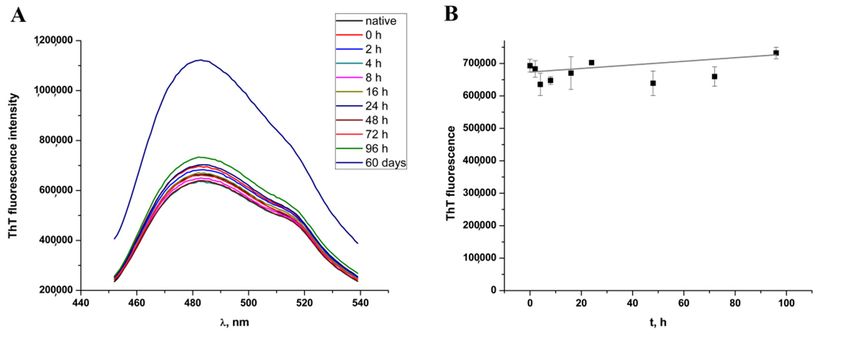
Molecules 2021, 26, 970                                                                                           8 of 15

                          β-sheet content takes place on the count of a random coil and α-helix. Even though quite
                           Molecules 2021, 26, x FOR PEER REVIEW
                          illustrative,   the Amide III region cannot distinguish between intra- and intermolecular
                          β-sheet as can be differentiated in the Amide I region.

                          Molecules 2021, 26, x FOR PEER REVIEW                                                   3 of 3

                          Figure 7. Amide II region of HEWL native sample in H2 O solution and HEWL samples incubated in
                           Figure
                               C27H75 OH for the time period indicated.
                           Figure
                          90%

                           Figure 88. Amide III region of HEWL native sample in H2 O solution and HEWL samples incubated
                          Figure
                          in 90% C2 H5 OH for the time period indicated.

                          2.6. Quantitative Analysis of FTIR Spectra: Amide I Region Deconvolution
                               As even simple inspection of the Amide I region suggests prominent secondary
                          structure changes during the first four days of incubation in the ethanol solution, and thus
                          the fact 8that FTIR is promising for oligomer detection, we wanted to use it quantitatively
                           Figure
                          by determining the secondary structure contents. Deconvolution of the Amide I region of
                          FTIR spectra is a standard method for secondary structure analysis with great application
                          among different protein model systems [20,23,42]. This demanding procedure was applied
                          on selected samples including spectra of native, water dissolved HEWL and 0 h, 24 h, 96 h,
                          and 60-days incubated samples in ethanol-rich conditions. The Amide I region of each
                          spectrum was decomposed to its original Gaussian constituents that are attributed to certain
                          secondary structures according to previously published data [20,21,23,25,43–45]. The area
                          under Gaussian constituents was calculated and expressed as a percentage of the total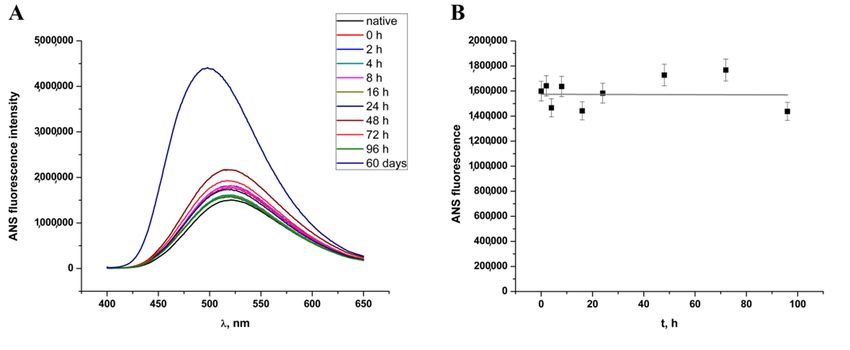
Molecules 2021, 26, 970                                                                                               9 of 15

                          summed area. This way, the contribution of each constituent peak to the total spectrum,
                          and thus—the content of each secondary structure in percentage was determined. Results
                          presented in Table 1 are compared to X-ray diffraction determined secondary structure
                          content and the results show a great correlation between these literature data and data
                          obtained for native HEWL. The dominant secondary structure in native HEWL is α-helix
                          with 41.7% (42.6% from X-ray data) and it drops to about 20% after the transition to ethanol.
                          A further drop in α-helix content is in the error range so it suggests that a great part of
                          α-helix is highly destabilized at the moment of transition to 90% ethanol. Native-like
                          β-sheet content remains about 10% regardless of the condition change and incubation time.
                          Total β-sheet content of the native HEWL determined by deconvolution of FTIR spectrum
                          does not differ from the total β-sheet content obtained by X-ray diffraction. In other
                          samples, aggregation-specific β-sheet increases, and this change is the most significant
                          upon transition to ethanol (from 8.6 to 29.7%). The change is still prominent after the first
                          incubation day (34.7%), but it gets much slower in the next three days indicating a stable
                          oligomer state. The final transition of the oligomer to mature fibrils gives an increase in
                          the aggregation-specific β-sheet to 38.2%. As α-helix and intramolecular β-sheet does not
                          change significantly from 0 h to 60 days of incubation, this increase in aggregation-specific
                          β-sheet comes mostly from a more gradual decrease in the content of random coil and turn
                          presented together here.

                          Table 1. Secondary structure content derived from HEWL samples by the deconvolution of attenuated
                          total reflectance—Fourier transform infrared spectroscopy (ATR-FTIR) spectra in the Amide I region
                          and literature data derived from X-ray diffraction [11].

                                                                     Aggregation                    Random
                               HEWL Sample             β-Sheet                        α-Helix                      Error
                                                                      β-Sheet                      Coil + Turn
                                 native, H2 O            10.3             8.6           41.7          39.4            1
                               0 h, 90% ethanol          10.5            29.7           21.8           38            0.8
                              24 h, 90% ethanol          10.1            34.7           22.8          32.4           0.6
                              96 h, 90% ethanol          10.2            35.1           21.8          32.9           1.1
                            60 days, 90% ethanol         10.3            38.2           19.6          31.9           0.8
                              X-ray diffraction          18.7              /            42.6          38.7            /

                               Almost the same changes in the content of secondary structures obtained by deconvo-
                          lution of FTIR spectra were observed in heat- and acid-induced HEWL fibrillation [20]. As
                          in their case, the change between native and 60-day incubated HEWL includes about a 30%
                          increase of aggregation-specific β-sheet, random coil drop of up to 10%, and α-helix loss
                          from 40% to 20% [20].
                               In ethanol-rich conditions, CD spectroscopy was applied for secondary structure
                          content monitoring by Goda et al. [28]. They incubated HEWL for 24 h and the overall
                          change of β-sheet content (about 20%) is similar to our data (26%) for the same incubation
                          period. Even though the overall change was similar, CD spectroscopy data did not provide
                          a good correlation of the native sample with the standard structural methods such as X-ray
                          diffraction and synchrotron radiation circular dichroism [10,11] as was the case with FTIR
                          deconvolution data presented here.

                          2.7. Quantitative Analysis of FTIR Spectra: Amide I/AMIDE II Ratio
                               As deconvolution is a demanding method unsuitable for big sets of samples, we
                          wanted to test another, much easier and faster method for the quantitative analysis of FTIR
                          spectra. We had previously published a simple method for the quantitative detection of
                          amyloid fibrils by monitoring of high- and low-frequency aggregation-specific β-sheet in
                          the Amide I region [25]. It was shown that the increase of these bands intensities when
                          normalized to the Amide II maxima intensity can be used as a parameter in quantitative
                          monitoring of amyloid formation for a fast-fibrillating model system ovalbumin [25]. This
                          normalization can be done by calculating Amide I to Amide II ratios, namely by dividing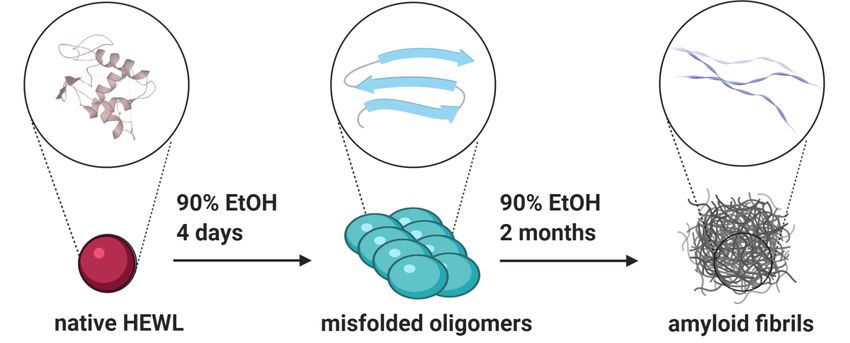
Molecules 2021, 26, 970 10 of 15
the value of absorbance of the sample at the wavenumber of interest in the Amide I region,
with the absorbance at the Amide II maximum. Bands of interest here were at the following
wavenumbers: 1654 cm− 1 for α-helix, 1644 cm− 1 for random coil, 1620 and 1698 cm− 1
for aggregation-specific β-sheets. Once Amide I maxima were identified, their intensities
were divided with the intensity of the Amide II maximum at 1542 cm− 1 for the sample
dissolved in H2 O and 1534 cm− 1 for samples in C2 H5 OH. Calculation of these ratios in
all samples of interest resulted in the values that indicate a trend of secondary structure
change in a process observed. These values do not show secondary structure contents but
give reliable information about the propensity of a sample to occupy a certain secondary
structure [25,37–39]. The increase of aggregation-specific β-sheet monitored this way was
Molecules 2021, 26, x FOR PEER REVIEW 11 of 16
found to be in a great correlation with the ThT fluorescence increase during the amyloid
formation of a fast-fibrillating model protein [25]. The samples of our model system for
slow-fibrillating proteins—HEWL was the subject of similar analysis and the results are
presented in Figure 9B. The same samples analyzed by the standard quantitative analysis
method—deconvolution of the Amide I region, were analyzed by this method as well. well.
Figure 9. (A) ThT fluorescence and (B) Amide I/Amide II ratio for native, 0 h-, 24 h-, 96 h-, and
60-day-incubated
Figure HEWL sample
9. (A) ThT fluorescence andin (B)
90%Amide
ethanol. Bands were
I / Amide attributed
II ratio to the
for native, 0 h-,secondary structures
24 h-, 96 h-, and 60-
as follows: 1654 cm − 1 to the α-helix, 1644 cm− 1 to the random coil, 1620 cm− 1, and 1698 cm−1 to the
day-incubated HEWL sample in 90% ethanol. Bands
aggregation-specific β-sheet, 1542 and 1534 cm−1 to the Amide II internal standards.
From the data presented in Figure 9, it is clear that Amide I/Amide II intensities
ratio provides to
were attributed better insight into
the secondary oligomers
structures formation
as follows: 1654than
cm−1ThT
to thefluorescence
α-helix, 1644datacm−1which
to the
random coil, 1620 cm and 1698 cm to the aggregation-specific β-sheet, 1542 and 1534 cmfor
is not surprising as
−1,ThT is characterized
−1 as a fluorescent dye with low affinity −1 to the
the
oligomer
Amide state [26].
II internal Sum of normalized intensities of peaks attributed to aggregation specific
standards.
intermolecular β-sheets (1622 cm−1 and 1698 cm−1 ) increases strongly upon the formation
of oligomers
From the(4data
days) and continues
presented in Figureto increase during
9, it is clear thatfurther
Amidefibrillation
I/Amide II(60 days). Atratio
intensities the
same time,
provides the propensity
better insight into tooligomers
form nativelike structures
formation than (α-helix and random
ThT fluorescence data coil) decreases.
which is not
The overallas
surprising data
ThT show an almost immediate
is characterized transition
as a fluorescent dyefrom native
with low to the oligomer
affinity structure.
for the oligomer
state Superior
[26]. Sumdetection of oligomers
of normalized by applying
intensities of peaksnormalized
attributed tointensities
aggregationof Amide
specificI bands
inter-
to ThT fluorescence
molecular is alsocm
β-sheets (1622 shown
−1 and as1698
a quite
cm−1poor correlation
) increases between
strongly uponthese
the two data sets
formation of
(Supplementary Figure S1). It thus proves that FTIR spectroscopy and simple
oligomers (4 days) and continues to increase during further fibrillation (60 days). At the normalization
of the time,
same intensity
the of aggregation
propensity specific
to form β-sheet bands
nativelike gives(α-helix
structures undoubted and proof
random of oligomer
coil) de-
formation.
creases. The overall data show an almost immediate transition from native to the oligomer
structure.
3. Materials and Methods
Superior detection of oligomers by applying normalized intensities of Amide I bands
3.1.ThT
to Materials
fluorescence is also shown as a quite poor correlation between these two data sets
Lysozyme from
(Supplementary chicken
Figure egg
S1). It white,
thus Thioflavin
proves that FTIR T (ThT), 8-anilinonaphthalene-1-sulphonic
spectroscopy and simple normaliza-
acid of
tion (ANS) were purchased
the intensity from Sigma–Aldrich
of aggregation specific β-sheet(Steinheim,
bands givesGermany).
undoubtedCoomassie bril-
proof of oligo-
liantformation.
mer blue R-250 (CBB R-250) was purchased from Serva (Heidelberg, Germany). Unstained
protein molecular weight markers were purchased from Thermo Scientific (Rockford, IL,
USA).
3. All other
Materials andchemicals
Methods used were analytical grade commercial products used without
further purification.
3.1. Materials
Lysozyme from chicken egg white, Thioflavin T (ThT), 8-anilinonaphthalene-1-sul-
phonic acid (ANS) were purchased from Sigma–Aldrich (Steinheim, Germany). Coo-
massie brilliant blue R-250 (CBB R-250) was purchased from Serva (Heidelberg, Ger-Molecules 2021, 26, 970 11 of 15
3.2. HEWL Destabilization and Incubation
Commercial HEWL powder was dissolved in MiliQ water to the concentration of 60
mg/mL and further diluted by the addition of absolute ethanol to the final concentration
of 90% (v/v) resulting in a protein concentration of 6 mg/mL. The solution was incubated
at 20 ◦ C with gentle shaking. Aliquots were removed at specific time points during the
four-day-long incubation (0 h, 1 h, 2 h, 4 h, 8 h, 16 h, 24 h, 48 h, 72 h, 96 h) and after 60 days,
and analyzed using biochemical and biophysical techniques.
3.3. ThT Fluorescence
ThT and buffer were mixed with HEWL samples including native protein dissolved
in H2 O, and aliquots taken during incubation in 90% ethanol solution (0 h, 1 h, 2 h, 4 h,
8 h, 16 h, 24 h, 48 h, 72 h, 96 h, 60 days) before spectra collection. The mixture contained
200 µL of ThT solution of 100 µM concentration, 1800 µL of 100 mM Tris-HCl buffer pH 8,
and 200 µL of HEWL samples prediluted to 0.6 mg/mL in the same buffer. The excitation
wavelength was 440 nm, and emission spectra were collected in the range 450 to 550 nm
using Spectrofluorimeter FluoroMax-4 Jobin Yvon. Spectra were corrected for background
signal contribution and multiplied with the dilution factor. All spectra were collected in
triplicates and the results presented are the average of all three measurements. Emission
maximum at 484 nm was used for the construction of time-dependence diagrams.
3.4. ANS Fluorescence
Mixtures containing 200 µL of 8 mM ANS, 1900 µL of 100 mM Tris-HCl buffer pH 8,
and 100 µL of HEWL samples prediluted to 0.6 mg/mL in the same buffer were prepared.
All emission spectra in the range of 400 to 600 nm were collected after the excitation with
390 nm wavelength. All samples (native HEWL in H2 O, and samples incubated in the
presence of ethanol) were treated the same way with triple spectra collected for each.
Spectra were collected using Spectrofluorimeter FluoroMax-4 Jobin Yvon and background
correction was applied. Fluorescence intensities were multiplied with the dilution factor.
Emission maximum at 500 nm was used for the construction of time-dependence diagrams.
3.5. Atomic Force Microscopy
A sample of four-day incubated HEWL was scanned using AFM in tapping-mode
(BioScope Resolve, Bruker, Germany). Before scanning, the sample was diluted to a con-
centration of 10 µg/mL and was applied onto Mica disc (model SD-101, Bruker, Germany),
rinsed with water, and dried by the inert gas stream. Images were captured and analyzed
using Nanoscope 8.10 software.
3.6. Fourier Transform Infrared Spectroscopy (FTIR)
Infrared spectra of HEWL samples (in H2 O and C2 H5 OH) were collected using Nico-
let Summit FTIR Spectrometer (Thermo Fisher Scientific) in ATR mode. Small aliquots
of 1.5 µL in protein concentration 6 mg/mL were applied onto a diamond crystal and
solvent was evaporated in the stream of argon. Composite spectra of the mid-IR region
(400-4000 cm−1 ) were collected in 64 scans using the DTGS KBr detector. Spectra were
automatically corrected for the background absorption. OMNIC software was used for
two basic additional corrections—automatic ATR correction and baseline correction.
3.7. Spectral Analysis: Second Derivatives and Spectral Correlation
FTIR spectra were analyzed in the Amide I, Amide II, and Amide III regions. Spectra
in the Amide I region were derived using the Savitsky–Golay second derivative with seven
points and polynomial order 3. For a quantitative comparison of the spectra, the correlation
coefficient was calculated from second derivatives using Equation (1):
∑ xi yi
r= q (1)
∑ xi2 ∑ y2iMolecules 2021, 26, 970 12 of 15
where x and y are absorbances of two spectra compared at each frequency point (i).
3.8. Spectral Analysis: Deconvolution of the Amide I Region
For a more detailed analysis of spectral changes, FTIR spectra of HEWL samples in
the Amide I region were deconvoluted. This was applied on the native HEWL sample in
H2 O solution, and HEWL samples incubated 1, 4, and 60 days in 90% ethanol solution. The
Amide I region was decomposed to its original Gaussian constituents by automatic peak
resolve function in OMNIC software. Decomposed peaks were attributed to characteris-
tic secondary structures according to literature data regarding deconvolution of spectra
of HEWL in H2 O solution [20], HEWL monitored by H-D exchange [35,43,44], homol-
ogous proteins [21], and band assignment in other proteins and their fibrils [23,25,45].
Bands were assigned as follows: 1616–1622 cm−1 aggregation-specific β-sheet, 1626–
1640 cm−1 intramolecular β-sheet, 1641–1645 cm−1 random coil, 1650–1660 cm−1 α-helix,
1660–1680 cm−1 turns and unordered structures, 1690–1700 cm−1 aggregation-specific
β-sheet. The area under each peak was determined and the total area was calculated as the
sum of individual peak areas. Content of each secondary structure is given as a percentage
of the area under the certain peak in the total area of the Amide I region calculated. Results
were compared with HEWL secondary structure content determined by X-ray diffraction
calculated from UniProt entry [https://www.uniprot.org/uniprot/P00698 (accessed on 24
December 2020)].
3.9. Spectral Analysis: Amide I/Amide II Band Ratio
Intensities of characteristic peaks within the Amide I region corresponding to specific
secondary structures were normalized and compared between samples of native HEWL
in H2 O, and HEWL incubated for one, four, and 60 days in 90% C2 H5 OH. Bands cor-
responding to α-helix (1644 cm−1 ), random coil (1654 cm−1 ), and aggregation specific
β-sheets (1620 and 1698 cm−1 ) were identified, and their intensities for each sample were
normalized by dividing with the intensity of the Amide II maximum (at 1542 cm−1 in H2 O
and 1534 cm−1 in the case of 90% C2 H5 OH in H2 O) intensity. Normalized values are thus
Amide I/Amide II ratios for characteristic peaks and they are presented as dimensionless
values suggesting overall trends in the secondary structure change upon condition switch
from water solution to high-ethanol solution and prolonged incubation. Normalized values
of two aggregation-specific β-sheet bands were summed.
4. Conclusions
The analysis and detection of oligomeric amyloid intermediates are of crucial impor-
tance as these are the cytotoxic agent on the road to amyloid fibrils. HEWL was chosen
as a model system for this sort of investigation and the establishing of FTIR methodology
for oligomer detection in this study. Stress, induced by a strong decrease of the dielectric
constant of the solvent, and incubation in those conditions for up to four days, results in
modest ThT and ANS fluorescence increase when compared to the results obtained for
mature fibrils after 60 days of incubation. On the other hand, this change of the solvent
almost immediately results in prominent qualitative changes of FTIR spectra. While the
Amide II region shows only a slight shift, as it is less dependent on the secondary struc-
ture content, the Amide I and Amide III regions change completely in their shapes. Both
regions provide proves for the shift towards β-sheet bands, on the count of α-helix and
random coil upon transition to ethanol solution. More sensitive Amide I region has the
additional advantage of differentiation between intermolecular and intramolecular β-sheet
and offers the possibility of quantitative monitoring of structural changes. The appearance
of aggregation specific β-sheet band in the Amide I region is evidence of HEWL propensity
to form ordered aggregates.
Deconvoluted Amide I region of FTIR spectra shows that oligomer state, stable during
the first four days of HEWL incubation in ethanol-rich conditions, is structurally closer to
mature fibril state obtained by 60-day incubation in mentioned conditions than to originalMolecules 2021, 26, 970 13 of 15
native monomer. Nevertheless, AFM microscopy, as a suitable replacement for oligomer-
specific antibody binding, proves that HEWL is still in this intermediate oligomer state after
four days of incubation. Drastic secondary structure perturbations in oligomer compared
to monomer state, namely 20% α-helix loss and about 26% aggregation-specific β-sheet
increase, does not change strongly during the rest of the fibrillation process (mature fibrils
show 22% of total α-helix loss and about 30% of the aggregation-specific β-sheet increase).
Unlike precise but complicated deconvolution methods that meet limitations in ana-
lyzing biological samples, the ratio of the Amide I bands to the Amide II internal standard
provides a fast and simple method for monitoring the propensity of the secondary structure
change. Applying this method shows a significant increase of intramolecular and signifi-
cant decrease of nativelike secondary structures that can be used as a simple quantitative
method for oligomers detection. It can be easily applied to biological samples with high
protein concentrations, such as liquor, and provide a fast screening method for these toxic
species.
Supplementary Materials: The following are available online. Table S1. Amide I/Amide II ratio for
the quantitative assessment of oligomer formation. Figure S1. Correlation of ThT fluorescence with
normalized aggregation β-sheet IR absorbance of HEWL samples during 4-day incubation.
Author Contributions: J.M. conducted all experiments, J.M., and N.P. contributed to the design
of experiments and writing, R.P. and N.P. analyzed the results and revised the manuscript. All
authors approved the manuscript. All authors have read and agreed to the published version of the
manuscript.
Funding: This work was supported by the Ministry of Education, Science and Technological Devel-
opment of the Republic of Serbia, Contract number: 451-03-68/2020-14/200168.
Institutional Review Board Statement: Not applicable.
Informed Consent Statement: Not applicable.
Data Availability Statement: Data is contained within the article and Supplementary Material.
Acknowledgments: We thank Alexander Dulebo, Bio Sales Application Engineer at Bruker Nano
Inc, and the company for providing us the opportunity to make AFM microscopies.
Conflicts of Interest: The authors declare no conflict of interest.
Sample Availability: Samples of HEWL oligomers are available from the authors.
References
1. Arosio, P.; Knowles, T.P.; Linse, S. On the lag phase in amyloid fibril formation. Phys. Chem. Chem Phys. PCCP 2015, 17, 7606–7618.
[CrossRef]
2. Breydo, L.; Uversky, V.N. Molecular Mechanisms of Protein Misfolding. In Bio-Nanoimaging: Protein Misfolding and Aggregation,
1st ed.; Vladimir Uversky, V.N., Lyubchenko, Y.L., Eds.; Academic Press: Cambridge, MA, USA, 2014; pp. 1–14.
3. Knowles, T.P.; Vendruscolo, M.; Dobson, C.M. The amyloid state and its association with protein misfolding diseases. Nat. Rev.
Mol. Cell Biol. 2014, 15, 384–396. [CrossRef]
4. Urbic, T.; Najem, S.; Dias, C.L. Thermodynamic properties of amyloid fibrils in equilibrium. Biophys. Chem. 2017, 231, 155–160.
[CrossRef]
5. Kodali, R.; Wetzel, R. Polymorphism in the intermediates and products of amyloid assembly. Curr. Opin. Struct. Biol. 2007, 17,
48–57. [CrossRef]
6. Buell, A.K.; Dobson, C.M.; Knowles, T.P. The physical chemistry of the amyloid phenomenon: Thermodynamics and kinetics of
filamentous protein aggregation. Essays Biochem. 2014, 56, 11–39. [PubMed]
7. Gharibyan, A.L.; Zamotin, V.; Yanamandra, K.; Moskaleva, O.S.; Margulis, B.A.; Kostanyan, I.A.; Morozova-Roche, L.A. Lysozyme
amyloid oligomers and fibrils induce cellular death via different apoptotic/necrotic pathways. J. Mol. Biol. 2007, 365, 1337–1349.
[CrossRef] [PubMed]
8. Kayed, R.; Lasagna-Reeves, C.A. Molecular mechanisms of amyloid oligomers toxicity. J. Alzheimer's Dis. 2013, 33 (Suppl. S1),
S67–S78. [CrossRef]
9. Holley, M.; Eginton, C.; Schaefer, D.; Brown, L.R. Characterization of amyloidogenesis of hen egg lysozyme in concentrated
ethanol solution. Biochem. Biophys. Res. Commun. 2008, 373, 164–168. [CrossRef] [PubMed]Molecules 2021, 26, 970 14 of 15
10. Meersman, F.; Atilgan, C.; Miles, A.J.; Bader, R.; Shang, W.; Matagne, A.; Wallace, B.A.; Koch, M.H.J. Consistent Picture of the
Reversible Thermal Unfolding of Hen Egg-White Lysozyme from Experiment and Molecular Dynamics. Biophys. J. 2010, 99,
2255–2263. [CrossRef]
11. Vaney, M.C.; Maignan, S.; Ries-Kautt, M.; Ducriux, A. High-resolution structure (1.33 A) of a HEW lysozyme tetragonal crystal
grown in the APCF apparatus. Data and structural comparison with a crystal grown under microgravity from SpaceHab-01
mission. Acta Crystallographica. Sec. D Biol. Cryst. 1996, 52, 505–517. [CrossRef]
12. Frare, E.; Polverino De Laureto, P.; Zurdo, J.; Dobson, C.M.; Fontana, A. A highly amyloidogenic region of hen lysozyme. J. Mol.
Biol. 2004, 340, 1153–1165. [CrossRef]
13. Arnaudov, L.N.; de Vries, R. Thermally induced fibrillar aggregation of hen egg white lysozyme. Biophys. J. 2005, 88, 515–526.
[CrossRef] [PubMed]
14. Brudar, S.; Hribar-Lee, B. The Role of Buffers in Wild-Type HEWL Amyloid Fibril Formation Mechanism. Biomolecules 2019, 9, 65.
[CrossRef]
15. Kumar, S.; Ravi, V.K.; Swaminathan, R. Suppression of lysozyme aggregation at alkaline pH by tri-N-acetylchitotriose. Biochim.
Biophys. Acta 2009, 1794, 913–920. [CrossRef]
16. Sarkar, N.; Kumar, M.; Dubey, V.K. Rottlerin dissolves pre-formed protein amyloid: A study on hen egg white lysozyme. Biochim.
Biophys. Acta 2011, 1810, 809–814. [CrossRef] [PubMed]
17. Hameed, M.; Ahmad, B.; Khan, R.H.; Andrabi, K.I.; Fazili, K.M. Tertiary butanol induced amyloidogenesis of hen egg white
lysozyme (HEWL) is facilitated by aggregation-prone alkali-induced molten globule like conformational state. Protein Pept. Lett.
2009, 16, 56–60. [CrossRef] [PubMed]
18. Vernaglia, B.A.; Huang, J.; Clark, E.D. Guanidine hydrochloride can induce amyloid fibril formation from hen egg-white lysozyme.
Biomacromolecules 2004, 5, 1362–1370. [CrossRef] [PubMed]
19. Yonezawa, Y.; Tanaka, S.; Kubota, T.; Wakabayashi, K.; Yutani, K.; Fujiwara, S. An Insight into the pathway of the amyloid fibril
formation of hen egg white lysozyme obtained from a small-angle X-ray and neutron scattering study. J. Mol. Biol 2002, 323,
237–251. [CrossRef]
20. Chaari, A.; Fahy, C.; Chevillot-Biraud, A.; Rholam, M. Insights into Kinetics of Agitation-Induced Aggregation of Hen Lysozyme
under Heat and Acidic Conditions from Various Spectroscopic Methods. PLoS ONE 2015, 10, e0142095. [CrossRef] [PubMed]
21. Frare, E.; Mossuto, M.F.; de Laureto, P.P.; Tolin, S.; Menzer, L.; Dumoulin, M.; Dobson, C.M.; Fontana, A. Characterization of
oligomeric species on the aggregation pathway of human lysozyme. J. Mol. Biol 2009, 387, 17–27. [CrossRef] [PubMed]
22. Zou, Y.; Hao, W.; Li, H.; Gao, Y.; Sun, Y.; Ma, G. New insight into amyloid fibril formation of hen egg white lysozyme using a
two-step temperature-dependent FTIR approach. J. Phys. Chem. B 2014, 118, 9834–9843. [CrossRef] [PubMed]
23. Raskovic, B.; Popovic, M.; Ostojic, S.; Andelkovic, B.; Tesevic, V.; Polovic, N. Fourier transform infrared spectroscopy provides
an evidence of papain denaturation and aggregation during cold storage. Spectrochim. Acta A Mol. Biomol. Spectrosc. 2015, 150,
238–246. [CrossRef] [PubMed]
24. Ruggeri, F.S.; Longo, G.; Faggiano, S.; Lipiec, E.; Pastore, A.; Dietler, G. Infrared nanospectroscopy characterization of oligomeric
and fibrillar aggregates during amyloid formation. Nat. Comm. 2015, 6, 7831. [CrossRef] [PubMed]
25. Milosevic, J.; Petric, J.; Jovcic, B.; Jankovic, B.; Polovic, N. Exploring the potential of infrared spectroscopy in qualitative and
quantitative monitoring of ovalbumin amyloid fibrillation. Spectrochim. Acta A Mol. Biomol. Spectrosc. 2020, 229, 117882.
[CrossRef]
26. Gade Malmos, K.; Blancas-Mejia, L.M.; Weber, B.; Buchner, J.; Ramirez-Alvarado, M.; Naiki, H.; Otzen, D. ThT 101: A primer on
the use of thioflavin T to investigate amyloid formation. Amyloid 2017, 24, 1–16. [CrossRef] [PubMed]
27. Cao, A.; Hu, D.; Lai, L. Formation of amyloid fibrils from fully reduced hen egg white lysozyme. Protein Sci. 2004, 13, 319–324.
[CrossRef] [PubMed]
28. Goda, S.; Takano, K.; Yamagata, Y.; Nagata, R.; Akutsu, H.; Maki, S.; Namba, K.; Yutani, K. Amyloid protofilament formation of
hen egg lysozyme in highly concentrated ethanol solution. Protein Sci. 2000, 9, 369–375. [CrossRef]
29. Yanamandra, K.; Gruden, M.A.; Casaite, V.; Meskys, R.; Forsgren, L.; Morozova-Roche, L.A. α-Synuclein Reactive Antibodies as
Diagnostic Biomarkers in Blood Sera of Parkinson’s Disease Patients. PLoS ONE 2011, 6, e18513. [CrossRef] [PubMed]
30. Barth, A. Infrared spectroscopy of proteins. Biochim. Biophys. Acta 2007, 1767, 1073–1101. [CrossRef]
31. Fandrich, M.; Dobson, C.M. The behaviour of polyamino acids reveals an inverse side chain effect in amyloid structure formation.
Embo J. 2002, 21, 5682–5690. [CrossRef]
32. Bouchard, M.; Zurdo, J.; Nettleton, E.J.; Dobson, C.M.; Robinson, C.V. Formation of insulin amyloid fibrils followed by FTIR
simultaneously with CD and electron microscopy. Protein Sci. 2000, 9, 1960–1967. [CrossRef]
33. Zandomeneghi, G.; Krebs, M.R.; McCammon, M.G.; Fandrich, M. FTIR reveals structural differences between native beta-sheet
proteins and amyloid fibrils. Protein Sci. 2004, 13, 3314–3321. [CrossRef]
34. Miti, T.; Mulaj, M.; Schmit, J.D.; Muschol, M. Stable, metastable, and kinetically trapped amyloid aggregate phases. Biomacro-
molecules 2015, 16, 326–335. [CrossRef] [PubMed]
35. Du, K.; Sun, J.; Song, X.; Chen, H.; Feng, W.; Ji, P. Interaction of ionic liquid [bmin][CF3SO3] with lysozyme investigated by
two-dimensional fourier transform infrared spectroscopy. ACS Sustain. Chem. Eng. 2014, 2, 1420–1428. [CrossRef]
36. Seo, J.; Hoffmann, W.; Warnke, S.; Huang, X.; Gewinner, S.; Schollkopf, W.; Bowers, M.T.; von Helden, G.; Pagel, K. An infrared
spectroscopy approach to follow beta-sheet formation in peptide amyloid assemblies. Nat. Chem. 2017, 9, 39–44. [CrossRef]You can also read