Estimation of total extractive content of wood from planted and native forests by near infrared spectroscopy - iForest ...
←
→
Page content transcription
If your browser does not render page correctly, please read the page content below
iForest                                                                                                      Research Article
                                                                                                           doi: 10.3832/ifor3472-013
                                                                                                                    vol. 14, pp. 18-25
         Biogeosciences and Forestry

Estimation of total extractive content of wood from planted and native
forests by near infrared spectroscopy

Luana Teixeira Mancini,                           The aim of this study was to evaluate the performance of multivariate models
                                                  using Near infrared (NIR) spectra for predicting total extractives content of
Fernanda Maria Guedes Ramalho,                    solid and powdered wood of planted and native species from tropical savanna.
Paulo Fernando Trugilho,                          NIR spectra were recorded on the milled wood and radial surface of solid wood
Paulo Ricardo Gherardi Hein                       specimens of Cedrela sp., Jacaranda sp., Apuleia sp., Aspidosperma sp. and
                                                  clones of Eucalyptus hybrids via an integrating sphere and fiber optics probe.
                                                  NIR spectral signatures were evaluated by Principal Component Analysis (PCA)
                                                  and then associated to the total extractive content quantified by extraction in
                                                  toluene/ethanol (2:1) solutions, pure ethanol and hot water by Partial Least
                                                  Squares (PLS) regressions. PCA revealed that NIR spectra measured in solid
                                                  wood by integrating sphere gave a better discrimination of wood species. A
                                                  global PLS model was developed based on NIR obtained by integrating sphere
                                                  with satisfactory estimations both for solid wood (R²cv= 0.87, RMSECV= 1.08%)
                                                  and wood powder (R²cv= 0.85, RMSECV= 1.19%). An independent test-set vali-
                                                  dation was performed with 25% of the samples and yielded R²p= 0.93 and RM-
                                                  SEP= 0.95% (for solid wood) and R²p= 0.87 and RMSEP= 1.40% (for wood pow-
                                                  der). Both models can be applied for rapid screenings, though models devel-
                                                  oped from NIR spectra by integrating sphere on solid wood are considered
                                                  more suitable for rapid predictions of extractive content in unknown wood
                                                  specimens.

                                                  Keywords: Lumber, Multivariate Analysis, Non-destructive Testing, Test Set Val-
                                                  idation, Wood Chemistry

Introduction                                     1963). In addition to these structural com-        of a tree: the sugars and other soluble con-
  The chemical composition of wood is            ponents, wood is made up of non-struc-             stituents of the sap as well as food re-
complex. Wood tissues are composed of            tural organic and inorganic components             serves (starch and fats) are found in the
many chemical components that are un-            grouped into two classes: extractives and          sapwood, while the phenolic substances
evenly distributed as a result of the ana-       mineral compounds (Pereira et al. 2003).           are normally deposited in the heartwood
tomical structure (Trugilho et al. 1996).        According to Pettersen (1984), the pres-           (Pereira et al. 2003). The benzene alcohol
Different combinations of chemical compo-        ence of some of these extractives influ-           extractives are often higher in heartwood
sitions, resulting from the effects of the en-   ences wood resistance to fungal and insect         while the sapwood has a higher acidic/pH
vironment and/or genetics, are also re-          attack, coloration, odor, permeability, den-       (Li et al. 2019).
sponsible for differences among and within       sity and hardness of wood. The extractives           Although the extractives contribute to
wood species (Zobel & Van Buijtenen              can constitute 4% to 10% of the dry mass of        only a small percentage of the wood com-
1989). According to Pereira et al. (2003) a      temperate hardwood species and up to               position, the solubility of extractives in
large proportion of the variation found          20% in species from tropical climates (Pet-        wood has importance regarding its proper-
among specific wood samples is an expres-        tersen 1984). According to Foelkel (1977)          ties and, therefore, in industrial applica-
sion of chemical characteristics and these       the most important extractives are ter-            tions (Shebani et al. 2008). The extractives
greatly affect end use properties and mate-      penes and resin acids (both consisting of          have, for example, a significantly negative
rial quality.                                    isoprene units) and polyphenols (flavonols,        effect on the pulping and bleaching proc-
  Wood structure has been described as an        anthocyanins, quinones, lignans, and tan-          ess of cellulosic pulp (He & Hu 2013) and
interpenetrating system of polymers com-         nins). There is a great variation in the distri-   their oxidation tends to increase the acidity
prising holocellulose and lignin (Browning       bution of extractives throughout the wood          of the wood, thereby promoting its degra-
                                                                                                    dation (Shebani et al. 2008). According to
   Departamento de Ciências Florestais, DCF, Universidade Federal de Lavras, CEP 37200-000          Várhegyi et al. (2004), the removal of some
Lavras, MG (Brazil)                                                                                 extractives decreases the fixed carbon con-
                                                                                                    tent, reducing the charcoal yield and shift-
@ Paulo Ricardo Gherardi Hein (paulo.hein@ufla.br)                                                  ing the thermo-gravimetric curve to higher
                                                                                                    temperatures. However, the extracts con-
Received: Apr 15, 2020 - Accepted: Nov 06, 2020                                                     tained in the wood of forest species may
                                                                                                    have potential for nutraceutical applica-
Citation: Teixeira Mancini L, Guedes Ramalho FM, Trugilho PF, Gherardi Hein PR (2021).              tions (Santos et al. 2017), as antioxidants
Estimation of total extractive content of wood from planted and native forests by near              (Cetera et al. 2019) and antifungal/antimi-
infrared spectroscopy. iForest 14: 18-25. – doi: 10.3832/ifor3472-013 [online 2021-01-09]           crobial agents (Lovaglio et al. 2017). Thus,
                                                                                                    investigating the role of wood extractives
Communicated by: Giacomo Goli                                                                       is critical for many industrial applications.
                                                                                                      The traditional method to determine the

© SISEF https://iforest.sisef.org/                                     18                                                     iForest 14: 18-25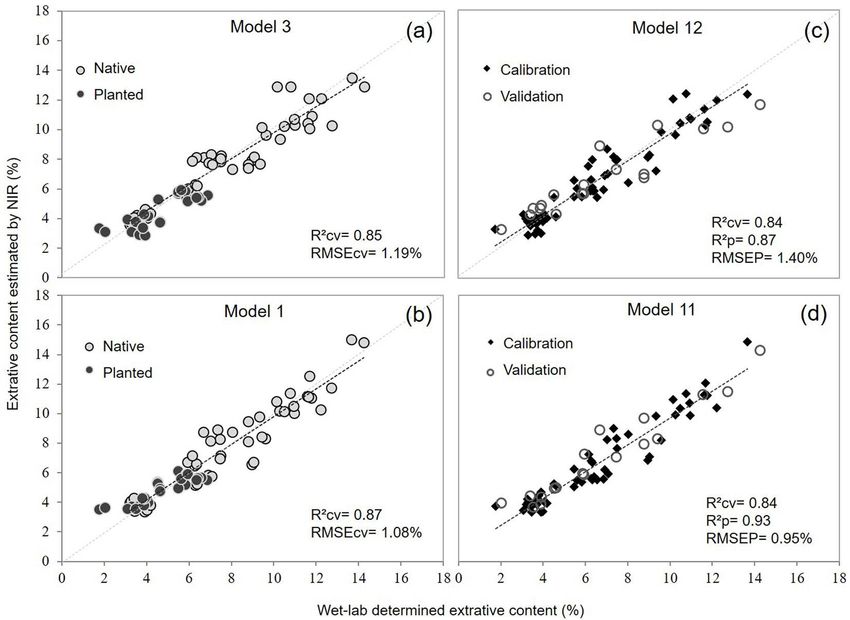
Teixeira Mancini L et al. - iForest 14: 18-25

                                        extractive content of wood is time-con-         tential of spectroscopy in estimating the         for five hours, 150 ml of ethanol for four
iForest – Biogeosciences and Forestry

                                        suming, costly, and operationally inappro-      extractive content in several species of          hours and hot water for two hours. Differ-
                                        priate for large sample quantities. There is    wood using several solvents. However, the         ent flasks were used for each solvent se-
                                        no universal solvent that removes all sub-      influence of the sample preparation (solid        quence. The process was carried out in du-
                                        stances; each solvent is selective for one or   or powdered wood) on the fit of the pre-          plicate using heating plates equipped with
                                        more classes of extractives, thus the use of    dictive models for extractive content is still    a soxhlet extraction system. The tempera-
                                        a sequence of solvents is needed. In gen-       not clear. Thus, the first objective of this      ture of heating plates was kept slightly be-
                                        eral, an extraction sequence initiated by       study was to develop predictive models to         low the boiling temperature of the sol-
                                        the ethanol/toluene mixture, followed by        monitor the total extractive content of           vents, around 80 °C. In the soxhlet extrac-
                                        ethanol and finished by hot water is used       planted and natural forest wood from NIR          tion system, the sample was placed in a
                                        to quantify the extractives (Oliveira & Della   spectra measured in solid wood and pow-           porous crucible that was gradually filled
                                        Lucia 1994). Therefore, the development of      der, and validate them using independent          with the solvent. When the liquid reached
                                        new solutions for chemical characteriza-        sets. Moreover, the study also aimed to           the overflow level, a siphon aspirated the
                                        tion of wood, preferably being fast and         verify whether NIR models developed for           solute and discharged it back into the distil-
                                        economical, is important for industrial use     wood specimens from planted forests can           lation flask, thus transporting the extracts.
                                        of wood. Near infrared (NIR) spectroscopy       predict the extractive content of wood            This operation was repeated until the ex-
                                        presents great potential for the evaluation     specimens from natural forest species.            traction was completed.
                                        of several materials, such as polymers, tex-                                                        After the extraction process, the porous
                                        tiles, pharmaceuticals and petrochemicals       Material and methods                              crucibles with extractive-free wood pow-
                                        (Tsuchikawa & Schwanninger 2013). Many                                                            der were placed in an oven at 103 ± 2 °C un-
                                        studies have shown that NIR spectroscopy        Plant material                                    til reaching constant mass, and were later
                                        can be applied to evaluate the chemical,          The wood samples used in this study             weighed to determine their dry mass. The
                                        physical, mechanical and anatomical prop-       were collected from different forest spe-         total extractive content of the samples
                                        erties of wood (Tsuchikawa & Kobori 2015).      cies from the Cerrado (tropical savanna)          was then quantified by the difference be-
                                          In regard to the NIR based models for         and commercial plantation biomes in Bra-          tween the dry mass of the material before
                                        wood extractives of softwoods, Gierlinger       zil. The Cerrado species (21° 10′ S, 44° 54′ W)   and after extraction. The volatile organic
                                        et al. (2002) developed models to estimate      are: Cedrela sp. (Cedar), Jacaranda sp.           compounds possibly emitted as gases dur-
                                        the extractive content of the wood core of      (Jacaranda), Apuleia sp. (Garapa) and Aspi-       ing the drying were not taken into account
                                        Larix sp. in acetone and hot water by           dosperma sp. (Peroba). These species were         in the calculations.
                                        means of powdered wood and solid wood           chosen because they stand out among the
                                        and reported that spectra of powdered           native woods of Brazil used commercially.         NIR spectra acquisition
                                        wood generated more accurate models.            The woods were obtained from sawmills               NIR signatures were recorded initially in
                                        Uner et al. (2011) evaluated the extractive     and lumber companies in July 2015. The            solid wood and, after processing the mate-
                                        and lignin contents in the Pinus brutia         commercial plantation species are repre-          rial, in the powdered wood before the ex-
                                        wood powder by NIR spectroscopy and             sented by clones of Eucalyptus grandis × E.       traction process. An MPA FT-NIR® spectro-
                                        presented models whose standard error of        urophylla hybrids from two forestry com-          meter (Bruker Optik GmbH, Ettlingen, Ger-
                                        prediction ranged from 0.26% to 1.85% for       panies: Vallourec Florestal Ltda plantations      many) was used to acquire the NIR spec-
                                        the extractive content. He & Hu (2013) ap-      (19° 16′ S, 44° 24′ W) which focuses on char-     tra, which is a Fourier transform (FT) based
                                        plied the NIR spectroscopy technique to         coal production (clones of 6.5 years) and         spectrometer equipped with an integrating
                                        estimate lignin and extractive content of       Cenibra SA plantations (19° 17′ S, 42° 23′ W)     sphere and an optical fiber. The software
                                        various coniferous and hardwood species         focused on cellulose production (clones of        OPUS ver. 7.5 (Bruker) was used for data
                                        and presented satisfactory models for the       6 years).                                         storage.
                                        prediction of extractive content in ethanol/
                                        benzene (R² = 0.96) and cross-validation er-    Sample preparation and total                      NIR signatures of solid wood
                                        ror of 0.18%.                                   extractives determination                           NIR signatures of solid wood were re-
                                          NIR models for extractive content of            For each plant material, six specimens          corded directly on the radial face (transi-
                                        hardwoods also are reported in the litera-      with dimensions of approximately 35 × 35 ×        tion between core and sapwood) of the
                                        ture. Silva et al. (2013) developed NIR mod-    100 mm (R × T × L) representing native and        specimens, in an air-conditioned room, us-
                                        els to estimate the total content of pheno-     commercial plantation woods, were pre-            ing the integrating sphere (Fig. 1a), by dif-
                                        lic compounds and extractives soluble in        pared as described by Ramalho et al.              fuse reflection mode, in the acquisition
                                        hot water in mahogany, with a calibration       (2017), totaling 36 specimens. The speci-         range of 12,500 to 3,500 cm-1 and with a
                                        error of 0.46% and cross-validation of          mens were taken from central planks and           spectral resolution of 8 cm-1. Each spec-
                                        0.63%. Poke et al. (2004) studied the ex-       without shell. The specimens were pro-            trum represents an average of 32 scans.
                                        tractive content of Eucalyptus globulus         cessed using a planing machine and the            For modeling, only the NIR range between
                                        wood in methanol with the NIR spectra           shavings produced was ground in a Wiley           9,000 and 4,000 cm-1 was considered. NIR
                                        measured in wood powder and reported            Mill® (Thomas Scientific, LLC, Swedesboro,        spectra were taken only in the radial sur-
                                        that the calibration error was 0.56%. Later,    NJ, USA) fitted with a 2 mm screen. The           face, because a spectrum on the tangential
                                        Poke & Raymond (2006) verified that the         powdered wood was classified by means             surface portrays the chemical information
                                        existing calibrations from wood powder          of 40 and 60 mesh screen sets. Total mate-        of a short period of the tree growth, as the
                                        were inadequate for the prediction of ex-       rial extraction was performed on the saw-         radiation penetrates a few millimeters in
                                        tractive content from spectra measured in       dust that passed through the 40 mesh              one growth ring, while on the radial sur-
                                        solid wood. Li & Altaner (2019) have associ-    sieve and was retained in the 60 mesh             face the light will interact with material de-
                                        ated NIR data with the extractives content      sieve.                                            veloped during several months or years of
                                        determined by accelerated solvent extrac-         For the determination of the total extrac-      growth.
                                        tion (ASE) of Eucalyptus bosistoana, E. glob-   tives of the wood, the technical standard
                                        oidea and E. argophloia wood. They gener-       NBR 14853 (ABTN 2010) was used. In the            NIR signatures of powder wood
                                        ated NIR-based models able to predict ex-       process of total sample extraction, 2.00 g         The same procedure and equipment for
                                        tractives content with errors from 0.34% to     of wood dry sawdust, previously classified        acquisition of the solid wood spectra was
                                        18.9% and a residual mean square error          in the 40 and 60 mesh sieves, and the fol-        used for recording the spectra in the pow-
                                        (RMSE) of 0.9%.                                 lowing sequence of solvents were used:            dered wood, but the two acquisition paths
                                          The above studies demonstrated the po-        150 ml of the toluene/ethanol mixture (2:1)       were used: integrating sphere and optical

                                        19                                                                                                                          iForest 14: 18-25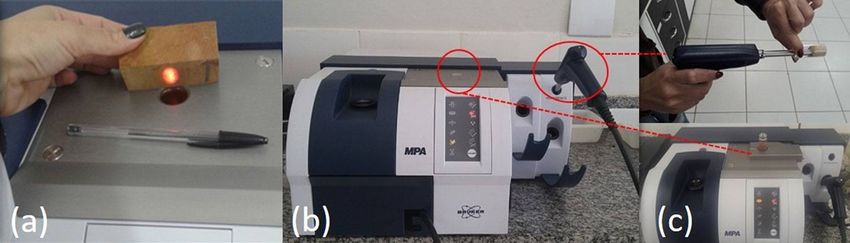
Total extractive content of wood by near infrared spectroscopy

                                                                                                                                              iForest – Biogeosciences and Forestry
 Fig. 1 - Acquisition of spectra with NIR spectrometer (b) in solid wood using integrating sphere (a and c) and powder wood using
 optical fiber (c).

fiber (Fig. 1c). Spectra of powdered wood Results and discussion                               for Eucalyptus urophylla and 4.15% for Euca-
were recorded with the material at equilib-     The natural species and the Eucalyptus hy- lyptus grandis wood at 7.5 years. Hsing et
rium moisture (12%) and oven dried (0%).      brids investigated in the present study al. (2016) obtained extractive values be-
                                              were chosen to verify whether chemical tween 5.89% and 7.75% for clones of Euca-
Multivariate statistics                       similarity between wood from natural and lyptus grandis × E. urophylla at 2.5 years of
  Principal Component Analysis (PCA) and planted forests can be a barrier for devel- age, which are higher than those obtained
Partial Least Square Regression (PLS) oping NIR models aimed at discriminating in this study; however, the hybrids had dif-
analyses were conducted using the free the origin of wood (natural and commer- ferent ages.
software Chemoface ver. 1.61 (Nunes et al. cial plantations). Ramalho et al. (2017) im-
2012). The analyses were carried out both plemented this approach for rapid discrimi- NIR Spectra
on the raw spectra (untreated) and after nation of wood type that has been trans-                The mean NIR spectra obtained by diffuse
mathematical pre-treatment (first deriva- ported and sold illegally in many countries, reflection of solid wood through the inte-
tive).                                        and reported promising findings. The pres- grating sphere and of the powdered wood
  PCA was used to verify the spectral simi- ent study was carried out within the frame- obtained by the two acquisition pathways
larity of the different samples of the spe- work of this major project.                        of the equipment are shown in Fig. 2. The
cies used, both from solid wood and pow-                                                       NIR signature from 9000 to 4000 cm -1 was
dered wood spectra. The PLS regression Determination of total extractives                      used for models because this range was
was used to correlate the NIR spectral data content                                            more informative.
(independent variables) and the extractive      The descriptive statistics of the values of      The most prominent absorption bands in
content obtained by wet-chemistry analy- total extractives determined by traditional all plant materials are approximately at
ses (dependent variables). NIR spectra ob- laboratory method for each plant material 7000 and 5100 cm-1 (Fig. 2). These bands
tained by the two acquisition pathways (in- which was used as reference for model cal- are consistent with the results of Silva et al.
tegrating sphere and optical fiber) on solid ibration are shown in Tab. 1.                     (2013) who observed higher absorption at
wood and powdered wood at equilibrium           Aspidosperma sp. presented the highest wavelengths of approximately 1410 and
moisture were used for these analyses.        total extractive content, with an average 1900 nm and attributed these absorption
  Calibration models were cross-validated of 10.99%, followed by Apuleia sp. and Eu- peaks to the O-H bonds and O-H and C=O
by leave-one-out and external set valida- calyptus (EC and EV) with an average of bands combinations, respectively.
tion methods. The external validation was 4.25%, 5.04% and 3.66%, respectively (Tab.
carried out using two different approaches: 1). Eucalyptus specimens (EC) presented Principal Component Analysis (PCA)
first, PLS models were developed with 75% the greatest variation among the values of             PCA was carried out using the raw spec-
of the randomly chosen specimens and val- its samples with a coefficient of variation of tra obtained by integrating sphere from
idated with the remaining 25%. In the sec- 39.32%. The lowest variation was observed solid wood and powdered wood (Fig. 3), to
ond step, the models were calibrated using for Apuleia sp., with an 8.39% coefficient of obtain a preliminary classification of the
data from five species and the validation variation, and also presented the lowest species used according to its chemical
was done against the sixth species (not in- average extractive content. Pereira et al. properties, in which the extractive content
cluded in the calibrated model). This proce- (2012) found 4.7% to 4.97% of extractives of the latter is highlighted.
dure was repeated six times, for the six
plant materials.
  The models were developed with eight la-      Tab. 1 - Descriptive statistics of the total content of extractives from different wood
tent variables (LV). Preliminary tests indi-    species determined by solvent sequence. (CV): coefficient of variation; (N): sample
cated that eight LVs minimized the root         intensity.
mean standard error (RMSE) and maxi-
mized the coefficient of determination (R²).                              Common                    Mean      Max      Min      CV
                                                 Plant material                             Abbr.                                      N
No samples were considered outliers. The                                  name                       (%)      (%)      (%)      (%)
criteria for selection of the prediction mod-     Eucalyptus (Cenibra)     Eucalypt         EC       4.25     6.85    1.75    39.32 12
els were the values of coefficient of deter-      Eucalyptus (Vallourec) Eucalypt           EV       5.04     6.41    3.80    19.82 12
mination of the cross-validation leave-one-
                                                  Cedrela sp.              Cedar            C        7.03     9.33    5.94    15.35 12
out (R²cv) and for prediction (R²p), root
mean standard error of the cross-validation       Apuleia  sp.             Garapa           G        3.66     4.18    3.20      8.39 12
(RMSECV) and ratio performance deviation          Jacaranda sp.            Jacaranda        J        9.46    11.77    6.69    19.66 12
(RPD).                                            Aspidosperma sp.         Peroba            P      10.99    14.25     8.04    18.49 12

iForest 14: 18-25                                                                                                                       20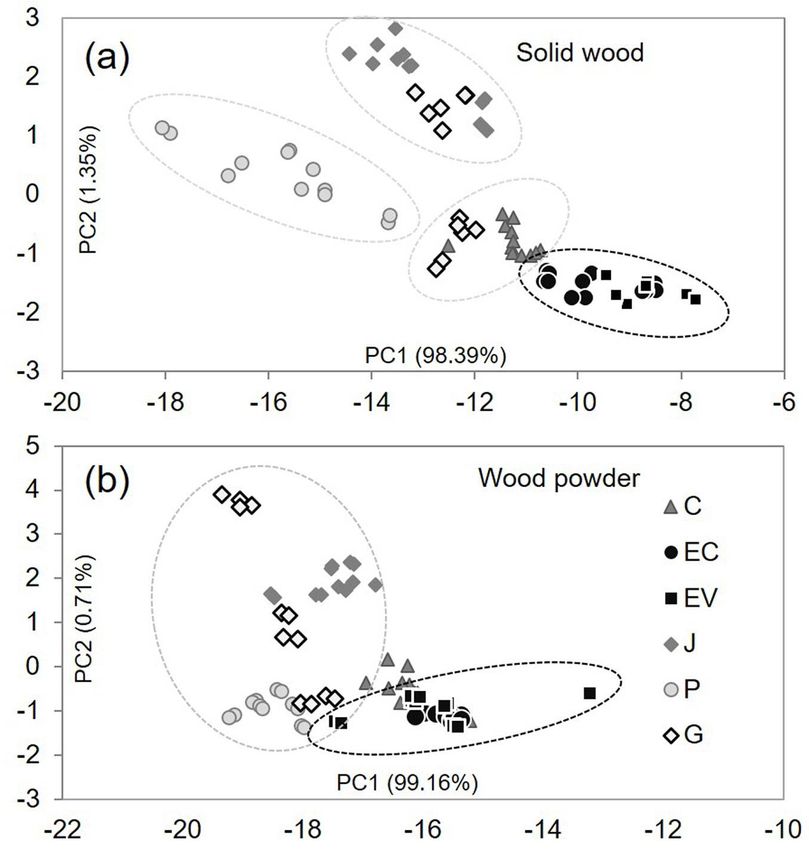
Teixeira Mancini L et al. - iForest 14: 18-25
iForest – Biogeosciences and Forestry

                                         Fig. 2 - Mean spectra untreated (a) and treated by second               Fig. 3 - Results of the principal components analysis of NIR
                                         derivative (b), collected in solid wood through the integrating         spectra obtained in solid wood (a) and wood powder (b)
                                         sphere and in powder wood through the two acquisition path-             through the integrating sphere. (C): Cedrela sp.; (EC): Eucalyp-
                                         ways of the equipment. (C): Cedrela sp.; (EC): Eucalyptus C;            tus C; (EV): Eucalyptus V; (J): Jacaranda sp.; (P): Aspidosperma
                                         (EV): Eucalyptus V; (J): Jacaranda sp.; (P): Aspidosperma sp.;          sp.; (G): Apuleia sp.
                                         (G): Apuleia sp.

                                          The contribution of each principal compo-        The PCA scores resulted in better classifi-   the cedar (C) (Fig. 3b). The overlap be-
                                        nent in the spectral variance obtained in        cation, as regards the grouping (dashed         tween the Eucalyptus (EC and EV) speci-
                                        the two approaches (solid and powder) is         groups) according to the species, when us-      mens was expected as they belong to the
                                        presented in the graph axis of Fig. 3. Princi-   ing the spectra obtained through the solid      same genus, though from different loca-
                                        pal components 1 and 2, for all analyses, ac-    wood (Fig. 3a). When the spectra obtained       tions, and therefore they show a high
                                        counted for more than 99% of the varia-          using the powdered wood were used a             chemical similarity. On the other hand, the
                                        tion. The principal components (PCs) help        larger overlap of some samples occurred.        species Garapa (G) was not well classified
                                        in the identification and interpretation of      Thus, a full separation of each species         in any analysis, overlapping several species
                                        the dependencies that exist among the            based on extractive content data was not        and showing no classification trend.
                                        variables and, also, in the examination of       possible, although the samples from Euca-         Overall, a better discrimination between
                                        the relationships that can exist among the       lyptus differed from the grouping (dashed       species was obtained when PCA was per-
                                        individuals (Timm 2002).                         groups) of the native woods, except for         formed on solid samples than on wood
                                                                                                                                         powder data. A possible explanation is that
                                                                                                                                         the spectrum measured from solid wood
                                             Fig. 4 - PCA load-                                                                          contains physical information from the
                                                 ings from un-                                                                           wood specimens, in addition to variations
                                               treated (a) and                                                                           in their chemical composition. Spectra cap-
                                               treated (b) NIR                                                                           ture variations due to wood texture, color,
                                                       spectra.                                                                          brightness, surface quality, etc. On the
                                                                                                                                         other hand, the physical component effect
                                                                                                                                         is canceled out in the wood powder spec-
                                                                                                                                         tra. A possible physical effect on the wood
                                                                                                                                         powder spectra could be the response to
                                                                                                                                         the particle size, though in this study the
                                                                                                                                         particle dimension was kept constant (40
                                                                                                                                         to 60 mesh) for all wood samples.
                                                                                                                                           The PCA loadings from untreated (Fig. 4a)
                                                                                                                                         and treated (Fig. 4b) NIR spectra are pre-
                                                                                                                                         sented to help interpreting spectral bands.

                                                                                                                                         Global PLS model for extractive content
                                                                                                                                           Partial Least Squares (PLS) regression
                                                                                                                                         analysis was performed with the aim of ob-
                                                                                                                                         taining global models for the estimation of
                                                                                                                                         total extractive content of the wood using
                                                                                                                                         both original spectra and those treated by

                                        21                                                                                                                        iForest 14: 18-25
Total extractive content of wood by near infrared spectroscopy
the first derivative method. The results of
iForest – Biogeosciences and Forestry
Tab. 2 - Global calibrations and cross-validations to estimate the total extractive con-
these analyses are summarized in Tab. 2.
tent of wood from NIR spectra. (Treat): mathematical treatment; (“-“): original data;
In general, the application of the first de-
(1d): first derivative; (R²c): coefficient of determination for calibration; (RMSEC): mean
rivative pretreatment was not efficient in
square error for calibration (%); (R²cv): coefficient of determination for cross valida-
estimating the extractive content of the
tion; (RMSECV): mean square error for cross validation (%); (RPD): deviation to perfor-
wood, since all the models presented
mance ratio; (EMC): equilibrium moisture content; (0%): 0% moisture.
lower calibration and validation results
when submitted to such method (Tab. 2).
All the models based on spectra obtained Model Via Processing Moisture Treat R²c RMSEC R²cv RMSECV RPD
from integrating sphere had better statis- 1 Sphere Solid EMC - 0.91 0.90 0.87 1.08 2.83
tics when compared to the models gener- 2 Sphere Solid EMC 1d 0.91 0.90 0.84 1.20 2.55
ated by optical fiber, as seen for Model 3
3 Sphere Powder EMC - 0.90 0.95 0.85 1.19 2.57
(sphere) and Model 7 (fiber), which had re-
spectively R²cv values of 0.85 and 0.71, RM- 4 Sphere Powder EMC 1d 0.87 1.11 0.81 1.34 2.30
SECV values of 1.19% and 1.65% and an RPD 5 Sphere Powder 0% - 0.81 1.32 0.72 1.63 1.89
of 2.57 and 1.85. Therefore, the integrating 6 Sphere Powder 0% 1d 0.84 1.21 0.72 1.63 1.89
sphere is more suitable for the acquisition
of spectra when the aim is to estimate the 7 Fiber Powder EMC - 0.91 0.90 0.71 1.65 1.85
extractive content of the wood. It is impor- 8 Fiber Powder EMC 1d 0.72 1.61 0.39 2.48 1.24
tant to note that this acquisition path 9 Fiber Powder 0% - 0.86 1.14 0.61 1.96 1.57
presents a surface area approximately 100
10 Fiber Powder 0% 1d 0.77 1.45 0.53 2.14 1.43
times larger than the surface area of a
fiber-optic probe.
Most of the models generated from
wood spectra at 0% moisture presented Tab. 3 - External calibrations and validations performed from 25% of the samples, using
statistics well below the models generated spectral data obtained from the sphere and fiber pathways. (R²cv): coefficient of
from wood spectra at equilibrium moisture determination for cross validation; (RMSECV): mean square error for cross validation
(moisture of approximately 12% – Tab. 2). (%); (R²p): coefficient of determination for prediction; (RMSEP): mean square error for
This could happen because in wet wood prediction (%); (RPD): deviation to performance ratio; (EMC): equilibrium moisture
the incident light penetrates deeper, cap- content; (0%): 0% moisture.
turing more information. In addition, the
spectra presented absorption peaks at Model Via Processing Moisture R²cv RMSECV R²p RMSEP RPD
wave numbers that are assigned to the O-H 11 Sphere Solid EMC 0.84 1.17 0.93 0.95 3.10
bonds (Fig. 2), so the presence of water 12 Sphere Powder EMC 0.84 1.16 0.87 1.40 2.12
may be the reason of the best results ob-
13 Sphere Powder 0% 0.68 1.68 0.67 1.93 1.53
tained using wood in equilibrium moisture.
Also, this facilitates the process and lowers 14 Fiber Powder EMC 0.74 1.51 0.64 2.08 1.42
its cost, as the drying step prior to analysis 15 Fiber Powder 0% 0.67 1.71 0.58 2.19 1.35
is no longer necessary.
The most robust statistics in estimating
extractive content from wood were ob- pared to spectra from ground wood ues observed for planted species as com-
tained using Model 1 (R²cv = 0.87, RMSECV (model 12: R²p = 0.87, RMSEP = 1.40%). pared to native species confirmed their
= 1.08%) which is based on spectra acquired However, in both cases these models can lower variability in extractive content (Fig.
through integrating sphere and solid wood be considered promising tools for the pre- 5a, Fig. 5b).
at equilibrium moisture. Model 3 (R²cv = diction of total extractive contents of un- Gierlinger et al. (2002), Poke & Raymond
0.85. RMSECV = 1.19%) was based on NIR of known wood. (2006) and Li & Altaner (2018) have com-
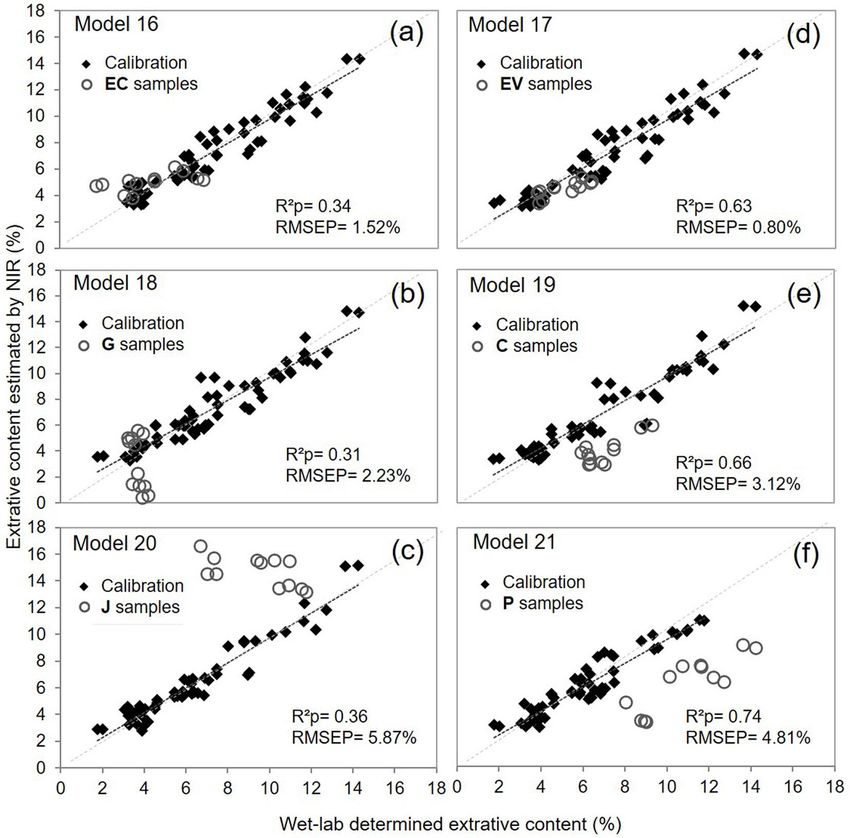
wood powder at equilibrium moisture. De- Fig. 5 presents the relationship between pared the use of solid wood and powdered
spite the difference in the associated statis- the extractive content of the wood deter- wood in the estimation of extractive con-
tics, the two models presented satisfactory mined in the laboratory and that predicted tents using NIR spectroscopy. Contrary to
results and could be used successfully. by NIR analysis. Fig. 5a depicts the results the results in Tab. 2, the authors reported
obtained by Model 3 (Tab. 2) using pow- more robust results using spectra from
Independent random batch validation dered wood and cross-validation, while Fig. wood powder. Gierlinger et al. (2002) stud-
In the first independent validation, 75% of 5b shows the results of Model 1 (Tab. 2) ied the species Larix sp. with two different
the samples were used for the calibration generated from the spectra of solid wood solvents for extraction. They reported pro-
of the models while the remaining 25% measured by the integrating sphere. Also mising models for predicting extractives in
were used for their validation. For this, we shown is the relationship between ob- hot water from spectra taken on wood
used original spectral data without mathe- served and predicted values of extractive powder (R²cv = 0.96, RMSECV = 0.86%)
matical treatments. The results of these content based on spectra from wood pow- and solid wood (R2c = 0.81, RMSECV =
analyses are summarized in Tab. 3. der (Fig. 5c) and solid wood (Fig. 5d) after 1.85%). For extractives in acetone, the mod-
Again, the integrating sphere showed validation. els presented lower statistics: R²cv = 0.85
better performance, as indicated by the A strong correlation between the values and RMSECV = 0.32% for wood powder and
statistics related to the generated models predicted by NIR analysis and those mea- R²cv = 0.70 and RMSECV = 0.43% for solid
(Tab. 3). In most cases, the R²p values were sured by wet-chemistry in laboratory was wood. Poke & Raymond (2006) studied Eu-
superior to the R²cv values, showing the detected both using calibration and exter- calyptus globulus wood extractives in
good performance of the validation. How- nal validation. Correlation was higher for methanol and reported values of R²cv =
ever, models based on spectra recorded by spectra recorded by integrating sphere on 0.89 and RMSECV = 0.56% (powder wood)
fiber-optic probe did not present this be- wood at equilibrium moisture. Regarding and R²cv = 0.87 and RMSECV = 1.37% (solid
havior. the use of wood in the solid or powder wood). Li & Altaner (2018) used NIR analy-
Better predictions were obtained by condition, a slight improvement in the cor- sis for assessing the extractive content of
spectra measured in solid wood (model 11: relation was observed for solid wood. Eucalyptus bosistoana from extraction in
R²p = 0.93, RMSEP = 0.95%) when com- The lower dispersion of the predicted val- ethanol solution, reporting values of R²cv =
iForest 14: 18-25 22Teixeira Mancini L et al. - iForest 14: 18-25
iForest – Biogeosciences and Forestry
Fig. 5 - Graph of calibra-
tions and cross and exter-
nal validations with spec-
tral data obtained from the
integrating sphere in pow-
dered wood (a and c) and
solid wood (b and d).
0.94 and RMSECV = 0.87% for wood pow- thors used a single solvent for the extrac- cients, had errors considered too high.
der and R²cv = 0.87 and RMSECV = 1.27% for tion, while in the present study the models The models based on spectra obtained
solid wood. were developed to estimate total extrac- through fiber-optic probe did not yield sat-
He & Hu (2013) applied NIR spectroscopy tion using a sequence of solvents. isfactory results, with low prediction coeffi-
for the prediction of the extractive content cients and/or high prediction errors. Fig. 6
of several wood species, including conifer- Independent validation by species shows the calibration and validation
ous and hardwood, and reported RMSEP = To assess the model accuracy in predict- graphs for each of the models generated
0.403% when extracted with sodium hy- ing the extractive content from unknown from the solid wood spectra.
droxide and RMSEP = 0.206% when ex- wood, calibrated models based on five The graphs in Fig. 6 showed a good distri-
tracted in ethanol/benzene. Uner et al. species were validated against a different bution of the calibration samples and a cu-
(2011) investigated wood powder of Pinus species not included in the calibration step. rious distribution for the validation sam-
brutia and presented models for extractive The analyses were carried out in three dif- ples, the latter being in some cases quite
content with a RMSEP varying between ferent steps: (i) from NIR spectra recorded distant from the trend line of the calibra-
0.26% and 1.85%. with integrating sphere from solid wood; tion samples. The best distribution of the
Gierlinger et al. (2002) investigated wood (ii) from NIR spectra recorded with inte- validation samples in the three sets of
in both conditions (solid and powder) and grating sphere from powdered wood; and graphs is observed using the planted mate-
obtained results contrary to the findings of (iii) from NIR spectra recorded with fiber- rials (EC and EV). The explanation for these
this study. They found more robust predic- optic probe in milled wood. Tab. 4 shows results lies in the fact that when one of the
tion models using wood powder (R²p = the statistics for each model in each of the Eucalyptus clone materials is used to vali-
0.84, RMSEP = 0.30%) in comparison to sol- three steps described above. date the models, consequently the other
id wood (R²p = 0.78, RMSEP = 0.36%). How- Tab. 4 shows that most of the models clone material was part of the calibration
ever, both models presented close values presented a satisfactory calibration using model. Since they belong to the same
and could be successfully applied for esti- only five species. The best results in the val- species and have great chemical similarity,
mating extractive content of unknown idation step were found using solid wood this led to achieve the best results in the
wood. spectra obtained through integrating validation step.
The models used in this study had close sphere. The best efficacy was observed us-
and robust statistics and yielded satisfac- ing the model validated by EV (R²p = 0.63, Concluding remarks
tory predictions of the extractive content RMSEP = 0.80%). The models validated by NIR spectroscopy proved to be an effi-
of unknown wood samples. Based on our the species C (R²p = 0.66, RMSEP = 3.12%) cient and fast technique for estimating the
results, the models developed from NIR and species P (R²p = 0.74, RMSEP = 4.81%) total extractive content of wood. For this
signatures taken on solid wood presented were also satisfactory for rapid screenings purpose, models from spectra acquired by
more robust statistics, probably because but presented a prediction error consid- the two acquisition pathways of the equip-
these are based on data from several dif- ered high for extractive content. ment can be used. However, the acquisi-
ferent species, while the above-mentioned Considering the powdered wood spectra, tion by integrating sphere showed more
studies were done using a single species. Li the highest prediction coefficient and low- robust results in different cases.
& Altaner (2019) also found better results est prediction error was obtained using the The preparation of samples (solid wood
for models including data from mixed spe- model validated by the EC species (R²p = or powder wood) affects the acquired
cies rather than from single species, both 0.66, RMSEP = 1.04%). The models vali- spectra and therefore the final results. In
for calibration and validation, using spectra dated by species J (R²p = 0.67, RMSEP = this study, models from spectra drawn
collected by optical fiber probe in pow- 6.21%) and P (R²p = 0.57, RMSEP = 5.46%), from solid wood had relatively better re-
dered wood. In addition, the above au- though presenting good prediction coeffi- sults when compared to models from spec-
23 iForest 14: 18-25Total extractive content of wood by near infrared spectroscopy
iForest – Biogeosciences and Forestry
Tab. 4 - Calibrations and external validations made from only one species using spectral data obtained from spectra recorded with
integrating sphere and fiber-optic probe. (R²cv): coefficient of determination for cross validation; (RMSECV): mean square error for
cross validation (%); (R²p): coefficient of determination for prediction; (RMSEP): mean square error for prediction (%); (RPD): devia -
tion to performance ratio. (C): Cedrela sp.; (EC): Eucalyptus C; (EV): Eucalyptus V; (J): Jacaranda sp.; (P): Aspidosperma sp.; (G):
Apuleia sp.
Model Via / Processing Validation set R²cv RMSECV R²p RMSEP RPD
16 Sphere / Solid EC 0.88 1.04 0.34 1.52 2.00
17 EV 0.87 1.16 0.63 0.80 4.02
18 G 0.81 1.29 0.31 2.23 1.35
19 C 0.86 1.22 0.66 3.12 1.07
20 J 0.89 0.99 0.36 5.87 0.51
21 P 0.84 0.98 0.74 4.81 0.52
22 EC 0.83 1.25 0.66 1.04 2.93
Sphere / Powder
23 EV 0.84 1.29 0.44 1.20 2.69
24 G 0.80 1.34 0.17 7.24 0.41
25 C 0.86 1.24 0.001 1.78 1.87
26 J 0.85 1.15 0.67 6.21 0.48
27 P 0.81 1.08 0.57 5.46 0.45
28 EC 0.68 1.73 0.01 1.82 1.67
Fiber / Powder
29 EV 0.73 1.67 0.002 1.57 2.06
30 G 0.72 1.58 0.002 3.00 1.00
31 C 0.71 1.79 0.05 1.88 1.77
32 J 0.70 1.63 0.44 5.65 0.53
33 P 0.62 1.56 0.39 6.63 0.37
Fig. 6 - Graphs of calibra-
tions and external valida-
tions from a species with
spectral data obtained from
the solid wood by the inte-
grating sphere acquisition
path. (C): Cedrela sp.; (EC):
Eucalyptus C; (EV): Eucalyp-
tus V; (J): Jacaranda sp.; (P):
Aspidosperma sp.; (G):
Apuleia sp.
iForest 14: 18-25 24Teixeira Mancini L et al. - iForest 14: 18-25
tra from wood powder. However, in both ing Near Infrared Spectroscopy. Journal of nology 24: 55-67. - doi: 10.1081/WCT-120035944
iForest – Biogeosciences and Forestry
cases the results were considered satisfac- Wood Chemistry and Technology 33: 52-64. - Poke FS, Raymond CA (2006). Predicting extrac-
tory and the models could be successfully doi: 10.1080/02773813.2012.731463 tives, lignin, and cellulose contents using near
applied to estimate the extractive content Hsing TY, Paula NF, Paula RC (2016). Característi- infrared spectroscopy on solid wood in Euca-
of the wood. cas dendrométricas, químicas e densidade bási- lyptus globulus. Journal of Wood Chemistry and
Based on PCA results, it is concluded that ca da madeira de híbridos de Eucalyptus grandis Technology 26: 187-199. - doi: 10.1080/02773810
the NIR is sensitive to the chemical varia- × Eucalyptus urophylla [Dendrometric, chemical 600732708
tions of the woods investigated in this characteristics and basic density of wood from Ramalho FMG, Hein PRG, Andrade JM, Napoli A
study. Although a classification of the spe- Eucalyptus grandis × Eucalyptus urophylla]. Ciên- (2017). Potential of near infrared spectroscopy
cies based on extract contents was not cia Florestal 26: 273-283. [in Portuguese] - doi: for distinguishing charcoal produced from
fully evident in several cases, a tendency 10.5902/1980509821119 planted and native wood for energy purpose.
towards the discrimination among species Li Y, Altaner C (2019). Calibration of near infrared Energy Fuels 31: 1593-1599. - doi: 10.1021/acs.en
based on such data could be noticed. spectroscopy (NIRS) data of three Eucalyptus ergyfuels.6b02446
The external validation of the NIR models species with extractive contents determined by Santos SAO, Vilela C, Domingues RMA, Oliveira
using 25% of the samples to validate the ASE extraction for rapid identification of spe- CSD, Villaverde JJ, Freire CSR, Neto CP, Silves-
calibration batch presented satisfactory re- cies and high extractive contents. Holzfor- tre AJD (2017). Secondary metabolites from Eu-
sults, as well as their validation using an ex- schung 73 (6): 537-545. - doi: 10.5902/19805098 calyptus grandis wood cultivated in Portugal,
tra species. In spite of the good predictions 21119 Brazil and South Africa. Industrial Crops and
obtained in the majority of cases, errors Li Y, Altaner C (2018). Predicting extractives con- Products 95: 357-364. - doi: 10.1016/j.indcrop.20
considered high for the content of extrac- tent of Eucalyptus bosistoana F. Muell. Heart- 16.10.044
tives were observed. wood from stem cores by near infrared spec- Shebani AN, Reenem AJ, Meincken M (2008).
troscopy. Spectrochimica Acta Part A: Molecu- The effect of wood extractives on the thermal
Acknowledgements lar and Biomolecular Spectroscopy 198: 78-87. - stability of different wood species. Thermochi-
The authors express special thanks to the doi: 10.1016/j.saa.2018.02.068 mica Acta 471: 43-50. - doi: 10.1016/j.tca.2008.
Wood Science and Technology Laboratory Li Y, Deng X, Zhang Y, Huang Y, Wang C, Xiang 02.020
of the Federal University of Lavras (UFLA, W, Xiao F, Wei X (2019). Chemical characteris- Silva AR, Pastore TCM, Braga JWB, Davrieux F,
Brazil), to CNPQ, FAPEMIG and CAPES for tics of heartwood and sapwood of red-heart Okino EYA, Coradin VTR, Camargos JAA, Prado
supporting the experimental work. This Chinese fir (Cunninghamia lanceolata). Forest AGS (2013). Assessment of total phenols and
work was supported by the National Coun- Products Journal 69 (2): 103-109. - doi: 10.13073/ extractives of mahogany wood by near infrared
cil for Scientific and Technological Develop- FPJ-D-18-00042 spectroscopy (NIRS). Holzforschung 67: 1-8. -
ment (CNPq, Brazil. grant no. 405085/2016- Lovaglio T, D’Auria M, Rita A, Todaro L (2017). doi: 10.1515/hf-2011-0207
8), the Higher Education Personnel Im- Compositions of compounds extracted from Timm NH (2002). Applied multivariate analysis.
provement Coordination (CAPES, Brazil) thermo-treated wood using solvents of differ- Springer Texts in Statistics, Springer, New York,
and Foundation for Research Support of ent polarities. iForest - Biogeosciences and For- USA, pp. 693.
the State of Minas Gerais (FAPEMIG, estry 10 (5): 824-828. - doi: 10.3832/ifor2360-010 Trugilho PF, Lima JT, Mendes LM (1996). Influên-
Brazil). PRG Hein was supported by CNPq Nunes CA, Freitas MP, Pinheiro ACM, Bastos SC cia da idade nas características físico-químicas e
(grant no. 303675/2017-9) grants. (2012). Chemoface: a novel free user-friendly in- anatômicas da madeira de Eucalypus saligna.
terface for chemometrics. Journal of the Brazil- [Influence of age on the physicochemical and
References ian Chemical Society 23: 2003-2010. - doi: anatomical characteristics of Eucalyptus saligna
ABTN (2010). NBR 14853: determinação do mate- 10.1590/S0103-50532012005000073 wood]. Cerne 2: 15. [in Portuguese]
rial solúvel em etanol-tolueno e em diclorome- Oliveira JTS, Della Lucia RM (1994). Teores de ex- Tsuchikawa S, Kobori HA (2015). Review of re-
tano e acetona [Determination of the material trativos de 27 espécies de madeiras nativas do cent application of near infrared spectroscopy
soluble in ethanol-toluene and in dichlorometh- Brasil ou aqui introduzidas [Extractive content to wood science and technology. Journal of
ane and acetone]. Brazilian Association of Tech- of 27 species of native wood from Brazil or in- Wood Science 61: 213-220. - doi: 10.1007/s10086-
nical Standards - ABTN, Rio de Janeiro, Brazil, troduced here]. Boletim Técnico SIF 9, Viçosa, 015-1467-x
pp. 3. [in Portuguese] Brazil, pp. 5. [in Portuguese] Tsuchikawa S, Schwanninger MA (2013). Review
Browning BL (1963). The Chemistry of wood. Wi- Pereira H, Graça J, Rodrigues JC (2003). Wood of recent near-infrared research for wood and
ley, New York, USA, pp. 689. chemistry in relation to quality. In: “Wood Qual- paper (Part 2). Applied Spectroscopy Reviews
Cetera P, Russo D, Milella L, Todaro L (2019). ity and its Biological Basis” (Barnett JR, Jeron- 48: 560-587. - doi: 10.1080/05704928.2011.6210
Thermo-treatment affects Quercus cerris L. imidis G eds). Oxônia, Blackwell, pp. 226. 79
wood properties and the antioxidant activity Pereira BLC, Oliveira AC, Carvalho AMML, Car- Uner B, Karaman I, Tanreverdi H, Ozdemir D
and chemical composition of its by-product ex- neiro ACO, Santos LC, Vital BR (2012). Quality of (2011). Determination of lignin and extractive
tracts. Industrial Crops and Products 130: 380- wood and charcoal from Eucalyptus clones for content of Turkish Pine (Pinus brutia Ten.) trees
388. - doi: 10.1016/j.indcrop.2018.12.099 ironmaster use. International Journal of For- using near infrared spectroscopy and multivari-
Foelkel CEB (1977). Estrutura da madeira [Timber estry Research 2012: 1-8. - doi: 10.1155/2012/523 ate calibration. Wood Science and Technology
structure]. Cenibra, Belo Oriente, Brazil, pp. 84. 025 45: 121-134. - doi: 10.1007/s00226-010-0312-z
[in Portuguese] Pettersen RC (1984). The chemical composition Várhegyi G, Gronli MG, Di Blasi C (2004). Effects
Gierlinger N, Schwanninger M, Hinterstoisser B, of wood. In: “The chemistry of solid wood”, of sample origin, extraction, and hot-water
Wimmer R (2002). Rapid determination of vol. 207 (Rowell R ed). American Chemical Soci- washing on the devolatilization kinetics of
heartwood extractives in Larix sp. by means of ety, Washington, DC, USA, pp. 54-126. - doi: chestnut wood. Industrial and Engineering
Fourier transform near infrared spectroscopy. 10.1021/ba-1984-0207.ch002 Chemistry Research 43: 2356-2367. - doi: 10.1021
Journal of Near Infrared Spectroscopy 10: 203- Poke FS, Wright JK, Raymond CA (2004). Predict- /ie034168f
214. - doi: 10.1255/jnirs.336 ing extractives and lignin contents in Eucalyp- Zobel BJ, Van Buijtenen JP (1989). Wood varia-
He W, Hu H (2013). Rapid prediction of different tus globulus using near infrared reflectance tion: its causes and control. Springer Verlag,
wood species extractives and lignin content us- analysis. Journal of Wood Chemistry and Tech- Berlin, Germany, pp. 363.
25 iForest 14: 18-25You can also read