Europe's 2020 - innovation and creative capability of the Baltic Sea Region - HWWI Policy
←
→
Page content transcription
If your browser does not render page correctly, please read the page content below
Europe’s 2020 –
                 innovation and creative capability
                 of the Baltic Sea Region
                 Jan Wedemeier, Mirko Kruse

HWWI Policy
     Paper 108

                 Hamburg Institute of International Economics (HWWI) | 2018
                 ISSN 1862-4960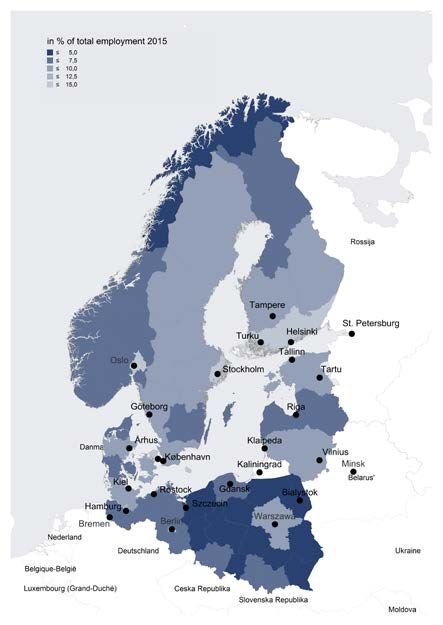
The views expressed here are those of the authors and do not necessarily
represent the views of the HWWI.

Corresponding Author:
Dr. Jan Wedemeier
Hamburg Institute of International Economics (HWWI)
Fahrenheitstr. 1 | 28359 Bremen | Germany
Phone: +49 (0)421 2208 - 243 | Fax: +49 (0)40 340576-150
wedemeier@hwwi.org

HWWI Policy Paper
Hamburg Institute of International Economics (HWWI)
Oberhafenstrasse 1 | 20097 Hamburg | Germany
Phone: +49 (0)40 340576-0 | Fax: +49 (0)40 340576-150
info@hwwi.org | www.hwwi.org
ISSN 1862-4960

Editorial Board:
Prof. Dr. Henning Vöpel
Dr. Christina Boll

© Hamburg Institute of International Economics (HWWI) | June 2018
All rights reserved. No part of this publication may be reproduced, stored in
a retrieval system, or transmitted in any form or by any means (electronic,
mechanical, photocopying, recording or otherwise) without the prior writ-
ten permission of the publisher.
HWWI Policy Paper 108

Europe’s 2020 - innovation and creative
capability of the Baltic Sea Region
Jan Wedemeier and Mirko Kruse

Abstract: The ongoing structural change towards the service and knowledge societies,
innovations, and the increasing integration of markets will have considerable influence
on the European Union, particularly on the Eastern members of EU. In March 2010, the
European Commission released the Europe-2020 strategy, which shall push the EU to
be the smartest and most competitive region in the world. Among the European Union
members, the Baltic Sea countries are effective in bringing up innovative cluster solu-
tions, cooperation between science and business. Innovations are crucial for further
economic development and prosperity. However, the innovation headline indicators
are ambitiously defined targets of the Europe-2020 strategy. The paper at hand anal-
yses and highlights the innovation and creative capability within the Europe 2020 strat-
egy framework.

JEL classification: O3, R11, R12, Z1

Key words: Innovation, Baltic Sea Region, Europe 2020, creative sector

                                                                                          1
Content
Content 2
1 | Introduction 3
2 | Innovation in the Baltic Sea Region 4
3 | Regional Innovation Development 8
4 | Innovation and the creative economy 15
5 | Conclusion 18
Sources 21
21 | Introduction
In March 2010, the European Commission released the Europe-2020 strategy, which
shall push the European Union to be the smartest and most competitive region in the
world. The vision of the Europe 2020 strategy is that of a social market economy of the
21st century, whose economy is smart, sustainable, and inclusive. 1 Five headline targets
serve as benchmarks for the EU-2020 strategy on employment, education, social inclu-
sion, R&D, climate and energy (see Bongardt et al., 2016; Eurostat. 2016a). Complemen-
tary to the EU-2020 strategy, the Commission developed an own macro-regional strategy
for the Baltic Sea Region - the first macro-regional strategy in Europe - to support the
implementation of the EU-2020 strategy. Moreover, the strategy shall support the Baltic
Sea Region to become the most competitive region within the European Union.
The Baltic Sea Region covers eleven countries, eight of them EU members (see Euro-
pean Commission, 2016). Namely, these are Denmark, Sweden, Finland, Estonia, Lithu-
ania, Latvia, Poland, and Germany. Three European neighbor countries are touching the
region, namely Belarus, Norway, and Russia. The eight member countries count for ap-
proximately 29 percent or 147 million inhabitants of the European population. The larg-
est member state is Germany (82.2 m. inhabitants), the smallest member state is Estonia
(1.3 m. inhabitants). These countries generate 29.3 percent of the GDP of the EU member
states. 2 This makes the region a significant economic region in Europe whose specific
structure and history offers enormous opportunities for development. The countries of
the Baltic Sea Region face common challenges – demographical, societal, environmental
et al. – which are preferred to be tackled by working together, achieving a balanced de-
velopment and reinforce integration.
The ongoing structural change towards the service and knowledge societies, innova-
tions, and the increasing integration of markets will have considerable influence on the
region. But, how can the development of the innovation capability of the Baltic Sea Re-
gion in respect of the EU-2020 strategy be evaluated? The Baltic Sea Region countries are
effective in bringing up innovative cluster solutions, cooperation between science and
business, and support for the research and development (R&D) sector from the national
GDP. They are supporters of green growth, based on innovation policy and a stronger
turn to renewable energy sources. These are strategic aspects, they can also be found in
the headline indicator results of the EU-2020 strategy (see Commission of the European
communities, 2016; Stiller/Wedemeier, 2011; Hogeforster et al., 2008).
The specific importance of the Baltic Sea Region in Europe is also the subject of the EU
Strategy for the Baltic Sea Region (EUSBSR). The cornerstones of this strategy are to
1 The European Commission puts seven flagships initiatives to catalyze the priorities, there are “Innovation Union”, “Youth on the move”,
“A digital agenda for Europe”, “Resource efficient Europe”, “An industrial policy for globalization era” “An agenda for new skills and
jobs”, and “European platform against poverty”. European Commission, Communication from the commission, Europe 2020, A strat-
egy for smart, sustainable, and inclusive growth, COM(2010) 2020 final, 2010.
2 A more narrow regional definition of the Baltic Sea Region (program) is the federal states of Berlin, Brandenburg, Bremen, Hamburg,
sub-region Lüneburg, and Mecklenburg-Western Pomerian, and Schleswig-Holstein for Germany, the remaining seven countries in
the Baltic Sea region are treated in their entirely. The regional covering count for 85 million inhabitants in the Baltic Sea region.
3make the Baltic Sea Region more save (environmentally), connected (geographically and
societally) and prosperous (competitively and innovatively). The strategy includes an
action plan with various flagship projects as well as actions to promote entrepreneur-
ship, innovation and digitally driven growth (see European Commission, 2016). Ensur-
ing its technological capability and power of innovation are important prerequisites for
the Baltic Sea Region for being able to compete with other regions in the global market
in the future. The extent of these factors, in turn, depends, among other things, on the
availability of qualified labor, on research and development activities, and university-
industry linkages.
In the first section of this paper, some statistical facts about the research and develop-
ment indicator are presented, emphasizing the relevance for the economic development.
Section two shows various descriptive statistics for regional R&D expenditure and fur-
ther innovation indicators. In the third section, we discuss some aspects of innovation
and its link to the creative economy. The paper is closed by a conclusion, whereas it
considers the European regional smart specialization strategy (S3) development.
2 | Innovation in the Baltic Sea Region
The DUAL Ports project aims to decarbonize regional ports ́ resources through inno-
vation port investments that helps to minimize their negative external effects, the eco-
logical footprint. The effect of minimization has to be quantified by instruments as the
CBA (see European Commission, 2016b).
The innovation headline indicators are as well as ambitiously defined targets. Innova-
tions are regarded as crucial for further economic development and prosperity. Accord-
ing to the so-called endogenous growth theory, R&D investments are essential drivers
of growth. In the model of Paul Romer, for instance, R&D constantly develops new in-
terim products which lead to a continual increase of productivity (see Romer, 1986). The
level of intramural research and development expenditure therefore influences the over-
all GDP growth; the expenditures in R&D shall promote innovations resulting in eco-
nomic growth and increasing welfare. Ensuring its technological capability and power
for innovation is an important prerequisite for the Baltic Sea Region being able to com-
pete with other regions in the European common market such as in the global market.
But these innovation measures reflect more the condition for innovation than being an
innovation themselves. R&D and numbers of employees in R&D are common input fac-
tors for innovation processes. These differing conditions for innovations are reflected in
the indicators found in international comparative analyses of innovation as well as in
the EU-2020 strategy by the European Commission. In this process, an invention
emerges of an idea for a new product or process, in contrast, an innovation is the next
step to bring the idea out into the market (see Fagerberg, 2004). For this process, there is
a need for a knowledge society. In a knowledge-based European society, many jobs need
4a relatively high level of qualification. Europe-2020 target is to increase the share of pop-
ulation aged 30-34 having completed tertiary education to at least 40 percent, what –
with the exception of Germany – will be met by all Baltic Sea Region countries. The num-
ber of persons (aged 30-34) with tertiary education in the Scandinavian countries (more
than 50 percent in Sweden), for instance, is traditionally higher than the EU average (39
percent), whereas Germany has the lowest number of persons with tertiary education
(32 percent) due to its successful system of vocational training (see Stiller/Wedemeier,
2016).
The 28 EU member states achieved a value of 2.03 percent of intramural gross research
and development expenditure (GERD) as a percentage of GDP in 2014 (see Eurostat,
2016). It will be a considerable challenge to meet the innovation target of at least 3 per-
cent of GDP by 2020. The Baltic Sea Region countries mostly have a stable position
among the most innovative members of the EU (see figure 2a). In 2014, the EU member
states with the highest (total intramural) gross domestic expenditure on R&D (GERD)
were Finland (3.2 percent GERD) and Sweden (3.2 percent GERD), followed by Denmark
(3.05 percent GERD). Germany’s expenditures reach approximately 2.9 percent GERD,
which is still four times higher than the expenditures of Latvia, which has the lowest
GDP share on R&D. However, also neighbor countries such as Norway and Russia have
similar shares of GDP expenditure on research and development (1.7 percent and 1.2
percent GERD) in comparison to the EU-28 average (2.0 percent GERD) (see figure 1).
The European corporate R&D efforts are partly ambitious; in 2020, Finland’s and Swe-
den’s target is to reach 4.0 percent GERD, Denmark’s, Estonia’s, and Germany’s target
is 3 percent GERD. Latvia and Lithuania aim to achieve 1.5 percent and 1.9 percent of
their gross domestic product spent on R&D. With the exception of Denmark and Ger-
many, most countries will presumably fail to meet this headline indicator.
5Figure 1
Europe' 2020: Gross expenditure on R&D (GERD)¹
in %
4,5
4,0
3,5
3,0
2,5
2,0
1,5
1,0
0,5
0,0
Denmark Germany Estonia Latvia Lithuania Poland Finland Sweden Norway² EU28 Russia²
2004 2014 target 2020
¹ Data for Belarus not reported
² Partner countries; no target defined.
Source: Eurostat (2016).
With regards to the theory of Romer that research and innovation play an outstanding
role for the economic performance, it is worthwhile to have a look at the current GDP
growth and the R&D performance. Also further empirical literature indicates a strong
relationship between these variables. The arguments are that innovation is a fundamen-
tal driver of economic growth that benefits consume and business. Innovation can there-
fore lead to higher productivity and with a growing productivity, also the economy as a
whole will benefit (see OECD, 2007; European Central Bank, 2018; Barro, 1996). By doing
so, we use the R&D performance and analyse whether it relates to GDP growth. How-
ever, this article does not aim to control for causalities; it simply indicates the possible
relationship. But what do the figures tell us? The relation is positive and relatively strong
(R²=0.79 in logarithmic regression).
The investment in R&D has the character of diminishing marginal products, i.e. the
additional unit in R&D investment, as an input in the production process, will contribute
less to the production, here real GDP, while the amount of other inputs is held constant.
This seems reasonable as not any investment in R&D will increase its effect on the
GDP. For instance, Schumpeter (1950) discussed that innovation and technological
change come from the entrepreneurship or Unternehmergeist (Mark I) while large firms
and investments do not necessarily contribute disruptively to the innovation processes.
Large firms are more interested in maximizing the profit under the regime of incremen-
tal product and process improvements (Mark II).
6The countries can be divided into two groups. Firstly, those EU members with an al-
ready high GDP in the Baltic Sea region (Sweden, Finland, and Germany) present rela-
tively low GDP growth. Secondly, those countries with low GDP growth show a rela-
tively high level of GERD, vice versa. Obviously, figure 2 indicates a growth and
investment in R&D gap between the less developed countries of the Baltic Sea Region
and the more developed EU member countries of the Baltic Sea Region. In many cases,
there are considerable time lags between an innovation and its influence on economic
growth. Moreover, this gap is larger for investments in research and development such
as GDP growth. For the more developed Baltic Sea countries, it can be assumed that it is
a fortiori essential to have high levels of expenditures in R&D to remain globally com-
petitive. For instance, Pelle (2015) who shows a positive relation between R&D expend-
itures and the GCI score of EU member states as an indicator for competitiveness, vali-
dates this assumption. Moreover, Frietsch et al. (2015) summarize that the low R&D level
in Eastern European countries, hereunder Poland, Latvia, and Lithuania, are less the
outcome of underinvestment in research and development, rather than a political re-
sponse to a relatively low transfer rate of research investments into research output. In
other words, there are no considerable research capabilities to catalyze higher expendi-
tures in R&D. Moreover, it is obvious that Norway’s GDP development is driven by
other factors, for instance the petroleum industry, rather than R&D expenditures. The
(current) GDP growth of Russia is 429 percent between 2000-14 while its level of GERD
is 1.05 percent. This extreme value (outlier) lies outside the range of the rest of the obser-
vations (and is not included in the simple regression).
7Figure 2
Current GDP growth (2000-14) to GERD 2000 in %¹
real GDP growth (2000-14)
250
Estonia
200 Lithuania
Latvia
R² = 0,79
150
Norway
100 Poland
Denmark Finland
50 EU28
Sweden
Germany
0
0,00 0,50 1,00 1,50 2,00 2,50 3,00 3,50 4,00 4,50
GERD in % 2000
¹ Current Gross Domestic Product (GDP) to Gross domestic expenditure on R&D
(GERD); Data for Belarus not reported.
Sources: Eurostat (2016a).
3 | Regional Innovation Development
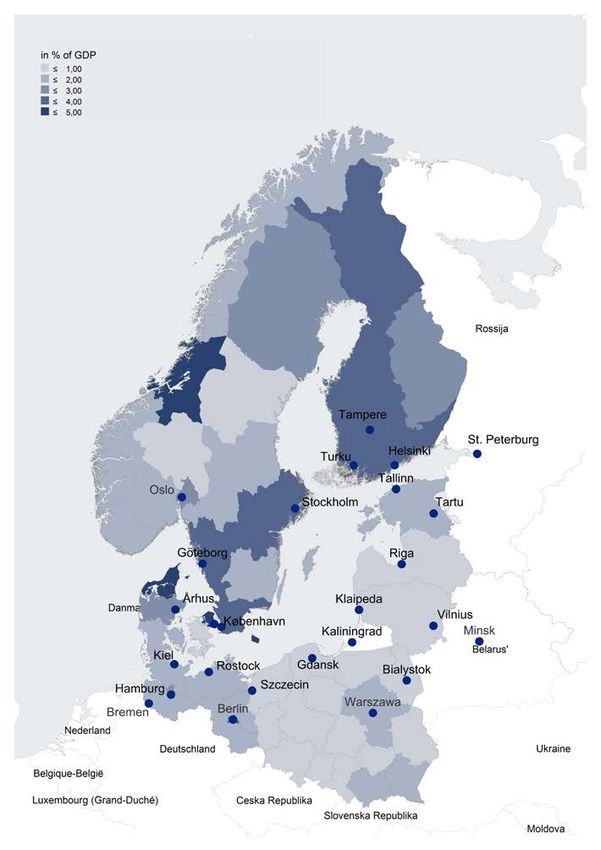
Comparing regional data on R&D at NUTS level 2, in 2013 the Copenhagen area
(Hovedstaden) had the highest percentage in R&D, followed by Trøndelag in Norway,
and Nordjylland in Denmark (all more than 4.6 percent GERD). The Polish voivodship
Lubuskie, and Opolskie are at the bottom-up of the Baltic-Sea regions (around 2.6 per-
cent GERD). There are considerable regional disparities in R&D. The largest regional
disparities were observed in those Baltic Sea Regions, which had particular specializa-
tion and clusters, for instance, the Danish region of Hovedstaden (health and food), the
Norwegian region of Trøndelag (education and knowledge creation), the German re-
gions of Bremen (transportation and logistics) and Hamburg (transportation, logistics,
and distribution) (cf. figure 3) (see Eurostat, 2016b; European Cluster Observatory, 2015).
Another typical pattern is that the capital city regions recorded the highest level of in-
tramural R&D expenditures (see Eurostat, 2016b). In Germany, Berlin has the highest
level of R&D (3.55 percent GERD). Outside of the German parts of the Baltic Sea, several
regions are outperforming the regional level of R&D, for instance, Braunschweig (7.33
percent GERD) und Stuttgart (6 percent GERD). Especially for small countries, it is im-
portant to focus on particular strengths and to profile themselves accordingly. Speciali-
zation means finding a niche. It is vital to the success of initiatives that the necessary
critical mass of specialists and human resources in general are reached so that specialties
8can develop (see Blech et al., 2009). For small countries, cooperation is a key to success
in forming clusters and minimizing disadvantages of scale. This helps to explain why,
for instance, Denmark and Finland are relatively open and liberalized countries (see
Maskell et al., 1998).
Patents and trademarks give their inventor the intellectual property right to use a spe-
cific invention – based on a new solution or technical problem – in a particular field.
Patents are limited for a number of years, 3 and represent, from the micro-economic per-
spective, a governmentally-granted monopoly or legal market power. It gives the inven-
tors the incentive to invest in patents, trademarks or generally, inventions. But intellec-
tual property refers broadly to inventions, and is not to be compared with innovations
in a narrow sense (inventions brought to the market). With a patent, the government
grants an enterprise the right to produce, sell a good or service, notwithstanding hereof
if the granted patent holder uses it to supply market goods or services or not (see Schum-
peter, 1950). Exclusivity laws give a significant benefit for the innovator-turned monop-
olist.
3 Another limitation is that the regional statistics on patents are based on the address of the inventor; the place of invention is not always
the place of the inventor. The discrepancy is even higher in the case of smaller geographical units.
9Figure 3
Gross expenditure on R&D (GERD) by NUTS 2 regions (2013)
Source: Eurostat (2016a).
Sweden, Finland, Denmark and Germany are among the leading “inventors” in Eu-
rope and file more patents than the EU average. In contrast, in Russia and the more re-
cent EU countries, such as Estonia, patents play a subordinate role for the development
of these countries as areas of innovation (see Stiller/Wedemeier, 2016). Underlining this
observation, Estonia witnessed a significant decline of over 50 percent in absolute patent
applications in the period between 2008-12. Apart from Lubelskie in Poland (minus 70.9
10percent) that is the largest decline of all single regions in the study area. While capital
regions generally rank above the national average, for instance in terms of patent appli-
cations, the case of Berlin breaks the trend. The growth in patent applications was in
average negative among the European Union 28 member states. This trend can also be
observed for the Baltic Sea region (see Eurostat, 2016c).
Trademarks reflect the non-technological innovation in every sector including ser-
vices. Trade marks support brand recognition, and are seen as important in marketing
and communication. The European Union trademark (EUTM) gives protection for trade
and service marks and is valid across the EU. According to findings of a study, almost
21 percent of all economic job activities – these are approx. 45.5 million jobs – in the EU
during the period 2008 to 2010 were created by trade mark-intensive industries (see
OHIM/EPO, 2013). Sweden, however, has the highest level of registered trademarks
(208.0 EUTM registrations per m. inhabitants) within the Baltic Sea Region. In contrast,
the level of EUTM registrations is the lowest in Poland (49.6 EUTM registrations per m.
inhabitants). This is also below the EU-28 average of 150.4 EUTM registrations per m.
inhabitants. Moreover, the regional levels of EUTM registrations are relatively heteroge-
neously distributed among the Baltic Sea Region with Stockholm (412.6), Hamburg
(375.0), and Copenhagen (303.7) presenting the highest level of trade marks per m. in-
habitants and therefore belonging to the top regions for EU trade marks in the European
Union. Thereby, the Polish NUTS level 2 presents a level (Warminsko-Mazurskie 18.3 or
Zachodniopomorskie 52.4 EUTM registrations per m. inhabitants) which is below the
EU-28 average.
On the other side, German regions such as Bremen (170.7 EUTM per m. inhabitants)
also show relatively high levels of registered European Union trademarks (see table 1).
Looking at the regional shares of trademarks, the highest concentration can be found in
Helsinki (59 percent of Finnish registered EUTM), in Copenhagen (48 percent of Danish
registered EUTM), in Berlin (38 percent of Northern German registered EUTM), and Po-
morskie (52 percent of Northern Polish registered EUTM).4 Moreover, the concentration
of EUTM registrations per m. inhabitants reaches its highest values in Stockholm (412.64
registrations), Helsinki (317.45) and Copenhagen Hovedstaden (303.71), reflecting the
previously stated observation of above-average concentrations in capital regions and an
enhanced importance of Scandinavian regions in matter of trademarks. In opposite to
the registered patent applications to the European Patent Office (EPO), with exception
of Germany, the level of registered trademarks increases between the years 2008-15 (see
table 1). The highest percental increases can be found in Polish regions as a reflection of
their still existing backlog. The noticeable low values of Russia in terms of EUTM regis-
4 Respective data shares refer for German and Polish NUTS 2 regions to Northern Germany (Berlin, Brandenburg, Bremen, Hamburg,
Mecklenburg-Vorpommern, Lüneburg, Schleswig-Holstein) or to Northern Poland (Warminsko-Mazurskie, Podlaskie, Pomorskie,
Zachodniopomorskie).
11trations can be traced back to the fact that the EUTM registrations only reflect registra-
tions of trademarks within the European Union and therefore neglect foreign activities.
The same statistical inaccuracy holds for patent applications to the EPO (see table 1).
Statistics on high-tech industry and knowledge-intensive services (KIS) refer to eco-
nomic, employment, science, technology, and innovation (STI) data describing the tech-
nological intensity of sectors. These sectors are regarded as highly competitive and in-
novative on a global scale. In the following, the focus lies on the knowledge-intensive
services, since they are more generally distributed between the smaller economies of the
Baltic Sea Region than the industry shares. The share of employment in knowledge-in-
tensive services is especially high in the Scandinavian countries (between 53 and 45 per-
cent). Germany presents a share close to the average of the EU-28 member states (40
percent). The three Baltic States and Poland deliver shares below the EU-28 average with
around 31 percent (Poland), and 36 percent (Latvia). A geographical fragmentation be-
tween the Nordic states on the one hand side, Eastern Europe on the other and Germany
in between can be derived from the statistical data. However, the three Baltic states faced
a growth rate above the EU-28 average, whereas especially Estonia stands out with the
highest percentage increase of all single countries. Among the states in Northern Ger-
many, only Bremen witnessed a decline in 2008-12. The only other region with a negative
growth in that period is Åland in Finland, whereby Warminsko-Mazurskie realized the
highest growth rate marking a considerable catching-up process from the Polish region
with the lowest employment in KIS to a region close to the national average (see Euro-
stat, 2016c) (see table 2).
Additional to data on knowledge-intensive services, statistics on high-technology sec-
tors allow for some interesting conclusions. Defined as an aggregate of high-technology
manufacturing and knowledge-intensive high-technology services, the included sectors
are quantitatively smaller in comparison to KIS. The geographical fragmentation is less
noticeable but still existent in this case, with Norway (4.0 percent) and Germany (4.1
percent) ranking in the region of the EU-28 average (4.0 percent) and Sweden (4.9 per-
cent), Denmark (5.6 percent) and Finland (5.9 percent) in the upper range. While Poland
(3.0 percent), Latvia (3.3 percent) and Lithuania (2.3 percent) remain weak also in terms
of high-tech industries, Estonia appears to be more of a Northern country than part of
Eastern Europe with 5.1 percent high-tech sectors. That is not only the third highest
value within the study area, behind Finland and Denmark, but Estonia also witnessed
the largest growth in the period of 2008-12. Again, the Eastern European countries face
a higher growth rate than the EU-28 average which can be attributed to their still emerg-
ing high-tech industry. The highest share on the regional level can be found in Helsinki
with 10 percent of total employment being located in high-technology sectors. Copenha-
gen Hovedstaden (9.7 percent), Oslo (8.1 percent) and Stockholm (7.1 percent) comple-
ment the list of high-technology regions, whereby among these regions only Stockholm
faced a decline since 2008 (see Eurostat, 2016c).
12A similar pattern in terms of a geographic fragmentation in human resources in sci-
ence and technology (HRST), measured in percentage points of the active population,
can be observed. The HRST measure is an additional definition for qualified labor. HRST
is defined as persons who have completed a tertiary level of education and, respectively
or, are employed in science or technology related sectors (see Eurostat, 2016c). Again,
the Nordic countries, such as Sweden, Finland and Denmark rank above the EU average
(45 percent), this time accompanied by Norway with the highest share among the Baltic
Sea countries. Germany, on the other hand, although slightly above the EU-28 average,
is surpassed by Estonia and Lithuania, emphasizing the successful structural change in
the aftermath of the collapse of the USSR. The below-average growth rate in Germany
(4.2 percent) and Denmark (4.9 percent) is, however, not necessarily critical as their hu-
man resources in science and technology already reflect the European average. Moreo-
ver, Norway, Sweden and Finland not only have the highest share of HRST in relation
to the active population but also their growth rates exceed the other countries in the
study area. Again, Estonia ranks above the Eastern Europe average, both in terms of the
level of HRST and its growth rate. Lithuania is also well positioned while the country
performs below-average in most of the other indicators. Among all observed Baltic Sea
regions only Lüneburg experienced a decline. The other German regions, apart from
Hamburg, were growing less powerful than the European average. The highest concen-
tration of fast-growing regions is observed in Norway, with an average regional growth
of over 9 percent, Moreover, Norway is the only country among the study area with all
its regions being placed above the EU-28 average in terms of HRST. The development in
Poland is noticeable on another level as only one of 16 examined regions, namely Ma-
zowieckie, is ranked above the EU-28 average in HRST percentage, although the Polish
regions realized substantial growth rates in 2008-15 (see table 1).
13Table 1
Further innovation indicators by (selected) NUTS 2 regions 1
European Un- Employment Human Re-
ion trade- in knowledge- sources in Sci-
Regional innovation
mark (EUTM) intensive ser- ence and Tech-
performance
registrations vice sectors nology (HRST)
(scoreboard) 2
(per m. inhab- (in % of total (in % of active
itants) employment) population)
change change
in per- in per- perfor-
growth
cent cent mance
2015 2008- 2015 2015 2016
points points change
15
2008- 2008- 2016-2012
15 15
Denmark 199,8 5,2 48,3 2,5 48,4 4,9 leader -
Hovedstaden 303,7 3,3 57,3 2,1 59,1 4,5 leader -
Estonia 161,4 148,4 35,7 4,5 47.7 5,3 moderate decrease
Finland 156,4 8,7 45,4 3,9 51.3 6,0 leader -
Helsinki-Uusimaa 87,9 53,4 51,6 2,5 61.5 5,6 leader -
Germany 156,1 -11,9 40,0 1,3 45.8 4,2 leader -
Berlin 251,6 36,0 51,6 0,2 54,0 4,5 leader -
Brandenburg 46,8 14,1 41,1 1,0 44.8 4,0 strong -
Bremen 170,7 -16,8 38,8 -1,0 43.9 3,2 strong -
Hamburg 375,0 -4,1 47,1 2,5 55,0 6,5 leader
Lüneburg 78,7 -16,9 38,8 2,0 43.3 -5,6 strong -
Mecklenburg-Vorpommern 36,3 -17,7 39,4 2,4 42,0 5,6 strong -
Schleswig-Holstein 116,6 -3,3 42,6 0,7 44.3 3,7 strong -
Latvia 53,9 146,0 35,9 3,8 41.6 3,3 moderate increase
Lithuania 61,6 157,1 33,8 3,3 47.1 5,5 moderate -
Poland 49,6 111,2 31,2 2,9 40.1 8,2 moderate -
Podlaskie 23,2 295,8 27,7 0,6 37.1 7,8 moderate increase
Pomorskie 52,4 110,6 32,7 0,6 40.3 5,7 moderate -
Warminsko-Mazurskie 18,3 335,7 30,9 29,7 35.7 7,5 modest -
Zachodniopomorskie 33,2 367,7 33,9 0,4 37.8 3,5 moderate increase
Sweden 208,0 12,3 52,8 2,3 52,0 7,2 leader -
Stockholm 412,6 12,4 61,0 2,5 62,7 7,2 leader -
EU-28 150,4 33,8 39,9 2,9 45,2 5,6 strong -
Norway 43,3 4,4 51,0 3,5 54.3 9,2 moderate decrease
Oslo og Akershus 93,3 -8,5 58,5 2,4 65.3 5,9 strong -
Russia 0,6 1,6 : : : : : :
1Performance groups: innovation leaders, strong innovators, moderate innovators,
modest innovators.
Sources: Eurostat (2016); Hollanders et al. (2016).
The same pattern becomes visible in the recent Regional Innovation Scoreboard (RIS)
measuring and clustering the innovation performance among 214 European regions (see
Hollanders et al., 2016). The RIS 2016 includes various indicators from the European In-
novation Scoreboard (EIS), thereunder regional data from the Community Innovation
Survey (CIS). The RIS indicators range from “Percentage population aged 30-34 having
completed tertiary education”, to “Non-R&D innovation expenditures in SMEs as per-
centage of turnover” to “Innovative SMEs collaborating with others as percentage of
14SMEs”. In total, 18 indicators are sed in the RIS. The RIS measures the innovation per-
formance and classifies them either as “innovation leaders”, “strong innovators”, “mod-
erate innovators”, or “modest innovators”. Generally, Danish, Finish, German such as
Swedish regions are classified as “innovation leaders” or “strong innovators”. The Baltic
States and Poland are typically moderate innovators.
Denmark’s regions are almost all listed as “innovation leaders”, apart from Syddan-
mark which is a “strong innovator”, the second-highest classification. In Sweden, more
than half of the regions can be found in the highest classification. Interestingly, the cap-
ital region of Stockholm is not among them while Helsinki is the only region in Finland
to reach the highest grading with all other regions being only “strong innovators”. Nor-
way, in contrast, breaks the positive trend of the Nordic countries, with its regions
mainly being classified as “moderate innovators”. Germany partly remains in the mid-
dle with innovation leading regions such as Hamburg and Berlin and various strong
innovative regions. Within the study area, Poland is the only country with a number of
regions being “modest innovators”, representing the lowest classification. The regions
bordering the Baltic Sea, however, are among the more innovative areas within the coun-
try. The capital region is not an outstanding innovation hotspot. All regions of the study
area have been relatively stable between 2012 and 2016 (see table 1).
4 | Innovation and the creative economy
A sophisticated and excellent skill structure is regarded as a major condition for re-
gional employment growth and economic welfare (see above). In particular, creative and
culture professionals are supposed to be attracted to the places that are the most benefi-
cial to creative and innovative activities (see Wedemeier, 2012; Florida, 2002).5
The most successful places seem to be particularly concentrated in idea-producing in-
dustries, among these are the Scandinavian respectively Nordic countries.6 The creative
and culture economy becomes increasingly important for economic development. More
than in other states, the cities and regions of Denmark and Sweden have specialized in
the creative economy and pursue cluster strategies to promote the creative economy,
and in Denmark the experience economy in particular (see Danish Government, 2015).
The experience economy stretches beyond the cultural and creative economy to include
the areas, for instance, of sports, tourism, and edutainment. Strengthening these indus-
tries is one of the strategic aims of the Nordic Innovation Council. As part of this initia-
tive, the Nordic countries and the Baltic States collaborate supra-nationally to develop
strategies to promote the economic activities of the experience economy. The Nordic
5 Florida (2002) developed the main hypothesis of the so-called creative class. By creativity he means the ability to create new
knowledge and to deploy existing knowledge successfully. Florida’s central hypothesis argues that creative cities develop out of the
interplay and mutual positive reinforcement of the three locational conditions ‘technology, talent and tolerance’.
6 The Nordic countries are Denmark, Finland, Iceland, Norway, and Sweden; the Scandinavian countries refer to Denmark, Norway, and
Sweden, sometimes also Finland.
15countries have become a growing market for the creative and culture economy. Moreo-
ver, the Baltic States, especially Estonia, are being increasingly integrated into this strat-
egy of the Nordic countries, for example, through the joint development of a model re-
gion for the creative economy. Hamburg also has strong partnerships in the Baltic Sea
Region in the sector of the cultural and creative economy (see Stiller/Wedemeier, 2016).
The indicator of employment is built on a specific distinction of the creative and cul-
ture sector including the NACE Rev.2 economic activities of film, television and music
production, programming and broadcasting, creative, arts and entertainment activities,
libraries, archives and museums as well as related technical activities. As in terms of
innovation, the Nordic countries also rank above the EU-28 average of 2.8 percent when
it comes to the employment in the creative sector in relation to the total employment.
While Germany and Poland lie under the European average, especially the Baltic States
rank higher compared to their innovation rankings. Nevertheless, Latvia and Lithuania
are the only countries that befall a negative growth rate in 2008-14, while the majority of
countries realized a growth in double-digits. As in terms of employment, Sweden tops
the list with almost 5 percent of all enterprises being related to the cultural sector.7 Apart
from Finland, the Nordic States again represent the upper range in contrast to Eastern
European countries. In Germany, the low share of creative and culture employment is
relativized by its above-average number of creative enterprises. However, in none of the
observed countries has a negative growth taken place in 2008-13, whereas Estonia, Lat-
via and Germany realized significant increases between 23.3 and 35.4 percent (see table
2).
The same distinction as for the number of enterprises is used for data on the turnover
of enterprises. Although the available data fails to draw a complete picture, particularly
Poland is worth a look. Despite having the lowest percentage of creative and culture
employment among all countries in the study area and being last but two in terms of the
number of cultural enterprises, surprisingly, the Polish creative and culture industry has
the highest percental turnover, before Germany and Sweden (see table 2).
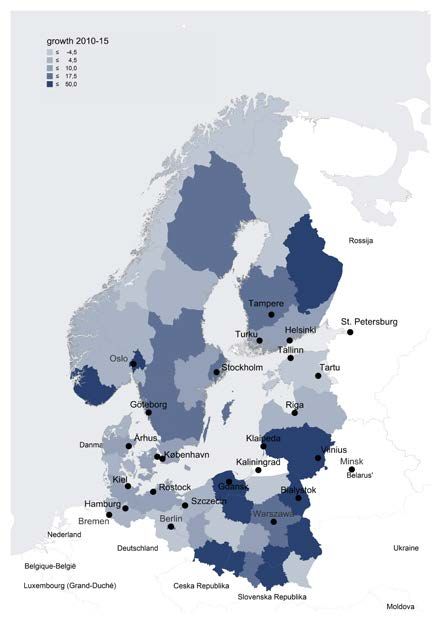
Figure 4 presents the regional distribution of the shares of the creative economy and
its growth from 2010-15. Among the regions with the highest shares are the German
metropolitan cities Berlin (13.9 percent) and Hamburg (10.6 percent), such as the capital
cities of the Nordic countries Copenhagen (13.7 percent), Helsinki (14.5 percent), Oslo
(14.2 percent) and Stockholm (13.7 percent). The growth rates are relatively high in these
cities. With some exceptions, for instance Bremen (-14.8 percent) or Nordjylland (-6 per-
cent), the remaining regions experience relatively high growth rates, but coming from
lower levels of shares of the creative economy (see figure 3).
7 In contrast, the definition of the creative sector related to the number of enterprises differs significantly. The sector definition is an ag-
gregate of publishing of books, journals, magazines, newspapers and computer games, film, television and music production, pro-
gramming and broadcasting, news agency and architectural activities as well as specialized design activities.
16Table 2
Creative economy¹
employment no. of enterprises turnover of enterprises
in % of in % of
in % of total total
Change Change Change
in total total number turno-
in % in % in million in %
thousands employ- number of en- ver of
2008- 2008- EUR 2013 2008-
2014 ment 2013 ter- enter-
14 13 13
2014 prises prises
20133 2013
Denmark 104,1 3,8 24,4 8.459,0 4,0 17,1 5.846,7 4,5 -13,8
Estonia 21,5 3,6 11,4 1.672,0 2,7 35,4 : : :
Finland 95,5 3,8 6,5 6.092,0 2,6 4,6 : : :
Germany 1.183,0 2,8 17,1 72.873,0 3,3 23,3 62.648,3 5,8 12,5
Latvia 28,6 3,3 -8,9 1.918,0 2,0 26,6 : : :
Lithuania 42,4 3,2 -3,6 1.705,0 1,1 5,8 325,3 2,3 -41,9
Poland 402,1 2,6 26,4 35.071,0 2,3 8,1 7.893,4 6,2 -18,6
Sweden 194,0 4,1 29,3 31.920,0 4,8 21,2 12.050,4 5,4 19,5
EU-28 6.273,1 2,8 17,4 : : : 300.476,4 5,3 :
Norway 88,4 3,2 27,2 10.435,0 3,7 5,7 7.233,3 4,8 24³
¹ Data for Belarus and Russia not reported.
² 2009
³ Number of enterprises in the non-financial business economy
Source: Eurostat (2016).
17Figure 4
Creative economy
Source: Eurostat (2016).
5 | Conclusion
As empirical literature suggests, the innovation capability is an important driver in
achieving growth and welfare in the European Union, whereby the Baltic Sea countries
already contribute to a high extent to this development. Programs such as the flagship
program Innovation Union and Horizon 2020 are an integrated contribution to this de-
velopment. The Baltic Sea Region innovation system is a heterogeneous one. The re-
source endowment is very different between the Baltic Sea countries, but the same holds
for its efficiency in producing innovative outputs.
Europe’s corporate R&D goals are challenging and presumably too ambitious. In a
global perspective, however, the development of R&D has been relatively stable in the
last ten years, in the United States and Japan it remained at almost the same level (see
European Commission, 2010; Pochet, 2010). The European Union, therefore, is far from
18being totally outperformed by these countries. Moreover, the member states of the Eu-
ropean Union upgraded the R&D intensity in the last decade, especially by national ef-
forts. The main drivers of the European innovation improvements were the Scandina-
vian members and Germany. They increased the public and private spending since 2000
between 2.19 percent of GDP (minimum) (Denmark) and 3.91 percent of GDP (maxi-
mum) (Sweden) to 2.87 percent of GDP (minimum) (Germany) and 3.17 percent of GDP
(maximum) (Sweden) in 2014. Thanks to the countries of the Baltic Sea Region, Europe
is not only the largest transnational science and research system but it is still ahead of
other international innovation systems (see Frietsch et al., 2015). Still, in various indica-
tors, the three Baltic States rank below the EU-28 average (for instance in terms of em-
ployment in technology-intensive sectors or patent applications to the EPO), while Esto-
nia outperforms its neighbors and the EU-28 average in terms of employment in high-
technology sectors. Looking at human resources in science and technology (HRST), the
above-average position of Estonia is shared by Lithuania, breaking the substandard
trend for the latter. Obviously, the economic transformation has not yet raised the Baltic
States to the Western European level, but the efforts already made are reflected in spe-
cific indicators. Most capital cities tend to have higher innovation scores than the rest of
the countries. This is not a surprise since companies’ headquarters are mainly located in
capital cities/regions. Despite of the highest growth rates for several headline targets be-
ing recorded in the eastern Baltic Sea countries, most regions within these countries are
still catching up to the Western part of the Baltic Sea region.
The regional disparities presented in this paper indicate a need for action since one
aim of the European Commission’s Innovation Union – as part of the EU-2020 strategy -
is to foster the dissemination and realization of European wide economies of scale (and
scope, i.e. knowledge spillovers) in innovation and knowledge intensive sectors (see
McCann/Ortega-Argilés, 2015). A core objective is to enforce interregional cooperation
of regional smart specialization strategies (S3). The key concept of S3 is that innovation
leader regions (in a specialization) mostly invest in the invention of a general purpose
technology (GPT), while the moderate/modest innovator regions (in a specialization) fol-
low the co-invention aspect of a technology with their investment. Smart specialization
is therefore not about being specialized in a certain sector. For moderate innovation re-
gions, it is more relevant to focus on what is the potential of GPT for the target economic
domain by the aspect of co-invention of applications (see David et al., 2015), e.g. aug-
mented reality (GPT) for construction or tourism activities.
This is also an argument for organizing more cross-cluster approaches and innovation
projects with the character of transnational cooperation. Many regions in Europe are
characterized by a weak relation between R&D and the economic activities (see
McCann/Ortega-Argilés, 2015). This can also be assumed for many regions of the Baltic
Sea. Projects such as GoSmart BSR 8 or Smart-Up BSR can contribute to a strengthening
8 GoSmart aims to boost transnational cooperation among industry, the research & development sector, and authorities in employing
smart specialization strategies in regions in the eastern parts of the Baltic Sea Region. It promotes mutual learning, sharing best prac-
tices and translating smart specialization strategies into practical joint actions of small and medium sized enterprises.
19of smart specialization and a catch-up process of regions in the Baltic Sea Region (see
Interreg BSR, 2018a; Interreg BSR, 2018b)
Moreover, policy should consider the technology and market trends as relevant, since
changes in the focus of the economic sector are still possible and could influence the
future of the region’s smart specialization strategies, especially relevant for the upcom-
ing update of the S3 for the period 2021+. One important factor for the transfer of
knowledge – and this precisely because of the upcoming trend of digitalization – is face-
to-face contact and the cross-border mobility of the labor force under the regime of the
four freedoms of the European Union. For the process it is important to encourage en-
trepreneurs and other organizations to become involved in the discovery of the future’s
regional specializations.
However, the east-west disparities among the Baltic Sea countries are expected to de-
crease in future, whereas this decease will apparently take decades. As part of the catch-
up process of the three Baltic States and Poland, the research and development capacities
in these countries will expand and create potential growth.
20Sources
Barro, R. J. (1996): Determinants of Economic Growth: A Cross-Country Empirical
Study, NBER Working Paper No. 5698, Cambridge MA.
Blech, L.; Brandhuber, B.; Könönen, A.; Köster, R.; Lenné, T.; Reich, N.; Rohde, O.;
Stiller, S.; Wedemeier, J. (2009): Creative Future – Growth Potentialities for Baltic Cities,
Hamburg.
Bongardt, A.; Torres, F.; Pochet, P.; Begg, I.; Csaba, L.; Lannoo, K.; Soete, L.; Egenho-
fer, C. (2016): Europe 2020 – A promising strategy, in: Intereconomics, Forum, Volume
45, Issue 3, pp. 136-170.
Commission of the European communities (2016): Communication from the commis-
sion to the European parliament, the council, the European economic and social com-
mittee and the committee of the regions concerning the European Union Strategy for
the Baltic Sea Region, Action Plan, COM(2009) 248.
Danish Government (2015): Denmark in the Culture and Experience Economy – 5
new steps, The Danish Growth Strategy, Copenhagen.
David, P.; Foray, D.; Hall, B. (2015): Measuring Smart Specialization, The concept
and the need for indicators, www.cemi.epfl.ch/.../Measuring%20smart%20specializa-
tion, [accessed at 26.05.2018].
European Central Bank (2018): How does innovation lead to growth?, www.ecb.eu-
ropa.eu, [accessed 21.06.2018]
European Cluster Observatory (2015): Regions, see www.clusterobservatory.
European Commission (2010): Communication from the commission, Europe 2020, A
strategy for smart, sustainable, and inclusive growth, COM(2010) 2020 final, Brussels.
European Commission (2016): Communication from the commission to the Euro-
pean parliament, the council, the European economic and social committee and the
committee of the regions concerning the European Union Strategy for the Baltic Sea Re-
gion, Action Plan, COM(2009) 248.
Eurostat (2016a): Headline indicators, http://ec.europa.eu/eurostat/de, [accessed at
15.02.2018].
Eurostat (2016b): Eurostat regional yearbook, 2016 edition, Statistical books, 2016,
Luxemburg.
Eurostat (2016c): Innovation indicators, http://ec.europa.eu/eurostat/de, [accessed at
15.02.2018].
Fagerberg, J. (2004): Innovation, A guide to the literature, in: Fagerberg, J.; Mowery,
D. C.; Nelson, R. R. (Eds.): The Oxford Handbook for Innovation, Oxford.
21Florida, R. (2002): The rise of the creative class and how it’s transforming work, lei-
sure, community, and everyday life, New York.
Frietsch, R.; Rammer, C.; Schubert, T. (2015): Heterogeneity of Innovation Systems in
Europe and Horizon 2020, in: Intereconomics: The impact of Horizon 2020 on Innova-
tion in Europe, Volume 50, Issue 1, pp. 9-19.
Hogeforster, J.; Stiller, S.; Wedemeier, J. (2008): Baltic Education - Anerkennung von
Berufsbildungsabschlüssen in der Baltic Sea Region (BSR), Hamburg.
Hollanders, H.; Es-Sadki, N.; Kanerva, M. (2016): Regional Innovation Scoreboard
2016, Brussels.
Interreg BSR (2018a): GoSmart BSR – Strengthening smart specialization by fostering
transnational cooperation, https://projects.interreg-baltic.eu/projects/gosmart-bsr-
123.html, [accessed at 22.06.2018].
Interreg BSR (2018b): Smart-Up BSR – Improving smart specialisation implementa-
tion of the Baltic Sea Region through orchestrating innovaion hubs. https://projects.in-
terreg-baltic.eu/projects/smart-up-bsr-151.html, [accessed at 22.06.2018].
Maskell, P.; Eskelinen, H.; Hannibalsson, I.; Malmberg, A.; Vatne, E. (1998): Local-
ised learning and regional development, London and New York.
McCann, P.; Ortega-Argiés, R. (2015): Smart Specialization, Regional Growth, and
Applications to European Union Cohesion Policy, Regional Studies (49) 8, pp. 1291-
1302.
Office for Harmonization in the Internal Market (OHIM); European Patent Office
(EPO) (Eds.) (2013): Intellectual property rights intensive industries: Contribution to
economic performance and employment in the European Union, Industry-level Analy-
sis Report, September 2013, Munich and Alicante.
Organization for Economic Co-operation and Development (OECD) (Ed.) (2007): In-
novation and growth: Rationale for an innovation strategy, Paris.
Pelle, A. (2015): Mind the GAP: Arguments in Favour of Judicious Constructivism in
Providing Horizon for All, in: Intereconomics: The Impact of Horizon 2020 on Innova-
tion in Europe, Volume 50, Issue 1, pp. 13-20.
Pochet, P. (2010): What’s wrong with EU-2020?, in: Intereconomics: Europe 2020 – A
promising strategy?, Volume 45, Issue 3, pp. 141-146.
Romer, P. (1986): Growth based on increasing returns due to specialization, Ameri-
can Economic Review, 77(2), pp. 56-72.
Schumpeter, J.A. (1950): Kapitalismus, Sozialismus und Demokratie, 2nd Edition,
Bern.
Stiller, S.; Wedemeier, J. (2011): The future of the Baltic Sea region: Potentials and
challenges, HWWI Policy Report No. 16, Hamburg.
22Wedemeier, J. (2012): Germany’s creative sector and its impact on employment
growth, Structural change and structural policies, Volume 22, Frankfurt am Main.
23The Hamburg Institute of International Economics (HWWI) is an independent economic research institute that carries out basic and applied research and pro- vides impulses for business, politics and society. The Hamburg Chamber of Com- merce is the sole shareholder of the HWWI. The Helmut Schmidt University is an associated scientific partner of the Institute. The HWWI’s main goals are to: • Promote economic sciences in research and teaching • Conduct high-quality economic research • Transfer and disseminate economic knowledge to policy makers, stakeholders and the general public. The HWWI carries out interdisciplinary research activities in the context of the fol- lowing research areas: • Digital Economics • Labour, Education & Demography • International Economics and Trade • Energy & Environmental Economics • Urban and Regional Economics.
Hamburg Institute of International Economics (HWWI)

Oberhafenstrasse 1 | 20097 Hamburg | Germany
Phone: +49 (0)40 340576-0 | Fax: +49 (0)40 340576-150
info@hwwi.org | www.hwwi.org
You can also read


