Cycle to Work scheme - Weekend Warriors or Daily Commuters - Scottish Transport Applications ...
←
→
Page content transcription
If your browser does not render page correctly, please read the page content below
STAR 2014
Anne Clarke, Jeremy Shires & James Laird

      Cycle to Work scheme – Weekend Warriors or Daily
                         Commuters
    Anne Clarke, Jeremy Shires and James Laird, Institute for Transport Studies,
                               University of Leeds

1     Introduction
This paper presents the results from new research on the economic and mode shift implications of the
Cycle to Work scheme. Cycling and walking are essential to the Scottish government's overall
transport strategy, and the ambitious target of 10% of everyday journeys to be made by bike by 2020
has been set in the Cycling Action Plan for Scotland (CAPS). Due to their positive contribution to other
key policy areas such as health, environment and well-being, calls for joint funding across government
departments for active travel initiatives are increasingly being made.

As one initiative already 'funded' centrally via the tax savings scheme users make, we consider
whether the Cycle to Work scheme should be a part of CAPS or whether it is more akin to an
employee benefit package. The research used online surveys to collect self-reported data from
scheme users. Economic assessment tools were used to build up a post-hoc appraisal of the scheme.
DfT WebTAG guidance as well as the WHO's Health Economic Assessment Tool were used.

2     Background to this paper
2.1    Aims and objectives
The aim of the research was to assess the impact of the Cycle to Work (C2W) scheme,
including an economic assessment of the scheme's benefits and dis-benefits. The research
particularly focused on the scheme's impact on users' propensity to cycle.

Using data collected from user surveys, WebTAG (the UK Department for Transport's method
of transport appraisal) and the World Health Organisation Health Economic Assessment Tool
(HEAT), the research assesses the impact and overall benefits of the C2W scheme. In
addition, it assesses, financially, which parties the benefits and dis-benefits accrue to. In light
of the findings, it discusses whether CBA is the best form of appraisal for the scheme, and the
policy implications of the results.

This study builds on what is already known about the uptake of the C2W scheme by quantifying the
scheme economically for the first time. In the context of spending cutbacks and limited budgets it
indicates whether the scheme is cost-effective when compared to other measures to increase cycling
or broader efforts to improve public health. It also sheds light on whether cost-benefit analysis (CBA) is
an appropriate tool for assessing the Cycle to Work scheme.

2.2    Outline of C2W scheme and previous studies
The C2W scheme was introduced by the UK government to “promote healthier journeys to
work and to reduce environmental pollution” (DfT 2011a). As one of a number of measures
that have been implemented with the aim of increasing cycling levels in the UK, it is unique

                                                 Page 1
STAR 2014
Anne Clarke, Jeremy Shires & James Laird
in being a non-infrastructural measure which is national in character. Figure 1 below shows
estimated usage of the scheme since its introduction.
Figure 1: Estimated usage of the Cycle to Work scheme (data from DfT 2008 and Cycle
to Work Alliance 2011 and 2013)
The scheme is usually implemented as a salary sacrifice arrangement. Employers give
employees a loan to cover the cost of a bike and accessories. Equal repayments are then made
over 12-18 months, taken from the employee's salary before tax or National Insurance
deductions, effectively giving the employee a discount equivalent to the foregone tax and
National Insurance (and the employer a discount equivalent to the National Insurance
payments they would make on the employees’ salary otherwise). Since 2010 a final 'fair
market value' percentage payment has been required in order to formally transfer ownership
of the bike to the employee (DfT 2012a, see Table 1 below for typical savings).
Table 1: A typical tax saving calculation for a basic-rate earner (Cyclescheme, 2013a)
Total cost of bike and accessories: £600
Net cost of bike and accessories, including finance and admin costs (if £600
applicable):
Income tax saving over hire period: £120
Employee NI saving hire period: £72
Final market value percentage charge payment (7% of original price above -£42
£500)
Final cost of bike & accessories: £450
Total saving: £150
Gross salary sacrifice,* based on 12 month hire period: £50
Net salary sacrifice,* based on 12 month hire period: £34
Percentage saving over RRP (incorporating final payment value) 25%
*excludes final payment which is made separately
Since this research was carried out in summer 2013, the Cycle to Work Alliance published a report
entitled 'The healthy commute: What impact does cycling to work have on employee health?' (C2WA,
2014). It presents results for a very high level assessment of the health benefits of the C2W scheme,
using the WHO HEAT tool.
The Cycle to Work Alliance is made up of four of the largest C2W scheme providers (Cyclescheme,
Cycle Solutions, Evans Cycles and Halfords). Its reports all have in common a frequent lack of
transparency in result presentation makes conclusions on scheme usage ambiguous.
Based on the HEAT calculations the C2WA reported that the scheme prevented 509 deaths per year
and generated £5.1bn savings in Government expenditure over a 10 year period (C2WA 2014 p. 7).
However, the methodology used to derive these figures was flawed:
1. Results presented are for all C2W scheme users, not just those who change their cycling
behaviour as a result of the scheme. This is despite it being stated in the same report that “54%
of participants did not cycle to work before signing up to the scheme” (C2WA 2014 p. 6); a clear
indication that the weekly cycling of the other 46% of scheme participants cannot be attributed to
the scheme itself.
2. The actual data used for the calculations did not correlate cycle frequency with commute distance
to work, but took the average frequency of cycle commuting (three times a week) and combined it
Page 2STAR 2014
Anne Clarke, Jeremy Shires & James Laird
with the average commute distance (9.97 miles total). A weighted average approach would have
been more robust.
3. The research fails to consider the impact of other forms of physical activity which participants do
on physical activity benefits.
The report also wrongly stated that the £5.1 billion financial savings accrued to government, when in
fact this figure relates to benefits to society as a whole due to the improved health outcomes which
result from increased levels of cycling.
In addition to this piece of research, and the health economic analysis carried out by the C2WA, four
studies on the C2W scheme have been carried out to date (to the researchers' knowledge). The Cycle
to Work Alliance has produced two other reports on some of the impacts of the scheme (C2WA 2013
and 2011). Caulfield and Leahy (2011) focused on the benefits of the equivalent scheme in Ireland,
and Elliott (2010) researched the C2W scheme within the broader context of university bike hire
schemes in an unpublished dissertation thesis.
The scale and scope of the studies varied; Elliott's looked at one employer in-depth whereas C2WA
(2011 and 2013) and Caulfield and Leahy (2011) collected data at a national level. Only Elliott's (2010)
focussed on non-scheme-users as well. All had reasonable response rates from scheme users (14-
22%) and the reported findings showed many similarities. The gender split range in the findings was
fairly close; all found that 67-75% of scheme users were male. Caulfield and Leahy (2011 p. 44) found
that in Ireland 48% of scheme users did not already own a bike and Elliott (2010 p. 47) found that 72%
of scheme users did not already cycle to work. C2WA (2011 p. 5 and 2013 p. 5) found that 61% of
scheme users in 2011 and 54% of scheme users in 2013 did not already cycle to work before signing
up for the scheme.
Findings in relation to propensity to cycle and mode shift impacts are presented very differently and
direct comparison is therefore problematic. In Elliott's findings (2010 p. 61) the proportion of scheme-
users for whom cycling was their usual mode choice increased from 28% to 53%, making cycling the
main mode choice of roughly 35% of those who previously did not cycle to work. Caulfield and Leahy's
results (2011 p. 45) show that about 45% of new cyclists cycled to work at least twice a week. C2WA
(2013 p. 10) only presents results for all users; it found that 66% of scheme users cycle to work three
or more days a week.
Research on the connection between transport mode choice and health has increased
significantly over the past two decades. Study results have widely confirmed a positive
relationship between active transport and reduced risk of various diseases, in particular
cardiovascular diseases. A widely-cited study is that of Anderson (2000), which found a
reduced risk of mortality of approximately 40% for individuals who cycled to work,
independent of other leisure-time physical activity. Reduced absenteeism has also been widely
reported: Hendrikson et al (2010) found a reduction in the average duration of absenteeism of
more than one day annually for commuter cyclists compared to non-cyclists.
Economic assessments of cycling which include health benefits generally have relatively high
benefit-cost-ratios (BCRs) compared to traditional transport economic appraisals (Nordic
Council 2005 cited in Cavill et al 2008 p. 292). Davis (2010 p. 1) found it 'astonishing' how
high BCRs are in cost-benefit evidence on walking and cycling, from studies that include
health and other benefits; only one extra cyclist was needed in a 30-year appraisal period for a
£10,000 investment to break even (Davis 2010 p. 6). Rabl and de Nazelle (2012) looked at the
benefits of mode shift to active transport from car in relation to health, and found an annual
benefit of €1310 per new cyclist per year of cycling for the EU25 countries, with health
benefits by far the most important item in the scenarios (Rabl and de Nazelle 2012 pp. 126-
Page 3STAR 2014
Anne Clarke, Jeremy Shires & James Laird
128, see also Figure 2 below).
Figure 2: Typical changes of mortality cost per individual who switches from driving to
bicycling (Rabl and de Nazelle 2012 p. 128)
WebTAG is the appraisal guidance produced by the DfT for appraising transport projects.
Cope et al (2010; p. 8) applied WebTAG to results from the Cycle Demonstration Towns; the
resulting BCRs ranged from 2.6-3.5:1. Health benefits accounted for between 70 and 96% of
net benefits, and estimated accidents made up the biggest cost (Cope et al 2010 p. 8).
3 Appraising the impacts of the Cycle to Work Scheme
In STAG, impacts of a transport policy proposal are assessed within a framework of five objectives:
environment, safety, economy, accessibility and integration. A central part to this analysis is a
Transport Economic Efficiency analysis (also known by its acronym TEE) which is a transport cost
benefit analysis. Arguably a transport cost benefit analysis with its focus on the marginal use benefits
gives only a partial view of the benefits of the Cycle to Work scheme.
In the case of the cycle to work scheme, the primary impact of the scheme is on the purchase costs of
a bicycle. The scheme has no significant influence on the cost of a cycling trip 1 per se. That is the
scheme has no significant impact on the direct use costs of cycling. As cost benefit analysis theory
indicates that the benefits of a policy initiative are the use benefits plus changes in external costs
including safety, the environment minus the resource costs of the investment, this means that the core
element to the appraisal (the use benefits – i.e. the change in the use costs) are zero.
The fact that the cycle to work scheme has a significant impact on the total costs of cycling makes this
outcome seem bizarre. By lowering purchase costs the cycle to work scheme lowers the average
costs of a cycling trip rather than the marginal costs of a trip. This can be illustrated as follows. A
bicycle is bought for £600 by someone who currently doesn’t own a bicycle and they use it to commute
to work for 100 days a year over a 6 year period after which the bicycle is ‘retired’. The marginal cost
of the cycle trip is the generalised cost of the cycle trip (time plus maintenance related costs), which
for the sake of argument is £2.50 one way (£2 time costs plus £0.50 maintenance costs). The
average cost of the cycle trip on the other hand is the marginal costs plus the purchase costs spread
over all the trips made with the bicycle, which in this example are 1,200. 2 The average cost of a cycle
1 There are some examples in which replacement bicycles have been bought which are quicker (e.g.
replacing a mountain bike with ‘knobbly’ tyres with a hybrid bike with ‘road’ tyres), or where bicycles with cheaper
components have been bought which lead to slightly lower maintenance costs.
2 1,200 =100 return trips X 2 legs per trip X 6 years
Page 4STAR 2014
Anne Clarke, Jeremy Shires & James Laird
trip over the lifetime of the bicycle is therefore £3.00 3 - that is 50p more than the marginal costs.
It is this average cost that affects the decision as to whether to purchase a bicycle or not – and
therefore has a direct outcome on the ability of cycling to contribute to transport policy. If one also
considers the fact that someone who does not cycle will be uncertain regarding how often they may
actually cycle to work in the future, and therefore what the actual average cost of a cycle trip is this
creates a further barrier to the take up of cycling. For example the ‘potential’ cyclist may intend to
cycle 100 days a year, but in fact external pressures either associated with trip chaining (collecting
children, shopping, visiting the dentist, etc.) may preclude this or they may find that they find cycling
unbearable in heavy traffic. Thus there may be a risk that they may only cycle 50 times a year or in
fact only use the bicycle in the first year of purchase. In both scenarios the average cost per trip
increases quite significantly – whilst the marginal cost remains unchanged. The cycle to work scheme
addresses this issue directly by reducing the purchase costs of the bicycle by a significant margin –
average costs per trip are lowered and cycling to work is seen in a more positive light. However,
economic efficiency as measured in a transport cost benefit analysis is not affected by the cycle to
work scheme beyond its impacts on external costs – in this case congestion, air pollution, carbon and
health impacts. It is for this reason that in our appraisal of the cycle to work scheme we present both a
financial analysis and a cost benefit analysis. The financial analysis tracks the costs borne by each of
the groups affected by the cycle to work scheme, whilst the cost benefit analysis demonstrates the
gain in economic efficiency achieved through the cycle to work scheme.
3.1 Data collection initial analysis
The research used self-reported data from survey questionnaires which were completed by employees
of selected public sector employment sites in Yorkshire. 254 people completed the surveys in total.
Samples were intended to be random, with surveys promoted either to all scheme users or to the
whole staff population at the employer in question.
Respondents were segmented into three groups for analysis:
1. Group 1: Those who did not own a bike prior to using the scheme (23% of the total)
2. Group 2: Those who owned a bike but cycled infrequently or not at all (30% of the total)
3. Group 3: Those who owned a bike and already cycled regularly (47% of the total)
3.2 Initial analysis
Prior to using the scheme, respondents from groups one and two reported no weekly cycling
activity. After using the scheme, only 7% of group one and 8% of group two reported no
weekly cycling activity. The impact of the scheme on cycling, and particularly cycle
commuting levels, is outlined in Table 2 below.
Table 2: Impact of C2W scheme on cycling levels
Group Cycling weekly Cycling to work Cycling to work Cycling to work
(any frequency) regularly (2 or daily (5 days per
3 £3.00 = £2.50 marginal cost + £600 purchase cost/1,200 one-way trips
Page 5STAR 2014
Anne Clarke, Jeremy Shires & James Laird
more days per week)*
week)
1
(Non-bike 93% 82% 75% 31%
owners)
2
(Bike owners who
92% 92% 84% 36%
did little or no
cycle activity)
3
(Bike owners who
100% 96% 89% 42%
already cycled
regularly)
All respondents 96% 92% 84% 38%
*Since not all employees work five days a week, and may work from home on some days,
this percentage will underestimate the number who cycle to work every day that they are in
work.
Results show that the scheme clearly does change propensity to cycle, with the vast majority
of scheme users (96%) cycling weekly after using the scheme, an increase from 47% (the
proportion that cycled weekly before using the scheme). Perhaps more significantly, the
number of respondents cycling to work also more than doubles, from 42% prior to using the
scheme to 92% after the scheme.
However, the context of these results is one in which the scheme attracts individuals who are
more likely to cycle anyway: the most common reason for respondents who did not already
cycle regularly for using the scheme was that they were “considering cycling anyway and the
scheme seemed attractive” (39%). The second most common reason was that “the cost
savings and spread payments made it feel less of a risk to try cycling as an option” (20%).
This suggests that a high proportion (59%) of those who didn't cycle before using the scheme
could already have been contemplating or preparing for cycling; the scheme acted more like a
catalyst or enabler. This concurs with what Elliott's research found: scheme users were more
likely to be considering cycling than non-users (Elliott 2010 p. 50).
Results also show that a high proportion of scheme users are existing cyclists (over half of
scheme users in the sample). Many of these existing cyclists do not change their cycling
behaviour after using the scheme (70%). This has implications for the scheme when
considering its impact on propensity to cycle and its overall value for money for the
government, as discussed further below.
3.2.1 Propensity to cycle for non-commuting trip purposes
The scheme also had a substantial impact on bike use for non-commuting purposes, with the
number of respondents cycling for each purpose at least tripling (see Table 3 below).
Page 6STAR 2014
Anne Clarke, Jeremy Shires & James Laird
Table 3: Change to bike use for different purposes, any frequency
Trip purpose Proportion of Proportion of
sample using bike sample using bike
before after
Taking children to school
or extra-curricular 6% 18%
activities*
Shopping 11% 52%
Personal business 13% 58%
Accessing public transport* 9% 28%
Travelling to leisure
activities or visiting friends 14% 48%
or family
Business travel 15% 28%
*Not all respondents will make this kind of trip by any mode, so actual percentages for those
respondents who do make these kinds of trips will be higher.
Over 90% of respondents cycled for leisure purposes after acquiring a bike through the cycle
to work scheme, again showing that people who expect to enjoy cycling will be more likely to
use the scheme.
3.2.2 Further evidence of a mode shift to cycling
Respondents also gave up travel passes or season tickets, parking spaces or permits, or even
their car, indications that cycling became their main mode choice either for commuting or in
general (see Table 4 below). A number of other respondents were considering making these
changes as a result of getting a bike through the scheme.
Table 4: Items associated with previous mode given up after mode shift to cycling
Item foregone after Number of Percentage Percentage excluding
using the C2W scheme respondents of sample cyclists who did not
who gave it change their
up behaviour
Travel pass/ season 16 6% 9%
ticket
Parking space or permit 12 5% 7%
Car 14 6% 8%
Since respondents who use these modes are likely to commute either by car or by public
transport (and not both modes), and some may not have previously used a travel pass or had a
permit or had a dedicated parking space, these percentages are necessarily understatements.
3.2.3 Mode shift from car
The average reduction in car mileage per week across the sample was approximately 20 miles.
Page 7STAR 2014
Anne Clarke, Jeremy Shires & James Laird
However, this varied dramatically. A large proportion of respondents did not reduce any car
mileage, either because they were not replacing car journeys with cycle journeys, or, for
existing cyclists, because they had not changed their cycling behaviour. The proportions of the
groups who did not reduce any car mileage as a result of using the scheme were: 49% of non-
bike owners; 41% of those who had a bike but did not use it regularly before the scheme; and
81% of existing cyclists. When those who did not reduce their car mileage were not included
in the analysis, the average reduction in car mileage was about 35 miles per week across the
sample (average reductions were remarkably consistent across the different sample groups).
However, within this there was great variation, with some respondents reducing their weekly
driving by over 100 miles and others by only a few miles.
3.2.4 Health benefits
The impact of the scheme on respondents' health was limited by two main factors:
1. Most respondents (70%) were already getting the recommended weekly level of
physical activity (150 minutes of moderate-intensity aerobic physical activity) before
using the scheme.
2. Only around half of respondents increased their physical activity levels as a result of
using the scheme.
However, for those respondents who were below the recommended level of physical activity,
the scheme had substantial benefits; only 11% of respondents remained below the
recommended level of physical activity after using the scheme. However, some respondents
did reduce their level of physical activity after using the scheme (6%), primarily if they
replaced walking with cycling and were therefore active for less time per week because
cycling is a faster mode. Only one respondent moved from being above to below the
recommended level of physical activity as a result of this.
Key descriptive statistics on reported levels of physical activity before and after using the
scheme for the different groups is shown in Table 5 .
Table 5: Reported level of physical activity per week, minutes
Statistic Group 1 Group 2 Group 3
Before After Before After Before After
scheme scheme scheme scheme scheme scheme
Minimum
0 50 0 45 30 60
value
Lower
120 200 30.5 190 190 215
quartile
Median 260 290 120 300 300 320
Upper
322.5 480 212.5 435 457.5 497.5
Quartile
Maximum
600 780 900 1080 1080 1080
value
Page 8STAR 2014
Anne Clarke, Jeremy Shires & James Laird
4 Financial and cost benefit analyses and sensitivity tests
4.1 Assessment method/data used
Cost-benefit analysis is used to quantify the benefits of a project by converting all benefits to
a common, monetary unit, which can then be compared to the cost of implementing the
project. Table 6 below shows the objectives and sub-objectives that are considered in a
WebTAG CBA; the following appraisal considers only the sub-objectives that are relevant to
the C2W scheme, which are those highlighted in bold.
All objectives except physical fitness, accidents and public accounts are dependent on the
level to which mode shift from car occurs.
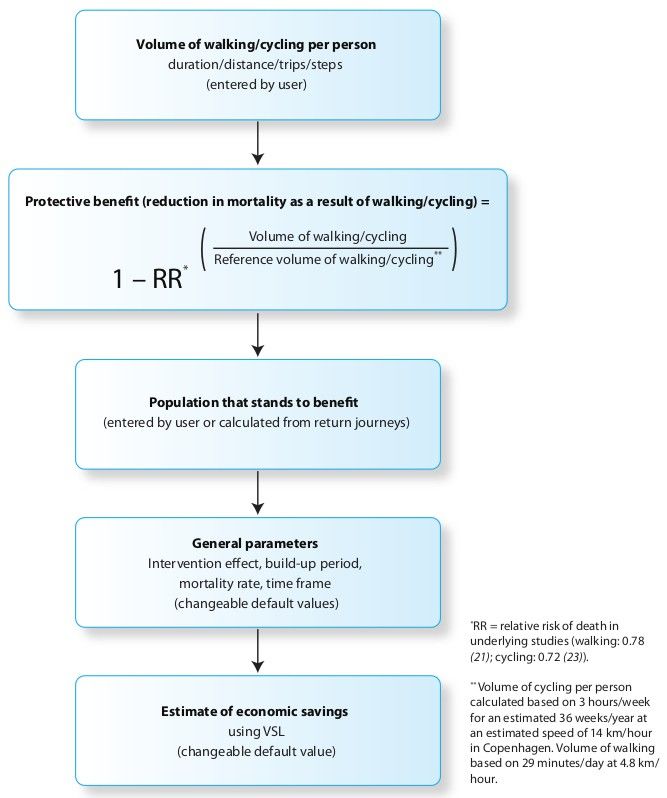
Health benefits are assessed using the World Health Organisation's (WHO) Health Economic
Assessment Tool (HEAT), which has been incorporated into WebTAG guidance by the DfT.
HEAT is designed to be an accessible method of estimating health benefits for professionals
without a health background (Kahlmeier et al 2011 p. 18). Results indicate only the order of
magnitude of benefits for a group of people overall, and morbidity benefits are not included
because of comparatively little evidence on morbidity and cycling in comparison to mortality
benefits. Results are therefore conservative since no disease-related benefits are quantified
(Kahlmeier et al 2011 p. 9). The DfT suggests morbidity benefits may be similar in size to
mortality benefits (DfT 2012b p. 15).Appendix 1 shows the mechanics of the HEAT tool in
greater detail.
Table 6: Department for Transport WebTAG Appraisal Objectives (DfT 2011b pp. 4-5)
Objective Description
Environment Includes noise, local air quality, greenhouse gases, landscape, townscape,
biodiversity, heritage of historical resources, water environment, physical
fitness and journey ambience
Safety Includes accidents and security
Economy Includes public accounts, transport economic efficiency, reliability, and
wider economic impacts
Accessibility Includes option values, severance, and access to the transport system
Integration Includes transport interchange, land use policy, and other government
policies
WebTAG calculations used survey data in combination with other subsidiary data sources,
and numerous DfT 'TAG Units' for guidance on how to carry out the appraisal. Because the
C2W scheme is funded out of general taxation rather than from the government transport
budget, meaning that there are no 'upfront' costs to the government of running the C2W
scheme, the tax and national insurance revenue losses from employee's savings were used as
indicative costs to government, in order to provide a benefit-cost-ratio (BCR) for the scheme.
An appraisal period of ten years was considered appropriate, ten years being a proxy for the
typical lifetime of a bike (since some bikes can be expected to last less and some more time
than this).Appendices 2 and 3 outline how the data was used in the appraisal.
Table 7 outlines all the various impacts of the C2W scheme, and indicates which are
considered in the financial analysis and which in the CBA.
Page 9STAR 2014
Anne Clarke, Jeremy Shires & James Laird
Table 7: Impacts of C2W Scheme – Financial and CBA
Impact Financial analysis Cost benefit analysis
• Accident dis-benefits x
• Physical fitness benefits x
• Absenteeism benefits for employers x
• Decongestion benefits x
• Other marginal external cost benefits from x
reduced car mileage (infrastructure, local air
quality, noise greenhouse gases)
• Fuel duty revenue losses x x
• Vehicle Excise duty revenue loss x x
• National Insurance savings for employers x x
• National Insurance savings for employees x x
• National Insurance revenue losses for x x
government
• Vehicle operating cost employee savings and x x
industry losses
• Income tax losses for government x x
• User bike maintenance costs x x
• Fare revenue losses for public transport x x
operators
• VAT gains for government from spending x x
redistributed away from public transport fares
• Cost of bike for respondent x
• Bikes sales for industry x
Page 10STAR 2014
Anne Clarke, Jeremy Shires & James Laird
• Commission on bike sales, C2W scheme x
providers
• Opportunity cost of loan to business x
• Car sale benefit for users, loss for industry x
• Vehicle Excise duty employee saving x
• Income tax savings for employees x
• Fare savings for employees x
• Bike maintenance sales for the bike industry x
• Reduced turnover in the car industry x
• User car sales x
• Employee travel time benefits - -
4.2 Assessment method/data used
Conventional WebTAG CBA fails to account for many of the benefits of the scheme because
it assesses the overall costs and benefits to society as a whole only. Because of this, further
financial analysis of the benefits as they accrue to the different interested parties has also been
carried out. Table 8 below provides a financial analysis of the impact of the scheme, in terms
of which parties the various costs and benefits accrue to (including aspects not included in the
standard CBA, such as the travel time savings some users realise due to a mode shift to
cycling).
Table 8: Financial analysis of the impact of the scheme (values are the sum of
discounted base year (2010) values for the 10-year lifetime of the bike in
£000s)
Impact Government Employers Employees Cycle Cycle to Public Car Other Total
industry work transport industry
scheme providers
providers
Income tax and -£55 £20 £35 - - - - £0
NI (income tax and (NI payments) (income tax
NI revenue) and NI
payments)
Cost of bike - -£17 -£135 £114 £21 - - -£17 £0
loan (opportunity (cost of bike, (bike sales (commiss-
cost of loan) including final minus C2W ion and final
payment) scheme market value
provider payments)
commission
fee)
Fuel/ vehicle -£72 - £252 (vehicle - - - -£180 £0
operating costs (fuel duty) operating cost (vehicle
-£19 savings) £19 mainte-
(VED losses) (VED nance sales)
savings)
Car sale - - £33 - - - -£33 £0
(car sale (car sales)
revenue)
Public transport £60 - £300 - - -£300 - £60 £0
fares (extra VAT (fare savings) (fare
revenue) revenue
losses)
Bike - - -£455 £455 - - - £0
maintenance (mainten-ance (revenue
costs) from bike
mainten-
Page 11STAR 2014
Anne Clarke, Jeremy Shires & James Laird
ance sales)
Total -£86 £3 £49 £569 £21 -£300 -£213 £43 £0
Interestingly, the employees using the Cycle to Work scheme actually lose out in the financial
analysis. The combined savings on vehicle operating costs and fares outweigh the added bike
maintenance costs by around £100,000 for the whole group, but the overall cost of the bike is
not fully recouped when the various costs and savings are balanced. This can largely be
explained by the inclusion of the extra VAT payments scheme users make due on spending
which is transferred from public transport fares to other goods which have VAT added. In
reality, this 'loss' would not be perceived by users.
The stakeholder group which gains the most from the scheme is the bike industry, with
spending on vehicle maintenance and public transport fares largely transferred to spending on
cycle maintenance. The bike industry also gains from the sales of the bikes and accessories
generated through the scheme. The stakeholders that lose out most from the scheme are the
car industry and the public transport industry, as might be expected with a scheme that
encourages a mode shift from these modes to cycling.
4.3 CBA and CBA sensitivity tests
The CBA results are outlined in Table 9. The scheme has a PVC of £0 because losses to central
government revenue are classed as dis-benefits rather than costs. Two alternate BCRs were therefore
presented: BCR2 classifies all lost government revenue as the 'cost' of the scheme to government,
and BCR3 uses the capital cost of the bike to indicate the cost of the scheme.
Table 9: Results for the 10-year appraisal period, £1,000s
Existing bike
owners who Existing All
Conventional Non-bike did not cycle cyclists respondents
WebTAG CBA owners (n=55) (n=73) (n=115) (n=243)
Fare revenue losses -£122.0 -£189.0 -£46.0 -£358.0
NI savings for employers £5.0 £7.0 £11.0 £23.0
Absenteeism £11.0 £21.0 £9.0 £41.0
Economy
Infrastructure £0.5 £0.8 £0.4 £1.8
Congestion £77.0 £118.0 £58.0 £253.0
Local Air Quality £0.3 £0.4 £0.2 £1.0
Noise £0.5 £0.8 £0.4 £1.8
Environmental
Greenhouse Gases £4.0 £6.0 £3.0 £14.0
Social Physical fitness £47.0 £438.0 £0.0 £485.0
Safety Accident* -£5.0 -£14.0 -£1.8 -£21.0
Public VED -£7.0 -£13.0 -£3.0 -£23.0
accounts Income tax and NI -£12.0 -£19.0 -£31.0 -£61.0
Indirect Taxation
-£2.0 -£2.0 -£10.0 -£14.0
(fuel duty and VAT)
Page 12STAR 2014
Anne Clarke, Jeremy Shires & James Laird
PVB -£3 £355 -£10 £344
PVC £0 £0 £0 £0
NPV -£3 £355 -£10 £344
Infinity – Infinity –
Infinity – can't Infinity – can't
can't divide can't divide
CBA divide by 0 divide by 0
BCR1 (PVB/PVC) by 0 by 0
BCR2 (PVB/'true' cost to
-0.13 10.44 -0.22 3.51
government)
BCR3 (NPV/K*) -0.10 8.44 -0.14 2.55
*K=the capital cost of the bicycles discounted back to 2010
The NPV and BCR vary substantially between the different groups. The main reason for this
was the substantial difference in physical fitness benefits between groups 1 and 3 (non-bike
owners and existing cyclists) and group 2 (those who owned a bike but did not use it prior to
using the scheme). The physical fitness benefits were much greater for group 2 because
individuals in this group increased their physical activity levels by a much greater amount
after using the scheme than the other two groups (by an average of three hours per week, as
opposed to 30 minutes for non-bike owners and 20 minutes for existing cyclists).
As the cycle to work scheme does not affect the overall transport budget it is not possible to
calculate a BCR with the PVC set to the cost to the government transport budget as advised in
appraisal guidance. Instead we have calculated two other BCRs, the first (BCR2) being to an
overall cost to government, and the second (BCR3) considering the use of resources (i.e. the
capital cost of the new bicycle). We can see from the overall cost to government ratio (BCR2)
that the return is good overall, and very good for non-cyclists who own a bike. This is also
the case for the NPV/K ratio. Overall, the BCR is fairly comparable to what has been found
in the appraisal of other cycling investments, although this is largely because of the impact of
the changes to physical activity by group 2 (the BCR for the other groups was negative).
However, this BCR result is significant since it uses reported rather than estimated
information, and also includes all WebTAG categories (such as the impact on the accounts of
public transport providers), which few other analyses do.
4.3.1 Sensitivity testing
The DfT recommends carrying out sensitivity testing on the core assumptions made in cycling
appraisals (DfT 2012b p. 33). Sensitivity testing gives an indication of the impact of the
choice of objective parameters and the assumptions made in the appraisal. In the appraisal, the
'big ticket' aspects are fare revenue losses, fuel duty, physical fitness, absenteeism and
congestion. Fare revenue losses and fuel duty figures were derived from information provided
by respondents on how the scheme had impacted on their travel behaviour in these relevant
areas. These aspects will therefore not be sensitivity tested (it is fairly obvious to readers what
impact increasing or decreasing these values by 25% would have).
The impact of the assumptions and values used for the other 'big ticket' aspects is discussed
below
4.3.2 Absenteeism
The study which informed DfT guidance on absenteeism found a reduction in short-term sick
leave of 6-32% (DfT 2012b p. 29). This would benefit employers by between 0.4 and 2.1 days
Page 13STAR 2014
Anne Clarke, Jeremy Shires & James Laird
gross salary costs (see Table 10 for values for the different segments).
Table 10: Sensitivity testing: NPV of absenteeism benefits per annum (based on 2013
salary data, undiscounted)
Reduced short- Group 1 Group 2 Group 3 All
term sick leave
0.4 days £559.78 £1,056.92 £465.93 £2,082.62
1 day £1,399.44 £2,642.30 £1,164.81 £5,206.55
2.1 days £2,938.82 £5,548.83 £2,446.11 £10,933.76
Table 10 shows that changing this assumption does significantly change the absenteeism
benefits of the scheme. Decreasing absenteeism benefits to the equivalent of 0.4 days less sick
leave per employee affected would have little impact on overall results. Increasing benefits to
the equivalent of 2.1 days less sick leave per employee would bring the PVB value for groups
1 and 3 closer to a positive figure.
An alternative assumption on absenteeism which would significantly affect the overall
appraisal would be to assume that all commuters who increased their PA realised absenteeism
benefits (this causes absenteeism benefits to approximately quadruple). The impact of this on
annual absenteeism benefits for each group is outlined in Table 11 below.
Table 11: Sensitivity testing: NPV of absenteeism benefits per annum, if all
respondents who increased their physical activity as a result of using the
scheme created absenteeism benefits (based on 2013 salary data,
undiscounted)
Reduced short- Group 1 Group 2 Group 3 All
term sick leave
0.4 days £2,023.36 £4,149.91 £2,017.54 £8,190.81
1 day £5,058.39 £10,374.77 £5,043.86 £20,477.02
2.1 days £10,622.62 £21,787.02 £10,592.10 £43,001.75
4.3.3 Physical fitness
Physical fitness benefits were based upon the median values for weekly physical activity before and
after respondents had used the scheme for each of the groups. Median values were used in
preference to mean values because they were more representative, because of the existence of
outliers within each group. In the appraisal, no physical fitness benefits were included for existing
cyclists because the median level of physical activity for this group prior to using the scheme was
already 300 minutes, and it is not known whether physical fitness benefits occur above this level of
physical activity. However, the HEAT methodology and user guide does cite research which finds that
physical activity has a continuous dose-response relationship with most health outcomes (Kahlmeier
et al 2011 p. 9).
If the change in median weekly physical activity for existing cyclists is entered into the HEAT tool this
adds £63,000 to the NPV for the ten-year appraisal period, although this would not cause the BCR to
become positive (physical fitness benefits for this group were not included because most respondents
Page 14STAR 2014
Anne Clarke, Jeremy Shires & James Laird
were above the 300 minute threshold at which the WHO believes extra health benefits – above the
basic benefits realised at 150 minutes physical activity per week – are realised, and the median
change in physical activity was also 0).
If physical fitness benefits are assessed with new segmentations for the whole group based on
changes to physical activity level, this also influences the BCR and NPV for the whole group.
15 respondents produce physical fitness benefits because they reduce their physical activity level, by
100 minutes per week on average (median). This would equate to a reduction in -£23,000 over the
ten-year appraisal period.
77 respondents do not change their physical activity level, and so would not generate any physical
fitness benefits.
112 respondents increase their physical activity level as a result of using the scheme, 50 of whom
were below the recommended level of weekly physical activity (150 minutes), and 31 of whom were
between the basic and upper levels of physical activity (150-300 minutes per week). Applying the
HEAT tool to these two groups generates £323,000 and £148,000 over the ten-year appraisal period
respectively.
The total physical fitness benefits for the group when analysed in terms of physical activity levels
before and after using the scheme rather than by cycling status before using the scheme generates
overall benefits of £448,000 over the ten-year period, as opposed to £485,000 over the ten year
period. This suggests that the original analysis is fairly robust for giving 'ballpark' figures based on the
HEAT tool.
4.3.4 Congestion
The appraisal of decongestion benefits used the weighted average values for the UK for all regions
and all time periods. More specific regional values could have been used for the analysis, however this
is the only aspect of the analysis which would be region-specific and the research aimed to give an
indication of the impact of the scheme in general, so this was felt to be a reasonable approach.
5 Discussion of results
5.1 Impact of including public transport revenue losses
It is significant that, excluding physical fitness benefits for group 2, fare revenue losses for public
transport providers is the biggest item in the appraisal. This is an impact which is rarely included in
other cycling appraisals (for WebTAG examples see Wilson and Cope 2011 and DfT 2012b itself; non-
WebTAG economic assessments do not seem to include costs to transport providers, see for example
the review of assessments by Cavill et al 2008). The inclusion of public transport revenue losses had a
substantial impact in this appraisal. Scheme users who replaced bus travel with cycling made
significant personal travel cost savings, but values are only included as 'business provider costs' not
as 'user savings'. This was countered to some extent in the appraisal through the inclusion of the
increased VAT revenues that are generated, since public transport fares are VAT-free but redirected
spending can be assumed to be on goods which do have VAT added. On the other hand, much public
transport provision in the UK is government subsidised, so any reduction in its use could increase
subsidy costs, or lead to a reduced level of service for remaining passengers. For over-subscribed
peak services on the other hand, passengers would experience a journey quality benefit if other
passengers begin cycling, thereby reducing crowding.
5.2 The value for money of the scheme – a cycle funding perspective
Page 15STAR 2014
Anne Clarke, Jeremy Shires & James Laird
If the results on the amount spent on the C2W scheme from the samples studied are representative of
what is spent generally, the lost government revenue from income tax and National Insurance (at just
under £350 per cyclist on average) might amount to as much as £192.5m (£157.5m of that since
2008). This equates to over £30m per year since 2008, roughly £0.50 per person. Current national
cycling funding is meagre, about £2 per person per year (Walker 2013). If an amount equivalent to the
lost revenue from the C2W scheme was instead set aside for other cycling projects, the government
could increase cycle funding by 25% and avoid directly subsidising existing cyclists. It could instead
more directly target those not currently cycling, or focus on hard measures which would more
comprehensively benefit cyclists and encourage new cyclists.
5.3 The value for money of the scheme – a user-profile and public health perspective
The value for money of the scheme is reduced by the existing cyclists who take advantage of the
scheme but don't change their behaviour. Use of the scheme by existing cyclists to extend their bike
collection, sometimes multiple times, treats the scheme as a government subsidy for hobby or 'keep-
fit' cycling. From a public health perspective, existing cyclists, as well as many other scheme
participants, are not generally those population groups engaging in an unsafely low amount of physical
activity (70% of scheme users were already taking adequate weekly physical activity). The equivalent
funding, targeted towards those below the recommended level of physical activity (maybe through the
NHS instead), might be more effective.
6 Conclusions
6.1 Impact of the scheme on propensity to cycle
The scheme substantially increases the cycling levels of its users. 96% of respondents start cycling
weekly as a result of using the scheme, 84% start cycling to work at least twice a week. The scheme
attracts many people who did no regular cycling beforehand (53% of all users in the sample). The
scheme increases cycling levels for a range of non-commuting trip purposes, with the biggest
increases occurring for shopping, personal business, accessing leisure activities or visiting friends or
family. Around half of respondents use their bike for these trip purposes after using the scheme. The
number of respondents cycling for business travel almost doubles to approximately 28% of all
respondents. Respondents giving up their car, parking space, travel pass or other item associated with
their previous commute mode is further evidence that the scheme changes propensity to cycle.
The scheme is somewhat limited by the fact that a large number of respondents who weren't already
regularly cycling before using the scheme were already considering this mode before making use of
the scheme. As would be expected, the scheme has a lesser impact on those less pre-disposed to
starting cycling. Another limitation on the scheme's impact on propensity to cycle was its use by
existing cyclists who do not change their cycling behaviour (~70% of all existing cyclists).
6.2 The benefits of the scheme
The scheme generated many benefits which were included in the appraisal. Health benefits were
relatively high despite most scheme users (over 70%) already being sufficiently active. The scheme
had a positive impact on physical fitness, absenteeism, decongestion and other externalities of car
use. This was however countered by the high amount attributed to lost public transport revenue. Other
quantified benefits that were not included in the WebTAG-based BCR revolved around benefits for
scheme users including public transport fare savings as well as travel time benefits in comparison to
respondents' previous mode. Benefits are lower for society overall where induced bike purchases
cause an environmental burden.
6.3 Assessment of the scheme: its strengths and limitations
Page 16STAR 2014
Anne Clarke, Jeremy Shires & James Laird
The scheme effectively meets the government objectives it sets out to, namely, increasing cycling,
improving health, and reducing the environmental impact of transport. Appraisal results suggest it is
good value for money for the government despite being used by many existing cyclists. It is favourable
as an employee benefit scheme, especially when the VAT impacts from reduced public transport
spending are not included. Its value for money compared to alternative measures which encourage
cycling is comparable in CBA terms. Although it does not alter the marginal cost of cycling for the user
it does alter the total costs of cycling. This is potentially a significant factor in the scheme's favour for
attracting and enabling new cyclists, in contrast to many other measures to promote cycling. The VfM
for the whole scheme would be better if it could be better tailored to those who increase the level of
physical exercise above the ‘threshold’, however by effectively 'subsidising' cycling per se it reduces
the generalised cost of cycling compared to other modes. Giving an economic advantage to those who
choose to cycle also sends out a clear pro-cycling message and raises the status of cycling.
More specific data was collected on individual behaviour than is typically known for an appraisal, so
assumptions were minimal. Sample sizes were smaller than hoped for, somewhat limiting the general
applicability of findings. The research found evidence of activity substitution for some respondents who
started cycling, which is often not considered in the appraisal of active travel modes.
Acknowledgements
We would like to thank the selected employers for allowing us to distribute the survey to their staff, in
particular the individuals within the organisations who helped in distributing the survey. We would also
like to thank Andy Shrimpton at Cycle Heaven Ltd for distributing the pilot survey through the business'
customer newsletter.
Finally, we would like to thank the survey participants for the time taken to complete the survey.
References
AA. 2013a. Motoring Costs 2013: Diesel Cars [online]. [Accessed 30 August 2013].
Available from: http://www.theaa.com/resources/Documents/pdf/motoring-advice/running-
costs/diesel2013.pdf
AA. 2013b. Motoring Costs 2013: Petrol Cars [online]. [Accessed 30 August 2013].
Available from: http://www.theaa.com/resources/Documents/pdf/motoring-advice/running-
costs/petrol2013.pdf
ANDERSON, L., P. SCHNOHR, M. SCHROLL, and H. HEINS. 2000. All-Cause Mortality
Associated With Physical Activity During Leisure Time, Work, Sports, and Cycling to Work.
Archive of Internal Medicine [online] 160(11), [Accessed 30 August 2013], pp. 1621-1628.
Available from: http://archinte.jamanetwork.com/article.aspx?articleid=485349
BARNES-CLAY, T. 2014. NEWS: Motorists urged to get the best price for scrap cars
[online]. [Accessed 21 March 2014]. Available from:
http://www.carwriteups.co.uk/2014/01/news-motorists-urged-to-get-the-best-price-for-scrap-
cars/
BCA (British Car Auctions). 2013. The Used Car Market Report 20131 [online]. [Accessed
21 March 2014]. Available from: http://www.british-car-
auctions.co.uk/Global/UK/latest_news/BCA_Used_Car_Market_Report_2013_v2a.pdf
CAULFIELD, B., and J. LEAHY. 2011. Learning to cycle again: Examining the benefits of
Page 17STAR 2014
Anne Clarke, Jeremy Shires & James Laird
providing tax-free loans to purchase new bicycles. Research in Transportation Business &
Management [online]. 2(1), [Accessed 30 August 2013], pp. 42-47. Available from:
http://www.sciencedirect.com/science/article/pii/S2210539511000368
CAVILL, N., S. KAHLMEIER, H. RUTTER, F. RACIOPPI, and P. OJA. 2008. Economic
analyses of transport infrastructure and policies including health effects related to cycling and
walking: A systematic review. Transport Policy. 15(5), [Accessed 30 August 2013], 291-304.
Available from:
http://www.sciencedirect.com/science/article/B6VGG4VFJS3G-/2/47f3ab4668f05b28d03d48
7d326e7e1d
COPE, A., A. KENNEDY, M. LEDBURY, R. CAMBERY, N. CAVILL, J. PARKIN, S. NAIR.
2010. Cycling demonstration towns – an economic evaluation [online]. [Accessed 30 August
2013]. Available from: http://abstracts.aetransport.org/paper/index/id/3523/confid/16
CYCLE TO WORK ALLIANCE (C2WA). 2014. The healthy commute : What impact does
cycling to work
have on employee health? [online]. [Accessed 21 March 2014]. Available from:
http://www.cycletoworkalliance.org.uk/news_43_1470779177.pdf
CYCLE TO WORK ALLIANCE (C2WA). 2013. Cycle to Work Alliance: The Green Way to
Work – Sustainable Transport Report [online]. [Accessed 30 August 2013]. Available from:
http://www.cycletoworkalliance.org.uk/news_41_2538974460.pdf
CYCLE TO WORK ALLIANCE (C2WA). 2011. Cycle to Work Alliance: Behavioural Impact
Analysis [online]. [Accessed 30 August 2013]. Available from:
http://www.cycletoworkalliance.org.uk/images/BehaviourImpactAnalysisFeb2011.pdf
CYCLESCHEME. 2013a. How much can I save? [online]. [Accessed 30 August 2013].
Available from: http://www.cyclescheme.co.uk/calculator
DAVIS, A. 2010. Value for Money: An Economic Assessment of Investment in Walking and
Cycling [online]. [Accessed 30 August 2013]. Available from:
http://www.apho.org.uk/resource/view.aspx?RID=91553
DEPARTMENT FOR TRANSPORT (DfT). 2013a. WebTAG Databook [online]. [Accessed 21
March 2014]. Available from: https://www.gov.uk/government/publications/webtag-tag-data-
book
DEPARTMENT FOR TRANSPORT (DfT). 2013b. Vehicle Licensing Statistics: 2012
[online]. [Accessed 30 August 2013]. Available from:
https://www.gov.uk/government/uploads/system/uploads/attachment_data/file/198753/vls-
2012.pdf
DEPARTMENT FOR TRANSPORT (DfT). 2012a. Updated guidance on implementing the
Cycle to Work Scheme [online]. [Accessed 30 August 2013]. Available from:
https://www.gov.uk/government/uploads/system/uploads/attachment_data/file/63929/cycle-to-
work-guidance-update.pdf
DEPARTMENT FOR TRANSPORT (DfT). 2012b. TAG Unit 3.14.1: Guidance on the
Appraisal of Walking and Cycling Schemes [online]. [Accessed 30 August 2013]. Available
Page 18STAR 2014
Anne Clarke, Jeremy Shires & James Laird
from: http://www.dft.gov.uk/webtag/documents/expert/pdf/u3_14_1-walking-and-cycling-
120723.pdf
DEPARTMENT FOR TRANSPORT (DfT). 2011a. Cycle to Work Scheme implementation
Guidance [online]. [Accessed 30 August 2013]. Available from:
https://www.gov.uk/government/uploads/system/uploads/attachment_data/file/11305/cycle-to-
work-guidance.pdf
DEPARTMENT FOR TRANSPORT (DfT). 2011b. The Appraisal Process: TAG Unit 2.5
[online]. [Accessed 30 August 2013]. Available from:
http://www.dft.gov.uk/webtag/documents/project-manager/pdf/unit2.5.pdf
DEPARTMENT FOR TRANSPORT. 2008. A Sustainable Future for Cycling [online].
[Accessed 30 August 2013]. Available from:
http://www.thepep.org/ClearingHouse/docfiles/A.Sustainable.Future.for.Cycling.pdf
ELLIOTT, R. 2010. Leeds Universities' cycle loan schemes: who participates, why and do
they make a difference? Master’s thesis, Institute for Transport Studies, University of Leeds.
HENDRIKSEN, I., M. SIMONS, F. GALINDO GARRE, and V. HILDEBRANDT. 2010. The
association between commuter cycling and sickness absence. Preventive Medicine [online],
51(2), [Accessed 30 August 2013]. pp. 132-135. Available from:
http://www.sciencedirect.com/science/article/pii/S0091743510001829
HMRC. 2013. National Insurance Contributions [online]. [Accessed 30 August 2013].
Available from: http://www.hmrc.gov.uk/rates/nic.htm
JAKE'S BIKES. [n.d.]. Lifetime cost of bike ownership [online]. [Accessed 21 March 2014].
Available from: jakesbikes.co.uk/resources/documents/cost%20of%20ownership.pdf
KAHLMEIER , S., N., CAVILL, H. DINSDALE, H. RUTTER, T. GÖTSCHI, C. FOSTER, P.
KELLY, D. CLARKE, P. OJA, R. FORDHAM, D. STONE, and F. RACIOPPI. 2011. Health
economic assessment tools (HEAT) for walking and for cycling: Methodology and user guide
[online]. [Accessed 30 August 2013]. Available from:
http://www.euro.who.int/__data/assets/pdf_file/0003/155631/E96097rev.pdf
PUCHER, J., and R. BUEHLER . 2008. Making Cycling Irresistible: Lessons from The
Netherlands, Denmark and Germany . Transport Reviews [online], 28(4), [Accessed 21 March
2014], pp. 495–528. Available from: http://policy.rutgers.edu/faculty/pucher/irresistible.pdf
RABL, A., and A. DE NAZELLE. 2012. Benefits of shift from car to active transport.
Transport Policy [online], 19(1), [Accessed 30 August 2013]. pp. 121-131. Available from:
http://0-www.sciencedirect.com.wam.leeds.ac.uk/science/article/pii/S0967070X11001119
UK GOVERNMENT. 2013. Vehicle tax rate tables [online]. [Accessed 30 August 2013].
Available from: https://www.gov.uk/vehicle-tax-rate-tables
WALKER, P. 2013. Invest £1bn a year to boost cycling levels tenfold, urges report. The
Guardian [online]. 23 April. [Accessed 30 August 2013]. Available from:
http://www.theguardian.com/lifeandstyle/2013/apr/24/invest-cycling-tenfold-report
Page 19STAR 2014
Anne Clarke, Jeremy Shires & James Laird
WILSON, A., and COPE, A. 2011. Value for money of walking and cycling interventions:
making the case for investment in active travel [online]. [Accessed 30 August 2013].
Available from: http://www.stsg.org/star/2011//angelaWilson.pdf
Page 20STAR 2014
Anne Clarke, Jeremy Shires & James Laird
Appendix 1: HEAT Methodology (Kahlmeier et al 2011 p. 22)
Page 21STAR 2014
Anne Clarke, Jeremy Shires & James Laird
Appendix 2: Survey data used for appraisal calculations
Objective Survey Data Subsidiary data
• Accident dis- • Minutes cycled per • The difference in accident rates
benefits week before and after, between the UK and Denmark
converted into (HEAT accounts for the change
estimated distance in accidents due to a mode shift
to cycling, but is based on
Danish data) – (Pucher and
Buehler 2008)
• WebTAG average value of a
prevention of a cycle casualty -
Table A 4.1.2 (DfT 2013a)
• Physical fitness • Median minutes of • WHO Mortality database data
benefits physical activity per for UK
week before and after • Value of a statistical life -
using the scheme for WebTAG Unit 3.14.1 (DfT
each group 2012b p. 16)
• Absenteeism • Number of • Reduced absence due to
benefits* respondents who went increased physical activity -
from being below to 1. WebTAG Unit 3.14.1 (DfT 2012b p.
above the NHS 18)
recommended physical 2. Hendriksen et al (2010)
activity level (150
minutes per week)
• Average pay data
• Externalities • Reduced car mileage • Marginal external costs and
• Vehicle per week indirect tax -
operating cost Table A 5.4.2 (DfT 2013a)
savings • Average car running costs -
• Fuel duty (AA 2013a/b)
revenue loss
• User time • Reported commuting • VOT for commuting -
savings time savings compared Table A 1.3.2 (DfT 2013a)
to alternate mode
• Car sale benefit • Reduced car • Average used car price -
• Vehicle Excise ownership Used Car Market Report 2013 (BCA
duty revenue 2013 p. 19)
loss* • Average car scrappage price -
(Barnes-Clay 2014)
• Average CO2 emissions, UK
vehicle fleet -
Vehicle Licensing Statistics: 2012
(DfT 2013b p. 6)
• VED emissions bands -
Vehicle tax rate tables (UK
government 2013)
• Fare savings • Reduced public -
• Fare costs for transport fare
business expenditure
providers*
• National • Amount spent on bike • National Insurance
Page 22You can also read