Blockchain-Based Flexible Double-Chain Architecture and Performance Optimization for Better Sustainability in Agriculture
←
→
Page content transcription
If your browser does not render page correctly, please read the page content below
Computers, Materials & Continua                                                                  Tech Science Press
DOI:10.32604/cmc.2021.016954
Article

                           Blockchain-Based Flexible Double-Chain
                         Architecture and Performance Optimization for
                               Better Sustainability in Agriculture
     Luona Song1 , Xiaojuan Wang1, * , Peng Wei1 , Zikui Lu1 , Xiaojun Wang2 and Nicolas Merveille3

                     1
                         Beijing University of Posts and Telecommunications, Beijing, 100876, China
                                     2
                                       Dublin City University (DCU), Dublin 9, Ireland
                             3
                               University of Quebec at Montreal, Montreal, H2X 3X2, Canada
                             *
                               Corresponding Author: Xiaojuan Wang. Email: wj2718@163.com
                                   Received: 15 January 2021; Accepted: 16 February 2021

                 Abstract: Blockchain is an emerging decentralized distributed technology that
                 can cross the boundaries and guarantee safe and trustworthy value transfers
                 between participants. Combining the blockchain technology with the Internet
                 of Things (IoT) technology to enhance the transparency and sustainability
                 of agricultural supply chains, has attracted researchers from both academia
                 and industry. This paper reviews the latest applications of the blockchain and
                 IoT technologies in the sustainable agricultural supply chain management and
                 explores the design and implementation of a blockchain-based sustainable
                 solution. By placing the sustainable agricultural supply chain management at
                 its core, a blockchain-based framework is designed. Considering the hetero-
                 geneity of the transaction data and the IoT data, the openness of sustainability
                 information and the sensitivity of participants’ data, a double-chain structure
                 is proposed including the consensus method, the transaction mechanisms, the
                 sustainability assessment method and the performance optimization strategy.
                 The sustainable management practices of all participants are introduced into
                 the blockchain network, especially those allowing the government to play a
                 more significant role in agriculture supply management. Meanwhile, to meet
                 the scenario requirements, a data reduction method is designed to improve
                 performance and reduce block size. Simulations are performed to evaluate the
                 latency, throughput, costs and efficiency of the proposed structure. This paper
                 can be a useful reference for further research on the application of blockchain
                 and IoT technologies in sustainable agricultural management.

                 Keywords: Blockchain; IoT; sustainability management; information system

1 Introduction
    With the massive implementation of technology, sustainability in agriculture is now facing
major challenges. The sustainable development goals (SDGs), in the form of established mitigation
targets and industrial strategies, are top priorities for many countries. According to a meta-analysis

                     This work is licensed under a Creative Commons Attribution 4.0 International License,
                     which permits unrestricted use, distribution, and reproduction in any medium, provided
                     the original work is properly cited.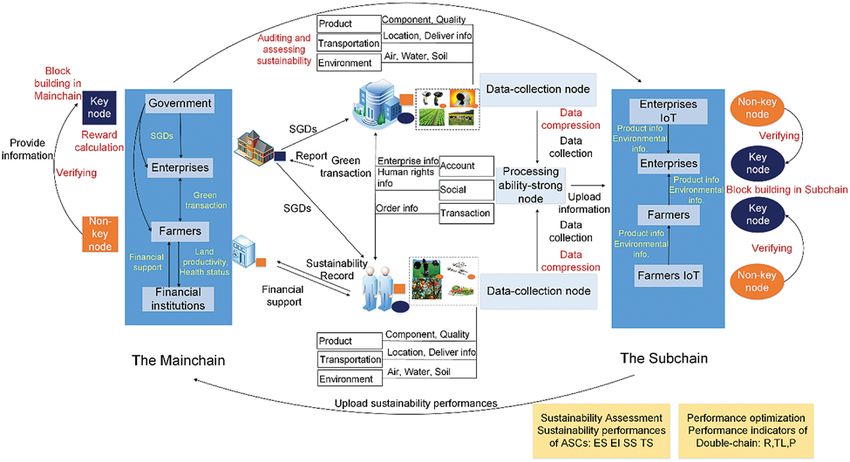
1430                                                                          CMC, 2021, vol.68, no.1

published in Science [1], the food sector accounts for approximately 26% of global greenhouse gas
emissions. The United Nations forecasts that the population to be fed will rise to nearly 10 billion
by 2050. Many countries have established goals for climate neutrality (e.g., Denmark, France),
productivity (e.g., Australia, Germany), the elimination of hunger (e.g., Canada, the United States)
and land management (e.g., Israel, New Zealand, the Netherlands). Achieving the sustainability
goals in the agricultural sector involves technical and non-technical elements.
    The first challenge is the data shortage in the sustainability assessment process although big
data is generated in the agriculture supply chains (ASCs). Different partners, such as farmers,
process enterprises, logistics, and retailers, play different roles in an ASC. To improve agricul-
tural sustainability, supply chain partners must take responsibility for their specific environmental
impacts and monitor them. One practical approach is to build an ASC only with partners who
are determined to meet sustainability targets and then communicate this success to consumers
and related parties, such as government regulators. However, limited participation of farmers
has led to the lack of critical details in sustainability assessment during the agri-food life cycle.
The development of the Internet of Things (IoT) has provided a practical way to capture data
generated during agricultural production, but farmers lack incentives to invest in IoT systems.
Low-profit margins make any agricultural transformations (e.g., agriculture 4.0, rural revitaliza-
tion, digital agriculture) more prudent, and using technology just for the sake of using technology
can mar sustainability in both the short and long term [2]. Therefore, to improve transparency
in ASCs, it is important to consider IT acceptance, cost and performance, as well as value
creation mechanisms.
     The performance and cost of technology deployment have become the second challenge in
developing sustainable ASCs. In recent years, blockchain technology is found to be an ideal tool
to prevent tampering and guarantee the traceability of agricultural data and provide a truthful
record, based on which regulators can supervise and third parties can provide services. Due to
its specific heterogeneity, the agricultural industry requires critical considerations of data hetero-
geneity, multipartite interactions, and technical indicators such as the usability and scalability
of the system when adopting blockchain-based solutions. In sustainable ASCs, data generated
during transactions and sustainability data collected by IoT devices are different in their security
requirements, generation rates and scales; thus, the integration of data flows, the selection of
blockchain networks, appropriate technology combinations, and the operation of sustainable ASCs
deserve further attention from scholars and practitioners.
    At present, many studies introduce blockchain-and IoT-based solutions into agricultural sce-
narios that include sustainability concerns to varying degrees (e.g., [3]). The majority of efforts
have been invested in discovering technological possibilities (e.g., [4,5]) and evidence of improve-
ment (e.g., [6]), summarizing use cases (e.g., [7]) and proposing frameworks and systems (e.g., [8]).
Nevertheless, extensive research is required to enable blockchain systems to interact significantly
with other technologies in a sustainability-driven ASC. Significant research is required to enable
blockchain solutions that truly consider the demands and principles of other methodologies in
a sustainable agricultural system, including monitoring and managing agricultural sustainability.
This paper addresses the deployment of blockchain and IoT technologies in ASCs with a specific
focus on sustainability. The main contributions of this paper include:
   (1) This paper summarizes the data requirements of a value creation mechanism for sustain-
       ability assessment designs to enhance interactions between related parties and improve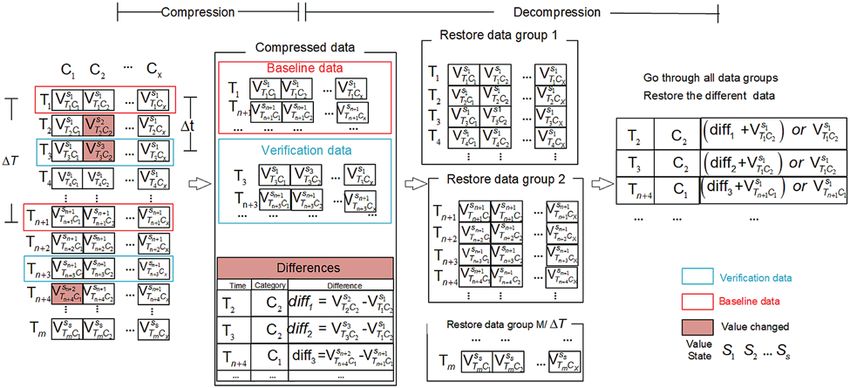
CMC, 2021, vol.68, no.1                                                                           1431

       sustainability in ASCs, and propose a sustainability framework for agricultural supply
       chains based on blockchain technology;
   (2) This paper also develops a blockchain-based flexible double-chain structure to fulfil
       the multifunctional sustainability management needs of agricultural systems, design cor-
       responding incentive mechanisms, improve the consensus algorithm, and indicate the
       applicability and effectiveness of the proposed structure using throughput, latency, and
       cost indicators;
   (3) This paper proposes a data reduction method to improve the efficiency of data collection
       and further lower the storage pressure on blockchain-based databases and considers per-
       formance optimization of the vast scale and limited value of IoT data in ACSs scenarios.
    The rest of the paper is organized as follows: Section 2 reviews the concept of sustainability
in ASC and recent works of blockchain- and IoT-based solutions. Section 3 introduces the
design of blockchain-based double-chain architecture in ASCs, the data reduction method, and
performance optimization strategy. Section 4 presents the simulation and discussion. Section 5
concludes the paper.

2 Related Work
     Sustainability assessments of products have become an increasingly important field with
increased public attention toward sustainable development, and there are many well-defined tools
for such assessments. However, owing to information latency and a lack of transparency, data
collection remains an enduring challenge in life-cycle assessments [9]. Meanwhile, improved trans-
parency also brings challenges related to energy consumption in IT implementation. Thus, the
performance and cost of technical solutions become a problem that cannot be ignored by any
industry, especially agriculture, that considers the blockchain to be an enabler. A recent paper
has proposed a data-driven framework including three-dimensional (economic, environmental, and
social) sustainable performance indicators but remained vague as to how these objectives may
be attained through improved data analytics capabilities, and the relevance of their objectives is
unclear [2]. Another paper has reviewed the role of machine learning in sustainable agricultural
supply chains and proposed an ASC performance framework that lists similar objectives [10].
Current frameworks lack measurements and ignore technological sustainability, making them less
appropriate for blockchain-based systems.
    IoT systems are widely used for data collection in current blockchain solutions for agricultural
applications. Using the IoT instead of manual data collection not only avoids human error but
also solves the problem of data tampering before upload. For current sensor deployment, many
studies focus on production processes without data processing before upload and neglect the
security of the sensor networks [10,11] and trust issues [12,13]. For instance, Lin et al. [14]
proposed a trusted, self-organized, open and ecological system for food traceability based on
blockchain and IoT. Sensors are used to record a variety of environmental data, which are stored
in every node of the blockchain system through an IoT gateway. In [15], the blockchain nodes are
divided into nine types to store data from different sensors. Accordingly, blockchain technology is
also considered an ideal solution to tackle the challenges of security problems in IoT systems [16].
    Regarding the deployment of the IoT in the supply chain, different approaches focus on differ-
ent processes. Some studies consider all participants in the agricultural supply chain (e.g., [17,18]),
while others involve only business users. In [14], a reliable food traceability system records infor-
mation from processing companies, seeding companies, logistics companies and food retailers.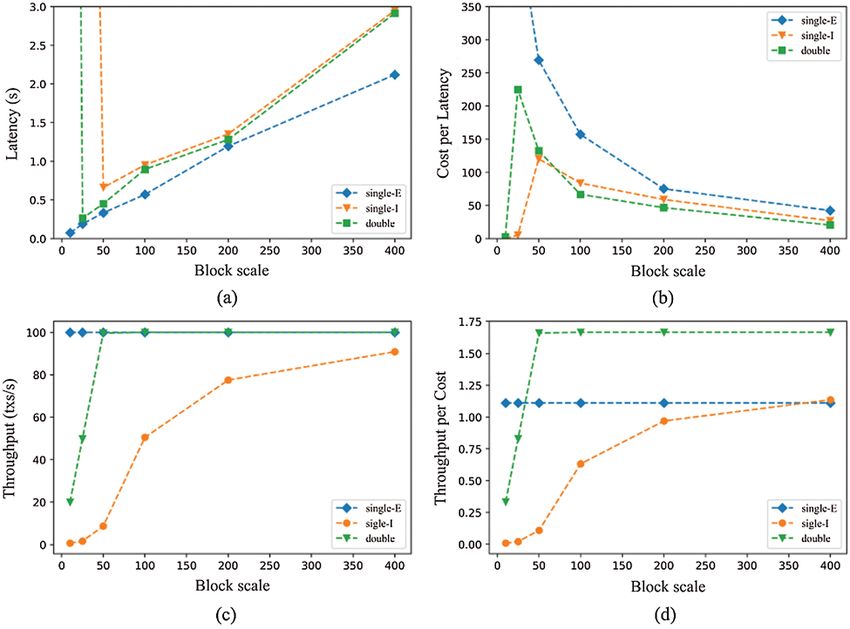
1432                                                                          CMC, 2021, vol.68, no.1

Awan et al. [19] put forward a model for upgrading traditional agriculture to smart agriculture in
which blockchain records the product name and origin and other information that is accessible to
all stakeholders. While IoT information collection and sharing have penetrated many links in the
supply chain, the depth and impact of this sharing are still relatively limited. Blockchain users
have access only to product information. However, information on the sustainability assessment of
products, which is closely related to stakeholders, is not collected, processed or shared effectively.
     Regarding data processing, very few studies have considered the problem of information over-
load in the blockchain, which edge computing is a possible solution [20]. In [21], edge computing
is used to reduce computing and storage costs and thus save network resources, while many other
studies ignore this problem and suppose real-time updates and access to data (e.g., [17]). However,
this previous work only mentions that edge computing can analyze data from the IoT layer,
without providing details about deployment and processing. In [15], the transaction throughput
and latency in agricultural blockchain are simulated, but resource efficiency and block scales
are not considered. In [19,22], only the transaction throughput is simulated, without considering
transaction latency, the number of users, or other issues.

3 Design of the Blockchain-Based Double-chain Architecture
     The sustainability of agriculture involves economic, environmental, social and technological
factors. Therefore, the designed system must adopt a reasonable consensus algorithm and system
architecture to ensure safe and efficient sustainable agricultural development. The sustainability
performance metrics of an ASC consists of economic sustainability (ES), potential environmen-
tal impacts (EI) and the social sustainability (SS) of the product i, as well as technological
sustainability (TS). Sustainability assessments can be expressed as follows:

ES = Fm , PF , LP ,                                                                            (1)

EI = PiT , LCj , w I
                     , S I
                           , AP
                                  ,                                                            (2)

where in the above ES metric Eq. (1), Fm represents farmer m, PF represents farmer’s profitability
and LP represents land productivity. In the EI metric Eq. (2), PiT represents product type or
crop type i, and LC
                  j represents life cycle phase j of product i, such as production, processing and
transportation processes. W I , SI and AP represent water impact, soil impact and air pollution
respectively.

SS = PiT , LC      R
              j ,H ,W ,P
                          E  SR
                                  ,                                                          (3)

TS = I L , F L , M L , K L ,                                                                 (4)

wherein SS metric Eq. (3), H R , W E and PSR represent human rights, working environment,
and product social responsibility respectively. The TS metric Eq. (4) focuses on the technology
investment and return of agricultural supply chain participants and determines whether supply
chain participants’ levels of informatization meet their current development needs. In the TS
metric equation, I L represent technological level, F L stands for financial level, M L refers to
management level and K L stands for knowledge and experience level.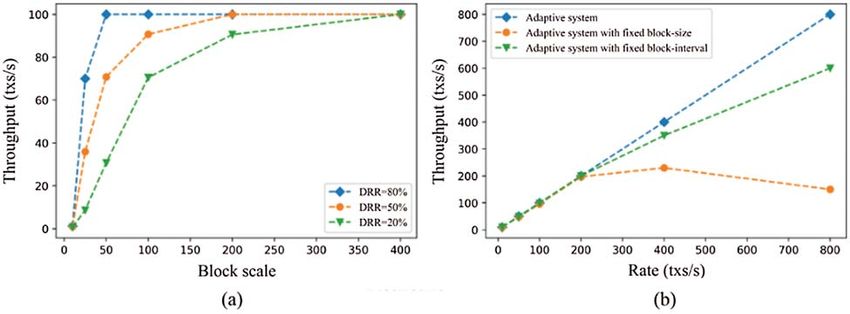
CMC, 2021, vol.68, no.1                                                                      1433

     The combination of blockchain, IoT and other new technologies can result in a high degree
of resource integration, enhance the transparency of ASCs, and quantify the sustainability of
the performances of participants. For upstream farmers in ASCs, technologies can detect various
indicators, such as crop growth, and help farmers increase production and income, thus realizing
green agriculture. For the processing enterprises in ASCs, supporting farmers in deploying IoT
equipment with extra computing power can help enterprises obtain additional tokens. Similarly,
the sustainability of the enterprise is quantified by the results of analyses of the IoT data and
the disclosure data. Green production can bring smart contracts into effect. To realize the above
vision and functions in ASC scenarios, we construct a double-chain structure (as shown in Fig. 1)
composed of a main-chain (Mainchain) and a sub-chain (Subchain).

            Figure 1: Blockchain-based double-chain framework for sustainable ASCs

    The arrangement accounts for function differentiation and security levels. The Mainchain
connects enterprises, farmers, government regulators, and financial service providers and stores
information on enterprises and farmers, such as their account information and their transaction
and social sustainability assessment information. The Subchain mostly stores data collected by IoT
devices in ASCs, including agriproduct information, product transportation information and data
on the corresponding environmental impacts during the life cycle of agricultural products. Farmers
and enterprises are the main uploaders of the information. As stakeholders, the government,
consumers and financial institutions have the right to know and supervise part of the information.

3.1 Design of the Mainchain and Sustainability Assessment
    The Mainchain stores information on a variety of transactions that occur in ASCs and
is supervised by government regulators. It is necessary to design and manage the block data
structure, consensus method, and transaction mechanisms.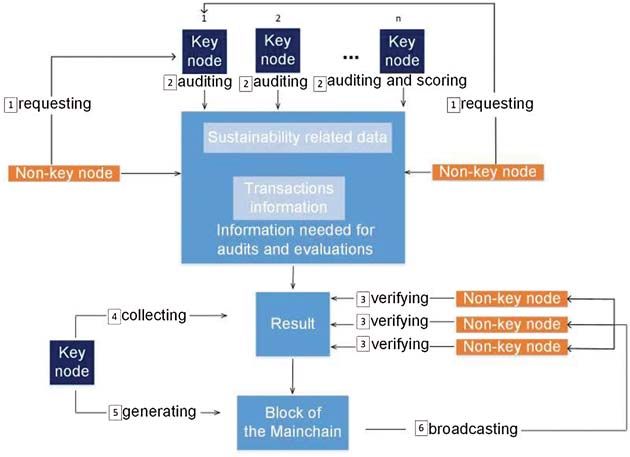
1434                                                                           CMC, 2021, vol.68, no.1

3.1.1 Block Data Structure and Consensus Method
     The key nodes in the Mainchain of the double-chain structure are government regulators,
and the non-key nodes are enterprises, farmers and financial institutions. The initialization of the
Mainchain for agricultural resources is shown in Eq. (5). In the Mainchain, the key nodes are
responsible for the generation of new blocks.
BN = (E, F, G, FI, BNeo , IOt , SC, CA) ,                                                           (5)
where BN is the Mainchain after initialization, E refers to enterprises, F refers to farmers, G
refers to government regulators, FI refers to third parties such as financial institutions, BNeo
refers to the information uploaded from environmental sustainability assessments (EI) in the
Subchain, and IOt refers to transaction information in ASCs. SC represents smart contracts and
CA is the consensus method. Our Mainchain and Subchain reference Proof-of-Authority (POA)
to design consensus mechanism, and support users to deploy more appropriate mechanism. In the
Mainchain, according to their functions, we define key nodes and non-key nodes. The key nodes
mainly refer to government nodes and non-key nodes refer to the farmers, enterprises and third
parties. The task of the key nodes is to audit the data submitted from the non-key nodes. The
non-key nodes are responsible for providing information (transaction information of two sides
and sustainability-related data) to the key nodes and are responsible for verifying the auditing
results of the government nodes. Firstly, a non-key node generates a request about the transaction
information that needs to be updated and the transaction information with sustainability-related
data is sent to one of the key nodes. Secondly, the key nodes audit the transaction information
in turn according to the audit procedures (the auditing order can be set by setting different
reputation values). The last key node in the auditing procedures is the accounting node and it
calculates the value of the data and sends the result to non-key nodes for verification. Thirdly,
each non-key node verifies the result audited by the accounting node and sends a confirmation
message to all other nodes after verification. Fourthly, the key nodes collect the verification result.
Fifthly, the accounting key node then generates a new block. Finally, the content of the new
block is broadcasted to all non-key nodes. Fig. 2 shows a logical diagram of the block-building
procedure in the Mainchain.
     The data block of the Mainchain contains the block header (Header) and the block body
(Body). The block header encapsulates the hash value of the previous block, the version number,
the Merkle root hash and the timestamp. The block body encapsulates the audit results, verifi-
cation results, and a digital signature. Digital signatures come from all Mainchain participants,
which can be used to prevent repudiation.

3.1.2 Transactions and Incentive Mechanisms
     In the Mainchain, a variety of transactions will occur between different participants in ASCs.
The broadcasted transaction information contains the product type, quantity, location, and vol-
ume, and the hash values and sustainability scores of both parties. To ensure the uniqueness and
security of the transaction, enterprises and farmers will generate a unique hash code according to
their identity information and time stamp. The hash code is calculated using Eq. (6) below.
I = hash (t, IOa ) ,                                                                                (6)
where I is the hash code that identifies both parties, t is the timestamp, and IOa is the infor-
mation from both parties. Taking the transactions between farmers and enterprises and the
transactions between different enterprises as examples, we construct two transaction scenarios.
CMC, 2021, vol.68, no.1 1435
When transactions occur between an enterprise and a farmer (MEF ) or between enterprises (MEE ),
the broadcasted information is expressed as follows:
MEF = (PTi , n, l, TA, sreEi , sreFi , I)
, (7)
MEE = (PTi , n, l, TA, sreEi , sreEi , I)
where PTi refers to product type, n is the quantity, l is the location of the transaction, TA is the
total amount of the transaction, sreEi and sreFi are the sustainability scores of the enterprise and
the farmer, and Ii is a hash code to identify each party.
Figure 2: Logical diagram of the block-building procedure in the Mainchain
The incentive mechanism usually refers to an incentive measure (such as awarding tokens) to
stimulate the smooth operation and development of blockchain networks. In the Mainchain, there
are several ways to obtain tokens, such as green production; enterprises buy agricultural products
with high sustainability scores, and farmers sell agricultural products to enterprises with high
sustainability scores. For instance, transactions between sustainable farmers and enterprises are
rewarded by an incentive mechanism. Before each transaction, we calculate the sustainability score
for each of the two parties (farmers or enterprises) based on their EI and SS values to get the
combined sustainability score of the transaction. In trading, we set a basic reward unit (in terms
of the number of tokens) and classify the sustainable scores into different scales, which correspond
to different sustainability reward weights. The final reward for both parties in a transaction is
obtained by multiplying the basic reward unit with the reward weight corresponding to the scale
that the combined sustainability score of the transaction falls in.
3.2 Data Compression Method and Design of the Subchain
The Subchain collects data from several enterprises and farmers separately, involving a large
volume of data and diverse data types, such as information on products, transportation and
environmental impacts. Therefore, it is necessary to use IoT sensors to collect these data. Due
to the explosive growth of real-time updating data, the data must be simplified before they are1436 CMC, 2021, vol.68, no.1
uploaded to the blockchain. Under the premise of ensuring the accuracy of the information, the
compressed data is recorded in the Subchain and thus minimize the storage. Hence, we compress
the massive data by designing a data reduction algorithm for the edge nodes and then use smart
contracts to audit and verify the data so that participants can access the required data safely and
easily. Because environmental data, such as those on water impacts and air pollution, may change
slightly with time or temperature, data collected at adjacent times may be more similar. Given this
fact, ASC members can set a baseline according to the type of the sensor, the type of the crop,
or the data recorded at a certain time.
The input to the data-reduction algorithm is the data collected by each sensor at different time
points. These data are temporarily stored in a large-scale two-dimensional matrix. The outputs of
the algorithm are three much smaller two-dimensional matrices. The original input data can be
recovered from these three small matrices within a controllable error range. The data reduction
process is shown in Algorithm 1.
Algorithm 1: Data uploading of IoT nodes
Input: data[ ] on collection, N interval , signinterval, lcomp
Output: basedatas[ ], changes[ ], signdatas[ ]
1: function DATA COMPRESSION(data[ ])
2: get data[ ] from collection
3: nbasedata ← data.length/Ninterval
4: for i ∈ nbasedata do
5: append(data[i ∗ Ninterval ]) to basedatas[ ]
6: append(data[i ∗ Ninterval + signinterval]) to signdatas[ ]
7: end for
9: for i ∈ data.length do
10: nextdata[ ] ← data[i]
10: n ← i/Ninterval
11: basedata ← basedatas[n]
11: signdata ← data[n + signinterval]
12: for j ∈ nextdata.length do
13: if (nextdata[j] − basedata[j]) > ftthen
14: append(i, j, nextdata[j] − −basedata, nextdata[j] − signdata)tochanges
15: end if
16: end for
17: end for
18 generate PK,SK
19 result ← VRF_Hash(SK, changes)
20 proof ← VRF_Proof(SK, changes)
21: upload result, proof
22: end function
In Algorithm 1, data[ ] represents the collected raw data, Ninterval represents the number of
collected raw data in the time interval between two adjacent baseline data time points (interval =
1T), and signinterval is the time interval between the time point of baseline data and the time
point of verification data (signinterval = 1t). The verification data is used to verify the compressed
data in each time interval to monitor the accuracy of the transmission process. Lcomp refers toCMC, 2021, vol.68, no.1 1437
the loss threshold value, in each time interval, only the difference between the value collected at
a certain time and the corresponding baseline data is greater the lcomp , will we record the value.
Fig. 3 shows the data compression and decompression processes. We use data matrix x ∗ m
to represent data to be compressed. x stands for categories of IoT devices, a certain type of IoT
device is represented by Cx , m is the number of time points with collected data, and Tm represents
S
a certain time point. In a data matrix, we define V as the data value, VTmS Cx represents the value
of data collected by IoT device Cx at time Tm , and superscript SS indicates the changing state of
the data value. If the data value changes compared with its baseline data of the same IoT device,
then S is incremented by 1 (S = S + 1), otherwise, the value S remains unchanged. Assume that
data compression is conducted in each time interval 1T with n collected raw data, and each 1T
contains only one baseline data (the first data in each 1T) and one verification data which is
selected randomly in 1t (1 < 1t1438 CMC, 2021, vol.68, no.1
baseline data and verification data are required. So, the compressed data consists of three parts:
the baseline data list, the verification data list and the difference list. The final data reduction rate
(DRR) can be defined as:
m
3 × N (diff ) + 2d ∆T xe
DRR = 1 − , (9)
m×x
where N denotes the function to calculate the number of differences. It can be simplified as:
3 × N (diff )
2
DRR = 1 − + . (10)
m×x ∆T
We can conclude that when m is large enough and the difference num N (diff ) > 31 mx, the
compression effect will not be achieved. So the applicable condition of the algorithm is that
the data fluctuation is less than 13 mx. DRR and Lcomp are closely related, and ASC participants
can set Lcomp according to the desired data reduction effect and storage demand. For example,
users need to set a lower lcomp value for critical data to guarantee the accuracy of sustainability
calculation. For non-critical data, without affecting sustainability assessments, a higher lcomp value
can be set to save storage space as much as possible. Meanwhile, when m data arrive, DRR
can be calculated by segments. Moreover, the data compression rate (controlled by the lcomp
value) can be adjusted according to the importance levels of the data. The flexibility of setting
different lcomp values for different kinds of data helps to save resources and improve efficiency
dramatically. The decompression process is also depicted in Fig. 3 and it is worth mentioning
that the decompressed data can be verified with verification data list recorded in the compression
process. In the calculation process, only the difference between the data at each time point and
the baseline data needs to be calculated. The categories of IoT device x are limited and m
is defined as the number of time points with collected data above. Thus, when m approaches
infinity, the computational complexity of the compression is O (m). As for the decompression
process, when data arrives, the original data can be restored by summing baseline data and diff in
m
compressed data. Besides, the data verification process will also be carried out ∆T times and the
m
total time cost is m + ∆T . Therefore, when m approaches infinity, the computational complexity
of the decompression is O (m). In application scenarios, the cost of calculation is estimated to be
equivalent to m times of simple subtraction calculations. The number of times of data generation
is the number of times we need to calculate, so the time cost is acceptable here.
The compressed data then is uploaded to the Subchain. To guarantee security, we introduce
Verifiable Random Function (VRF) to encrypt the compressed data. VRF is equivalent to random
oracle adding non-interactive zero-knowledge proof functionally. When sending data locally, nodes
can add random information through VRF, and other nodes can verify the selected results accord-
ing to the public information including random number, proof and public key. The consensus
process of the Subchain is as follows. Firstly, the IoT nodes generate data requests. The original
raw data should be compressed first, and the compressed data should be combined with VRF
generated random information to ensure the security of data. Secondly, the information will be
broadcasted to all key nodes. Thirdly, calculating the reputation of all key nodes through the rules
defined in advance, to select the accounting node. Fourthly, the accounting node calculates the
hash value of the block and sends the result to other nodes for verification. In the last step, the
other nodes will send correct messages to each other after verification. When each node receives
confirm messages from more than 23 of the total nodes, the key nodes update this block. Block
building in Subchain is shown in Algorithm 2.CMC, 2021, vol.68, no.1 1439
Algorithm 2: Block building in Subchain
Input: auditing[ ], non-key nodes[ ], keynodes[ ]
Output: Block of Result of verification[ ], the value of the hash block
1: function BLOCK BUILDING(auditing[ ],non-keynodes[ ],keynodes[])
2: for i ∈ non-keynode[ ]do
3: for j ∈ auditing[ ] do
4: if check(j) = false thenthen
5: send the error to nodes in keynodes[ ]
6: else
7: send confirm to nodes in keynodes[ ]
8: end if
9: end for
10: end for
11: if number of confirm >= 2/3 ∗ non-key nodes[].length then
12: generate a block
13: generate the value of the hash block
14: broadcast block
15: send the value of hash block to Ri
16 end if
17: end function
The input of Algorithm 2 includes three arrays, which are a set of data to be verified, a set
of key nodes and a set of non-key nodes. The non-key nodes verify the data audited by the key
nodes. If it is correct, every non-key node will return a positive signal to the key nodes. Otherwise,
the non-key nodes will return negative signals. When a transaction occurs, the required data are
sent to the key nodes of the government regulatory departments firstly. Similar to the Mainchain,
the block of data in the Subchain includes the Header and the Body. However, The Body in the
Subchain block contains all verified information records about the product, transportation and
the environmental impacts.
To monitor and encourage farmers and enterprises in the Subchain, tokens can be issued as
incentives. For farmers, conducting environmentally friendly practices has several benefits. First,
land productivity and profitability can be recorded by technology. Second, tokens gained from
sustainable production can be used to apply for agricultural insurance and tax benefits. Third,
farmers can enhance their bargaining power. Through controllable IT implementation, enterprises
can ensure the transparency of data along supply chains. The way to obtain tokens in the
Subchain is to record and analyze the data from IoT devices.
3.3 Performance Optimization
In sustainable ASCs scenarios, there are three indicators to be focused on: the throughput R
of the model, the latency T L of tasks and the cost P of tasks. The throughput is influenced by
the number and size of the transactions initiated by clients, and the scale of the block. If the
block can accommodate all the transactions, the throughput equals to the number of transactions.
If not, the actual throughput is the biggest quantity that the block can accommodate. Here, we
use ri to represent the number of the transactions that the client i initiates and use ηj to present1440 CMC, 2021, vol.68, no.1
the corresponding size. η is the average transaction size and sB is the size of a block. Then, R
can be described as:
i ri ηj ≤ sB
P P
i ri ,
R = sB . (11)
else
η
And the latency T L contains two parts: the block interval T I and the consumed time T C .
Thus, the latency can be calculated as:
TL = TI + TC, (12)
where TI is a variable value defined by the model. TC is determined by the compression time
T Comp , the algorithm calculation time T A and the size sB . And we can conclude that
T C = T Comp + T A + J (sB ) , (13)
where J denotes the waiting time calculation process of the transaction when sB changes. The cost
P mainly contains the calculation cost PC , the storage cost PS and P C
power cost P . P and P
P
I I
are determined by sB and T , which can be depicted as H sB , T . Therefore P is explained as:
X
P = H sB , T I + sB . (14)
In the experiment, we expect to make the throughput R greater and reduce T L and P. Thus,
the objective function can be defined as:
F obj = max R − T L − P R − T L − P . (15)
And if we use the original variable, it can be calculated as:
F obj = max G (sB , ri ) − I T I , sB , T Comp − E T I , sB , (16)
where G is the calculation function of R, I refers to the process of T L and E denotes the
calculation process of P. To get the optimal solution of the function, we use simulated annealing
algorithm [23]. Regarding timing choice, different optimization methods are used for different data
streams in the sustainable ASC scenario. The amount of data is relatively small on the Mainchain
and the generation of data has a relatively long periodicity. Therefore, offline optimization is more
applicable and only the data generated in one cycle should be considered. However, the amount
of data is relatively large on the Subchain and the data is constantly generated, so real-time
optimization is more desirable. To achieve real-time optimization, a certain time interval needs to
be set, and the parameters in the current time interval are used to optimize the parameters of the
next time interval. When the time interval is small enough, the effect of real-time optimization
can be achieved. The simulation result is depicted in Section 4.
4 Simulation and Evaluation
To verify the applicability and superiority of the double-chain structure in ASCs to improve
sustainability, several experimental schemes are designed and simulated by OMNeT++ (an open-
source software). The performance and cost of the double-chain and the single-chain structuresCMC, 2021, vol.68, no.1 1441
are evaluated and compared in term of latency of transaction confirmations, cost of unit latencies,
throughput, and throughput per unit cost.
Based on the main data flows in sustainable ASCs, the experiment divides the practical
agricultural application into three business scenarios: an IoT scenario that contains only IoT
data flows, an ASC scenario that contains only ASC transaction flows, and a hybrid scenario
that contains both IoT and ASC data flows. In different application scenarios, there are some
differences in performance and cost between a single chain and double chain structures. To study
these differences, three blockchain structures have been designed, including two single chains
and one double chain. One single chain (single-I) is set for IoT scenarios, and the other single
chain (single-E) is for ASC scenarios. Double-chain has two chains that can accommodate both
IoT and ASC scenarios. The performance and cost of the three chains were recorded under
the three scenarios. The performance metrics include transaction latency and throughput, and
cost metrics include cost per latency and throughput per unit cost. Moreover, we conduct a
throughput comparison of the system under different data reduction rate (DRR) and different
adaptive settings (flexibility of block size and block interval).
4.1 Parameter Descriptions
In different application scenarios, there will be differences in performance and costs between
the single chains and the double chain, as well as between the different single chains. OMNeT++
is used to simulate the communication of an IoT device in the process from transaction generation
in the actual environment to the final confirmation and encapsulation in the block by a consensus
algorithm. The transaction confirmation latency, throughput, and cost are recorded for different
scenarios. Finally, through the Matplotlib library, the recorded data are visualized for analysis.
The simulation setup parameters are shown in Tab. 1.
Table 1: Simulation setup parameters
Environment configuration Operating system Windows 10
RAM 16 GB
Processor Inter(R) Core (TM) i7-10710U
Parameters Block scale Storage cost/block size
Latency Latency of the transaction confirmation
Cost per latency Cost of unit latency
Throughput Number of transaction confirmations per unit time
Throughput per cost Throughput per unit cost
Performance affects the usability of the system, while cost consumption affects the scalability
of the system. Assessing the sustainability of a system requires consideration of both performance
and cost. An evaluation of these indicators can help achieve the lowest cost under a given
performance demand to realize the sustainable development of agriculture.
4.2 Analysis and Discussion of the Experimental Results
Fig. 4 shows the throughput comparison of the system under different DRR and different
adaptive settings. The adaptive system includes three kinds of adaptive settings: 1) adjustable block
size and interval; 2) fixed block size; 3) fixed block interval. In Fig. 4a, DRR = 80% represents
80% compression on the original data and so on. So larger DRR figure indicates higher data1442 CMC, 2021, vol.68, no.1
reduction. Under the same block resource cost, the higher the DRR is, the greater the throughput
is. This is because the greater the data reduction, the more the transaction data can be stored
with the same block resource cost. At the same time, the higher the data, the faster the curve
levels off, allowing the resulting transactions to be linked up in real-time. Data reduction removes
data redundancy, resulting in greater data capacity for the same storage cost, that is, increased
throughput. But the greater the data reduction, the longer the data recovery time and the higher
the system cost. After all the curves in the figure have levelled off, the lower the percentage, that is,
the higher the data reduction, the higher the cost. In practical applications, business requirements
and costs should be considered at the same time. To satisfy these requirements, an appropriate
data reduction ratio should be selected to minimize the cost.
Figure 4: Comparison of the system under different DRR and adaptive settings (a) Throughput
of different data reduction rates (b) Throughput of different adaptive settings
In Fig. 4b, the adaptive system in which both block size and block interval are adjustable can
always meet throughput requirements. When the transaction rate is high, the system with fixed
block-size will experience congestion and throughput decline after the block interval reaches the
regulated limit. The system with fixed block-interval can adjust the block size to meet the through-
put requirements, but too large the block size will increase the cost and delay, so the throughput
performance is not as good as that of the system with adjustable size and interval. The higher
the DRR, the more data the block can contain at the same storage cost. Regarding when to do
data reduction, data reduction is needed when the system needs to get rid of congestion quickly,
or when the same block scale needs more throughput. In this case, the larger the DRR is, the
faster it gets rid of congestion, and the larger the throughput is under the same block scale. As
for the time cost of data reduction, under the same block scale, the higher the DRR, the greater
the throughput. But the higher the DRR, the more time it takes to compress and decompress.
This will lead to the increase of system delay. Therefore, it is necessary to select the appropriate
DRR to meet the throughput requirements while maintaining the delay in an acceptable range.
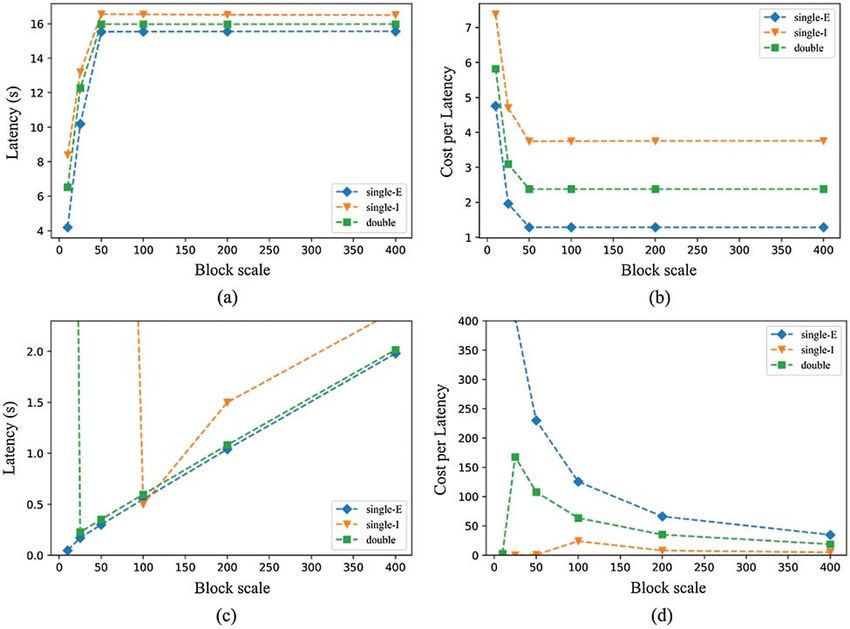
Fig. 5 shows a comparison of different chain structures in the ASC and IoT scenarios.
The ASC scenario only contains transactions among ASC participants and the IoT scenario
only contains IoT data flows. To achieve optimal performance and minimize cost, performance
optimization is used to obtain optimal results. Figs. 5a and 5b correspond to the ASC scenario,CMC, 2021, vol.68, no.1 1443 and Figs. 5c and 5d correspond to the IoT scenario. In Fig. 5a, there is no congestion in the three chains, and the enterprise single-chain (single-E) latency is the smallest. The IoT single-chain (single-I) consensus algorithm has the longest execution time and the largest latency, while the latency of the double chain lies in the middle. In Fig. 5b, since the enterprise single-chain is designed for the ASC scenario, it has the lowest cost. The IoT single-chain costs more in the IoT scenarios than in the ASC scenarios. The cost of the double chain is moderate. Fig. 5c indicates that in the case of low block resource cost, the single-chain for enterprises does not suffer from congestion, while the single-chain for IoT does suffer from congestion. The total latency in the double-chain lies between those of the two single chains. In Fig. 5d, the cost of the IoT single- chain is the lowest, the cost of the enterprise single-chain is the highest, and the cost of the double-chain is moderate. For every single type of transaction only scenario, the corresponding single-chain performs better in terms of latency and cost, while the double-chain is in the middle. Figure 5: Comparison of different chain structures in the ASC and IoT scenarios (a) Latency in different chains (b) Cost of different chains (c) Latency in different chains (d) Cost of different chains
1444                                                                      CMC, 2021, vol.68, no.1

    Fig. 6 shows a performance and latency comparison of different chains under the sustainable
ASC scenario (a mixed scenario combining transactions with IoT data). The goal is to maximize
throughput and minimize latency and cost through performance optimization. In this hybrid
scenario, both ASC and IoT transactions occur.

Figure 6: Comparison of different chains in the sustainable ASC scenario (a) Latency in different
chains (b) Cost of different chains (c) Throughput of different chains (d) Throughput per unit
cost of different chains

    In Fig. 6a, the enterprise has low single-chain latency and no congestion. The IoT single-
chain has significant latencies in processing IoT transactions, causing congestion in the system.
Therefore, the total latency of the double chain lies between the two single chains. In Fig. 6b,
IoT single-chain transactions have the lowest costs when processing IoT transactions but the
highest costs when processing ASC transactions as well as enterprise single-chain transactions.
The double chain uses two mechanisms at the same time, and its cost is relatively moderate when
processing both transactions, so the unit latency cost is the lowest when the system eliminates
congestion. In Fig. 6c, the enterprise single-chain can always maintain high throughput. The IoT
single-chain throughput starts small and then increases due to the long execution time of the
consensus algorithm. The Subchain in the double chain has large latencies that cause congestion
CMC, 2021, vol.68, no.1 1445
at the beginning, affecting performance. However, after eliminating the congestion, the two parts
of the double chain adapt to the two scenarios, so the throughput of the double chain gradually
increases. In Fig. 6d, the cost of the double chain is relatively moderate for both transactions, so
the throughput of the unit cost is the highest once the system eliminates congestion.
For performance optimization, the double chain in the sustainable ASC scenario meets the
performance requirements, and its implementation cost is the lowest. In the ASC transaction
only or IoT transaction only scenarios, the performance and cost of a double-chain are in
between the two corresponding single-chains. However, in a sustainable ASC scenario, although
the performance of the double chain is moderate, its cost is the lowest, allowing it to achieve
comprehensively optimal performance and cost. Therefore, in the sustainable ASC scenario, the
double-chain scheme can meet the performance requirements, making the cost minimum.
5 Conclusion
The combination of blockchain and Internet of Things technologies not only provides trans-
parent solutions for the traditional agricultural supply chain but also provides opportunities to
support progress and innovation through sustainable management tools and methods. Concerning
the challenges related to transparency, data collection and data sharing in sustainable development,
this paper explores sustainable management in ASCs. Addressing the current situation of low-level
farmer informatizationand inadequate government supervision about sustainable goals, a double-
chain structure with low energy consumption is designed to achieve the sustainability management
of the entire supply chain and promote value creation in the life cycle of agricultural products.
Finally, the proposed technical scheme is evaluated through simulation and the performances
of different implementation scales are analysed. The future work is to develop more accurate
technical solutions for the double-chain application in different scenarios.
Acknowledgement: Thanks for the environment provided by laboratory ICN&CAD of School of
Electronic Engineering.
Funding Statement: This study was funded by the project of the National Natural Science
Foundation of China [Grant Numbers 62071056].
Conflicts of Interest: The authors declare that they have no conflicts of interest to report regarding
the present study.
References
[1] J. Poore and T. Nemecek, “Reducing food’s environmental impacts through producers and consumers,”
Science, vol. 360, no. 6392, pp. 987–992, 2018.
[2] S. S. Kamble, A. Gunasekaran and S. A. Gawankar, “Achieving sustainable performance in a data–
driven agriculture supply chain: A review for research and applications,” International Journal of
Production Economics, vol. 219, no. 1, pp. 179–194, 2020.
[3] V. G. Venkatesh, K. Kang, B. Wang, R. Y. Zhong and A. Zhang, “System architecture for blockchain
based transparency of supply chain social sustainability,” Robotics and Computer-Integrated Manufactur-
ing, vol. 63, no. 101896, pp. 1–9, 2020.
[4] M. Lezoche, J. E. Hernandez, M. M. E. A. Díaz, H. Panetto and J. Kacprzyk, “Agri-food 4.0: A
survey of the supply chains and technologies for the future agriculture,” Computers in Industry, vol. 117,
no. 103187, pp. 1–15, 2020.
[5] J. Liu, X. Sun and K. Song, “A food traceability framework based on permissioned blockchain,”
Journal of Cyber Security, vol. 2, no. 2, pp. 107–113, 2020.1446 CMC, 2021, vol.68, no.1
[6] S. Hayrutdinov, M. S. R. Saeed and A. Rajapov, “Coordination of supply chain under blockchain
system-based product lifecycle information sharing effort,” Journal of Advanced Transportation, vol. 2020,
no. 1, pp. 1–10, 2020.
[7] L. Hughes, Y. K. Dwivedi, S. K. Misra, N. P. Rana, V. Raghavan et al., “Blockchain research,
practice and policy: Applications, benefits, limitations, emerging research themes and research agenda,”
International Journal of Information Management, vol. 49, no. 1, pp. 114–129, 2019.
[8] A. Zhang, R. Y. Zhong, M. Farooque, K. Kang and V. G. Venkatesh, “Blockchain-based life
cycle assessment: An implementation framework and system architecture,” Resources Conservation and
Recycling, vol. 152, no. 104512, pp. 1–11, 2020.
[9] M. Jouini, J. Burte, Y. Biard, N. Benaissa, H. Amara et al., “A framework for coupling a participatory
approach and life cycle assessment for public decision-making in rural territory management,” Science
of the Total Environment, vol. 655, no. 1, pp. 1017–1027, 2019.
[10] R. Sharma, S. S. Kamble, A. Gunasekaran, V. Kumar and A. Kumar, “A systematic literature review
on machine learning applications for sustainable agriculture supply chain performance,” Computers and
Operations Research, vol. 1, no. 104926, pp. 1–47, 2020.
[11] B. L. Nguyen, E. L. Lydia, M. Elhoseny, I. V. Pustokhina, D. A. Pustokhin et al., “Privacy preserving
blockchain technique to achieve secure and reliable sharing of IoT data,” Computers, Materials &
Continua, vol. 65, no. 1, pp. 87–107, 2020.
[12] J. Wang, W. Chen, L. Wang, R. Simon Sherratt, O. Alfarraj et al., “Data secure storage mechanism
of sensor networks based on blockchain,” Computers, Materials and Continua, vol. 65, no. 3, pp. 2365–
2384, 2020.
[13] B. Bordel, R. Alcarria, D. Martin and A. Sanchez-Picot, “Trust provision in the internet of things
using transversal blockchain networks,” Intelligent Automation & Soft Computing, vol. 25, no. 1, pp. 155–
170, 2019.
[14] J. Lin, Z. Shen, A. Zhang and Y. Chai, “Blockchain and IoT based food traceability for smart
agriculture,” in Proc. ICCSE, Singapore, pp. 1–6, 2018.
[15] M. S. Devi, R. Suguna, A. S. Joshi and R. A. Bagate, “Design of IoT blockchain based smart
agriculture for enlightening safety and security,” Proc. ICETCE, vol. 985, no. 1, pp. 7–19, 2019.
[16] C. Li, G. Xu, Y. Chen, H. Ahmad and J. Li, “A new anti-quantum proxy blind signature for
blockchain-enabled internet of things,” Computers, Materials & Continua, vol. 61, no. 2, pp. 711–
726, 2019.
[17] Z. Liu and Z. Li, “A blockchain-based framework of cross-border e-commerce supply chain,” Interna-
tional Journal of Information Management, vol. 52, no. 102059, pp. 1–18, 2020.
[18] D. Bumblauskas, A. Mann, B. Dugan and J. Rittmer, “A blockchain use case in food distribution:
Do you know where your food has been?,” International Journal of Information Management, vol. 52,
no. 102008, pp. 1–10, 2020.
[19] S. H. Awan, S. Ahmed, N. Safwan, Z. Najam, M. Z. Hashim et al., “Role of internet of things (IoT)
with blockchain technology for the development of smart farming,” Journal of Mechanics of Continua
and Mathematical Sciences, vol. 14, no. 5, pp. 170–188, 2019.
[20] Y. Wei, F. R. Yu, M. Song and Z. Han, “Joint optimization of caching, computing, and radio resources
for fog-enabled IoT using natural actor-critic deep reinforcement learning,” IEEE Internet of Things
Journal, vol. 6, no. 2, pp. 2061–2073, 2019.
[21] R. S. Alonso, I. Sittón-Candanedo, Ó. García, J. Prieto and S. Rodríguez-González, “An intelligent
Edge-IoT platform for monitoring livestock and crops in a dairy farming scenario,” Ad Hoc Networks,
vol. 98, no. 102047, pp. 1–23, 2020.
[22] A. Arena, A. Bianchini, P. Perazzo, C. Vallati and G. Dini, “BRUSCHETTA: An IoT blockchain-based
framework for certifying extra virgin olive oil supply chain,” in Proc. SMARTCOMP, Washington, DC,
USA, pp. 173–179, 2019.
[23] K. A. Dowsland, J. M. Thompson and S. Annealing, Handbook of Natural Computing, Heidelberg,
Berlin, Germany: Springer, 2012.You can also read