Assessing the Environmental Potential of Collaborative Consumption: Peer-to-Peer Product Sharing in Hammarby Sjöstad, Sweden - MDPI
←
→
Page content transcription
If your browser does not render page correctly, please read the page content below
sustainability

Article
Assessing the Environmental Potential of
Collaborative Consumption: Peer-to-Peer Product
Sharing in Hammarby Sjöstad, Sweden
Michael Martin 1, * , David Lazarevic 2 and Charlie Gullström 3
 1   LCA and Environmental Management, IVL Swedish Environmental Research Institute, Valhallavägen 81,
     114 28 Stockholm, Sweden
 2   Environmental Policy Centre, Finnish Environment Institute SYKE, PL 140, 00251 Helsinki, Finland;
     David.Lazarevic@ymparisto.fi
 3   Department of Architecture, KTH-Royal Institute of Technology, Osquars backe 9, 114 28 Stockholm,
     Sweden; charlie.gullstrom@arch.kth.se
 *   Correspondence: michael.martin@ivl.se; Tel.: +46-10-788-66-81

 Received: 5 November 2018; Accepted: 21 December 2018; Published: 2 January 2019

 Abstract: Collaborative consumption—through sharing services—has been promoted as an important
 step in transforming current consumption patterns toward more sustainable practices. Whilst there
 are high expectations for sharing services, there are few studies on the potential environmental
 benefits and impacts of sharing services. This study aims to analyze the potential environmental
 impacts of a peer-to-peer (P2P) product sharing platform and potential integration with a package
 drop-off/pick-up service in the urban district of Hammarby Sjöstad, Stockholm, Sweden. A life
 cycle approach is adopted, taking into account product lifetime and use, the potential replacement
 of conventional products and services, impacts from digital infrastructure and their impacts on the
 environment. The results indicate that there is significant potential for these sharing services to reduce
 environmental impacts associated with production and consumption; primarily through avoiding
 production and reducing the production impacts of new product purchases. The results also illustrate
 potential synergies to integrate with the package drop-off/pick up service; where the impacts from
 shared products are further reduced by reducing transportation impacts through improved logistics.
 However, the results are dependent upon, and sensitive to, a number of methodological choices and
 assumptions; highlighting the need for greater knowledge on the use environmental assessments of
 sharing services.

 Keywords: collaborative consumption; sharing economy; life cycle assessment (LCA); peer-to-peer
 (P2P), sharing platform; environmental impacts; sustainability

1. Introduction
     The sharing economy—also referred to as collaborative consumption—is a broad umbrella
construct [1,2] that represents different forms of coordinated “sharing, bartering, lending, trading,
renting, gifting, and swapping” [3] (p. xv). Normative expectations for the sharing economy range
from its role in a post-capitalist zero marginal cost society that will overthrow capitalism [4], to a
nightmarish form of neoliberal capitalism [5].
     The sharing economy is often framed as a more sustainable form of consumption [5]; presenting
“a new pathway to sustainability” [6] (p. 228). In this framing, the environmental and social impacts
from the unsustainable consumption of goods and services [7] are addressed through a “new and
sustainable form of consumption based on individuals accessing rather owning resources” [5] (p. 154).
Indeed, Böcker and Meelen [8] reveal that environmental reasons rank as the greatest motivation for

Sustainability 2019, 11, 190; doi:10.3390/su11010190                    www.mdpi.com/journal/sustainability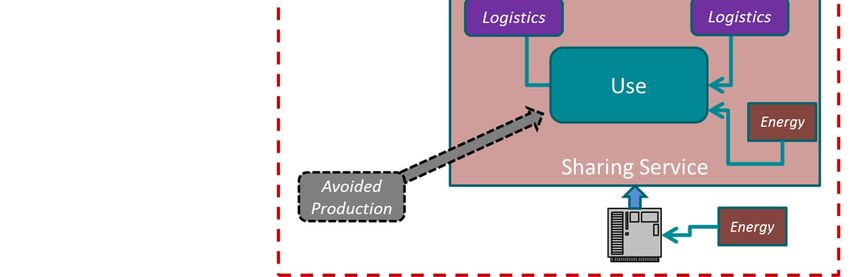
Sustainability 2019, 11, 190 2 of 19
people to engage in car and ride-sharing and it is the primary motivation for women to engage in
collaborative consumption.
There is an intuitive environmental logic of the sharing economy. The production of goods
is energy and material intensive and the source of significant environmental damage. By sharing
goods—based on either reciprocity or market transitions—the environmental impacts of primary
production are avoided, scare resources are preserved and residual waste to landfill is minimized.
However, given the increasing amount of literature on business models for the sharing economy [9],
there are a limited number of studies that compare the environmental impacts of the sharing economy
to conventional modes of consumption.
The environmental impacts of the collaborative consumption are complex. Studies have investigated
the environmental dimension of the sharing economy in the areas of transportation (e.g., [10,11]),
clothing (e.g., [12,13]), housing/accommodation (e.g., [14,15]), within households (e.g., [16,17]) and
consumer goods (e.g., [18,19]). However, the potential drawbacks of the sharing economy have
also been highlighted. For instance, Clewlow and Mishra [20] have shown that the introduction of
ride-sharing can increase congestion and divert commuters from public transport systems, and Briceno
et al. [21] have demonstrated that if rebound expenditure from car-sharing was spent on air
travel, car-sharing would have higher overall emissions than conventional car-ownership. In the
industrial ecology field, analogous approaches, such as product-service systems have also been
reviewed. For example, Agrawal et al. [22] have found that leasing products are not necessarily more
environmentally friendly than purchasing. Furthermore, rebound effects that negate the positive
benefits of sharing from have been highlighted [12,17,23].
In recent years, product sharing via peer-to-peer (P2P) platforms is becoming increasingly
available, through a number of initiatives, e.g., sharing services, boards, physical events, etc.; often
promoted as an approach to improve sustainability of consumptive patterns in urban areas [24].
Hence, whilst the sharing economy is promoted as a more environmentally friendly option, it is
becoming ever more important to understand the environmental implications of collaborative
consumption. However, there is a lack of detailed studies that consider the environmental impacts
of P2P platform-coordinated product sharing. In order to review the environmental implications of
the sharing economy, environmental systems analysis tools may be required to capture the potential
benefits and trade-offs of P2P platforms from a life cycle perspective. Life cycle assessment (LCA)
can be utilized to assess the potential environmental impacts and resource use of a product/service
throughout out its life cycle; i.e. from raw material extraction, via production and use phases, to waste
management and transportation along the way [25]. Again, however, P2P sharing between users is
complex, and few assessments have been made outside of mobility, housing and clothing sectors,
with no methodological guidelines available in the literature for guiding the assessments; and a limited
set of studies to compare with.
The aim of this study is to outline methodological considerations for reviewing the environmental
performance of P2P services and to apply these methodological considerations to review a P2P service
in the urban district, Hammarby Sjöstad, of Stockholm to assess its potential. The sharing service
includes a P2P online platform and a supporting service for goods delivery and collection. The target
audience of the article is the scientific community and practitioners who seek methodological guidance
for understanding the environmental impacts of sharing services.
2. Methodology
The following sections outline the methodology employed in this article, the description of the
LCA goal and scope, and the studied P2P sharing platform and scenarios reviewed.
2.1. Methodology for Reviewing Environmental Impacts of Sharing Services
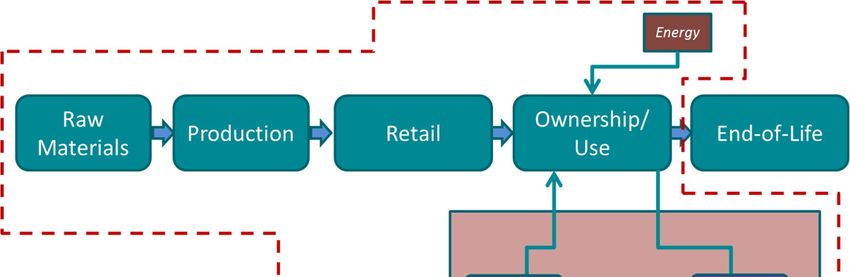
The potential environmental impacts associated with sharing services can occur at different phases
of a product’s life cycle; from the extraction of raw materials to the use of the product and final disposal.Sustainability 2019, 11, 190 3 of 19
Figure 1 depicts the different life cycle phases for a shared product using a sharing platform or service.
Impacts for the products include the raw materials and production impacts. Thereafter, the product is
made available
Sustainabilitydirectly, or through
2018, 11, x FOR PEER REVIEWretail operations, to the owner or user. Throughout 3this of 20process,
there are energy and transportation impacts. Unlike linear consumption patterns, the sharing of
productsThereafter,
alters the the product is made available directly, or through retail operations, to the owner or user.
use phase of the product by allowing the product to be available to be used by
Throughout this process, there are energy and transportation impacts. Unlike linear consumption
multiple users. The ownership phase can include, e.g., so-called “libraries” or private consumers
patterns, the sharing of products alters the use phase of the product by allowing the product to be
sharing available
goods (hereafter
to be used referred to users.
by multiple as providers) and includes
The ownership phase can e.g. the e.g.,
include, infrastructure and logistics
so-called “libraries” or for
the sharing platform
private consumersto besharing
functional.
goodsIn(hereafter
Figure 1,referred
this is depicted as the “loop”
to as providers) between
and includes e.g.the
theuse and
infrastructure
ownership phases. In and thelogistics for the sharing
assessment below, platform to be functional.
the end-of-life phase isInnot
Figure 1, this is depicted
considered, as
as the products
the “loop”
are assumed to bebetween the use
in use after and
the ownership
period phases. In the
of assessment, assessment
i.e., below, the end-of-life phase is
one year.
not considered, as the products are assumed to be in use after the period of assessment, i.e., one year.
Figure 1. Life cycle phases associated with a product being shared through a sharing service. The
Figure 1. Life cycle phases associated with a product being shared through a sharing service.
dashed line represents the system boundaries of the assessment.
The dashed line represents the system boundaries of the assessment.
The life cycle impacts from sharing services can be outlined using Equation 1 below, which
Theoutlines
life cycle theimpacts from sharing
overall impact servicesservice
of the sharing can be(Ioutlined
S), includingusing
the Equation 1 below,
impacts from which outlines
the product’s
the overall impact(Iof
production the sharing
P), retail service
(IR), shipping and(Ilogistics
S ), including
(IL), use the
(IU), impacts from the product’s
sharing infrastructure production
(ISI) and credits
for(Ipotential
(IP ), retail replacement
R ), shipping of products
and logistics (IL ),(Iuse
RP) due
(IUto
), avoided
sharingproduct purchases.
infrastructure (ISI ) and credits for potential
replacement of products (IRP ) due to avoided IS = IP + product
IR + IU + ILpurchases.
+ ISI + IRP (1)
The environmental impacts associated with a shared product (IP) include the environmental
IS = IP + IR + IU + IL + ISI + IRP (1)
impacts for the raw materials, production process and all associated energy and transportation
needed to produce the final product available for retail. Retail impacts (IR) can include all energy,
Theservices,
environmental impactsofassociated
and transportation the productswithuntil athe
shared
point ofproduct
sale. The(Iimpacts
P ) include
from the environmental
the use of the
impacts product
for the raw
(IU) vary between the different products and sharing services assessed; which can includeneeded
materials, production process and all associated energy and transportation
to produce theof,final
inputs e.g., product
energy and available for retail.
other materials. Retail
Impacts fromimpacts (IR )(Ican
the logistics include
L) include the all energy, services,
transportation
of the product from the provider to the user and back again, accounting for
and transportation of the products until the point of sale. The impacts from the use of the product (IU ) the transportation
distancethe
vary between anddifferent
mode. Impacts fromand
products the sharing
sharinginfrastructure (ISI) include
services assessed; whiche.g.,can
the include
impacts from the of, e.g.,
inputs
digital sharing platform (webpage, data traffic, use of mobile phone or computer to search and
energy and other materials. Impacts from the logistics (IL ) include the transportation of the product
rent/lend the product(s) and data storage) or any traditional infrastructure needed for sharing (e.g.,
from thesmall
provider
garagestoand thelocking
user and back again,
mechanisms). accounting
Finally, as sharing for the transportation
a product has the potentialdistance
to replaceand
the mode.
Impacts purchase
from theofsharing infrastructure (I
conventional products, impacts
SI ) include e.g., the impacts from the digital
from the replaced products (IRP) may also be included sharing platform
(webpage, data
where traffic, use of mobile phone or computer to search and rent/lend the product(s) and
relevant.
data storage) or any traditional infrastructure needed for sharing (e.g., small garages and locking
mechanisms). Finally, as sharing a product has the potential to replace the purchase of conventional
products, impacts from the replaced products (IRP ) may also be included where relevant.Sustainability 2019, 11, 190 4 of 19
For this study, the preceding life cycle approach was adopted to assess the environmental
impacts of sharing services compared to the conventional consumption of products. The goal of the
environmental assessment is to assess the impacts from sharing platforms, potential improvements and
important methodological considerations for reviewing sharing services and platforms. The functional
unit of the assessment is the annual sharing of products through the P2P product sharing platform
within the Hammarby Sjöstad urban area; see further information below.
In the assessment which follows, the environmental assessment is limited to greenhouse gas (GHG)
emissions, although the methodology outlined can include all other environmental impact categories
available in life cycle impact assessment (LCIA) methods. The GHG emissions were calculated based
on the GWP100 using CML 2015 LCIA methodology. All life cycle inventory (LCI) data is developed
from LCI databases such as Ecoinvent [26] and relevant data and input from literature. For products not
available from LCI databases, the methodology developed in Blocket [27] was followed to estimate the
GHG emissions for producing typical products shared. See Supplementary Materials and subsequent
text for further information.
2.2. Sharing Services in Hammarby Sjöstad, Stockholm
This study focuses on the use of a P2P sharing platform within the urban district of Hammarby
Sjöstad in Stockholm, Sweden; located on the southern edge of Stockholm with a population of
approximately 25,000 inhabitants. The district has long been a test-bed for the experimentation of
innovative environmental technologies and urban symbiosis strategies (see reference [28]). Recently
the district has become a test-bed for collaborative consumption, as part of the Sharing Cities
Sweden program that aims to develop sharing economy test-beds, sharing services and digital
solutions, and evaluate the opportunities and risks of the sharing economy. The sharing services
that will be developed in the test-beds relate to 1) the utilization of spaces (premises, housing, green
infrastructure, shared public space, etc.) and 2) the utilization of goods and services (tools, clothing,
toys, handicrafts, etc.).
This study is focused on the environmental potential of an online P2P sharing service provided
by the Swedish firm Hygglo (www.hygglo.se) in the outlined urban district. The services provided
by Hygglo allow for peer-to-peer sharing of products and services to allow for private individuals to
share products that are not used on a regular daily basis for a defined period agreed upon between
the provider and the user, where Hygglo facilitates the transactions between the user and provider.
Hygglo provides a large number of products, over 7000 listings annually (in 2017) with the largest
market in the metro Stockholm area. In this study, the environmental implications of this service
were reviewed only for the Hammary Sjöstad district and scenarios were created to review common
products currently shared to a baseline scenario where no products are shared. Further details on the
products shared and data collection from Hygglo are provided in the Sharing Scenario section below.
This article does not attempt to provide a review of the demographics of the region,
the implications of the sharing service on Hammarby Sjöstad residents, nor does it provide an account
for behavioral changes, etc. in the region; although the discussion section outlines such aspects which
may be important for further research. Hence, the study reviews only the potential of sharing services
by assuming they are increased and improved in the region.
2.3. Scenarios
In order to assess the implications of P2P collaborative consumption in the Hammarby Sjöstad
urban area, scenarios were developed to test a baseline and compare it to sharing, including different
assumptions. Thereafter, an integrated logistic service, using a locker sharing service, was added to
find the implications on the logistics and transportation impacts.Sustainability 2019, 11, 190 5 of 19
2.3.1. Baseline Scenario
Assuming that no sharing service was available, a baseline scenario was developed to show the
potential benefits of collaborative consumption. In this scenario, all products are purchased and used
by residents in the Hammarby Sjöstad area, with varying degrees of use during one year; see Table 1.
Table 1. Review of the baseline scenario.
Products Number Unit Number of Uses
Skis (Adult) 3 days 2
Skis (Children) 3 days 2
Electric Tool (w/o battery), e.g., table saw 20 min 20
Electric Tool (w/o battery), e.g., circle saw, drill 29 min 20
Electric Tool (w/battery), drill 20 min 20
Van 5 km 100
Car (Combi) 5 km 200
Car (Compact) 5 km 200
Video Game Unit 60 min 100
Bicycle 10 km 300
Cargo Bike 10 km 300
Cooking Equipment 150
2.3.2. Sharing Scenario
The review of the sharing scenario involves the Hygglo P2P platform that enables the collaborative
consumption of products [29]. In this study, the environmental impacts of this service were analyzed
for the sharing of products in the Hammarby Sjöstad urban district. Scenarios were developed to
analyze the most common products currently shared with a baseline where no products are shared.
Data for the most popular products shared and the product searches for Hammarby Sjöstad
residents was provided by Hygglo for the period of August 2017 to November 2017. Based on
the data provided, an extrapolation to an annual rental lineup of products was made in order to
understand the potential of sharing during a longer period. Table 2 outlines the annual rentals and the
products reviewed.
Table 2. Annual rentals.
Products Rentals Number of Listings
Skis (Adult) 132 44
Skis (Children) 132 44
Electric Tool (w/o battery), e.g., table saw 72 24
Electric Tool (w/o battery), e.g., circle saw, drill 12 4
Electric Tool (w/battery), drill 12 4
Van 10 3
Car (Combi) 24 8
Car (Compact) 10 3
Video Game Unit 12 4
Bicycle 48 16
Cargo Bike 12 4
Cooking Equipment 24 8
It was assumed that each product would be shared at least three times per year. Thus, the number
of products available (listings) is lower than the number of rentals. The following sub-sections provide
data and assumptions pertaining to transportation, use and product lifetime, sharing platform and
infrastructure and avoided products.Sustainability 2019, 11, 190 6 of 19
Transportation for Shared Products/Services
The products shared via the Hygglo platform are assumed to be transported within a short
distance from the provider to the user; a maximum distance of approximately 10 km based on a review
of available products in the region. The assumptions on transport mode and distance were included to
analyze the sensitivity of the transportation phase; see Table 3. This includes sensitivity to the choice
of “high-impact” transportation methods and “low-impact” transportation methods.
Table 3. Transportation of shared products for high and low transport assumptions.
High-Impact Transport Low-Impact Transport
Product
Mode km Mode km Mode km Mode km
Skis (Adult) Car 7 Bus 3 Bus 6 Bike/walk 4
Skis (Children) Car 7 Bus 3 Bus 6 Bike/walk 4
Electric Tool (w/o battery), e.g., table saw Car 7 Bus 3 Bus 6 Bike/walk 4
Electric Tool (w/o battery), e.g., circle saw, drill Car 7 Bus 3 Bus 6 Bike/walk 4
Electric Tool (w/battery), drill Car 7 Bus 3 Bus 6 Bike/walk 4
Van Car 7 Bus 3 Bus 6 Bike/walk 4
Car (Combi) Car 7 Bus 3 Bus 6 Bike/walk 4
Car (Compact) Car 7 Bus 3 Bus 6 Bike/walk 4
Video Game Unit Car 7 Bus 3 Bus 6 Bike/walk 4
Bicycle Car 7 Bus 3 Bus 6 Bike/walk 4
Cargo Bike Car 7 Bus 3 Bus 6 Bike/walk 4
Cooking Equipment Car 7 Bus 3 Bus 6 Bike/walk 4
Product Use and Lifetime
The use of the product, both by the provider and user, accounted for the varying characteristics
and impacts from different products, including e.g. seasons, energy use, etc.; see Table 4. Product
use in Hammarby Sjöstad was only considered to allow for a comparison with the reference scenario.
It was assumed that 40% of the products and only 20% of the vehicles (cars and vans) were available
in Hammarby Sjöstad. Thus, only this share of impacts from the use by providers was allocated to
the total impacts from the use phase in Hammarby Sjöstad; the sensitivity of this assumption was
also tested in the analysis. The assumptions are provided in high and low values to determine the
sensitivity of the use phase.
Table 4. Review of the number of uses (high and low assumptions) and respective details for different
products shared.
Provider Shared Number of uses (High) Shared Number of uses (Low)
Replaced Product/Serv
(Uses) User (Uses) Per Use Unit User (Uses) Per Use Unit
Skis (Adult) 1 5 - - 2 - -
Skis (Children) 1 5 - - 2 - -
Electric Tool (w/o battery), e.g., table saw 8 5 20 min 20 20 min
Electric Tool (w/o battery), e.g., circle saw, drill 8 5 20 min 20 20 min
Electric Tool (w/battery), drill 8 5 20 min 20 20 min
Van 20 5 5 km 100 5 km
Car (Combi) 40 5 5 km 200 5 km
Car (Compact) 40 5 5 km 200 5 km
Video Game Unit 40 5 60 min 100 60 min
Bicycle 120 5 20 km 300 20 km
Cargo Bike 120 5 20 km 300 20 km
Cooking Equipment 60 5 - - 150 - -
Note: This is only 40% of the provider uses.
The product lifetime was used to determine and allocate emissions to the product for the annual
use in the Hammarby Sjöstad area. The lifetime of the products was modeled to be the same in the
high and low scenarios; see Table 5.Sustainability 2019, 11, 190 7 of 19
Table 5. Lifetime of products.
Replaced Product Lifetime (Years)
Skis (Adult) 5
Skis (Children) 5
Electric Tool (w/o battery), e.g., table saw 5
Electric Tool (w/o battery), e.g., circle saw, drill 5
Electric Tool (w/battery), drill 5
Van 15
Car (Combi) 15
Car (Compact) 15
Video Game Unit 5
Bicycle 15
Cargo Bike 15
Cooking Equipment 4
Platform and Infrastructure for Sharing
The impact of the online sharing platform, e.g., data and energy use for searches, databases,
servers, were also considered. It is assumed that there were three searches per listing and that all the
products were shared several times. In order to include the impact of the sharing service platform,
electricity demand for data storage and search engine use was developed based on details provided
in [30–35] (see Supplementary Materials).
Replaced Products
As a consequence of the sharing platform, consumer behavior may be altered; i.e. the purchase of
certain products may be avoided or replaced by the sharing of products with the same functionality.
The assumptions for the proportion of products replaced by sharing are detailed in Table 6.
Table 6. Review of the number of replaced products due to sharing (high and low assumptions).
High Low
Replaced Product
Replace (%) Replaced Prods. Replace (%) Replaced Prods.
Skis (Adult) 50% 66 25% 33
Skis (Children) 50% 66 25% 33
Electric Tool (w/o battery), e.g., table saw 50% 36 25% 18
Electric Tool (w/o battery), e.g., circle saw, drill 50% 6 25% 3
Electric Tool (w/battery), drill 50% 6 25% 3
Van 1% 1 1% 1
Car (Combi) 11% 3 5% 1
Car (Compact) 11% 1 5% 1
Video Game Unit 50% 6 25% 3
Bicycle 50% 24 25% 12
Cargo Bike 50% 6 25% 3
Cooking Equipment 50% 12 25% 6
2.3.3. Integrated Scenario for Improved Logistics through the Sharing Locker Service
As the transportation of products between the provider and user have been found to have
a significant impact on the environmental performance of sharing products, the potential for the
improved logistics of product sharing was also reviewed through integration with a recently developed
digital locking and storage service (hereafter referred to as locker service) in Hammarby Sjöstad.
It is hoped that this locker service will improve package logistics and availability for P2P sharing.
Additional scenarios have therefore been included to assess the influence of such locker services,
including assumptions, on product sharing through the P2P platform.
For delivery and pick-up, the sender can put the package in a locker and register it with the service;
thereafter the recipient is notified through a mobile application, and the postbox, locker or room, can be
opened using the application or code. By providing such services, households and citizens can shareSustainability 2019, 11, 190 8 of 19
products among themselves, and logistics companies can deliver and pick-up packages with a reduced
number of delivery attempts. The sharing locker service can be used for the sharing of products;
as such the services were also reviewed in this assessment as a separate service and in integration with
the online sharing platform. This was done to understand the potential for reduced emissions and
transportation, first and foremost, from traditional package deliveries.
In order to review the potential of using this system, the review includes the use of the locker
services in all apartment buildings in Hammarby Sjöstad. Lockers, with several boxes, were anticipated
to be installed as new lockers in the apartment buildings; see Supplementary Materials for more details
on the assumptions for the locker service.
For the sharing services reviewed in the previous scenarios, it was assumed that all products
were shared personally between the user and provider. With the use of the locker services, traditional
logistics may be employed for the sharing of products between the user and provider. To determine
the implications of the service integration, all products shared through the online sharing platform in
the Hammarby Sjöstad district were modeled as employing the sharing lockers. This entails that the
products are placed in a sharing service locker, picked up by a logistics company and thereafter placed
in another locker.
Previous products reviewed, which may not be compatible with the locker services, e.g. cars, vans
and bikes, were not included in the assessment, as the review was focused only on products which
could fit in the lockers. As such, the assessment was dissimilar to the previous scenario reviewed
above, and not compared with these results. To compare with the previous P2P sharing scenario
(without the sharing of cars, vans and bikes) results were also extracted for the sharing of the remaining
products. In the integrated scenario, the transportation of the packages is altered to include pick-up
and delivery by logistic services and impacts.
A high and low transportation impact for the logistics was also tested; again, with a total distance
of 10 km. The high impact transportation (labeled Sharing Integ. Trans. Logistics) included picking up
the package by a conventional diesel vehicle (e.g. Bring or DHL), its distribution to a central logistics
center and delivery to the user by cargo bikes. The trip back to the provider was assumed to have the
same route. The package, therefore, is posted, picked-up, delivered, posted, and returned using the
sharing locker and logistics services.
In the near future, logistic services for the Hammarby Sjöstad urban district aim to use cargo bikes
services. As such, no impacts for transport were included for the use of the bikes, although there may
be impacts from storage and management of the operations. The low impact transportation scenario
(labeled Sharing Integ. Trans. Bike) included only logistics by cargo bikes.
Finally, as the integration may increase sharing due to the ease at which packages can be picked
up and dropped off, another scenario was included to review an increase in sharing. In this scenario,
the assessment includes twice as many products shared, given the same number of advertisements
and availability for sharing (labeled Sharing Integ. Incr. Sharing).
3. Results and Analysis
3.1. Online Sharing Platform
The sharing services platform showed significant GHG reduction potential compared to the
baseline scenario; see Figure 2. In the baseline scenario, the GHG emissions corresponded to roughly
22,000 kg CO2 -eq annually. The sharing scenarios, both high and low, showed emission reduction
corresponding to over 18,000 kg CO2 -eq. Impacts associated with goods production are reduced in
the sharing scenario, as there are fewer products in the system. The impacts from the use phase were
also found to decrease in the sharing scenarios, due to an overall reduction in use in the Hammarby
Sjöstad area. However, the impacts for the use of the products (including use outside of Hammarby
Sjöstad) may increase due to an increased total number of uses of the product (but again less than
the baseline scenario, see the analysis). The impacts from the digital infrastructure were found to beSustainability 2018, 11, x FOR PEER REVIEW 9 of 20
corresponding to over 18,000 kg CO2-eq. Impacts associated with goods production are reduced in
Sustainability 2019, 11, 190 9 of 19
the sharing scenario, as there are fewer products in the system. The impacts from the use phase were
also found to decrease in the sharing scenarios, due to an overall reduction in use in the Hammarby
Sjöstad area. However, the impacts for the use of the products (including use outside of Hammarby
nearly negligible
Sjöstad) for
maythe datadue
increase transmission, storage
to an increased total and
number of energy
uses of theuse for the
product (but searching, uploading
again less than the and
storing of information in the
baseline scenario, see sharing scenarios,
the analysis). andfrom
The impacts werethethus included
digital in thewere
infrastructure usefound
phase. Furthermore,
to be
as the studynearlyalsonegligible
reviewed forthe
the data transmission,
effects that the storage
sharing andofenergy use formay
products the searching,
have onuploading
avoidingand purchases of
storing of information in the sharing scenarios, and were thus included in the use phase.
similar products, the use of sharing services can lead to even larger benefits
Furthermore, as the study also reviewed the effects that the sharing of products may have on
(i.e. large credits) if the
replacement of products is also included. As such, in Figure 2, the “Total” indicator
avoiding purchases of similar products, the use of sharing services can lead to even larger benefits is the difference
between the (i.e.sum
largeof the impacts
credits) from use,
if the replacement production,
of products transport
is also included. As and
such, infrastructure and the credits
in Figure 2, the “Total”
indicator is the difference between the sum of the impacts from use, production, transport and
from avoided purchases.
infrastructure and the credits from avoided purchases.
25,000
20,000
Credits
kg CO2-eq annually
15,000
Transport
Infra
10,000
Use
Prod
5,000 Total
-
Baseline Sharing-High Sharing Low
-5,000
Figure 2. Annual emissions for the reviewed scenarios, including credits for avoided product
Figure 2. Annual emissions for the reviewed scenarios, including credits for avoided product purchases.
purchases.
Figure 3 illustrates the total
Figure 3 illustrates impacts
the total (split
impacts (splitonce again
once again into
into credits,
credits, transport,
transport, use, and production)
use, and production)
for the separate products. As shown, it was estimated that the largest
for the separate products. As shown, it was estimated that the largest impacts may be impacts may be due to the
dueuse
to the use of
of vehicles; which were also only rented a limited number of times. Electricipowered products, such
vehicles; which were also only rented a limited number of times. Electricipowered products, such as
as tools and video game units, displayed very small overall impacts. Due in part to the low number
tools and video gamerented.
of products units, Seedisplayed veryofsmall
further analysis overalltoimpacts.
the sensitivity assumptions Due in use
on the part of to
thethe low number of
products
products rented. See further
in subsequent sections. analysis of the sensitivity to assumptions on the use of the products in
subsequent sections.
Sustainability 2018, 11, x FOR PEER REVIEW 10 of 20
2,000.00
1,500.00
1,000.00 Replace
kg CO2-eq annually
Transport
500.00 Infra
Use
Product
0.00
Total
-500.00
-1,000.00
Figure 3. Emissions per product shared for Sharing-High scenario.
Figure 3. Emissions per product shared for Sharing-High scenario.
Additionally, Figure 4 illustrates the contribution of the different LCA phases to the overall
impact; highlighting the different inherent properties. While some products have little to no impact
on the use phase, others have high impacts during their use phase. Interestingly, for several products,
a large share of the GHG emissions are from the transportation of the product from the provider to
the user (e.g., those products with little to no emissions from the use phase, such as cooking
equipment and skis). Again, the use phase impacts of the vehicles are shown to be large in
comparison to the other products.Total
kg
-500.00
Sustainability 2019, 11, 190
-1,000.00 10 of 19
Additionally, FigureFigure 3. Emissions per product shared for Sharing-High scenario.
4 illustrates the contribution of the different LCA phases to the overall
impact; highlighting the different inherent
Additionally, Figure 4 illustrates theproperties. While
contribution some
of the products
different have little
LCA phases tooverall
to the no impact on
the use impact;
phase,highlighting
others have thehigh impacts
different during
inherent their While
properties. use phase. Interestingly,
some products fortoseveral
have little products,
no impact
a large share
on the of
usethe GHG
phase, emissions
others have high are from during
impacts the transportation ofInterestingly,
their use phase. the productfor from theproducts,
several provider to the
a large
user (e.g., share
those of the GHG
products withemissions
little to are
no from the transportation
emissions from the useof the product
phase, suchfromasthe provider
cooking to
equipment
the user (e.g., those products with little to no emissions from the use phase, such as cooking
and skis). Again, the use phase impacts of the vehicles are shown to be large in comparison to the
equipment and skis). Again, the use phase impacts of the vehicles are shown to be large in
other products.
comparison to the other products.
100%
90%
80% Transport
70%
60%
Infra
50%
40%
30% Use
20%
10%
Product
0%
Figure
Figure 4. 4. Contribution
Contribution of different
of different impact
impact categoriestotooverall
categories overall GHG
GHG emissions
emissionsper product
per shared
product shared for
for Sharing-High scenario.
Sharing-High scenario.
Sensitivity to Data and Methodological Choices
The following sub-sections review and analyze the sensitivity of assumptions used in the
comparisons; namely, the extent of replaced products, product lifetime, and transportation distance for
the shared products.
Replaced Products
As Figure 5 illustrates, increasing or decreasing the number of products replaced by 50%, can result
in large modifications in the overall annual impacts. When increasing the number of conventional
products replaced, shown in the Sharing-High Repl. +50% scenario, an overall decrease in emissions
of 42% is illustrated. Alternatively, for the Sharing-Low-Repl. −50% scenario, a minor increase in
emissions is illustrated.Replaced Products
As Figure 5 illustrates, increasing or decreasing the number of products replaced by 50%, can
result in large modifications in the overall annual impacts. When increasing the number of
conventional products replaced, shown in the Sharing-High Repl. +50% scenario, an overall decrease
Sustainability
in emissions2019, 11, 190
of 42% is illustrated. Alternatively, for the Sharing-Low-Repl. −50% scenario, a minor 11 of 19
increase in emissions is illustrated.
25,000
20,000
15,000
kg CO2-eq
10,000
Credits
5,000 Prod, Use, Trans
Total
-
-5,000
-10,000
Figure 5. Reviewing
Figure the sensitivity
5. Reviewing for choices
the sensitivity forinchoices
the number of replaced
in the numberproducts.
of replaced products.
Product Lifetime
Product Lifetime
In both the high-use and low-use sharing scenarios, the product lifetime of the shared products
In both the high-use and low-use sharing scenarios, the product lifetime of the shared products
was similar to the baseline scenario. However, in the sharing scenarios, the product lifetime may be
was similar to the baseline scenario. However, in the sharing scenarios, the product lifetime may
reduced, due to the exchanging of the products between different users. Thus, by extending the use
be reduced,
of the due
products, it isto the exchanging
important of the
to review the products
effect between
that this may have ondifferent users.
the overall Thus,
impacts. by extending the
For the
use of the
Sharing products,
High it is and
(Life) scenario important to review
Sharing Low thelifetime
(Life) the effectofthat
the this may
product washave on theand
decreased overall impacts.
increased
For by 30% respectively.
the Sharing High (Life)As Table 7 illustrates,
scenario and Sharing thereLow
is no(Life)
longerthe
a lower impact
lifetime offor theproduct
the sharing- was decreased
high increased
and scenario, asbythe30%production and use
respectively. impacts
As Table are increased,
7 illustrates, dueisprimarily
there no longertoaalower
lower impact for the
“denominator” for dividing the impacts per year, as the higher use scenario assumes a lower lifetime.
sharing-high scenario, as the production and use impacts are increased, due primarily to a lower
“denominator” for dividing the impacts per year, as the higher use scenario assumes a lower lifetime.
Table 7. Reviewing the influence of the lifetime for products in sharing scenarios (measured in kg
CO2 -eq emissions annually).
Phase Baseline Sharing-High Sharing-High (Life) Sharing-Low Sharing-Low (Life)
Production 11,200 3730 5330 3730 3880
Use 10,430 1000 1000 880 1000
Transport 240 1010 1010 120 120
Credits −2620 −3740 −1310 −2010
Total 21,870 3120 3600 3420 2990
Distance/Transportation
The influence of the transportation distance of the shared products to the environmental impacts
is also reviewed in Table 8. For the two scenarios, the transportation distance was increased by a
factor of 5. In the Sharing High (Trans.) scenario, the distance traveled was increased from 10 to
50 km roundtrip for products being shared by car and bus, and in the Sharing Low (Trans.) scenario,
the distance increased from 5 to 25 km by bus and walking. Additionally, in the Sharing Low (Trans.)
scenario, it was assumed that 90% of the travel would be done by bus.Sustainability 2019, 11, 190 12 of 19
Table 8. Reviewing the influence of transportation distance for sharing scenarios (measured in kg
CO2 -eq emissions annually).
Sharing-High Sharing-Low
Phase Baseline Sharing-High Sharing-Low
(Trans.) (Trans.)
Production 11,200 3730 3730 3730 3730
Use 10,430 1000 1000 880 880
Transport 240 1010 5040 120 290
Credits −2620 −2620 −1310 −1310
Total 21,870 3120 7150 3420 3590
As illustrated in Table 8, increasing the distance traveled for sharing products between users may
lead to increased GHG emissions. In the Sharing-High (Trans.) scenario, the total impacts are increased
by roughly 130%, while the transportation impacts being increased by over 400%. In the Sharing-Low
(Trans.) scenario, no significant increases in total impacts were illustrated (an increase of roughly 9%)
although there was an increase in transportation impacts of roughly 150%.
Use of the Products
In this study, impacts from the providers are also included; although this only included impacts for
those providers in Hammarby Sjöstad, which was assumed to be 40% of the products. The sensitivity
to this choice, including all impacts from users within and outside Hammarby Sjöstad, are reviewed in
Figure 6. The results illustrate that including the use by providers outside of the area may significantly
increase the environmental impacts. As such, the use phase adds to a large share of the impacts of the
products being shared compared to the Sharing-High and Sharing-Low scenarios, as outlined earlier.
Nonetheless, compared to the reference scenario, the emissions are still significantly lower.
Sustainability 2018, 11, x FOR PEER REVIEW 13 of 20
25,000
20,000
kg CO2-eq annually
15,000
Credits
Transport
10,000
Infra
Use
5,000
Prod
Total
-
-5,000
Figure
Figure 6. 6. Sensitivity
Sensitivity to theto use
the use
by by
thethe providers. Sharing
providers. Sharing High
High(sens) andand
(sens) Sharing-Low (sens) show
Sharing-Low (sens) show
inclusion of all impacts for use by providers (both providers within and outside of Hammarby
inclusion of all impacts for use by providers (both providers within and outside of Hammarby Sjöstad).
Sjöstad). Other sharing scenarios show only the impacts from use by providers in Hammarby Sjöstad.
Other sharing scenarios show only the impacts from use by providers in Hammarby Sjöstad.
3.2. Integration with Locker Services
3.2. Integration with Locker Services
Figure 7 illustrates that there is significant potential to reduce impacts from sharing services
Figure 7 illustrates
through integration that
of thethere is platform,
sharing significant potential
locker services,to reduce
and impacts
improved from sharing
transportation logistics.services
throughComparing
integrationtheof the sharing platform,
Sharing-Ref-High locker
scenario with theservices, and Def.
Sharing Integ. improved transportation
Logistics scenario, a largelogistics.
reduction
Comparing the in impacts from transportation
Sharing-Ref-High scenarioiswith
illustrated. This is due
the Sharing to theDef.
Integ. integration of using
Logistics sharing a large
scenario,
lockers and logistics services with the online sharing platform. Transportation emissions are
drastically reduced in the Sharing Integ. Trans Bike scenario, as all transports were modeled to take
place with cargo bikes. In the final scenario reviewed, Sharing Integ. Incr. Sharing, it was assumed
that an increase in sharing may be possible due to the ease at which packages can be picked up and
dropped off. Thus, there is a large potential to replace purchases of conventional products with the
same range of products available for sharing. As with the other scenarios, these may also be sensitive
to the choice of data and assumptions, although they are not reviewed again.Sustainability 2019, 11, 190 13 of 19
reduction in impacts from transportation is illustrated. This is due to the integration of using sharing
lockers and logistics services with the online sharing platform. Transportation emissions are drastically
reduced in the Sharing Integ. Trans Bike scenario, as all transports were modeled to take place with
cargo bikes. In the final scenario reviewed, Sharing Integ. Incr. Sharing, it was assumed that an
increase in sharing may be possible due to the ease at which packages can be picked up and dropped
off. Thus, there is a large potential to replace purchases of conventional products with the same range
of products available for sharing. As with the other scenarios, these may also be sensitive to the choice
of data and assumptions, although they are not reviewed again.
Sustainability 2018, 11, x FOR PEER REVIEW 14 of 20
5,000
4,000
3,000
2,000
Credits
kg CO2-eq annually
1,000 Infrastructure (Box)
Infrastructure (Digital)
- Transport
Use
-1,000 Prod
Total
-2,000
-3,000
-4,000
-5,000
Figure 7. Comparison of baseline impacts with sharing scenarios from Hygglo (Sharing-Ref) and with
Figure 7. Comparison of baseline impacts with sharing scenarios from Hygglo (Sharing-Ref) and with
Hygglo and QLocx integration (Sharing Integrated).
Hygglo and QLocx integration (Sharing Integrated).
4. Discussion
4. Discussion
The results presented show significant benefits from the use of sharing services compared to
Theconventional
results presented show
consumption andsignificant benefits
logistic methods. from
While the are
there usefew
of studies
sharingthatservices
assess compared
the
to conventional
environmentalconsumption
impacts fromand logistic
sharing methods.
services, While
the results therewith
correspond are several
few studies
previousthat assess the
studies
that analyze
environmental the impacts
impacts fromofsharing
sharing and logistics
services, [12,18,36,37].
the However, it with
results correspond shouldseveral
be notedprevious
that these studies
results could be over- or underestimations of the potential impact reductions,
that analyze the impacts of sharing and logistics [12,18,36,37]. However, it should be noted as the results are that
sensitive to the assumptions made for important methodological considerations, such as product
these results could be over- or underestimations of the potential impact reductions, as the results
impacts, avoided product purchases and transportation methods and distance; as reviewed in the
are sensitive to the
sensitivity assumptions
to choices above. made for important methodological considerations, such as product
impacts, avoided product purchases and transportation methods and distance; as reviewed in the
4.1. to
sensitivity Products andabove.
choices Avoided Purchases
As shown, significant changes in overall impacts are apparent when comparing the
4.1. Products and Avoided
consequences Purchases
of sharing to a baseline. The impacts of production contribute to a large share of the
As impacts
shown,insignificant
all scenarios; with significant emission reductions present when comparing baseline and
changes in overall impacts are apparent when comparing the consequences
sharing scenarios. The use of products, on the other hand, contributes to a relatively minor share of
of sharing to a baseline. The impacts of production contribute to a large share of the impacts in all
the overall impacts from the products being shared.
scenarios; with
The significant emissionthe
benefits of avoiding reductions present
purchase of when comparing
new products baseline
were illustrated andasharing
to have scenarios.
significant
influence on the results. When using system expansion methods, this choice, and ultimately the
system boundaries of the study, has a significant impact on the overall impact of the systems being
reviewed; see discussion on avoided impacts in the LCA literature [38–41]. However, few
assessments review the avoided impacts from sharing contrasted with conventional consumption
models [22,40]. Furthermore, while sharing services have the potential to avoid the purchase of newSustainability 2019, 11, 190 14 of 19
The use of products, on the other hand, contributes to a relatively minor share of the overall impacts
from the products being shared.
The benefits of avoiding the purchase of new products were illustrated to have a significant
influence on the results. When using system expansion methods, this choice, and ultimately the system
boundaries of the study, has a significant impact on the overall impact of the systems being reviewed;
see discussion on avoided impacts in the LCA literature [38–41]. However, few assessments review the
avoided impacts from sharing contrasted with conventional consumption models [22,40]. Furthermore,
while sharing services have the potential to avoid the purchase of new products, there is a lack of
studies in the literature documenting such behavioral changes, despite studies identifying the social
and economic motives for using sharing services [8,42,43].
4.2. Product Use and Lifetime
The results suggest that the use phase for many of the products contribute to a minor share of
impacts. Many of the products used had little to no impact from the use phase, as there was no material
or energy inputs for their use. For electrical products, this may be sensitive to the datasets used. As this
study was conducted in Sweden, the Ecoinvent dataset for Swedish electricity mix was used. However,
previous studies have shown sensitivity to the use of e.g. Nordic electricity mix data (see e.g., [44]).
Additionally, as identified in previous studies, many products designed with a long service life, rarely
are used to their potential [45]. As Kjaer et al. [40] suggest for research related to providing product
services, there are many challenges to assess the impacts from the use phase, as the products may
require maintenance and refurbishment; although the aforementioned study is not concerned with
P2P platforms, many parallels can be drawn to product-service system research.
4.3. Transportation and Integrating Services
The assumptions for the transportation of the products from the provider to the user also had a
significant influence on product sharing impacts; supporting the results of Leismann et al. [18] and
Zamani et al. [12]. While Zamani et al. [12] discuss the potential for postal service options for such
web-based sharing platforms, they were not reviewed. This study included transportation by car,
bus, bike and walking, and thereafter logistic services; which showed aa significant potential for
reduced GHG emissions through improved postal logistics; supporting the claims of Zamani et al. [12].
In the scientific literature, there is limited availability of such reviews. This study provides a unique
perspective for the potential of integrating sharing services. The results suggest that this could greatly
reduce the impacts from the online sharing platform, and potentially lead to increased sharing.
4.4. Impacts of Online Services
Although identified as a minor impact in this study, due to the limited geographical proximity
and volume of products shared, with an increase in web-based sharing platforms and services in the
future, it will be important to review the potential impacts created by the use of the web-based services
for data transfer, storage, etc. However, such concerns are insufficient in the literature. In a study
by Suckling and Lee [46], they found that the addition of phones, and their use of internet services,
will require more and more servers and data storage platforms in the future. At the time, they estimate
that the data usage of roughly 400 phones (based on data use at the time) per server would be required.
As Malmodin et al. [30] discuss, Sweden has the highest data traffic per capita in the world, and this
continues to increase. Nonetheless, as phones, servers, cloud services, etc. become increasingly efficient
and multi-functional, the review of such impacts may also provide an additional obstacle to overcome
in order to allocate impacts; see, e.g., [47]. van Loon [48] also reviews the impact of retail and suggests
that improvements may be needed to review the actual impacts occurring, not only from the use but
also from the rebound effects. Börjesson-Rivera et al. [49] suggest that available metrics for reviewing
the impacts from servers and the use of internet is difficult, and many available figures for carbon
emissions are very dissimilar.Sustainability 2019, 11, 190 15 of 19
In studies such as Blocket [27], internet use for users is not included, but the impacts for energy
use for the entire company (including servers) is included, as it was difficult to review other impacts.
It is important that such information is made more transparent (and included) in assessments to show
the impacts of internet-based sharing systems, as they are becoming more popular.
4.5. Sustainability and Rebound Effects
There are few assessments to review the actual implications of the sharing economy; and even
fewer reviewing systems that target the sharing of resources in P2P platforms (see e.g., [23]). Aside from
the discourse and speculations on the potential environmental improvements, the empirical evidence
is scarce and it is extremely challenging and complex to demonstrate the potential environmental
improvements at an aggregate level; see [50]. As such, first-order effects, such as those reviewed in
this study may be possible to review, but the net impact at an aggregated socio-economic level should
also be considered; see, e.g., [37].
While this study assumed that the availability of the sharing services may increase its use, and
the potential replacement of conventional products and processes in response, as Parguel et al. [23]
emphasize, the availability of P2P platforms may contribute to more indulgent consumption patterns.
This can transpire due to the money saved by sharing; which was found to be a primary driver for
users of sharing services [42]. If the additional wealth (saved) is instead spent on other energy or
carbon-intensive products or services, there may be an increase in environmental impacts. Many people
also engage in sharing, not only due to the environmental impacts, but the community, social and
economic benefits; see e.g., [8,42,43,51]. However, social and economic sustainability are rarely
addressed. There is, therefore, a need, and currently a lack of studies, for broader sustainability
assessments with the increased use of sharing services and other collaborative economy models [52].
4.6. System Boundaries and Data
The results of this study are largely reliant upon life cycle inventory data for the products and
logistics reviewed; which are currently lacking. As such, the project relies on data developed on the
basis of material specifications and other databases for representative data, e.g., Ecoinvent v. 3.3; which
may over- or underestimate the emissions from the products reviewed. However, the robustness of
such assessments would be improved with a broader range of product data.
Furthermore, this study does not handle the impacts from the waste handling of the products.
The downstream impacts may also be important to understand, given the potential for extending
the lifetime of products, in terms of uses; which is an important limitation to highlight. In future
assessments, it will be important to understand the implications this may have for a reduction in
potential material flows (i.e. circular material flows), energy recovery from waste incineration, etc.
The study also is limited to data provided from Hygglo on shared products and the listing for
the Hammarby Sjöstad region. As such, it may not represent, nor be applicable to other regions in
Stockholm; thus, leading to over or underestimations of the actual benefits from sharing if used in a
wider context.
5. Conclusions
This paper has provided an approach for quantifying the environmental performance of sharing
services using a life cycle assessment. For P2P services, this includes important factors such as the
production, use, product lifetime, logistics and transportation of products between user and provider,
digital sharing infrastructure, and avoided conventional products linked to the sharing of products.
Using the methodological considerations for the environmental assessment, the results of this
study indicate that there is a significant potential for sharing services to reduce environmental impacts
of consumption in the Hammarby Sjöstad urban district. The online P2P sharing platform can
promote reduced production impacts by avoiding new product purchases and extending the service
life of underutilized products in the area. Compared to the baseline scenario, over 18 tonnes ofSustainability 2019, 11, 190 16 of 19
CO2 -eq emissions can be reduced by sharing a limited number of products in the small urban area of
Hammarby Sjöstad using one P2P sharing platform.
The use the products shared was determined to have little influence on the results, except for
shared vehicles. The transportation of the products from provider to the user had a significant influence
on the results. The avoidance of product purchases illustrated significant performance improvement
potential, with assumptions of a high product avoidance leading to an additional 2 tonnes CO2 -eq
emissions reduction. The synergies with the locker service can also further reduce impacts of the
transportation of products between the provider and user. This is accomplished by providing an
increased availability for delivery and pick-up services to promote sharing through improved logistics.
Once again, however, and as reviewed in the analysis, the results are dependent upon a number of
assumptions and are sensitive to methodological choices made in the modeling, e.g., to transportation
methods of the products, the number of uses and avoided purchases of new products. The assessment
does not cover the waste management of the products nor the demographic conditions in the region
for promoting further sharing and integrated sharing services. Nonetheless, while the study provides
a review in only one district of Stockholm, the results have shown significant improvements from the
limited sharing of products in the district.
In conclusion, the study outlines a methodology that can be employed for reviewing the
environmental performance of sharing services and highlights many of the potentially sensitive
methodological choices and areas for improvement when reviewing the impacts of sharing services.
6. Future Research Suggestions
This study has provided a review of P2P sharing and its environmental performance. Further
studies such as this are welcomed in the scientific literature to compare and analyze the implications
of sharing services and the importance of methodological considerations.
Further research is needed on how P2P sharing platforms influence users’ consumption patterns.
With the proliferation of P2P platforms, it will be important to assess behavioral changes as the sharing
would become more accessible [53].
Furthermore, while the demographics and pre-conditions have not been explored, nor its influence
on sharing, for the Hammarby Sjöstad urban district, this may be important to review further, as the
residents are generally of higher economic status than other areas in Stockholm (and Sweden) [28],
and have been subject to a number of sustainability targeted initiatives [54], which may influence the
use of P2P services [55].
This study also reviewed the integration of P2P services with other logistic services. Assessments
may need to include economic aspects to review the added costs for sharing incurred by further
integrated systems; e.g. business models and costs for optimized value.
Supplementary Materials: The following are available online at http://www.mdpi.com/2071-1050/11/1/190/
s1.
Author Contributions: M.M. conceived of and designed the research approach for the project. M.M. also
contributed to the development of methods, primary data collection for LCI data in addition to the environmental
analysis and the majority of the writing. D.L. contributed with a literature review of sharing economy and
collaborative consumption literature, writing in the text and provided a critical review, analysis of the data,
the development of scenarios, figures, writing of the text and revisions. C.G. provided support for the project
through contacts with sharing service providers, data collection and a review of the manuscript.
Funding: This project has been funded through Sharing Cities Stockholm, which is an initiative within Viable Cities
(www.viablecities.com), the Swedish Strategic Innovation Program for smart, sustainable cities. The program is
jointly funded by the Swedish Innovation Agency (VINNOVA), the Swedish Energy Agency and the Swedish
Research Council for Environment, Agricultural Sciences and Spatial Planning (FORMAS).
Acknowledgments: The authors would like to thank Jonatan Wranne for his help with the LCI data used in this
project and input from the sharing service provider Hygglo. We are also grateful for the constructive input from
the reviewers and editors.
Conflicts of Interest: The authors declare no conflict of interest.You can also read


