KBC Group / Bank Covered Bond Investor Presentation February 2016
←
→
Page content transcription
If your browser does not render page correctly, please read the page content below
KBC Group / Bank
Covered Bond Investor Presentation
February 2016

More infomation: www.kbc.com :
KBC Group - Investor Relations Office - Email: investor.relations@kbc.com

                                                                            1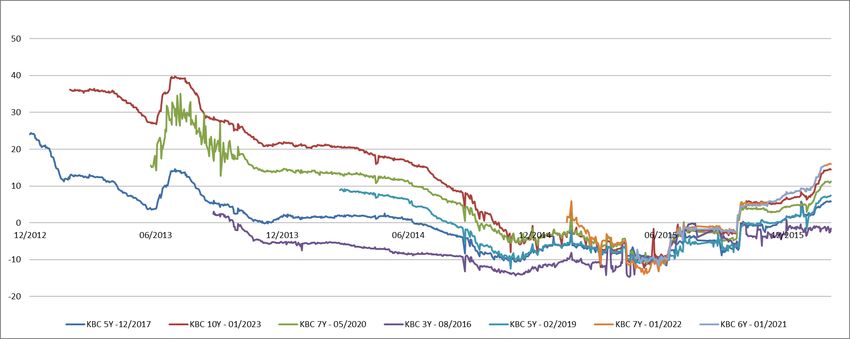
Important information for investors
The information in this document has been prepared by KBC Bank NV (KBC Bank) solely for use at a presentation to be held in connection,
inter alia, with a potential offering (the Offering) of Covered Bonds (the Covered Bonds) by KBC Bank.
In the event the Offering proceeds, investment in the Covered Bonds will involve certain risks. A summary of the material risks relating to the
Offering will be set out in the section headed "Risk Factors" in the prospectus. There may be additional material risks that are currently not
considered to be material or of which KBC Bank and its advisors or representatives are unaware.
KBC Bank believes that this presentation is reliable, although some information is summarised and therefore incomplete. Financial data is
generally unaudited. KBC Bank cannot be held liable for any loss or damage resulting from the use of the information.
Forward-looking statements:
This presentation includes contains non-IFRS information and “forward-looking statements” relating to KBC Bank including with respect to the
strategy, earnings and capital trends of KBC Bank, that are subject to known and unknown risks and uncertainties, many of which are outside
of KBC Bank’s control and are difficult to predict, that may cause actual results to differ materially from any future results expressed or
implied from the forward-looking statements. In this presentation, the words “anticipates,” “believes,” “estimates,” “seeks,” “expects,”
“plans,” “intends” and similar expressions, as they relate to KBC Bank, are intended to identify forward-looking statements. Important factors
that could cause actual results to differ materially from such expectations include, without limitation: the inability to obtain necessary
regulatory approvals or to obtain them on acceptable terms; the economic environment of the industries in which KBC Bank operates; costs
associated with research and development; changes in the prospects for products in the pipeline or under development by KBC Bank;
dependence on the existing management of KBC Bank; changes or uncertainties in tax laws or the administration of such laws; changes or
uncertainties in the laws or regulations applicable to the markets in which KBC Bank operates. All written and oral forward-looking statements
attributable to KBC Bank or persons acting on its behalf are expressly qualified in their entirety by the cautionary statements above. KBC
Group does not intend, or undertake any obligation, to update these forward-looking statements.
Much of the information in these slides relates to KBC Group NV (including KBC Bank and KBC Insurance NV) (KBC Group) and may not,
therefore, be wholly relevant to the performance or financial condition of KBC Bank and its subsidiaries. Those interested in KBC Bank should
not place undue reliance or attach too great importance to the information contained in these slides relating to KBC Group.
This document and its contents are confidential and are being provided to you solely for your information and may not be retransmitted,
further distributed to any other person or published, in whole or in part, by any medium or in any form for any purpose. The opinions
presented herein are based on general information gathered at the time of writing and are subject to change without notice. KBC Bank relies
on information obtained from sources believed to be reliable but does not guarantee its accuracy or completeness.
2Important information for investors
This presentation is provided for information purposes only. This presentation does not constitute an offer or invitation to sell, or any
solicitation of any offer to subscribe for or purchase any securities, and nothing contained herein shall form the basis of any contract or
commitment whatsoever. Investors and prospective investors in the Covered Bonds of KBC Bank are required to make their own
independent investigation and appraisal of the business and financial condition of KBC Bank and the nature of the Covered Bonds. Any
decision to purchase Covered Bonds in the context of the Offering, if any, should be made solely on the basis of information contained in the
prospectus published in relation to such Offering. No reliance may be placed for any purpose whatsoever on the information contained in this
presentation, or any other material discussed verbally, or on its completeness, accuracy or fairness. This presentation does not constitute a
recommendation regarding the Covered Bonds of the KBC Bank.
Any offer of Covered Bonds to the public that may be deemed to be made pursuant to this document in any EEA Member State that has
implemented Directive 2003/71/EC (together with any applicable implementing measures in any Member State, the Prospectus Directive) is
only addressed to qualified investors in that Member State within the meaning of the Prospectus Directive.
A prospectus prepared pursuant to the Prospective Directive is intended to be published, which, if published, can be obtained in accordance
with the applicable rules. A decision to purchase or sell our securities should be made only on the basis of a prospectus prepared for that
purpose and on the information contained or incorporated by reference therein.
This document is only being distributed to and is only directed at (i) persons who are outside the United Kingdom or (ii) to investment
professionals falling within Article 19(5) of the Financial Services and Markets Act 2000 (Financial Promotion) Order 2005 (the Order) or (iii)
high net worth entities, and other persons to whom it may lawfully be communicated, failing within Article 49(2)(a) to (d) of the Order (all
such persons together being referred to as relevant persons). Any investment activity to which this communication may relate is only
available to, and any invitation, offer, or agreement to engage in such investment activity will be engaged in only with, relevant persons. Any
person who is not a relevant person should not act or rely on this document or any of its contents.
Neither this presentation nor any copy of it may be taken or transmitted into, or distributed, directly or indirectly in, the United States of
America (or to U.S. persons), its territories or possessions, Canada, Australia or Japan. This presentation is not a public offer of securities for
sale in the United States. The Covered Bonds proposed in the Offering have not been and will not be registered under the U.S. Securities Act
of 1933 (the "Securities Act"), or the laws of any state or other jurisdiction of the United States, and may not be offered or sold within the
United States or to U.S. persons, absent registration or an exemption from, or in a transaction not subject to, the registration requirements of
the Securities Act and applicable state laws. The Issuer does not intend to register any portion of the Offering in the United States or conduct
a public offering of securities in the United States. The Securities are subject to U.S. tax law requirements. KBC Bank does not intend to
register any portion of the proposed Offering under the applicable securities laws of the United States, Canada, Australia or Japan. Any failure
to comply with these restrictions may constitute a violation of U.S., Canadian, Australian or Japanese securities laws, as applicable. The
distribution of this document in other jurisdictions may also be restricted by law, and persons into whose possession this document comes
should inform themselves about, and observe, any such restrictions.
By reading this presentation, each investor is deemed to represent that it understands and agrees to the foregoing restrictions.
3Executive summary
KBC Bank has strong and diversified financial performance
• Strong core banking operations in Belgium and CEE region
• Highly liquid – a loyal deposit base and low refinancing needs
o Continued strong liquidity position (NSFR at 121% and LCR at 127%)
• Conservative risk profile
o Well capitalised – Common equity ratio (B3 fully loaded based on Danish Compromise) of 14.9% at 4Q 2015*
Sound economic picture provides strong support for Belgian housing market
• Private savings ratio of approx. 12%
• Belgian unemployment is significantly below the EU average
• Demand still outstrips supply
KBC’s covered bonds are backed by strong legislation and superior collateral
• KBC’s Covered Bonds are rated Aaa/AAA (Moody’s/Fitch)
• Cover pool: Belgian residential mortgage loans
• Strong Belgian legislation – inspired by German Pfandbrief law
• KBC has a disciplined origination policy – 2007 to 2014 residential mortgage loan losses below 4 bp
• CRD and UCITS compliant
KBC has issued 7 successful benchmark covered bonds in different maturity buckets.
* After reimbursement of the remaining state aid (2bn EUR) and penalty of 50% (1bn EUR) at the end of 2015
4Contents
Page nr.
1 Key highlights of KBC Group/Bank 6
2 Overview of Belgian housing and mortgage market 16
3 Review of Belgian covered bond legislation 23
4 KBC Bank residential mortgage covered bond programme 29
5 Appendices 36
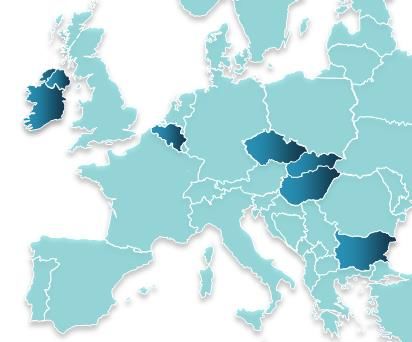
5Well-defined core markets provide access to ‘new
growth’ in Europe
MARKET SHARE (END 2015)
BE CZ SK HU BG
KBC Group’s core markets 21% 19%
Loans and 11% 10%
and Ireland deposits 3%
Investment 40%
26% 18%
funds 7%
NETHERLANDS
IRELAND Life 17%1
UK 12%
insurance 7% 4% 4%
BELGIUM GERMANY 9% 10%
Non-life 7% 5%
3%
CZECH REP insurance
SLOVAKIA
REAL GDP GROWTH OUTLOOK
FRANCE HUNGARY FOR CORE MARKETS2
BE CZ SK HU BG
% of 69%
Assets 14% 3% 3% 1%
BULGARIA
4.5%
3.2% 2.8% 2.7%
ITALY 2015 1.4%
SPAIN
PORTUGAL
Macroeconomic outlook 2.5% 3.2% 2.4% 2.5%
GREECE 2016e 1.5%
Based on GDP, CPI and unemployment trends
Inspired by the Financial Times
2.3% 3.2% 2.7% 2.4%
2017e 1.5%
1. Excluding group insurance. Including group insurance, market share of life insurance amounted to 13% at the end of 2015
2. Source: KBC data, February 2016
6Overview of KBC Group
STRONG BANK-INSURANCE GROUP PRESENT WITH LEADING MARKET POSITIONS IN CORE GEOGRAPHIES
(BELGIUM AND CEE region)
• A leading financial institution in both Belgium and the Czech Republic
• Turnaround potential in the International Markets Business
• Business focus on Retail, SME & Midcap clients
• Unique selling proposition: in-depth knowledge of local markets and profound relationships with clients
INTEGRATED BANK-INSURANCE BUSINESS MODEL, LEADING TO HIGH CROSS-SELLING RATES
• Strong value creator with good operational results through the cycle
• Integrated model creates cost synergies by avoiding overlap of supporting entities and generates added value for our clients
through a complementary and optimised product and service offering
LEGAL STRUCTURE OF KBC GROUP
KBC Group NV
100% 100%
KBC Bank KBC Insurance
Issuing Entity
of Covered Bonds
7Overview of key financial data at 4Q 2015
KBC Group KBC Bank KBC Insurance
Market cap (17/02/16): EUR 21bn Net result FY 2015: EUR 2.4bn2 Net result FY 2015: EUR 354m
Net result FY 2015: EUR 2.6bn Total assets: EUR 218bn Total assets: EUR 38bn
Total assets: EUR 252bn Total equity: EUR 13bn Total equity: EUR 3bn
Total equity: EUR 16bn CET1 ratio (Basel 3 transitional): 14.1% Solvency I ratio: 289%
CET1 ratio (Basel 3 transitional1): 15.2% CET1 ratio (Basel 3 fully loaded): 13.7% Solvency II ratio: 231%
CET1 ratio (Basel 3 fully loaded1): 14.9% C/I ratio FY 2015: 55%3 Combined operating ratio FY15: 91%
Credit Ratings of KBC Bank (KBC Group) as at 15 February 2016
S&P Moody’s Fitch
Long-term A (Negative) A1 (Stable) A- (Stable)
(KBC Group) BBB+ (Stable) Baa1 (Stable) A- (Stable)
Short-term A-1 Prime-1 F1
1. After taking into account the full reimbursement of remaining state aid of 2bn EUR (and penalty)
2. Includes KBC Asset Management ; excludes holding company eliminations
3. Adjusted for specific items, the C/I ratio amounted to c.59% in 4Q 2015
8Earnings capacity
CONTRIBUTION OF BANKING ACTIVITIES
TO KBC GROUP NET RESULT1,2 903
765
564
NET RESULT1 532
420 412
524
257 262
448
2 639
-310
765
1 860 1 762 1Q14 2Q14 3Q14 4Q14 1Q15 2Q15 3Q15 4Q15
Impact Financial Holding Goodwill impairments
1 015
612
2 218
13 CONTRIBUTION OF INSURANCE ACTIVITIES
TO KBC GROUP NET RESULT1,2
-344 121
Impact Financial Holding 105
118 98 121
Goodwill impairments 73
46 79
42 71 33
68 51 62
37 50 44
25
-2 484 -2 466 89
73 82 66
51 50 59 48 44
FY08 FY09 FY10 FY11 FY12 FY13 FY14 FY15 3
-8 -19 -16 1 -19 -21
-23 -41
-34
4Q13 1Q14 2Q14 3Q14 4Q14 1Q15 2Q15 3Q15 4Q15
1 Note that the scope of consolidation has changed over time, due partly to divestments
Non-life result Non-technical & taxes
2 Difference between the net result at KBC Group and the sum of the banking and insurance
contribution are the holding-company/group items 9
Life result Goodwill imprairments
Amounts in m EUROverview of results based on business units
NET PROFIT – BELGIUM NET PROFIT – CZECH REPUBLIC
FY15 ROAC: 26% FY15 ROAC: 37%
1,570 1,516 1,564 581
554 528 542
1,360 114
377 348 119
414 121 119
296
1,193 1,216 467 435 423
1,064 1,102 408
2012 2013 2014 2015 2012 2013 2014 2015
4Q 9M 4Q 9M
NET PROFIT – NET PROFIT – INTERNATIONAL
INTERNATIONAL MARKETS MARKETS EXCL. IRELAND
FY15 ROAC: 18%
FY15 ROAC: 12%
245 232
61
184 58
-18 144 139
-242 -175 -7
49 34
-182
-260 -731 174
95 105
38
-122 -41
-853 -3
2012 2013 2014 2015 2012 2013 2014 2015
4Q 9M 4Q 9M
Amounts in m EUR 10Loan loss experience at KBC
FY15 FY14 FY13 FY 2012 AVERAGE
CREDIT COST RATIO CREDIT COST RATIO CREDIT COST RATIO CREDIT COST RATIO ‘99 –’15
Belgium 0.19% 0.23% 0.37% 0.28% n/a
Czech
0.18% 0.18% 0.26% 0.31% n/a
Republic
International
0.32% 1.06% 4.48%* 2.26%* n/a
Markets
Group Centre 0.54% 1.17% 1.85% 0.99% n/a
Total 0.23% 0.42% 1.21%** 0.71% 0.52%
Credit cost ratio: amount of losses incurred on troubled loans as a % of total average outstanding loan portfolio
* The high credit cost ratio at the International Markets Business Unit is due in full to KBC Bank Ireland. Excluding Ireland, the CCR at this business unit amounted to 108 bps in FY13
** Credit cost ratio amounted to 1.21% in FY13 due to the reassessment of the loan books in Ireland and Hungary
11Strong capital position, also after the full repayment of
state aid
BASEL 3 CET1 RATIO AT KBC GROUP BASED ON THE DANISH
COMPROMISE*
15.2% Common equity ratio (B3 phased-in) of
13.7% 15.2% based on the Danish Compromise at
13.3% end 2015, which clearly exceeds the new
11.4% minimum capital requirements set by the
ECB (9.75%) and the NBB (0.5%), i.e. an
10.6% 11.0% aggregate 10.25% for 2016
9.6% 9.9%
10.25% regulatory
minimum (phased-
14.9% in) for 2016
As announced by the NBB the systemic buffer
13.2% 14.0%
11.7% (CET1 phased-in of 0.5% in 2016 under the
9.7% 10.4% 11.0% Danish Compromise) will gradually increase
9.0% over a 3-year period, reaching 1.5% in 2018.
A pro forma fully loaded minimum common
equity ratio translation to 11.25% was clearly
exceeded with a fully loaded B3 common
equity ratio of 14.9% based on the Danish
1Q14 1H14 9M14 FY14 1Q15 1H15 9M15 FY15
Compromise at end 2015
Fully loaded B3 CET1 ratio Phased-in B3 CET1 ratio
Total distributable items (under Belgian GAAP) KBC Group 6.6bn EUR, of which:
• available reserves 1.3bn EUR
• accumulated profits (losses) 5.3bn EUR
* Pro forma assuming full state aid repayment (principal + penalty) 12Fully loaded Basel 3 leverage ratio
Fully loaded Basel 3 leverage ratio at KBC Bank
5.1% 5.4%
5.0% 4.9% 4.8% 4.8%
Fully loaded B3 leverage ratio, based on the
9M14 FY14 1Q15 1H15 9M15 FY15 current CRR legislation (which was adapted
during 4Q14):
• 5.4% at KBC Bank consolidated level
Fully loaded Basel 3 leverage ratio at KBC Group* • 6.3% at KBC Group level
6.3%
5.4% 5.6%
5.1% 5.2%
4.7%
9M14 FY14 1Q15 1H15 9M15 FY15
* Pro forma assuming full state aid repayment (principal + penalty) 13KBC maintains a minimum total capital ratio of 17%*
Total capital ratio Will be filled up with T2,
of 19.8% phased-in Total capital ratio depending on the actual CET1
of 19.0% fully loaded Total capital ratio position
of no less than 17.0%
2.99% T2 fully loaded
2.57%
2.25% additional
• Minimum CET1 target of
1.66% AT1 1.57% capital 11.25% fully loaded (SREP
2.00% T2 of 9.75% and Domestic
1.50% AT1 SIFI buffer of 1.50% fully
loaded)
15.16% CET1 14.87%
• AT1 of 1.5%
11.25%
• Minimum T2 target of 2%
• Minimum total capital
ratio of 17.0%
2015 phased-in 2015 fully loaded 2017e fully loaded
* Basel 3, Danish compromise
14Solid liquidity position (1)
KBC Bank continues to have a strong retail/mid-cap deposit base in its core markets – resulting in a stable
funding mix with a significant portion of the funding attracted from core customer segments & markets
3% 3% 3% 4% 100%
8% 6% 2% 5%
5% 0% 2% 2%
9% 10%
5% 7% 8% 8% 8%
8% 7%
8% 9% 8% 9% 8% 7%
9% 2% 1%
8% 7% 3% 3% 3%
3%
7%
21%
73%
73% 75% 73% 73% customer
70% 69% 71%
64% driven
Retail and SME
Mid-cap
Debt issues in retail network
FY09 FY10 FY11 FY12 FY13 FY14 FY15 Government and PSE
Net unsecured interbank funding Total equity
Net secured funding Certificates of deposit
Debt issues placed with institutional investors Funding from customers
15Upcoming mid-term funding maturities
Breakdown of Funding Maturity Buckets
5.000 (Including % of KBC Group’s balance sheet)
1,8%
4.500
4.000 KBC Bank has overall a limited reliance on wholesale funding
3.500 1,2%
Millions EUR
3.000 1,1%
1,0%
2.500 Senior debt and subordinated Tier 2 spreads have moderately
2.000 0,7% narrowed towards the end of 4Q15
1.500 0,5%
0,5%
1.000 0,3%
0,1% KBC Bank has 6 solid sources of long-term funding:
500 0,1%
0
• Retail term deposits
2016 2017 2018 2019 2020 2021 2022 2023 2024 >= 2025 • Retail EMTN
Senior Unsecured Subordinated T1 Subordinated T2 Contingent Convertible Covered Bond TLTRO
• Public benchmark transactions
• Covered bonds
• Structured notes and covered bonds using the private placement
15% format
25%
• T1 and T2 capital instruments issued at KBC Group level and
down-streamed to KBC Bank
Total
outstanding =
18.99bn EUR
7%
36%
12%
5%
16Credit spreads evolution
Credit Spreads Evolution
85 220
75
65 170
55
45 120
35
25 70
15
5 20
-5
-15 -30
Dec-13 Apr-14 Aug-14 Dec-14 Apr-15 Aug-15 Dec-15
1
2.5Y Senior Debt Interpolated 5Y Covered Bond Interpolated 10NC5 Subordinated Tier 2
1 10NC5 Subordinated Tier 2 spread is depicted based on the right hand axis.
17Contents
Page nr.
1 Key highlights of KBC Group/Bank 6
2 Overview of Belgian housing and mortgage market 16
3 Review of Belgian covered bond legislation 23
4 KBC Bank residential mortgage covered bond programme 29
5 Appendices 36
18Economic recovery in Belgium takes further shape
Relative optimism concerning growth in 2016
• The recovery that started in spring 2013 is still on track, despite faltering growth in emerging markets. We are forecasting Belgian GDP
growth at 1.3% and 1.6%, respectively, in 2015 and 2016. That is below the euro area figures (1.6% and 1.9% respectively), partly due to a
larger impact of fiscal austerity. Our 2016 forecast however is above the one of the EC (1.3%) and the consensus (1.4%).
• Household consumption continues to be supported by the improved situation on the labour market. There has been a net increase of more
than 50,000 jobs since spring 2013. The unemployment rate fell to 8.7% in September from its peak of 8.9% in June. Wage moderation, the
tax shift away from labour and the unemployment measures taken by the regional governments, all help fuel further job creation.
• Belgian inflation already moved some way from the negative figures recorded at the start of this year. The rise in inflation is due on the one
hand to the ending of the effect of the reduction in VAT on electricity for domestic use in April last year. In addition, prices of fresh foods
has jumped sharply in recent months. We think inflation will rise further to an average of 1.5% in 2016.
GDP - ECONOMIC UPTURN UNEMPLOYMENT RATE CONSUMER PRICE INFLATION IN
SINCE EARLY 2013 (% OF LABOUR FORCE) BELGIUM (IN %)
(Q1 2008 = 100) Belgium
6 General index 80
Oil price (in EUR, rhs)
106 14 France
5 60
Germany
104 12 Netherlands
Euro Area 4
40
102 10
3
20
100 8 2
0
98 6 1
Belgium 4 -20
96 0
Germany
France 2 -1 -40
94
Netherlands
Euro Area 0 -2 -60
92
19Demand for houses continues to be supported
Increasing demand for houses
High homeownership in Belgium: around 72%, approx. 5% higher than the EMU.1
Total outstanding mortgage debt was at EUR 189.5 bn. end 2014. Total mortgage debt compared to GDP in Belgium is 49,1% and
compares well to other European countries and EU average of 49,4% (2014 figures).2
The number of Belgian families has grown by around 570.000 since 2000 and is expected to grow by 33.000 per annum on
average over the coming 5 years.3
THE NUMBER OF HOUSEHOLDS IS GROWING HOUSEHOLD MORTGAGE DEBT
FASTER THAN THE POPULATION (1980 = 100) (% of GDP)
110
Population 100
145 Number of families 2,8
90 2002
140 Number of persons per family (right axis)
80 2014
135 2,7
70
Forecast
130
2,6 60
125
50
120
2,5 40
115
30
110
2,4 20
105 10
100 2,3 0
95
90 2,2
1. KBC research department
2. European Mortgage Federation
3. Federal Planning Bureau 20Supply remains subdued
Stable
There has not been a building boom in Belgium: construction activity has remained relatively stable over the past three decades at
around 5% of GDP. The construction sector has been in a difficult period in 2012-2014; in line with the general economic recovery the
sector is now actively making up lost ground against the other sectors, however.
Demand for mortgage lending has remained notably strong in 2015, despite the reduction of the “woonbonus” in Flanders at the start
of this year.
The ratio of the number of accommodation units to the number of families began to fall again in the early 2000s, indicating that there
has been a movement towards some shortage on the housing market. In recent years, this trend reversed, but from 2015 onwards the
increase in families is expected to be higher again (partly due to a strong increase in immigrants).
% OF CONSTRUCTION ECONOMY AS PART HOUSING SUPPLY VERSUS
12%
OF TOTAL GDP NUMBER OF FAMILIES
60000 1100
10% 1090
50000
1080
8% 1070
40000
1060
6% 30000 1050
1040
20000
4% 1030
Belgium France 1020
10000
2% Germany Ireland 1010
Netherlands Spain 0 1000
0%
Number of housing units per 1000 families (rhs)
Number of new families (lhs)
21 Number of new housing units (lhs)
Source: Fod Economie, FOD Financiën, EurostatBelgian housing market not overvalued
Belgian housing market Mortgage market technicality
Belgian house prices have risen relatively strongly; regression-based Belgian borrowers predominantly prefer to take fixed rate interest
valuation techniques however indicate that the Belgian market is not rates. A 78% is fixed permanently and the remainder is variable
overvalued (surely not excessively, as indicated by price-to-income or
There is a legal cap on variable mortgage rates in Belgium
price-to-rent ratios)
House prices have risen, however borrowers have increased their
In absolute terms, Belgium is not an overly expensive country for housing,
own equity stake
with an average sales price in Q4 2014 of 224.339EUR1
Belgian residential mortgage loans are amortizing
No excessive Housing Cost Overburden Rate (proportion of the
population, whose housing costs exceed 40% of their equalized
disposable income): Belgium 11% versus euro-zone average 12%2
HOUSING PRICE AVERAGE HOUSING PRICE AND MORTGAGE CREDIT3
(1995 Q1 = 100) (SOURCE: ECB) (LEFT HAND SCALE IN THOUSAND EURO)
320 Belgium
300 Germany 250 85%
France
280 Netherlands
260 Austria 200 80%
240 Ireland
Italy 150 75%
220
Spain
200
100 70%
180
160
50 65%
140
120
0 60%
100
80
Average amount of loan for purchase
House price
1. FOD Economie Loan-to-value (right axis)
2. Eurostat 22
3. All data/graphs : Union de Crédit Professionels / BeroepsVerening KredietenKBC’s disciplined origination leads to low arrears and
extremely low loan losses
BELGIUM SHOWS A SOLID PERFORMANCE OF MORTGAGES…
Arrears have been very stable over the past 10 years. Arrears in Belgium are low due to:
Cultural aspects, stigma associated with arrears, importance attached to owning one’s property
High home ownership also implies that the change in house prices itself has limited impact on loan
performance
Well established credit bureau and surrounding legislation
Housing market environment (no large house price declines)
… AND KBC HAS EXTRAORDINARY LOW LOAN LOSSES
1,4%
1,22%
1,22%
1,20%
1,20%
1,20%
1,20%
1,20%
1,19%
1,19%
1,19%
1,18%
1,18%
1,18%
1,17%
1,17%
1,17%
1,17%
1,17%
1,17%
1,17%
1,16%
1,16%
1,16%
1,16%
1,16%
1,15%
1,14%
1,14%
1,14%
1,13%
1,13%
1,12%
1,12%
1,12%
1,12%
1,12%
1,12%
1,11%
1,11%
1,11%
1,10%
1,09%
1,09%
1,09%
1,09%
1,08%
1,08%
1,08%
1,08%
1,08%
1,06%
1,06%
1,06%
1,06%
1,2%
1,0% Market loans in 3 months arrears KBC loans in 90days arrears KBC loan losses
0,8%
0,56%
0,54%
0,53%
0,52%
0,50%
0,48%
0,440%
0,440%
0,430%
0,44%
0,6%
0,41%
0,39%
0,38%
0,33%
0,4%
0,036%
0.015%
0,013%
0,012%
0,007%
0,003%
0,2%
0,0%
23Low defaults, illustrated by KBC’s securitisation
transactions performance
PRUDENT ORIGINATION AND STABLE HOUSING RESULT IN LOW DEFAULTS AND HIGH RECOVERY
Low cumulative default figures on KBC Home loan Invest transactions
The mortgage loans used in securitisation are similar to the mortgage loans of the covered bond programme
Default is defined as acceleration of the loan (on average after 180 days overdue)
Defaults are very low at approx. 10bp per year. Recoveries are very high (see previous chart with KBC
residential mortgage loan losses). In the securitisation transactions, all defaults are covered by recoveries and
excess spread.
CUMULATIVE DEFAULTS KBC SECURITISATIONS
24Contents
Page nr.
1 Key highlights of KBC Group/Bank 6
2 Overview of Belgian housing and mortgage market 16
3 Review of Belgian covered bond legislation 23
4 KBC Bank residential mortgage covered bond programme 29
5 Appendices 36
25Belgian legal framework
Direct covered bond issuance from a bank’s balance
sheet
Dual recourse, including recourse to a special estate
with cover assets included in a register
The special estate is not affected by a bank insolvency
National Bank of Requires license from the National Bank of Belgium
Belgium (NBB)
Ongoing supervision by the NBB
The cover pool monitor verifies the register and the
Cover Pool
portfolio tests and reports to the NBB
Monitor
The NBB can appoint a cover pool administrator to
manage the special estate
Covered bonds
Issuer Special Estate with Cover
Note Holders
Assets in a Register
Proceeds
Cover Pool Representative
Administrator of the Noteholders
26Special estate - dual recourse
COVERED BOND INSOLVENCY REGIME
General bank estate
Covered Bond
Material exception to ordinary rules:
Special estate
• Liquidation proceedings only affect the general estate
Covered Bond • The special estate is not affected by the bank’s
Cover assets insolvency/liquidation
in a
The NBB appoints a Cover Pool Administrator
Register with the purpose, in principle, to continue the
management of the assets until the maturity
date of the covered bonds
Cover Assets consists by law of one or more of the following types of
assets: After redemption of all covered bonds,
1. Residential mortgage loans and senior RMBS; remaining assets in the special estate become
2. Commercial mortgage loans and senior CMBS; part of the general estate.
3. Claims towards public entities and related senior ABS; Recourse to the general estate and the
4. Receivables on credit institutions; insolvency procedure cannot be closed as long as
5. Hedging instruments related to a cover asset there are covered bonds outstanding.
Assets of either type 1, 2 or 3 must at least be 85% of the nominal
amount of covered bonds
A Special Estate consists by law of:
Cover assets;
Security Interests or guarantees related to the cover assets;
Any monies deriving from the collection of cover assets/exercise
of rights attached to cover assets
27Strong legal protection mechanisms
1 The value of one asset category must be at least 85% of the nominal amount of
covered bonds
Collateral type
• KBC Bank selects residential mortgage loans and commits that their value (including collections) will be at
least 105%
2 The value of the cover assets must at least be 105% of the covered bonds
Over- • The value of residential mortgage loans:
1) is limited to 80% LTV
collateralisation
Test 2) must be fully covered by a mortgage inscription (min 60%) plus a mortgage mandate (max 40%)
3) 30 day overdue loans get a 50% haircut and 90 days (or defaulted) get zero value
3
The sum of interest, principal and other revenues of the cover assets must at
Cover Asset least be the interest, principal and costs relating to the covered bonds
Coverage Test • Interest rates are stressed by plus and minus 2% for this test
4 Cover assets must generate sufficient liquidity or include enough liquid assets to
Liquidity Test pay all unconditional payments on the covered bonds falling due the next 6
months
Interest rates are stressed by plus and minus 2% for this test
5
Cap on Issuance Maximum 8% of a bank’s assets can be used for the issuance of covered bonds
28External supervision / management
Provides a general and special authorization
The statutory auditor provides a report on the organizational capabilities of the
issuer
By the Approves the appointment of the cover pool monitor
NBB Appoints, if circumstances require so, the cover pool administrator
Ongoing supervises compliance with the Covered Bonds Legislation by issuing
credit institutions
The Issuer reports quarterly to the NBB
Is an auditor who is not the statutory auditor of the issuing credit institution
By the Provides an initial report to the NBB that the issuer complies with regulatory
requirements and will verify this annually
Cover Pool
Verifies each month that the legal tests are met and reports exceptions to the
Monitor
NBB
The NBB appoints a cover pool administrator to manage the special estate,
By the instead of the credit institution:
• In case of adoption of a restructuring measure or liquidation of the credit institution; or
Cover Pool • When the NBB is in the opinion that interests of bondholders is endangered
Administrator Has the legal power to manage the special estate, independently from the
issuer or the liquidator, for the benefit of the covered bondholders
29Belgian covered bond legislation in comparison
Belgium Netherlands France Germany UK
Segregation of Cover • Issuer holds assets on • Cover pool assets assigned • No segregation of covered • Issuer holds assets on • Cover pool assets sold to
Pool balance sheet and the to SPE (which guarantees pool assets assigned to an balance sheet SPV (which guarantees the
assets covering the the bonds) and SCF (Sociétés de crédit bonds)
bonds are segregated subsequently pledged to a foncier) from the other • Bonds are secured in favour
on the originator’s security trustee acting on SCF's assets of a security trustee acting
balance sheet in a behalf of the bondholders • However, SCF is a single on behalf of the
Register • As a result, the cover pool purpose entity, bankruptcy bondholders and
• Alternatively, a credit assets are segregated from remote and completely segregated from other SPV
institution could other issuing bank / independent from other assets and the issuing bank
transfer eligible assets originator assets and SPE group companies / originator
to another dedicated assets respectively
credit institution, which
in turn issues the
covered bonds
Max LTV. 80% LTV in the over-
80%¹ 60%/80%/100%² 60% 80%
(Residential) collateralisation test
Min Over-
5% Contractually agreed 2% for both SCF and SFH 2% c.10%³
Collateralisation
One asset category must
Max. Substitute
be at least 85% of the Contractually agreed 15% 10-20% 15%
Collateral
covered bonds
Cover Register Yes No No Yes Yes
Independent Monitor Yes Yes Yes Yes Yes
CRD Compliant Yes Depending on programme Yes Yes Depending on programme
Derivatives as
Yes Yes Yes Yes Yes
Collateral
Matching
Nominal value Nominal value NPV and nominal value NPV and nominal value NA⁴
Requirements
1. All covered bond programmes apply an 80% LTV cut-off percentage. Some covered bond programmes apply a 100% or different LTV cut-off percentage for residential mortgage loans
that have the benefit of a Dutch National Mortgage Guarantee (Nationale Hypotheek Garantie) or of a credit risk insurance policy
2. 60% of the value of the financed asset is eligible for the loan. This amount may be increased to 80% if the entire loan portfolio consists of loans to individuals and is intended to
finance home purchases. It may be raised to 100% for loans guaranteed by the FGAS
3. Actual amount varies from programme to programme
4. Primary method for the mitigation of market risk is the use of derivative hedge instruments
30Contents
Page nr.
1 Key highlights of KBC Group/Bank 6
2 Overview of Belgian housing and mortgage market 16
3 Review of Belgian covered bond legislation 23
4 KBC Bank residential mortgage covered bond programme 29
5 Appendices 36
31KBC Bank NV residential mortgage covered bond
programme (1/2)
Issuer: • KBC Bank NV
• min 105% of covered bond outstanding is covered by residential mortgage loans and
Main asset category:
collections thereon
Dual recourse:
• Parri passu with the other unsecured obligations of the Issuer (general bank estate)
Status:
• Exclusive recourse to the special estate
Current Programme Characteristics
Program size: • Up to 10bn EUR
Interest rate: • Fixed Rate, Floating Rate or Zero Coupon
Currencies: • Euro
• Soft Bullet: payment of the principal amount may be deferred past the Final Maturity
Maturity: Date until the Extended Final Maturity Date if the Issuer fails to pay
• Extension period is 12 months
32KBC Bank NV residential mortgage covered bond
programme (2/2)
• Failure to pay any amount of principal on the Extended Final Maturity Date
Events of default:
• A default in the payment of an amount of interest on any interest payment date
• Moody’s Aaa
Rating agencies:
• Fitch AAA
• 3 months interest payments are covered by liquid bonds of credit quality Step 1 (“AA-” or
Additional liquidity better). (Fitch requirement)
• To ensure timely payment of interests
Cover Pool Monitor: • KPMG
Moody’s Fitch
Over-collateralisation 15% 25%
TPI Cap Probable D-cap 4 (moderate risk)
33Benchmark issuance KBC covered bonds
Since establishment of the covered bond programme KBC has issued seven benchmark issuances:
SPREAD EVOLUTION KBC COVERED BONDS (SPREAD IN BP VERSUS 6 MONTH MID SWAP)
Source Bloomberg Mid ASW levels
34Key cover pool characteristics (1/3)
Investor reports, final terms and prospectus are available on www.kbc.com/covered_bonds
Portfolio data as of : 31 December 2015
Total Outstanding Principal Balance 11 646 819 260
Total value of the assets for the over-collateralisation test 10 722 161 327
No. of Loans 138 739
Average Current Loan Balance per Borrower 117 397
Maximum Loan Balance 1 000 000
Minimum Loan Balance 1 000
Number of Borrowers 99 208
Longest Maturity 359 month
Shortest Maturity 1 month
Weighted Average Seasoning 42 months
Weighted Average Remaining Maturity 195 months
Weighted Average Current Interest Rate 2.61%
Weighted Average Current LTV 64.1%
No. of Loans in Arrears (+30days) 279
Direct Debit Paying 97.8%
35Key cover pool characteristics (2/3)
REPAYMENT TYPE (LINEAR VS. ANNUITY) GEOGRAPHICAL ALLOCATION
Linear Onbekend Brussels
4% 0% Hoofdstedelijk
gewest Waals Brabant
Oost- 5% 1%
Vlaanderen Vlaams
18% Brabant
17%
West-
Vlaanderen
16%
Luxemburg Antwerpen
0% 29%
Annuity Henegouwen Limburg
96% 1% 12%
Luik
Namen
1%
0%
LOAN PURPOSE INTEREST RATE TYPE (FIXED PERIODS)
Construction Other 10 y / 5 y 15 y / 5 y 20 y / 5 y
11% 0% 2% 0% 0%
5y/5y
7%
3y/3y
Purchase 19%
50%
Remortgage No review
39% 57%
1y/1y
15%
36Key cover pool characteristics (3/3)
60
FINAL MATURITY DATE 30 SEASONING
25,55
50 Weighted Average
25 Weighted Average
Remaining Maturity: Seasoning:
195 months 20,78 42 months
40
20
30
15
11,98
20 9,27 9
10 8,68
6,24 5,74
10
5
1,38 1,37
0
0
2013 - 2017 2018 - 2022 2023 - 2027 2028 - 2032 > 2032
0 - 12 13 - 24 25 - 36 37 - 48 49 - 60 61 - 72 73 - 84 85 - 96 97 -108 109 -
50 INTEREST RATE 18 CURRENT LTV
45 16
40 14
Weighted Average
35 Weighted Average 12 Current LTV:
Current Interest Rate: 10 64.1%
30 2.61% 8
25 6
20 4
15 2
0
10
5
0
Interest 2.5 < 3.0 < 3.5 < 4.0 < 4.5 < 5.0 < 5.5 < 6.0 < 6.5 < Interest
rate < Interest Interest Interest Interest Interest Interest Interest Interest Interest Rate >
2,5 RateContents
Page nr.
1 Key highlights of KBC Group/Bank 6
2 Overview of Belgian housing and mortgage market 16
3 Review of Belgian covered bond legislation 23
4 KBC Bank residential mortgage covered bond programme 29
5 Appendices 36
38Appendices
Page nr.
1 Initial mortgage selection criteria 37
2 Underwriting and approval process 39
3 Credit risk management 41
4 Additional financial information on KBC 44
5 Supplementary information on Belgian mortgage market 50
39Mortgage selection criteria
The Mortgage Loans have all been originated under the Mortgage Credit Act;
The Mortgage Loans and Related Security is governed by Belgian law;
The Mortgage Loans are granted with respect to Real Estate in Belgium;
The Mortgage Loans have all been originated on or after 1st January 1995;
The Mortgage Loans have all been originated by the Originator in its ordinary course of business;
The Mortgage Loans comply in all respects with all applicable laws including mortgage credit and consumer
protection legislation;
The Mortgage Loans are all secured by a first ranking Mortgage, together, as the case may be, with a second
ranking Mortgage and/or a mandate to create Mortgages over the Mortgaged Asset in favour of the
Originator;
The Mortgage Loans are all fixed rate or variable rate Mortgage Loans;
The maximum lifetime for the Mortgage Loans does not exceed 30 years as from the date of full
disbursement;
The Mortgage Loans are either Annuity Mortgage Loans, Linear Mortgage Loans or Interest-only Mortgage
Loans;
The Mortgage Loans are not in Arrears;
The Mortgage Loans are all fully disbursed;
In respect of each Mortgage Loan, at least one Instalment has been received
Each Mortgage Receivable, except Mortgage Receivables under Interest-only Mortgage Loans is repayable by
way of monthly Instalments;
The Current Balance on the Cut-off Date of each Mortgage Loan is not less than EUR 1,000 and does not
exceed EUR 1,000,000;
The Borrowers of the Mortgage Loans can be employees of KBC Bank
Maximum Loan To Mortgage of 500%
Maximum Current Loan to Value of 150%
40Appendices
Page nr.
1 Initial mortgage selection criteria 37
2 Underwriting and approval process 39
3 Credit risk management 41
4 Additional financial information on KBC 44
5 Supplementary information on Belgian mortgage market 50
41Underwriting and approval process
Customer Credit Credit Administration
Step 1 Application Step 2 Analysis Step 3 Decision
Step 4
Handling
Standard Application Form
Step 11 i. Information on the project (investment and financing plan, what is the total cost and how is it going to be financed?)
ii. Information on the customer: personal data and information on his assets and liabilities
Supported by behavioural and application scoring
i. Property valuation (guarantees)
Step 2 ii. Ratios - loan-to-value ratio and debt-to-income ratio
iii. Credit history of the customer
iv. Income check
85 % of the loans is decided by the local branch
The registration system KPD decides if the branch manager is authorised, which depends on:
Step 33
Step i. The risk-appreciation (= result of application scoring)
ii. The guarantees
The registration system KPD also defines how many people must take the decision and what delegation they must have
Output • After signing and registration of the notarial deed loan file is
• Written offer for the client (= legally transferred to the bookkeeping department
Step 44
Step required) input for the notary • Full disbursement within 12 months of notarisation - can be
extended once with max. 12 months
• Building or renovation bills must be presented
42Appendices
Page nr.
1 Initial mortgage selection criteria 37
2 Underwriting and approval process 39
3 Credit risk management 41
4 Additional financial information on KBC 44
5 Supplementary information on Belgian mortgage market 50
43Start of credit risk monitoring: automatic processes
Main risk warning signal : detection of arrears in payment
Monthly review of the credit portfolio : start of Monitoring phase if arrears > 5 days
Daily review of the credit portfolio : start of special follow-up phase if arrears = 45 days
Dunning procedure
• Automatic friendly reminder after 15 days arrears
• Notice of default after 35 days arrears
day day day day day
15 35 45 65 95
Friendly reminder Notice of Notice of Conciliation proceeding
non payment non payment (department KIB) or call in
(department KBE)
Local branch task
Special Mention – Possible Loss Irrecoverable
Monitoring : Local branch
Head Office – Department KIB Dept.KBE
44Credit risk management: various phases
Borrower Debtor
The
Step
1
Monitoring Step Special Step Possible Step Irrevocable Ste
Step Written off
2 Mention 3 Loss 4 5
Phase
p5
5 days 45 days 90 days Termination – Legal proceedings Written Off
• Arrears < 45 days; local branch is responsible for Step • Irrecoverable: From termination till recovery or
Step
Step 1
the credit risk supervision and is the point of
3 write-off. Time frame is around 180 days
contact
Step • Head office tries to recover outstanding amount
1 • Electronic monitoring of customers being at lowest expense
followed up 4 •
• Payment arrangements possible
After conciliation proceeding Head Office
Step 4 transfers authority to an attorney to begin
• Arrears 45 till 90 days; head office (department
Step proceeding
KIB and KBE) is responsible for the credit risk
supervision and is the point of contact Electronic
4 • Consequences:
• Transfer of the loan to default claim
monitoring of customers being followed up accounting (DUB)
Step 2 •
• Automatic transfer of the title after 45 days Special debt recovery account is opened
arrears to KCB • Specific provisions are booked
• Blocking all borrowers accounts
• Transfer can be sooner at request of local branch
• Write-off after execution of all legal procedures
• Reasons to write off loan
• Payments received < accruing interest
Step • Possible loss from 90 days arrears till termination
• Natural extension of special mention phase
• Borrower disappeared
•
2
Step 3
• Head office is responsible and continues as point
Step 5
Amount not significant enough for further
follow-up
of contact
• Claim is forgiven by law
• Conciliation proceeding before the competent
• Borrower has died without heirs
court is possible in case of 3 unpaid installments
• Compromise settlement between KBC and
(Mortgage loan)
45 borrowerAppendices
Page nr.
1 Initial mortgage selection criteria 37
2 Underwriting and approval process 39
3 Credit risk management 41
4 Additional financial information on KBC 44
5 Supplementary information on Belgian mortgage market 50
46State aid position fully paid back by the end of 2015
KBC made accelerated full repayment of 3.0bn EUR of state aid to the Belgian Federal Government in
December 2012 and accelerated repayment of 1.17bn EUR of state aid to the Flemish Regional Government
mid-2013, approved by the NBB
At the beginning of 2014, KBC accelerated the repayment of 0.33bn EUR (plus penalty), and as such saved 28m
EUR in coupon payments
At the end of 2015, KBC repaid the full outstanding tranche of 2bn EUR of remaining state aid plus a penalty of
1bn EUR to the Flemish Regional Government, well ahead of the official deadline of 2020
Jan 2012 Dec 2012 2013 2014 2015
Total
remaining 7.0bn EUR 6.5bn EUR 3.5bn EUR 2.33bn EUR 2bn EUR 0 EUR
amount
0.5bn1 EUR
Belgian
Federal 3.5bn EUR
3.0bn EUR 3.0bn2 EUR
Government
1.17bn3 EUR
Flemish
0.33bn4 EUR
Regional 3.5bn EUR 3.5bn EUR 3.5bn EUR
Government 2.33bn EUR
2.0bn EUR 2bn5 EUR
1. Plus 15% penalty amounting to 75m EUR
2. Plus 15% penalty amounting to 450m EUR
3. Plus 50% penalty amounting to 583m EUR
4. Plus 50% penalty amounting to 167m EUR 47
5. Plus 50% penalty amounting to 1 000m EURImpaired loans ratios of KBC Group and per Business Unit,
incl. of which over 90 days past due
KBC GROUP CUSTOMER LOAN BOOK: EUR 128bn at 31-12-2015
10.6% 10.5% 10.3% (LARGELY SOLD THROUGH OWN BRANCHES)
9.9% 9.6% 9.3% 9.0% 8.6%
45% 43%
6.0% 6.3% 6.0% 5.5% 5.5% 10%
5.3% 5.2% 4.8%
2% Total retail = 55%
Residential mortgages Other retail loans
1Q14 2Q14 3Q14 4Q14 1Q15 2Q15 3Q15 4Q15 Consumer finance SME/Corporate loans
BELGIUM BU CZECH REPUBLIC BU INTERNATIONAL MARKETS BU
4.8% 4.6% 4.6% 4.2% 4.0% 4.1%
4.3% 4.2% 4.1% 34.6% 35.4% 34.8% 34.1% 33.4% 32.9%
4.0% 3.8% 3.8% 3.7% 31.4% 29.8%
3.5% 3.4% 3.4%
3.1% 3.1% 3.0% 2.9% 2.7% 2.6%
2.5% 2.6% 2.5% 2.2% 2.5% 2.4% 2.4% 2.2% 2.5% 2.5% 19.7% 20.8% 20.0% 19.0% 18.4% 17.9% 17.0% 16.0%
1Q14 2Q14 3Q14 4Q14 1Q15 2Q15 3Q15 4Q15 1Q14 2Q14 3Q14 4Q14 1Q15 2Q15 3Q15 4Q15 1Q14 2Q14 3Q14 4Q14 1Q15 2Q15 3Q15 4Q15
Impaired loans ratio * of which over 90 days past due **
* Impaired loans ratio : total outstanding impaired loans (PD 10-12)/total outstanding loans
** of which total outstanding loans with over 90 days past due (PD 11-12)/total outstanding loans 48Cover ratios
KBC GROUP BELGIUM BU
60.3% 63.1%
57.1% 57.6% 57.8% 57.9% 60.4%
53.6% 57.9% 56.0% 58.3% 57.6% 56.5%
50.7% 54.6%
49.8%
42.9% 43.9% 44.8% 44.7%
40.5% 41.7% 42.4% 42.4% 43.4% 43.6% 44.0%
39.0% 39.2% 40.3% 40.6% 41.1%
1Q14 2Q14 3Q14 4Q14 1Q15 2Q15 3Q15 4Q15 1Q14 2Q14 3Q14 4Q14 1Q15 2Q15 3Q15 4Q15
Impaired loans cover ratio
Cover ratio for loans with over 90 days past due
CZECH REPUBLIC BU INTERNATIONAL MARKETS BU
67.1% 66.6% 67.1% 65.1% 58.1%
63.2% 63.9% 54.5% 55.2% 55.6%
61.5% 61.3% 52.7%
50.1%
51.9% 54.2% 52.9% 53.4% 54.2% 53.6% 45.1% 45.4%
51.7% 50.0% 43.0%
39.8% 40.4% 41.7%
38.2% 39.3%
36.4% 36.6%
1Q14 2Q14 3Q14 4Q14 1Q15 2Q15 3Q15 4Q15 1Q14 2Q14 3Q14 4Q14 1Q15 2Q15 3Q15 4Q15
* Impaired loans cover ratio: total impairments (specific) for impaired loans / total outstanding impaired loans (PD10-12)
** Cover ratio for loans with over 90 days past due: total impairments (specific) for loans with over 90 days past due / total outstanding PD11-12 loans
49Investment portfolio (as per 31/12/2015)
INVESTMENT PORTFOLIO
(Total EUR 70bn)
Equities Other
SOVEREIGN BOND PORTFOLIO
Non-Financial bonds (Carrying value1 EUR 53bn)
2%
5% 1%
(Notional value EUR 49bn)
Covered bonds
7% Netherlands * Ireland **
Austria ** Portugal *
ABS Germany **
3% Spain
6%
Financial bonds
4% Other
7%
5% 41%
Other public bonds
France 10%
5%
73% Italy
Belgium
Sovereign bonds 5%
Slovakia 4%
2% 13%
Hungary
Poland ** Czech Rep.
(*) 1%, (**) 2%
1 Carrying value is the amount at which an asset [or liability] is recognised: for those not valued at fair value this is after deducting any accumulated depreciation
(amortisation) and accumulated impairment losses thereon, while carrying amount is equal to fair value when recognised at fair value
50Solid liquidity position (2)
Short term unsecured funding KBC Bank vs Liquid assets as of end December 2015 (*)
(bn EUR)
65,0
62,9
59,1 60,9
58,5
KBC maintains a solid liquidity position, given that:
376%
352% • Available liquid assets are more than 3.5 times the
362%
332% amount of the net recourse on short-term wholesale
333% funding
• Funding from non-wholesale markets is stable funding
18,5
from core-customer segments in core markets
17,7 18,4 17,4 15,6
4Q14 1Q15 2Q15 3Q15 4Q15
Net Short Term Funding Available Liquid Assets Liquid Assets Coverage
* Graphs are based on Note 18 of KBC’s quarterly report, except for the ‘available liquid assets’ and
‘liquid assets coverage’, which are based on the KBC Group Treasury Management Report
Ratios FY14 FY15 Target NSFR at 121% and LCR at 127% by the end of FY15
• Both ratios were well above the minimum target of at least
NSFR1 123% 121% >105%
105%, in compliance with the implementation of Basel 3
LCR1 120% 127% >105% liquidity requirements
1 Liquidity coverage ratio (LCR) is based on the Delegated Act requirements, while the Net
Stable Funding Ratio (NSFR) is based on KBC’s interpretation of current Basel Committee
guidance
51Appendices
Page nr.
1 Initial mortgage selection criteria 37
2 Underwriting and approval process 39
3 Credit risk management 41
4 Additional financial information on KBC 44
5 Supplementary information on Belgian mortgage market 50
52Lending market dominated by banks
MARKET SHARES OF BELGIAN MORTGAGE LENDING MARKET DOMINATED BY BANKS
MARKET
Specialised The four biggest market participants, KBC Bank
Insurance Mortgage NV, Belfius, BNP Paribas Fortis and ING control
Companies: Companies: nearly 70 per cent of the mortgage lending
1-2% 1-2% market
Other credit and financial institutions (smaller
banks, insurance companies, savings banks) and
mortgage shops cover the remaining 30 per cent
In 2013, KBC Bank NV held a solid market share
of 19% of total outstanding mortgage loans
Smaller
Banks:
The role of brokers is minimal
30-32% The mortgage market is 95% dominated by
banks, hence deeper insight into the financial
Top 4 Banks: situation of the mortgage taker
65-70% • Banks also have far better control over credit quality
and affordability of mortgage takers
53Contact Details
Ilya Vercammen Kurt de Baenst Alpha Peeters
Investor Relations Manager Investor Relations Manager Investor Relations Analyst
Email: Ilya.vercammen@kbc.be Email: kurt.debaenst@kbc.be Email: alpha.peeters@kbc.be
Work: (+32) (0)2 429 21 26 Work: (+32) (0)2 429 35 73 Work: (+32) (0)2 429 17 41
Mobile: (+32) 472 72 77 77 Mobile: (+32) (0)472 50 04 27 Mobile: (+32) (0)477 90 40 26
Mark Stout Enzo Soi Frederik Vyncke
Manager KBC Credit Investments
Structurer, KBC Credit Investments Manager, Group treasury
Structuring
Email: innocenzo.soi@ci.kbc.be Email: Frederik.vyncke@kbc.be
Email: mark.stout@ci.kbc.be
Work: (+32) (0)2 417 35 51 Work: (+32) (0)2 429 32 62
Work: (+32) (0)2 417 41 98
54Contact information
Investor Relations Office
E-mail : investor.relations@kbc.com
visit www.kbc.com for the lastest update
55You can also read