The hyperbolic geometry of financial networks - Nature
←
→
Page content transcription
If your browser does not render page correctly, please read the page content below
www.nature.com/scientificreports
OPEN The hyperbolic geometry
of financial networks
Martin Keller‑Ressel* & Stephanie Nargang
Based on data from the European banking stress tests of 2014, 2016 and the transparency exercise of
2018 we construct networks of European banks and demonstrate that the latent geometry of these
financial networks can be well-represented by geometry of negative curvature, i.e., by hyperbolic
geometry. Using two different hyperbolic embedding methods, hydra+ and Mercator, this allows us
to connect the network structure to the popularity-vs-similarity model of Papdopoulos et al., which
is based on the Poincaré disc model of hyperbolic geometry. We show that the latent dimensions
of ‘popularity’ and ‘similarity’ in this model are strongly associated to systemic importance and to
geographic subdivisions of the banking system, independent of the embedding method that is used.
In a longitudinal analysis over the time span from 2014 to 2018 we find that the systemic importance
of individual banks has remained rather stable, while the peripheral community structure exhibits
more (but still moderate) variability. Based on our analysis we argue that embeddings into hyperbolic
geometry can be used to monitor structural change in financial networks and are able to distinguish
between changes in systemic relevance and other (peripheral) structural changes.
Network models based on hyperbolic geometry have been successful in explaining the structural features of
informational1, social2 and biological n etworks3. Such models provide a mathematical framework to resolve the
conflicting paradigms of preferential attachment (attraction to popular nodes) and community effects (attraction
to similar nodes) in n etworks4–6.
Just as the geometric structure of a social network determines the diffusion of news, rumors or infective
diseases between i ndividuals7, the geometric structure of a financial network influences the diffusion of financial
stress between financial institutions, such as banks8–11. Indeed, the lack of understanding for risks originating
from the systemic interaction of financial institutions has been identified as a major contributing factor to the
global financial crisis of 200812. While many recent studies have analysed the mechanisms of financial contagion
in theoretical or simulation-based settings, less attention has been payed to the structural characteristics and
the geometric representation of real financial networks. Although evidence of hyperbolic structure has been
uncovered for international trade networks13, no such analysis has been carried out for networks of financial
institutions. Identifying a suitable geometric representation for such networks can help to monitor and quantify
structural change, and—in the case of hyperbolic geometry—even distinguish structural change in terms of
systemic importance from changes in the network’s peripheral structure. Moreover, a geometric representation
can form the basis of analytic models of contagion processes and their optimal control in future research.
Here, we consider financial networks inferred from bank balance sheet data, as collected and made available
by the European Banking Authority (EBA) within the European banking stress test and transparency exercises
of 2014, 2016 and 2 01814,15. We show that these networks can be embedded into low-dimensional hyperbolic
space with considerably smaller distortion than into Euclidean space of the same dimension, suggesting that
the paradigm of latent hyperbolic geometry also applies to financial networks. In addition, we demonstrate that
the hyperbolic geometric representation compares favorably to a degree-corrected stochastic block m odel16—a
popular non-geometric network model. Furthermore—following Papadopoulos et al.4—we decompose the
embedded hyperbolic coordinates into the dimensions of popularity and similarity and demonstrate that these
dimensions align with systemic importance and membership in regional banking clusters respectively. Finally,
the longitudinal structure of the data allows us to track changes in these dimensions over time, i.e., to track the
stability of systemic importance and of the peripheral community structure over time.
Results
Inference of financial networks. Contagion in financial networks is a complex process, which can take
place through several parallel (and potentially interacting) mechanisms and channels17. These mechanisms
include direct bank-to-bank liabilities18, bank runs19, and market-mediated contagion through asset sales17,20–22
Institute for Mathematical Stochastics, TU Dresden, 01062 Dresden, Germany. * email: martin.keller‑ressel@
tu‑dresden.de
Scientific Reports | (2021) 11:4732 | https://doi.org/10.1038/s41598-021-83328-4 1
Vol.:(0123456789)
www.nature.com/scientificreports/
Figure 1. Densities of edge weights (A) and of node strengths (B) in the EBA financial networks of 2014, 2016
and 2018.
(‘fire-sale contagion’); see also (French et al.12, p. 21ff). Here, we focus on the channel of fire-sale contagion,
which has been singled out—both in simulation21 and in empirical studies20—as a key mechanism of financial
contagion. Moreover, the propensity of fire-sale contagion can be quantified from available balance sheet data,
using liquidity-weighted portfolio overlap (LWPO)22,23 as an indicator (see “Methods” for details).
Our inference of financial networks follows a two-stage mechanism: First, we construct a weighted bipartite
network in which banks B = (b1 , . . . , bn ) are linked to a common pool of assets A = (a1 , . . . , am ), which consist
of sovereign bonds classified by issuing country and by different levels of maturity. In the second step we perform
a one-mode projection of this network on the node set B, using the LWPO of two banks bi , bj ∈ B to determine
the weight wij of the link between the corresponding nodes. For any of the years y ∈ {2014, 2016, 2018}, the result
is an undirected, weighted network Ny of banks, in which two banks are connected if and only if they hold com-
mon assets. The link weight wij , normalized to [0, 1], represents the susceptibility of two banks bi , bj to financial
contagion, quantified by their LWPO.
Network features. The inferred networks are very dense (densities: ρ2014 = 0.86, ρ2016 = 0.96,
ρ2018 = 1.00), i.e., almost all pairs of banks hold some common assets. However, the distribution of weights is
highly skewed (see Fig. 1A), with most of the connections exhibiting very small weights. In other words, the net-
works are dominated by a ‘sparse backbone’ of a few strong connections, which represent the dominant channels
of potential contagion of financial distress. The same skew is present in the distribution of node strengths (see
Fig. 1B) with a few strong nodes dominating over a majority of weaker nodes in all years.
To extract more salient connectivity information from these highly connected networks, we also consider
the ‘ p%-Backbone’ of each network, formed by the upper p%-quantile of highest-weighted edges (We have also
ltering24 as an alternative method for backbone extraction; see ‘Comparison of methods
considered disparity fi
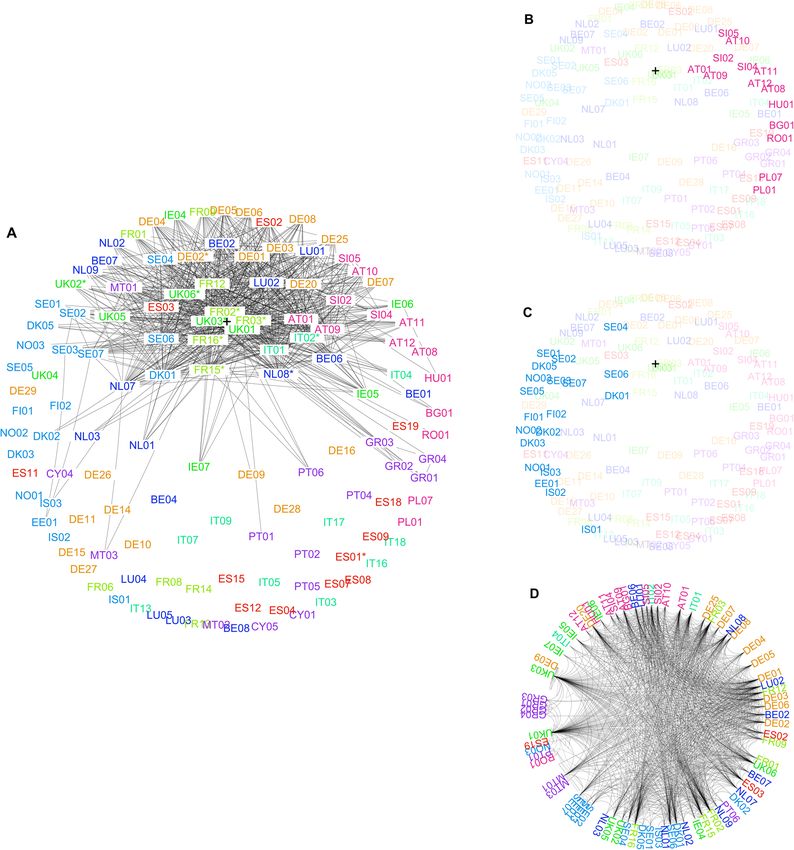
and robustness checks’ below.). Figure 2 shows the degree distribution and the local clustering coefficient (in
dependence on node degree) for the 10%- and the 25%-Backbone. While there is no evidence of a scale-free
degree distribution, the clustering coefficient displays an interesting pattern: It is highest for medium-degree
nodes and then decreases with increasing node degree. This indicates that high-degree nodes (i.e. highly con-
nected banks) typically act as hubs between lower-degree nodes (i.e. ‘normal’ banks) without a direct link.
Latent network geometry. Network representation methods. Our next objective was to uncover the
latent geometric network structure and to evaluate the suitability of a hyperbolic network model. (See “Meth-
ods” for background on hyperbolic geometry.) To this end, we applied four different network representation
methods (one method embedding into two-dim. Euclidean space E2, two methods embedding into two-dim.
hyperbolic space H2, and one non-geometric method) to the financial networks N2014 , N2016 and N2018 and their
p%-backbones for p = 10, 25, 50. The first two methods, multidimensional scaling25 (MDS) and hydra+26,27,
calculate stress-minimizing embeddings of the weighted network distances into Euclidean and hyperbolic ge-
ometry, respectively. The third method, Mercator28, is a connectivity-based method (i.e. ignoring network
weights) and uses a mix of machine learning and maximum likelihood estimation to infer latent coordinates in
a popularity-vs-similarity-model of hyperbolic geometry; see García-Pérez et al.28 for details. As non-geometric
representation method, we used a degree-corrected stochastic block model (dSBM)16, as implemented in the R-
package randnet29, which aims to represent network structure by inferring communities and their connection
probabilities; see Karrer and Newman16 for details. Since Mercator and dSBM are connectivity-based, they
can only be meaningfully applied to the network backbones. MDS and hydra+, on the other hand, can also be
applied to the full weighted networks and are directly comparable, since they minimize exactly the same objec-
tive function, but only differ in their target geometries. Figure 3 shows a comparison of the embedding quality
of the different methods. For the full networks, we use stress (i.e. the root mean square error between network
distances and embedded distances) as an evaluation metric, while for the backbones we use the AUPR (area
under the Precision-Recall-curve) from a network reconstruction task (see “Methods” for details).
Scientific Reports | (2021) 11:4732 | https://doi.org/10.1038/s41598-021-83328-4 2
Vol:.(1234567890)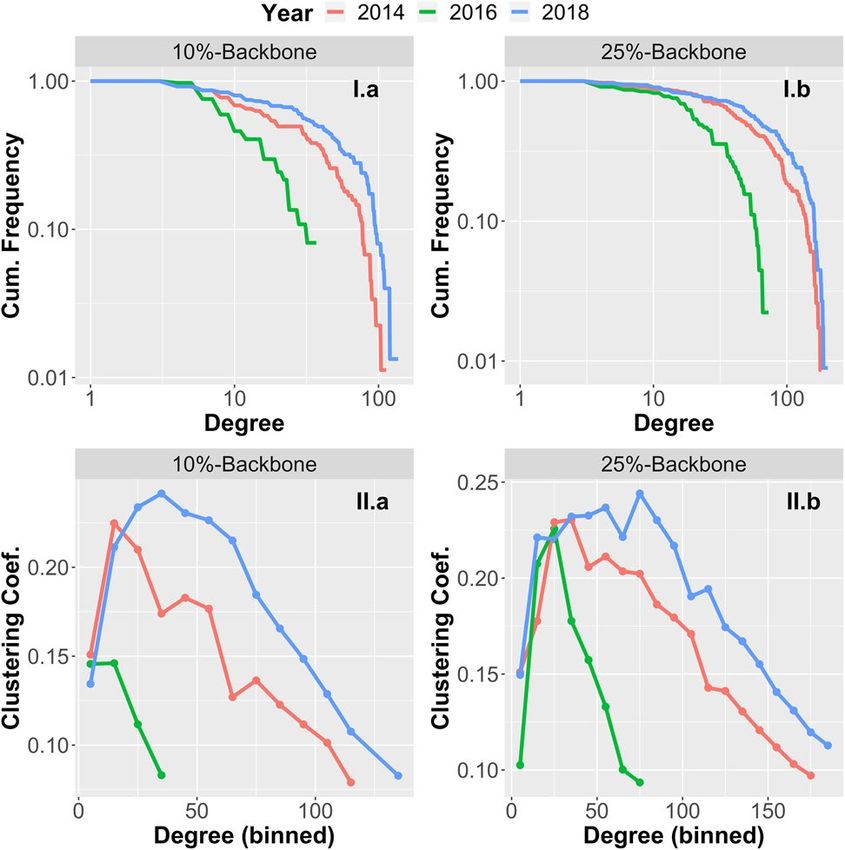
www.nature.com/scientificreports/

                                  Figure 2.  Degree distribution (I) and local clustering coefficients (II) in the 10%-backbone (a) and the
                                  25%-backbone (b) of the EBA financial networks of 2014, 2016 and 2018.

                                  Figure 3.  Panel (A): Stress (i.e. root mean square error) of network embeddings produced by hydra+
                                  (hyperbolic target space) and multidimensional scaling/MDS (Euclidean target space). Lower stress values
                                  indicate better embedding quality. Panels (B)–(D): Area-under-Precision-Recall-curve (AUPR) for the task of
                                  reconstructing network backbones based on network representations produced by Mercator and hydra+
                                  (hyperbolic target space), dSBM (non-geometric), and MDS (Euclidean target space). Higher AUPR values
                                  indicate better reconstruction performance.

                                  Comparison of methods and robustness checks. Our comparison shows that Mercator, based on hyperbolic
                                  geometry, outperforms all other methods in terms of network reconstruction performance, consistently over all
                                  three years of observation and independent of the threshold used for the extraction of the network backbone.
                                  The second hyperbolic embedding method, hydra+, yields results that are better or at least comparable to
                                  dSBM, while the Euclidean embedding method MDS performs worst. Also note that hydra+ and MDS are the
                                  only methods which can be directly applied to the full weighted network, in which case hydra+ clearly outper-
                                  forms MDS in terms of embedding error.

Scientific Reports |   (2021) 11:4732 |                https://doi.org/10.1038/s41598-021-83328-4                                                  3

                                                                                                                                              Vol.:(0123456789)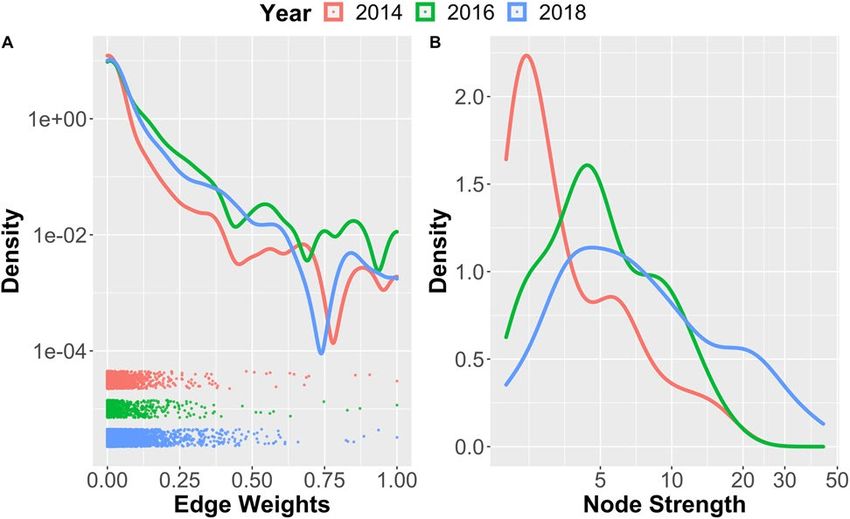
www.nature.com/scientificreports/
To check the robustness of our results with respect to the method of backbone extraction, we have repeated
the same analysis with backbones determined by disparity filtering24. The results are reported in supplemen-
tary Figure S1. While reconstruction quality deteriorates for all methods on the disparity filtered backbones,
the advantage of the hyperbolic methods over the non-geometric and Euclidean methods becomes even more
pronounced. Overall, we conclude that the latent geometry of the observed financial networks is—at least in low
dimension—much better represented by negatively curved (hyperbolic) rather than flat (Euclidean) geometry.
Moreover, the hyperbolic representations are superior even to the (non-geometric) degree-corrected stochastic
block model in terms of network reconstruction quality.
Latent hyperbolic coordinates. As a result of the hyperbolic embeddings we obtain for each bank node bi latent
coordinates (ri , θi ) in the Poincaré disc model of hyperbolic space (see “Methods”). This allows us to connect the
network embedding to the popularity-vs-similarity model of Papadopoulos et al.4 and the S1-model of Ánge-
les Serrano et al.28,30. The hyperbolic embedding of the full banking network of 2018 produced by hydra+
is shown in Fig. 4A. The embedding of the 10%-Backbone of the same network produced by Mercator is
shown in Fig. 4D. Note that the hydra+-embedding attempts to give a faithful representation of all distances
in the weighted network, whereas Mercator only encodes connectivity information and is harder to inter-
pret visually. This phenomenon is exacerbated by the laws of hyperbolic geometry, in which seemingly small
differences in the radial coordinate can represent large differences in hyperbolic distance. With reference to
Fig. 4A, the embedded network shows a clear core-periphery structure, in line with previous studies of financial
networks31,32 and in agreement with the pattern exhibited by the local clustering coefficient in Fig. 2.
Structural analysis. The popularity-vs-similarity model of Papadopoulos et al.4 and the S1-model of Ánge-
les Serrano et al.28,30 used by Mercator offer a direct interpretation of the latent hyperbolic network coordi-
nates in the Poincaré disc in terms of their popularity dimension (the radial coordinate r) and the similarity
dimension (the angular coordinate θ ). In the context of financial networks, we hypothesized that the popularity
dimension of a given bank aligns with its systemic importance, and that its similarity dimension is associated
with sub-sectors of the banking system, e.g., along geographic and regional divisions. Also for the hydra+
embedding, a theoretical foundation for interpreting r as popularity dimension and θ as similarity dimension
has been given27. However, due to the asymmetric distribution of banks within the Poincaré disc (Fig. 4A) for
the hydra+ embedding, we calculate its geodesic polar coordinates (ri , θi ) with respect to the network center-
of-weight, rather than the center of the Poincaré disc; see “Methods” for details (The fact that both approaches—
Mercator and re-centered hydra+—lead to qualitatively very similar results can be seen as a validation of
this methodology.). For the Mercator method we directly use the coordinates (ri , θi ) from the embedding of
the 25%-backbone and perform no additional centering.
To test the first hypothesis—the association between radial coordinate r and systemic importance—we labelled
a bank as systemically important in a given year, whenever it was included in the contemporaneous list of global
systemically important banks (G-SIBs) as published by the Financial Stability B oard33–35; see also Table 1. Using
a Wilcoxon–Mann–Whitney test, we find a significant association between radial rank and systemic importance
in all years and for both methods ( P2014 < .0001, P2016 < .0001 for both methods, P2018 = .0038 for hydra
and P2018 = 0.0001 for Mercator). In Table 2 we report the five top-ranked banks (most central in terms of
r) for each year.
To test the second hypothesis—the association between similarity dimension θ and regional banking sub-
sectors—we assigned banks to the following nine regional groups:
Spain (ES), Germany (DE), France (FR), Italy (IT), UK and Ireland (UK/IE), Nordic Region (EE/NO/SE/
DK/FI/IS), Benelux Region (BE/NE/LU), Southern/Mediterranean (GR/CY/MT/PT), Central/Eastern
Eur. (AT/BG/HU/LV/RO/SI).
These regions are reasonably balanced in terms of the number of banks included in the EBA panel. Using ANOVA
for circular data (see “Methods”) we find a highly significant association between the angular coordinate θ and
the regional group in all three years considered ( P < .0001 in all years for both methods). This indicates that the
peripheral community structure (away from the network core) of the EBA financial network is indeed strongly
aligned with geographic and regional divisions in Europe. We have highlighted two different regional groups in
Fig. 4B,C to illustrate the association between angular coordinate and regional structure.
Network structure over time. The longitudinal structure of the data set allows us to track changes in the
network structure over the whole time span of observations from 2014 to 2018. Note, however, that the samples
of banks included by the EBA vary substantially in size and—even when restricted to the smallest sample—
are not completely overlapping; see Table 3. Nevertheless, the embedding quality of the hyperbolic methods
(reported in Fig. 3) is surprisingly stable over all years. This suggests that the hyperbolic model does indeed
capture intrinsic qualities of the network, rather than relying on transitory structural artefacts.
We proceed to analyze the temporal changes in the latent radial coordinate r and angular coordinate θ , cor-
responding to changes in systemic importance and community structure. Note that the small sample of banks
included in the 2016 stress test restricts the number of banks that are included in this longitudinal analysis, cf.
Table 3. The scatter plots in Fig. 5 and the corresponding Pearson’s correlations of .678 (hydra+, P < .0001)
and .892 (Mercator, P < .0001) between 2014 and 2016, and .569 (hydra+, P = .0001) and .502 (Merca-
tor, P = .0015) between 2016 and 2018 show a significant positive association between hyperbolic centrality
in successive snap shots of the financial networks.
Scientific Reports | (2021) 11:4732 | https://doi.org/10.1038/s41598-021-83328-4 4
Vol:.(1234567890)
www.nature.com/scientificreports/
Figure 4. Hyperbolic Embeddings of the EBA Financial Network of 2018. Nodes are labelled by country
and bank ID and coloured according to region (see Table 1 for full names). Panel (A) shows the full network
embedding produced by the hydra+ method. Also shown is the top decile of strongest links, i.e., the
connections with the largest liquidity-weighted portfolio overlap. Banks labelled as systemically important by
the Financial Stability Board (G-SIBs) are indicated by asterisks. The black cross marks the capital-weighted
hyperbolic center of the banking network. In panels (B) and (C) the Central/Eastern and the Nordic regional
groups are highlighted to illustrate regional clustering. Panel (D) shows the hyperbolic embedding of the
10%-backbone of the same network, as produced by the Mercator method.
In panel Ia of Fig. 5, Nordea bank can be identified as a clear outlier, moving from a very central position in
2014 to a peripheral position in 2016. Interestingly, Nordea was one of just two banks (together with Royal Bank
of Scotland) which were removed from the list of G-SIBs in the subsequent update in 2018 due to decreasing sys-
temic importance35. In the Mercator embedding (panel IIa) Nordea bank does not appear as an outlier, which
is likely due to the fact that some structural information is lost when the full network is reduced to its backbone.
Scientific Reports | (2021) 11:4732 | https://doi.org/10.1038/s41598-021-83328-4 5
Vol.:(0123456789)www.nature.com/scientificreports/
ID Full name ID Full name
AT01 Erste Group Bank AG GR01 Eurobank Ergasias
AT08 BAWAG Group AG GR02 National Bank of Greece
Raiffeisen Bank Interna-
AT09 GR03 Alpha Bank
tional AG
Raiffeisenbankengruppe
AT10 GR04 Piraeus Bank
Verbund eGen
AT11 Sberbank Europe AG HU01 OTP Bank Ltd
AT12 Volksbanken Verbund IE04 AIB Group plc
BE01 Belfius Banque SA IE05 Bank of Ireland Group plc
Citibank Holdings Ireland
BE02 Dexia NV IE06
Limited
BE04 AXA Bank Europe SA IE07 DEPFA BANK Plc
BE06 KBC Group NV IS01 Arion banki hf
The Bank of New York
BE07 IS02 Íslandsbanki hf.
Mellon SA/NV
BE08 Investar IS03 Landsbankinn
BG01 First Investment Bank IT01 Intesa Sanpaolo S.p.A.
Hellenic Bank Public
CY01 IT02 UniCredit S.p.A.*
Company Ltd
Bank of Cyprus Holdings Banca Monte dei Paschi di
CY04 IT03
Public Limited Company Siena S.p.A.
Unione Di Banche Italiane
CY05 RCB Bank Ltd IT04 Società Cooperativa Per
Azioni
Banca Carige S.P.A. -
DE01 NRW.Bank IT05 Cassa di Risparmio di
Genova e Imperia
Banca Popolare
DE02 Deutsche Bank AG* IT07 Dell’Emilia Romagna -
Società Cooperativa
DE03 Commerzbank AG IT09 Banca Popolare di Sondrio
Landesbank Baden- Mediobanca - Banca di
DE04 IT13
Württemberg Credito Finanziario S.p.A.
Banco BPM Gruppo
DE05 Bayerische Landesbank IT16
Bancario
Norddeutsche Landes- Credito Emiliano Holding
DE06 IT17
bank-Girozentrale SpA
Iccrea Banca Spa Istituto
Landesbank Hessen-
DE07 IT18 Centrale del Credito
Thüringen Girozentrale
Cooperativo
DekaBank Deutsche Banque et Caisse
DE08 LU01
Girozentrale d’Epargne de l’Etat
DE09 Aareal Bank AG LU02 Precision Capital S.A.
Deutsche Apotheker- und J.P. Morgan Bank Luxem-
DE10 LU03
Ärztebank eG bourg S.A.
RBC Investor Services
DE11 HASPA Finanzholding LU04
Bank S.A.
Landeskreditbank Baden- State Street Bank Luxem-
DE14 LU05
Württemberg-Förderbank bourg S.A.
Landwirtschaftliche
DE15 MT01 Bank of Valletta plc
Rentenbank
Münchener Hypotheken-
DE16 MT02 Commbank Europe Ltd
bank eG
DZ Bank AG Deutsche
DE20 Zentral-Genossenschafts- MT03 MDB Group Limited
bank
Deutsche Pfandbriefbank Bank Nederlandse
DE25 NL01
AG Gemeenten N.V.
Erwerbsgesellschaft der Coöperatieve Centrale
DE26 S-Finanzgruppe mbH & NL02 Raiffeisen-Boerenleen-
Co. KG bank B.A.
HSH Beteiligungs Man- Nederlandse Waterschaps-
DE27 NL03
agement GmbH bank N.V.
State Street Europe Hold-
DE28 ings Germany S.à.r.l. & NL07 ABN AMRO Group N.V.
Co. KG
DE29 Volkswagen Bank GmbH NL08 ING Groep N.V.*
Continued
Scientific Reports | (2021) 11:4732 | https://doi.org/10.1038/s41598-021-83328-4 6
Vol:.(1234567890)www.nature.com/scientificreports/
ID Full name ID Full name
DK01 Danske Bank NL09 Volksholding B.V.
DK02 Jyske Bank NO01 DNB Bank Group
DK03 Sydbank NO02 SPAREBANK 1 SMN
DK05 Nykredit Realkredit NO03 SR-bank
EE01 AS LHV Group PL01 PKO BANK POLSKI
Bank Polska Kasa Opieki
ES01 Banco Santander* PL07
SA
Banco Bilbao Vizcaya
ES02 PT01 Caixa Geral de Depósitos
Argentaria
Banco Comercial Por-
ES03 Banco de Sabadell PT02
tuguês
Banco Financiero y de Caixa Central de Crédito
ES04 PT04
Ahorros Agrícola Mútuo, CRL
Caixa Económica
Caja de Ahorros y M.P. de
ES07 PT05 Montepio Geral, Caixa
Zaragoza
Económica Bancária SA
ES08 Kutxabank PT06 Novo Banco, SA
ES09 Liberbank RO01 Banca Transilvania
ES11 MPCA Ronda SE01 Nordea Bank AB (publ) †
Caja de Ahorros y Pen- Skandinaviska Enskilda
ES12 SE02
siones de Barcelona Banken AB (publ) (SEB)
Svenska Handelsbanken
ES15 Bankinter SE03
AB (publ)
Abanca Holding Financi-
ES18 SE04 Swedbank AB (publ)
ero, S.A.
Banco de Crédito Social
ES19 SE05 Kommuninvest - group
Cooperativo, S.A.
Länsförsäkringar Bank
FI01 OP-Pohjola Group SE06
AB - group
FI02 Kuntarahoitus Oyj SE07 SBAB Bank AB - group
Nova Ljubljanska banka
FR01 La Banque Postale SI02
d. d.
FR02 BNP Paribas* SI04 Abanka d.d.
FR03 Société Générale* SI05 Biser Topco S.à.r.l.
C.R.H. - Caisse de Refi- Royal Bank of Scotland
FR06 UK01
nancement de l’Habitat Group plc †
FR08 RCI Banque UK02 HSBC Holdings plc*
Société de Financement
FR09 UK03 Barclays plc*
Local
FR12 Groupe Crédit Mutuel UK04 Lloyds Banking Group plc
Banque Centrale de Com- Nationwide Building
FR13 UK05
pensation (LCH Clearnet) Society
Bpifrance (Banque Pub-
FR14 UK06 Standard Chartered Plc*
lique d’Investissement)
FR15 Groupe BPCE*
FR16 Groupe Crédit Agricole*
Table 1. IDs and full names of banks in the 2018 EBA Network. Banks marked by asterisk (*) were G-SIBs in
all years (2014, 2016, 2018); banks marked by dagger (†) were G-SIBs in 2014 and 2016, but not in 2018.
For the angular coordinate, we account for the circular nature of the variable and compute the circular cor‑
relation36 of the angular coordinates between successive years. Only moderate associations between successive
years can be observed at absolute circular correlation values of 0.211 (hydra+, P = .1877) and 0.01 (Merca-
tor, P = .9442) between 2014 and 2016 and 0.225 (hydra+, P = 0.1385) and 0.383 (Mercator, P = .0196)
between 2016 and 2018.
Discussion
Based on data from the EBA stress tests of 2014, 2016 and the transparency exercise of 2018, we have presented
strong evidence that the latent geometry of financial networks can be well-represented by geometry of negative
curvature, i.e., by hyperbolic geometry. Calculating embeddings into the Poicaré disc model of hyperbolic geom-
etry has allowed us to visualize this geometric structure and to connect it to the popularity-vs-similarity model of
Papdopoulos et al.4 and the S1-model of Ángeles Serrano et al.28,30. We find that the radial coordinate (‘popularity’)
is strongly associated with systemic importance (as assessed by the Financial Stability Board) and the angular
Scientific Reports | (2021) 11:4732 | https://doi.org/10.1038/s41598-021-83328-4 7
Vol.:(0123456789)www.nature.com/scientificreports/
Rank (hydra+) 2014 2016 2018
1 Nordea* BNP Paribas* Groupe BPCE*
2 Royal Bank of Scotland* UniCredit* Barclays*
3 Barclays* ING Groep* Royal Bank of Scotland
4 Intesa Sanpaolo Deutsche Bank* Groupe Crédit Agricole*
5 UniCredit* Intesa Sanpaolo BNP Paribas*
Rank (Mercator) 2014 2016 2018
1 Deutsche Bank* BNP Paribas* Royal Bank of Scotland
2 BNP Paribas* Deutsche Bank* BNP Paribas*
3 Groupe Crédit Agricole* HSBC* Société Générale*
4 Commerzbank ING Groep* Groupe Crédit Agricole*
5 UniCredit* UniCredit* Barclays*
Table 2. For each year the five banks with the highest hyperbolic centrality (i.e., smallest r coordinate) are
listed. The upper subtable corresponds to the hydra+ embedding of the full network and the lower subtable
to the Mercator embedding of its 25%-backbone. Asterisks denote banks that are considered globally
systemic relevant institutions (G-SIBs).
2014 2016 2018
Number of banks (n) 119 51 128
Of which included in the subseq. year 43 41
Table 3. Sample sizes of EBA data sets
coordinate (‘similarity’) with geographic and regional subdivisions. A longitudinal analysis shows that—in the
observation period from 2014 to 2018—systemic importance of banks within the European banking network has
stayed rather stable and has been predominated by only gradual changes. The peripheral community structure
has been more variable, but has remained strongly determined by geographical divisions in all years considered.
From a broader perspective, our results indicate that hyperbolic network representations could be important
tools for regulators to monitor structural change in financial networks, as they are able to distinguish changes in
the systemic importance (popularity) of financial institutions from ‘peripheral changes’ (similarity) which are less
relevant from a regulator’s perspective. Furthermore, our research provides an empirical basis for using hyper-
bolic geometry as a model space for the modelling of contagion processes and their optimal control in financial
(or other) networks. Instead of modelling such processes by simulation on individual networks, a geometric
model space provides the opportunity of analytic models that provide deeper insights beyond a specific case.
Methods
Data preparation and inference of financial networks. The financial networks were extracted from
three different publicly available data sets stemming from the stress tests (in 2014 and 2016) and the EU-wide
transparency exercise (in 2018) of the European Banking Authority (EBA)14,15. The data sets contain detailed
balance sheet information from all European banks (EU incl. UK + Norway) included in the stress test/trans-
parency exercise of the EBA in the respective year. From these data sets we extracted the portfolio values of all
sovereign bonds held by the banks, split by issuing country (38 countries) and three levels of maturity (short:
0M-3M, medium: 3M-2Y, long: 2Y-10Y+), resulting in m = 38 × 3 = 114 different asset classes.
For each year, this data was stored as the weighted adjacency matrix P (‘portfolio matrix’) of a bipartite net-
work. The n rows of P correspond to the banks in the sample, the m columns to the different asset classes, and
the element Pik to the portfolio value (in EUR) of asset k in the balance sheet of bank i. To perform a one-mode
projection of this bipartite network, we followed Cont and W agalath23,37 as well as Cont and S chaanning22: We
computed the liquidity-weighted portfolio overlap (LWPO) of bank i and bank j as
m
Pik Pjk
Lij = , (1)
dk
k=1
where dk is the market depth for asset k22. The LWPO measures the impact of a sudden liquidation of the port-
folio of bank i on the portfolio value of bank j and vice versa. Hence, it quantifies the risk of fire-sale contagion
between the banks in a financial stress scenario. The market depth of asset k was estimated from P as its total
volume held by all banks in the sample, i.e., as dk = ni=1 Pik. Writing D for the diagonal matrix of market depths,
(1) can be succinctly written as matrix product L = PD−1 P ⊤. Finally, we set the link weight wij between bank
bi and bj in the one-mode projection N of the banking network equal to the normalized LWPO between banks
bi and bj , i.e., wij := Lij / max i,j Lij
Scientific Reports | (2021) 11:4732 | https://doi.org/10.1038/s41598-021-83328-4 8
Vol:.(1234567890)www.nature.com/scientificreports/
Figure 5. Changes in radial coordinate r (low values indicate high centrality) between 2014 and 2016 (a) and
2016 and 2018 (b) for the hydra+-embedding (I) and the Mercator-embedding (II). Banks considered
systemically relevant (G-SIBs) at the end of the time period are marked in red. Nordea bank is circled in the
panel Ia and IIa; see text for background.
Background on hyperbolic geometry. The hyperboloid model. Hyperbolic geometry can be character-
ized as the geometry of a space of constant negative curvature, while the more familiar Euclidean geometry is
the geometry of a flat space, i.e., a space of zero curvature. In the hyperboloid model of hyperbolic geometry38,39,
d-dimensional hyperbolic space Hd is defined as the hyperboloid
Hd = x ∈ Rd+1 : x02 − x12 − · · · − xd2 = 1, x0 > 0 equipped with distance dH (x, y) = arcosh x0 y0 − x1 y1 − · · · − xd yd .
In fact, Hd endowed with the Riemannian metric tensor ds2 = dx02 − dx12 − · · · − dxd2 is a Riemannian manifold
and dH (x, y) is the corresponding Riemannian distance38,39. The sectional curvature of this manifold is constant
and equal to −1. Thus, Hd is indeed a model of geometry of constant negative curvature.
The Poincaré disc model. While the hyperboloid model is convenient for computations, a more preferable (and
popular) model for visualizations in dimension d = 2 is the Poincaré disc model38, which also forms the basis of
the popularity-vs-similarity model of Papadopoulos et al.4. To obtain the Poincaré disc
model, the hyperboloid
H2 is mapped to the open unit disc (‘Poincaré disc’) D = z ∈ R2 : z1 2 + z2 2 < 1 , parameterized by hyper-
bolic polar coordinates as z1 = tanh(r/2) cos θ , z2 = tanh(r/2) sin θ , using the stereographic projection38
r = log x0 + x02 − 1 , θ = atan′ (x2 , x1 ), x = (x0 , x1 , x2 ) ∈ H2 , (2)
where atan′ is the quadrant-preserving arctangent (The quadrant-preserving arctangent atan′ (x2 , x1 ), well-
defined unless x1 = x2 = 0, returns the unique angle θ ∈ [0, 2π) which solves tan θ = x2 /x1 and points to the
same quadrant as (x1 , x2 ). It is commonly implemented in scientific computing environments (e.g. in MATLAB
or R) as atan2.). In the Poincaré disc model, the hyperbolic distance becomes
Scientific Reports | (2021) 11:4732 | https://doi.org/10.1038/s41598-021-83328-4 9
Vol.:(0123456789)www.nature.com/scientificreports/
dB ((r1 , θ1 ), (r2 , θ2 )) = arcosh (cosh(r1 ) cosh(r2 ) − sinh(r1 ) sinh(r2 ) cos(θ1 − θ2 ))
and geodesic lines are represented by arcs of (Euclidean) circles intersected with D.
Stress‑minimizing embeddings and hyperbolic centering. Stress‑minimizing embeddings. Stress-
minimizing embedding methods aim to find—for each network node bi—latent coordinates x i in a geometric
model space G, such that the geodesic distance between x i and x j in G matches—as closely as possible—a given
dissimilarity measure dij (such as the weighted network distance) between nodes bi and bj . This is achieved by
minimizing the stress functional
1 2
geom
1 n
Stress(x , . . . , x ) =
dij network − dG (x i , x j ) ,
n(n − 1) (3)
i,j
which measures the root mean square error between given network distances and the corresponding distances in
the model space. For Euclidean geometry, this method is well-known as multidimensional scaling25,40, or—using
geom
a weighted stress functional—as Sammon m apping41. For hyperbolic space, i.e., when dG = dH , several opti-
mization methods for (3) have been p
roposed 26,27,42
. We use the hydra+ method implemented in the package
hydra for the statistical computing environment R43.
Hyperbolic centering. For a point cloud x 1 , . . . , x n in Hd and non-negative weights w1 , . . . , wn summing to
one, the hyperbolic mean
ori hyperbolic center of weight can
36 44
be determined as follows: Calculate the weighted
Euclidean mean x̄ = wi x , and its ‘resultant length’ ρ = (x̄0 )2 − (x̄1 )2 − · · · − (x̄d )2 , which is a measure
of dispersion for the point cloud. The hyperbolic center c is then determined as c = x̄/ρ and is again an element
of Hd . The point cloud can be centered at c by transforming each point as x̃ i = T−c x i , where Tc is the hyperbolic
translation matrix (‘Lorentz boost’)
c0
c̄ ⊤
Tc = with c = (c0 , c̄) = (c0 , c1 , . . . , cd ).
c̄ Id + c̄c̄ ⊤
In dimension d = 2, the stereographic projection (2) can then be applied to convert the centered coordinates x̃ i
to centered polar coordinates (ri , θi ) in the Poincaré disc.
Application to financial networks. For the hydra+ embedding, the described methods were applied
to the financial networks inferred from the EBA data as follows: We converted the similarity weights wij (nor-
malized LWPO) to dissimilarities dij = 1 − wij . We embedded these dissimilarities by minimizing the stress
functional (3), using the R-package hydra. For the resulting network embeddings, we calculated the capital-
weighted network center c as the weighted hyperbolic mean with weights wi proportional to the total capital
k=1 Pik of bank i invested in all assets a1 , . . . am. After centering at the hyperbolic center c, we calculated the
m
coordinates (ri , θi ) by the stereographic projection (2).
For the Mercator embedding and the dSBM, we first extracted network backbones, both by simple thresh-
olding and by disparity filtering24. The resulting backbones were used as input for the methods provided at https
://github.com/networkgeometry/mercator and the implementation of dSBM in the R-package randnet. Mer-
cator outputs latent coordinates (ri , θi ) in the Poincaré disc, and the output of the dSBM method is a matrix
of connection probabilities p̂ij for each node pair.
For multi-dimensional scaling (MDS) the same methodology as for hydra+ was used, except that Euclidean
geom
distance (instead of hyperbolic distance) was used as dG in the objective function (3).
Analysis of embedding results. AUPR and network reconstruction. To evaluate the embedding results
of the network backbones, we used the following network reconstruction task: To each pair of nodes (bi , bj ), as-
geom geom
sign the score dG (xi , xj )−1, where dG is the geodesic distance in the geometric model space G, or—in case
of the degree-corrected stochastic block model—the score p̂ij , where p̂ij is the estimated connection probability
between nodes i and j. Based on these scores we predict whether an edge is present between nodes (bi , bj ) or not,
and construct the Precision-Recall(PR)-curve45 of this classifier. The area under the PR-curve (AUPR) measures
the quality of this predictor, with an AUPR of 1.0 representing perfect prediction.
Wilcoxon–Mann–Whitney test. The Wilcoxon–Mann–Whitney46 test is a non-parametric test to decide
whether the distributions of two populations are identical without assuming them to follow the normal distribu-
tion. Let X be a sample of size m from the first population and Y be a sample of size n from the second popula-
tion. Consider the combined sample of size m + n ordered from least to greatest and denote the ranks of Yi in
this joint ordering by Si , i = 1, . . . , n. Then the test statistic W = ni=1 Si is the sum of the ranks assigned to the
values of Y.
ANOVA for circular data. With the Analysis of Variance for circular data36, we test for the equality of p mean
directions from independent circular (i.e. taking values on the unit circle) populations with von-Mises (M) dis-
tribution and the same (unknown) concentration parameter κ. We test the null hypothesis H0 : µ1 = . . . = µp,
where µi are the mean directions for the p populations following a M(µi , κ) distribution. For any circular obser-
vation θ , denote s = sin(θ), c = cos(θ) and let s̄i , c̄i be the averages within the i-th population. Let ni be the
Scientific Reports | (2021) 11:4732 | https://doi.org/10.1038/s41598-021-83328-4 10
Vol:.(1234567890)www.nature.com/scientificreports/
p
sample size, Ri = s̄i2 + c̄i2 the mean resultant length of the i-th population, and let n = i=1 ni be the size of
the combined sample and R the overall mean resultant length based on all n observations. The identity
p
p
p
p
n−R = n− Ri + Ri − R = (ni − Ri ) + Ri − R
i=1 i=1 i=1 i=1
p
2 36 and therefore, the test statistic F = ( Ri −R)/(p−1)
has the approximate χ 2 decomposition χn−1
2 2
= χn−p + χp−1 p i=1
i=1 (ni −Ri )/(n−p)
can be derived. The null hypothesis is rejected for a given confidence level α , when F > Fp−1,n−p;α , where
Fp−1,n−p;α is the α-quantile of the F-distribution with p − 1 and n − p degrees of f reedom36.
Data availability
The data analysed during the current study are available from the website of the European Banking Authority at
https://www.eba.europa.eu/risk-analysis-and-data/eu-wide-stress-testing and https://eba.europa.eu/risk-analy
sis-and-data/eu-wide-transparency-exercise/2018.
Received: 30 April 2020; Accepted: 1 February 2021
References
1. Shavitt, Y. & Tankel, T. On the curvature of the internet and its usage for overlay construction and distance estimation. In IEEE
INFOCOM 2004, vol. 1 (IEEE, 2004).
2. Muscoloni, A., Thomas, J. M., Ciucci, S., Bianconi, G. & Cannistraci, C. V. Machine learning meets complex networks via coalescent
embedding in the hyperbolic space. Nat. Commun. 8, 1–19 (2017).
3. Alanis-Lobato, G., Mier, P. & Andrade-Navarro, M. A. Manifold learning and maximum likelihood estimation for hyperbolic
network embedding. Appl. Netw. Sci. 1, 1–14 (2016).
4. Papadopoulos, F., Kitsak, M., Serrano, M. Á., Boguná, M. & Krioukov, D. Popularity versus similarity in growing networks. Nature
489, 537 (2012).
5. Papadopoulos, F., Psomas, C. & Krioukov, D. Network mapping by replaying hyperbolic growth. IEEE/ACM Trans. Netw. (TON)
23, 198–211 (2015).
6. Barabasi, A.-L. Luck or reason. Nature 486, 507–509 (2012).
7. Brockmann, D. & Helbing, D. The hidden geometry of complex, network-driven contagion phenomena. Science 342, 1337–1342
(2013).
8. Cont, R., Moussa, A. & Santos, E. B. Network structure and systemic risk in banking systems. In Network Structure and Systemic
Risk in Banking Systems (ed. Jean-Pierre Fouque, J. A. L.) (Cambridge University Press, Cambridge, 2010).
9. Battiston, S., Gatti, D. D., Gallegati, M., Greenwald, B. & Stiglitz, J. E. Liaisons dangereuses: increasing connectivity, risk sharing,
and systemic risk. J. Econ. Dyn. Control 36, 1121–1141 (2012).
10. Roukny, T., Bersini, H., Pirotte, H., Caldarelli, G. & Battiston, S. Default cascades in complex networks: topology and systemic
risk. Sci. Rep. 3, 2759 (2013).
11. Battiston, S., Caldarelli, G., May, R. M., Roukny, T. & Stiglitz, J. E. The price of complexity in financial networks. Proc. Natl. Acad.
Sci. 113, 10031–10036 (2016).
12. French, K. et al. The Squam Lake report: fixing the financial system. J. Appl. Corp. Finance 22, 8–21 (2010).
13. García-Pérez, G., Boguñá, M., Allard, A. & Serrano, M. Á. The hidden hyperbolic geometry of international trade: world trade
atlas 1870–2013. Sci. Rep. 6, 33441 (2016).
14. European Banking Authority. EU-wide stress testing. https://www.eba.europa.eu/risk-analysis-and-data/eu-wide-stress-testing.
15. European Banking Authority. EU-wide transparency exercise. https://eba.europa.eu/risk-analysis-and-data/eu-wide-transparen
cy-exercise/2018.
16. Karrer, B. & Newman, M. E. Stochastic blockmodels and community structure in networks. Phys. Rev. E 83, 016107 (2011).
17. Caccioli, F., Farmer, J. D., Foti, N. & Rockmore, D. Overlapping portfolios, contagion, and financial stability. J. Econ. Dyn. Control.
51, 50–63. https://doi.org/10.1016/j.jedc.2014.09.041 (2015).
18. Eisenberg, L. & Noe, T. H. Systemic risk in financial systems. Manag. Sci. 47, 236–249 (2001).
19. Brown, M., Trautmann, S. T. & Vlahu, R. Understanding bank-run contagion. Manag. Sci. 63, 2272–2282 (2017).
20. Shleifer, A. & Vishny, R. W. Liquidation values and debt capacity: a market equilibrium approach. J. Finance 47, 1343–1366. https
://doi.org/10.1111/j.1540-6261.1992.tb04661.x (1992).
21. Glasserman, P. & Young, H. P. How likely is contagion in financial networks?. J. Bank. Finance 50, 383–399. https: //doi.org/10.1016/j.
jbankfin.2014.02.006 (2015).
22. Cont, R. & Schaanning, E. Fire sales, indirect contagion and systemic stress testing. Norges Bank Working Paper 02/2017 (2017).
23. Cont, R. & Wagalath, L. Fire sales forensics: measuring endogenous risk. Math. Finance 26, 835–866 (2016).
24. Serrano, M. Á., Boguná, M. & Vespignani, A. Extracting the multiscale backbone of complex weighted networks. Proc. Natl. Acad.
Sci. 106, 6483–6488 (2009).
25. Kruskal, J. B. & Wish, M. Multidimensional Scaling Vol. 11 (Sage, Thousand Oaks, CA, 1978).
26. Chowdhary, K. & Kolda, T. G. An improved hyperbolic embedding algorithm. J. Complex Netw. 6, 321–341 (2017).
27. Keller-Ressel, M. & Nargang, S. Hydra: a method for strain-minimizing hyperbolic embedding of network- and distance based
data. J. Complex Netw. 8, cnaa002 (2020).
28. García-Pérez, G., Allard, A., Serrano, M. Á. & Boguñá, M. Mercator: uncovering faithful hyperbolic embeddings of complex
networks. New J. Phys. 21, 123033 (2019).
29. Li, T., Levina, E. & Zhu, J. randnet: Random Network Model Selection and Parameter Tuning. R package version 0.2 (2019).
30. Serrano, M. A., Krioukov, D. & Boguná, M. Self-similarity of complex networks and hidden metric spaces. Phys. Rev. Lett. 100,
078701 (2008).
31. Boss, M., Elsinger, H., Summer, M. & Thurner, S. Network topology of the interbank market. Quant. Finance 4, 677–684 (2004).
32. Langfield, S., Liu, Z. & Ota, T. Mapping the UK interbank system. J. Bank. Finance 45, 288–303 (2014).
33. Financial Stability Board. 2014 update of list of global systemically important banks (G-SIBs). https://www.fsb.org/2014/11/2014-
update-of-list-of-global-systemically-important-banks/.
34. Financial Stability Board. 2016 list of global systemically important banks (G-SIBs). https: //www.fsb.org/2016/11/2016-list-of-globa
l-systemically-important-banks-g-sibs/.
Scientific Reports | (2021) 11:4732 | https://doi.org/10.1038/s41598-021-83328-4 11
Vol.:(0123456789)www.nature.com/scientificreports/
35. Financial Stability Board. 2018 list of global systemically important banks (G-SIBs). https: //www.fsb.org/2018/11/2018-list-of-globa
l-systemically-important-banks-g-sibs/.
36. Mardia, K. V. & Jupp, P. E. Directional Statistics (Wiley, Hoboken, 2009).
37. Cont, R. & Wagalath, L. Running for the exit: distressed selling and endogenous correlation in financial markets. Math. Finance:
Int. J. Math. Stat. Financ. Econ. 23, 718–741 (2013).
38. Ratcliffe, J. G. Foundations of Hyperbolic Manifolds Vol. 3 (Springer, Berlin, 1994).
39. Cannon, W. J., Floyd, W. J., Kenyon, R. & Parry, W. R. Hyperbolic geometry. In Flavors of Geometry 31st edn (ed. Levy, S.) 59–115
(MSRI Publications, Cambridge, 1997).
40. Borg, I. & Groenen, P. Modern multidimensional scaling: theory and applications. J. Educ. Meas. 40, 277–280 (2003).
41. Sammon, J. W. A nonlinear mapping for data structure analysis. IEEE Trans. Comput. 100, 401–409 (1969).
42. Zhao, X., Sala, A., Zheng, H. & Zhao, B. Y. Efficient shortest paths on massive social graphs. In 7th International Conference on
Collaborative Computing: Networking, Applications and Worksharing (CollaborateCom) 77–86. (IEEE, 2011).
43. R Core Team. R: A Language and Environment for Statistical Computing (R Foundation for Statistical Computing, Vienna, 2019).
44. Galperin, G. A concept of the mass center of a system of material points in the constant curvature spaces. Commun. Math. Phys.
154, 63–84 (1993).
45. Saito, T. & Rehmsmeier, M. The precision-recall plot is more informative than the ROC plot when evaluating binary classifiers on
imbalanced datasets. PLoS ONE 10, e0118432 (2015).
46. Wilcoxon, F. Individual comparisons by ranking methods. Biometr. Bull. 1, 80–83 (1945).
Author contributions
M.K.-R. conceived the study, S.N. prepared the data, M.K.-R. and S.N. analyzed the results. M.K.-R wrote the
main manuscript text and all authors reviewed the manuscript.
Funding
Open Access funding enabled and organized by Projekt DEAL.
Competing interests
The authors declare no competing interests.
Additional information
Supplementary information is available for this paper at https://doi.org/10.1038/s41598-021-83328-4.
Correspondence and requests for materials should be addressed to M.K.-R.
Reprints and permissions information is available at www.nature.com/reprints.
Publisher’s note Springer Nature remains neutral with regard to jurisdictional claims in published maps and
institutional affiliations.
Open Access This article is licensed under a Creative Commons Attribution 4.0 International
License, which permits use, sharing, adaptation, distribution and reproduction in any medium or
format, as long as you give appropriate credit to the original author(s) and the source, provide a link to the
Creative Commons licence, and indicate if changes were made. The images or other third party material in this
article are included in the article’s Creative Commons licence, unless indicated otherwise in a credit line to the
material. If material is not included in the article’s Creative Commons licence and your intended use is not
permitted by statutory regulation or exceeds the permitted use, you will need to obtain permission directly from
the copyright holder. To view a copy of this licence, visit http://creativecommons.org/licenses/by/4.0/.
© The Author(s) 2021
Scientific Reports | (2021) 11:4732 | https://doi.org/10.1038/s41598-021-83328-4 12
Vol:.(1234567890)You can also read