Quantifying Bicycle Network Connectivity in Lisbon Using Open Data - MDPI
←
→
Page content transcription
If your browser does not render page correctly, please read the page content below
information
Article
Quantifying Bicycle Network Connectivity in Lisbon
Using Open Data †
Lorena Abad *         and Lucas van der Meer
 NOVA Information Management School (NOVA-IMS), Universidade Nova de Lisboa, Campus de Campolide,
 1070-032 Lisbon, Portugal; luukvandermeer@live.nl
 * Correspondence: lore.abad6@gmail.com
 † This paper is an extended version of our presentation in the workshop “Open Data for Open Cities V 2.0”,
    Lund, Sweden, 12 June 2018.

 Received: 31 October 2018; Accepted: 15 November 2018; Published: 17 November 2018

 Abstract: Stimulating non-motorized transport has been a key point on sustainable mobility agendas
 for cities around the world. Lisbon is no exception, as it invests in the implementation of new bike
 infrastructure. Quantifying the connectivity of such a bicycle network can help evaluate its current
 state and highlight specific challenges that should be addressed. Therefore, the aim of this study
 is to develop an exploratory score that allows a quantification of the bicycle network connectivity
 in Lisbon based on open data. For each part of the city, a score was computed based on how many
 common destinations (e.g., schools, universities, supermarkets, hospitals) were located within an
 acceptable biking distance when using only bicycle lanes and roads with low traffic stress for cyclists.
 Taking a weighted average of these scores resulted in an overall score for the city of Lisbon of only
 8.6 out of 100 points. This shows, at a glance, that the city still has a long way to go before achieving
 their objectives regarding bicycle use in the city.

 Keywords: bicycle network analysis; levels of traffic stress; sustainable mobility; open data; bicycle
 network connectivity; BNA score

1. Introduction
      Stimulating non-motorized transport has been one of the many strategies adopted by cities
to tackle climate change [1] and boost their inhabitants’ living conditions. Introducing sustainable
mobility into an urban planning agenda has beneficial effects on public health, as it decreases air
pollution and stimulates physical activity [2–6]. Additionally, it has proven to reduce traffic jams [7]
and reactivate public spaces [8]. Therefore, investing in cycling and pedestrian infrastructure is a
critical part of transportation policies in metropolitan areas.
      The city of Lisbon has undertaken this investment by establishing new cycle ways and public
bike-sharing stations, i.e., Gira Bicicletas [9]. The municipality hopes to turn the bicycle into a means
of transport that, along with public transportation, will enable inhabitants to make safe and efficient
short distance journeys, up to six kilometers, without the use of motorized private transport [10,11].
This is happening in a city where 89% of commuters use a private vehicle [12], with a car occupancy of
1.2 passengers per vehicle [13]. The municipality originally presented a plan which would introduce
more than 150 km of new cycle ways (Figure 1) into the city’s infrastructure by 2018 [14]. However, by
early 2018, only 80 km of the proposed routes had actually been built. The planned completion date
has been pushed back to 2020 [15].

Information 2018, 9, 287; doi:10.3390/info9110287                         www.mdpi.com/journal/information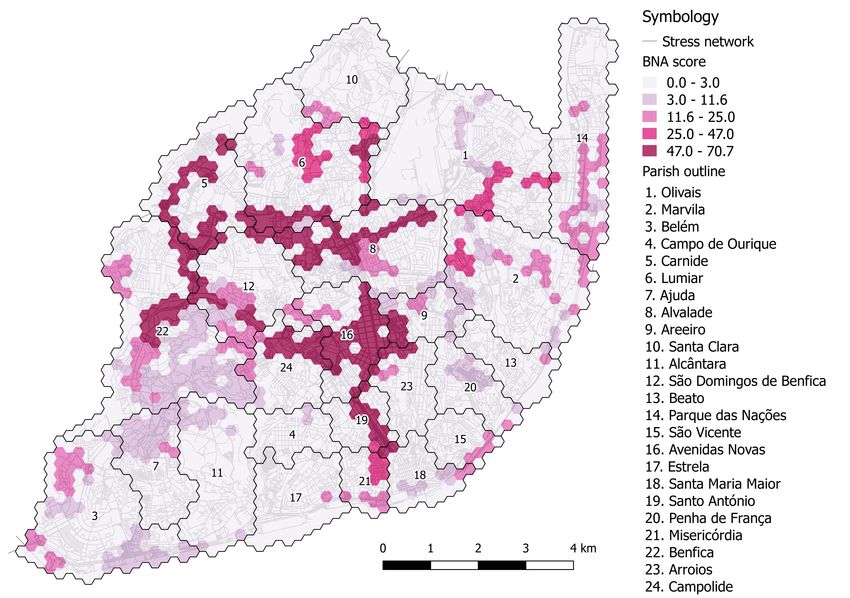
Information 2018, 9, 287                                                                                  2 of 14

      Figure 1. Existing (green) and proposed (dashed yellow) biking infrastructure according to the Lisbon
      City Council. Source: [16]

      In the meantime, Lisbon’s cyclists have increased in number [17], which intensifies the need
to invest in well-connected and safe infrastructure, not only for regular commuter trips, but also
for trips to common destinations (e.g., schools, universities, supermarkets, hospitals). Quantifying
the bicycle network’s connectivity can help city officials to evaluate its current state and identify
specific challenges that should be addressed. The use of publicly available data sources should be
favored for such inquiries, given their ease of access and knowledge sharing, constant updates, and
reproducibility [18,19]. Therefore, the aim of this study is to develop an exploratory score that allows a
quantification of the bicycle network connectivity in Lisbon based on open data, as a first attempt to
apply such an index to a European city with a developing biking infrastructure.
      The remainder of this paper will be structured as follows: Section 2 provides an overview of
work related to bicycle network connectivity. Section 3 describes the specific approach on which this
study is based. Section 4 details the adapted methodology applied to address the particular case of the
Lisbon study area. Section 5 presents the main results, discusses them within the context of Lisbon,
and compares them to other cities’ examples. Section 6 suggests directions for future research and
development and, finally, Section 7 concludes the report and summarizes its limitations.

2. Background
     Bicycle network analyses have been undertaken from several angles, making use of GIS
tools [20,21]. Connectivity analyses and measures have been developed and applied to understand
how accessible a city’s bike infrastructure really is (see Chapter 3 of [22] for an overview of these
methods).
     A recurrent approach within the literature is the quantification of cyclists’ perceived traffic
stress [23,24]. Mekuria, Furth and Nixon [25] proposed a scheme to classify road segments into four
levels of traffic stress (LTS), ranging from LTS 1, the level suitable for children; to LTS 4, the level
tolerated by “strong and fearless” cyclists [26]. Their approach was tested via a case study in San
Diego, California, in which every street and crossing was classified by LTS. In later work, Furth,
Mekuria and Nixon [27] developed a measure for the connectivity of low stress cycling networks,
using origin-destination data from home-to-work trips. Applying their methodology once again in
San Diego, California, they concluded that the road network is divided into disconnected islands of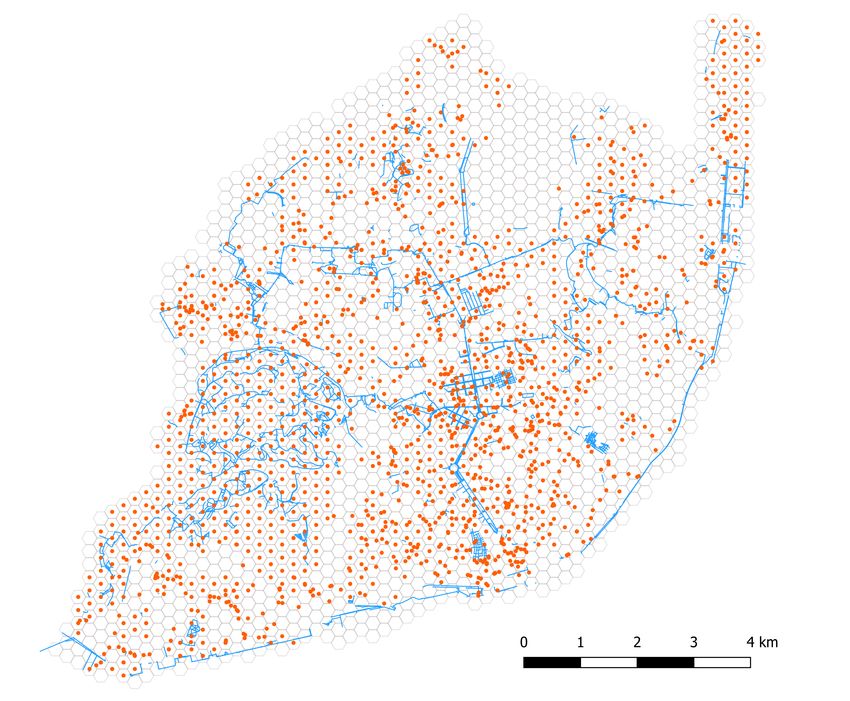
Information 2018, 9, 287                                                                             3 of 14

low-stress segments. Investments in new bicycle infrastructure between such islands could drastically
improve the connectivity of low-stress networks.
     Building on the findings of [25], Lowry et al. [28] created a tool for transportation planners to rank
more than 750 bicycle improvement projects from the Seattle, Washington’s Bicycle Master Plan, based
on their potential to connect homes and important destinations over a low-stress network. The same
master plan was evaluated in [29], by comparing the bicycle network connectivity for different types of
cyclists and different neighborhoods in Seattle, in both the existing and proposed situation. The results
showed that connectivity differs between neighborhoods and types of cyclists, and emphasized the
importance of policies and programs that increase the confidence of cyclists. Both [28,29] focused
solely on utilitarian travel, and did not distinguish between destinations of varying importance.
     Boettge et al. [30] validated the LTS concept in a qualitative way, gathering information from
individual cyclists using surveys. Their findings in St. Louis, Missouri, confirmed a positive correlation
between cyclists’ levels of stress on a road and the speed limit, number of lanes and functional class of
the road. No relationship was found between specific bicycle facilities and LTS.

3. PeopleForBikes “Bike Network Analysis Score” Approach
     Yet another example of the use of LTS to quantify bicycle network connectivity comes from
the organization PeopleForBikes (PfB). They developed a scoring system called the Bike Network
Analysis score (BNA score). The score applies a slightly modified version of LTS whose methodology is
described by [25]. The modifications add bicycle facility types that were not considered by the initial
LTS approach. Besides this, the method is the same, classifying the four original LTS levels into Low
Stress (LTS 1 and LTS 2) and High Stress (LTS 3 and LTS 4).
     The BNA score determines how people in a city can get to common destinations on a comfortable
and connected bike network, i.e., a low stress network. The way these destinations are picked is similar
to how Lowry et al. define their so-called basket of destination types, following the theory that “it is
possible that some bicyclists would not need certain destinations in the basket, and it is also possible
that different bicyclists would have unique preferences for particular destination types, e.g., preference
for a particular restaurant. Nevertheless (...) the concept of a basket provides a means to calculate a
meaningful metric with objectivity” ([28], p. 130).
     The score is computed by counting the total number of common destination points accessible
within 10 min on a low-stress bike network from an origin census block. A scoring scale between 0
and 100 is assigned to each destination type, in a stepped manner. Finally, the scores for all census
blocks are aggregated as a weighted averaged to get to one score for the whole city [31].
     The PfB analysis is unique because the methodology is based on OpenStreetMap (OSM),
a crowd-sourced project to create a free and editable map of the entire world. The use of OSM,
although complemented by open governmental data from the 2011 US Census, still makes the tool
easier to implement in other areas where street network and points of interest information might not
be available to the public.
     Therefore, this paper used the PeopleForBikes open source methodology as a guide to develop a
BNA score for the city of Lisbon [32].

4. Data and Methods

4.1. Data Acquisition and Preprocessing
     The computation of the BNA score for Lisbon in this paper is based solely on open data. The main
sources used were OpenStreetMap (OSM), Lisbon Municipal Council’s Spatial Open Data and Open
Data Portal, and the National Statistics Institute.
     The OSM data were downloaded in February 2018 through the built-in QGIS tool and loaded
into a PostgreSQL database in two formats: the osm2pgrouting bicycle map configuration .XML file to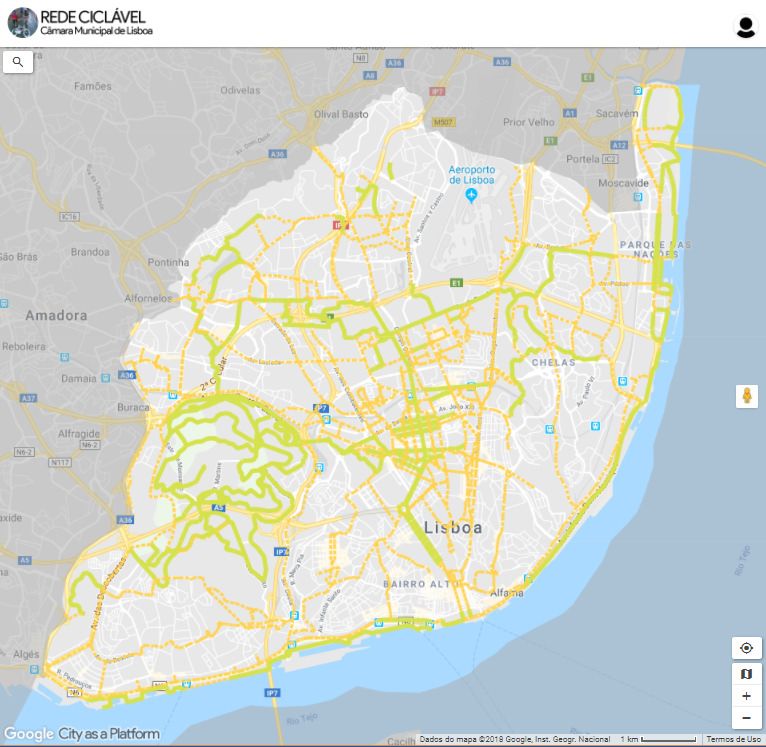
Information 2018, 9, 287                                                                            4 of 14

generate edge/segment and node/intersection tables, and the osm2pgsql adjusted to the .STYLE file
from PeopleForBikes to generate points, lines, and polygon base data.
      The CML data consisted of Lisbon’s municipal boundary, the Parishes belonging to the Council,
and the existing cycleways. The Parishes data were merged with the corresponding population data
obtained from the 2011 Portuguese Census.
      The PeopleForBikes methodology uses census blocks as the unit of analysis. However, information
at this administrative level was not available for the study area. Therefore, a hexagonal grid was laid
over Lisbon’s municipal area to perform the analysis at a higher spatial resolution and evaluate the
results locally. A hexagonal shape was selected over a rectangular grid as it reduces the bias of the
edge-effect generating a more symmetrical neighborhood and is thus more convenient for connectivity
analyses [33]. Each hexagon in the grid had an x-spacing of 200 m. This value was arbitrarily chosen,
but based on the underlying idea that all destinations in a single cell should be within a reasonable
walking distance of each other. The population of each cell was estimated from the parish population
data, by simply dividing the total population of a parish by the number of grid cells that belong
predominantly to that parish.
      For the pre-processing, all the data were projected to ETRS89/Portugal TM06 and clipped to the
study area outline. Next, the point and polygon data were organized to create one homogeneous layer
with common destination points. The centroids of the polygon data were calculated to be appended
to the point data. For polygons that comprehended large areas (nature reserves and parks), a spatial
join with the hexagonal grid was performed to assign a destination to each cell centroid that intersects
these polygons.
      Finally, the segment data were built upon attributes like maximum speed, number of lanes, road
type, taken from OSM tags. To assure that the official cycleways in the CML data were comprised
within the OSM segments, an intersection between them was performed. An additional variable
concerning the mean slope was added for this analysis, given the challenging conditions of the study
area. The slope was calculated for each segment from the Digital Terrain Model raster (49 m resolution),
obtained from the Portuguese Open Data Portal.

4.2. Biking Network Stress Levels Classification
     The segment data were categorized into two possible classes: low and high stress. This
classification follows the PeopleForBikes simplification of the LTS mentioned in Section 3. The
conditions to determine if a segment is of high or low stress are based on five variables: maximum
speed, whether or not it is a residential area, the number of lanes, the slope, and a bicycle tag existing
among the OSM information. With these variables, the type of segments, identified by the OSM tag
are classified. The criteria followed can be found in Table 1.

4.3. Bike Network Analysis (BNA)
     A network analysis was performed to count, for each cell separately, the number of destinations
reachable within a biking distance of six kilometers on the low stress network. First, the hexagonal
grid and destinations were spatially joined, so that the number of destinations per type was known for
each cell. A spatial join was also performed between the grid and the nodes of the low-stress network,
to select only those cells that are reachable with the low-stress network. For each of these, the centroid
was computed, after which the nearest node to each centroid was found (Figure 2). By doing this, each
reachable cell was then represented by one single node.
Information 2018, 9, 287 5 of 14
Table 1. Classification criteria for stress level segment labeling.
Type of Segment Maximum Speed Residential Area Number of Lanes Slope Bicycle Tag Stress Level
Municipality
——– ——– ——– ——– ——– Low
designated cycleway
OSM tagged cycleway ——– ——– ——– ——– ——– Low
≤35 km/h Yes ——– ——– ——– Low
Shared lanes ≤35 km/h No 1 35 km/h No ——– ——– ——– High
≥50 km/h No >1 ——– ——– High
Motorized road network ≥50 km/h No 1Information 2018, 9, 287 6 of 14
4.4. BNA Scoring
Each cell on the hexagonal grid was evaluated according to its capacity to reach the destinations
within the study area, being able to get a maximum score of 100 points. These destinations were not
equally weighted, given that their number and importance differ from one another. For example,
universities are not as common as parks, therefore the ability of the network to reach one park would
be rewarded with 30 points, whereas reaching a university campus or building would award the cell
70 points. Hence, different scoring processes were established for each type of destination, which can
be observed in Table 2.
Table 2. Methodology for scoring destinations.
Scoring
Criteria General Methodology
Process
First low stress destination = 30 points The maximum amount of points is 100.
A Second low stress destination = 20 points The points are given in a cumulative form,
Third low stress destination = 20 points considering the number of destinations that
the low stress network allows to reach within a
biking distance of 6 km.
First low stress destination = 40 points If all the destinations can be reached, then 100
B Second low stress destination = 20 points points are granted.
Third low stress destination = 10 points If more destinations can be reached than
defined in the criteria on the left, extra points
are given based on a ratio:
C First low stress destination = 70 points
No. of extra destinations that can be reached
by the low stress network/total number of
extra destinations within a distance of 6 km,
First low stress destination = 60 points represented by a circular buffer around the
D
Second low stress destination = 20 points concerned node.
The scores for each type of destination, following the scoring process described in Table 2, were
then categorized into three distinct groups: Opportunities for those destinations related to education,
Core Services for health, consumer goods, and social services, and Recreation including parks and nature
reserves. Within each of these categories, the scores for the different types of destinations were given a
weight (Table 3) that would allow the calculation of a weighted average per category. Finally, these
averaged scores were once again aggregated given the weights assigned to the categories, and the BNA
score per cell was obtained. To calculate the overall score for the whole study area, a final weighted
average was performed. This average consisted of the addition of all the cells inside the grid, weighted
by the fraction of the population they would comprehend, assuming that the population is equally
distributed along each parish.
The complete scoring process can best be summarized using a short example. Assume in a radius
of 6 km around a cell that there are five parks and two nature reserves. With the low stress network,
one can reach four of these parks and one nature reserve. Both parks and nature reserves have scoring
process A, so, for the first park and the nature reserve, the cell will get 30 points. The fact that a second
and third park can be reached will account for two times 20 points more. Hence, for three reachable
parks, the cell now has 70 points. There are two more parks in the radius, of which one can be reached.
That is, of the remaining 30 points (100–70), the cell will get half, i.e., 15 points. The 85 points for the
four reachable parks and the 30 points for the nature reserve both count for 50% in the Recreation
category, so the cell will have a score of:
85 × 0.5 + 30 × 0.5 = 57.5. (1)Information 2018, 9, 287 7 of 14
This score counts for 20% in the computation for the final BNA score of the cell. How much weight is
assigned to this particular final score when the overall is computed for the whole city depends on the
fraction of the total population of Lisbon assigned to the cell.
Table 3. Weights for destinations and categories.
Category W Type of Destination W Scoring Process
School 30 A
College 30 C
Opportunity 40
University 25 C
Library 15 B
Doctors + Clinics 20 B
Dentist 10 B
Hospital 20 C
Core services 40
Pharmacies 15 B
Supermarket 25 D
Social facilities 10 C
Nature reserve 50 A
Recreation 20
Park 50 A
5. Results and Discussion
5.1. Low-Stress Biking Network
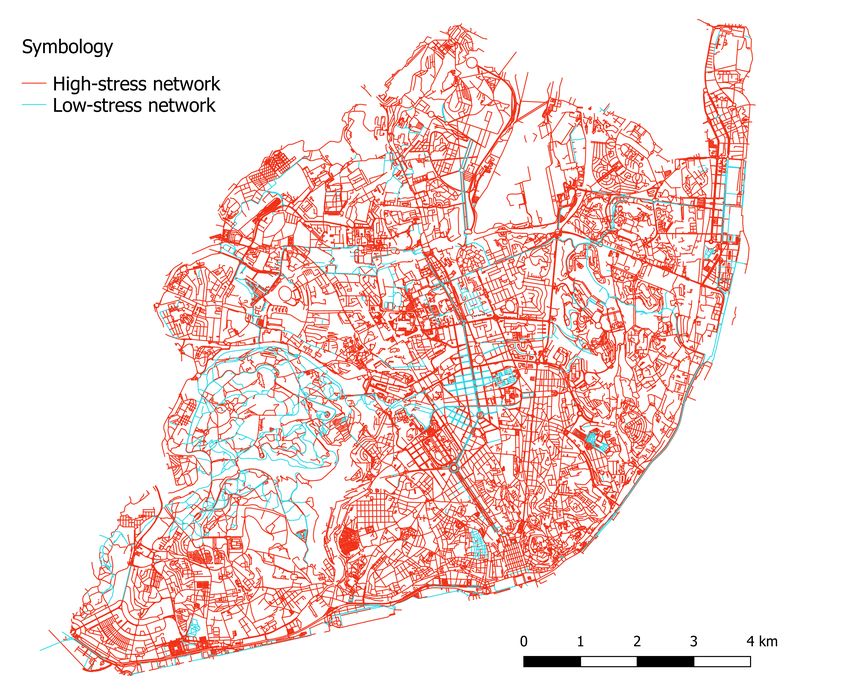
A low-stress set of segments was identified from the bike network classification, as can be observed
in cyan color in Figure 3. The resulting low-stress network is very limited according to the classification
criteria. Only 9% out of the 42,294 analyzed segments are classified as low-stress. These are comprised
in their majority by the existing biking facilities, with only a few additions of some roads considered
suitable for commuting cycling.
Figure 3. Stress network for study area.Information 2018, 9, 287 8 of 14
Even if the results are tightly linked to the quality of the OSM data, certain factors might explain
the limited low-stress network within the city context. The first one is the maximum speed allowed
on the segments, closely attached to the number of lanes and residential areas. At least 75% of those
allow a maximum speed equal to or higher than 50 km/h, 105 km/h being the highest maximum
speed. Even if these are not the official values that the municipality handles, as they were generated
by the osm2pgrouting tool, they give an idea of how the actual street network in the city is structured.
According to a sociological study on the pedestrian and cycling practices in Portugal ([34], p. 298), “the
automobiles’ excessive speed is referred to [as an obstacle] specially by the (. . . ) people who commute
in Lisbon”, hence classified as high-stress.
Another decisive variable, especially within Lisbon’s context, is the slope. Twenty five percent of
the segments have a slope higher than 9% in the analyzed network, with a mean slope of 6.6% and a
maximum reaching 49% It is known in commuting cycling that, given the decision between a steep
and shorter route, and a flat and longer one, a person would choose the second option [35], as “the
slope increases the amount of effort that cyclists need to make” ([36], p. 67).
Studies [35–38] do not talk about a threshold for the maximum percentage that an average
commuter-cyclist would consider as too physically demanding. Therefore, the 10% chosen for this
study was based on the authors’ experience, considering that even this slope could be challenging for
some people but that a lower threshold would imply an even more limited network. It should be noted
in this context that the influence of slope on cyclists’ stress level could become of far less importance,
as the share of electric bikes is rising sharply in Northern Europe, opening up sustainable mobility
to new markets that did not exist before [39]. As of 2017, Lisbon has a public bike sharing program
consisting mainly of electric bikes. Eventually, this system should be expanded to 1410 bikes, of which
two-thirds will be electrical [40]. Such initiatives, in combination with e-bike friendly infrastructure,
lower the barrier of slope and could potentially increase the extent of the low-stress network.
Intersections were not evaluated as part of the network. The main reason to omit them was the
lack of sufficient information incoming from the OSM data for all the nodes generated during the
topology creation. Further work requires complementary open data and further assumptions regarding
the road network to successfully include the information for intersections, given their importance
when evaluating the status of a biking network, especially a high-traffic one, as the presence of stop
signs and traffic signals increase perceived safety [35]. The PeopleForBikes approach does take them
into consideration; therefore, their strategy will be closely followed to integrate the intersections within
the network analysis to be performed in future analyses.
Behavior of fellow road users forms another factor that could be of influence on the amount
of stress that cyclists perceive. Particularly in Lisbon, it is still hard to create a culture where the
motorized vehicle drivers acknowledge the right of way of cyclists. The main reason for this behavior
is that only in 2013 the road traffic regulations migrated from a motorized-centered perspective to one
that includes the cyclists’ rights as well [34]. Since this change is so recent, it still fails to be embraced
by the daily commuters. Besides motorized traffic, also pedestrian behaviors can turn the low-stress
network into a highly stressful experience. One of the most noticeable examples of these behaviors is
the usage of cycleways as footways. This adds up to the fact that the pedestrians do not appear to have
a cycling-city culture, and, therefore, become unpredictable when reacting upon the sudden meeting of
a cyclist in their way. These limitations raise the question of whether the resulting low-stress network
for Lisbon can really be considered as such. However, at the same time, these cultural factors are
hardly accountable for in a quantitative index based on open data.
5.2. Lisbon’s BNA Score
The connectivity of the low-stress network can be quantified by the scoring mechanism, awarding
the city of Lisbon with a score of 8.6 out of 100 possible points. Each of the grid cells was punctuated
in order to obtain this overall score, which can be visualized in Figure 4. At a first glance, the figure
shows how the cells with high scores spatially correlate with those areas where the municipality’sInformation 2018, 9, 287 9 of 14
bike infrastructure is located; however, this is not always true. It can be observed how, in fact, the
cells correspondent to the central and northwestern axes are highly scored, whereas the cells along the
riverside show lower scores even if an acceptable bike infrastructure can be already found there.
This is mainly because the number of destinations accessible within the analysis are clustering
predominately around the central areas and not the riversides (Figure A1 in the Appendix). As [41]
indicate in their analysis, the current cycling network in Lisbon does not satisfy the commuters’ needs
for daily commuting, as it was projected as a network for leisure trips, providing infrastructure for
parks, gardens, and touristic areas. Furthermore, as also mentioned in Section 5.1, the hilly areas in
the city limit the extent of the low-stress network, thus scoring the steep cells low (Figure A2 in the
Appendix).
The resulting score shows an extremely low performance of the bike network, which does not
really come as a surprise given the factors already discussed in Section 5.1. Of course, it is true that
obtaining a score of 100 points is difficult in a city where the biking culture and policies are not
completely established yet, and where the mind shifting is still an ongoing process; however, it is
important to know that there is big room for improvements, and that this starting process can follow
the steps of cities where commuting-biking is a daily way of life.
Figure 4. BNA score results for the city of Lisbon.
This does not necessarily mean that there are cities around the world with a perfect BNA score. For
example, Groningen in the Netherlands is one of the world’s leading cities regarding bike infrastructure,
and yet, when the PeopleForBikes organization applied their methodology to compute a BNA score
for Groningen, it was awarded 75 points [42]. If we look for the highest rated cities in the USA, where
the original tool was implemented, we see that some places reach scores as high as 88 (Crested Butte,
CO) and 85 (Provincetown, MA, USA, values taken from PeopleForBikes BNA score visualizer), but it
is important to notice that these are small cities with less than 3000 inhabitants.
Comparing the obtained value for Lisbon with what the PeopleForBikes BNA score has done for
the US cities is not completely accurate, as the methodology differs. One of the biggest challenges of
applying such methodology outside of the USA is that the open data available is not the same as in
Europe. As already mentioned, the PeopleForBikes BNA approach includes census blocks informationInformation 2018, 9, 287 10 of 14
with exact population counts, which was not easily and openly available for the Lisbon case, as far
as the authors were aware. Additionally, their approach included workplace data, which is also an
important factor to consider, but not possible to obtain as open data in the European data portal or
similar local portals for Lisbon. Nevertheless, seeing how other cities score, and analyzing the strengths
and weaknesses of their biking policies, can guide Lisbon on its way to become a more sustainable city.
6. Future Research
Future research will focus on analyzing the set up of street networks to include segments and
intersections altogether, as the PeopleForBikes approach considers. This will be an effort to translate
the BNA score for any city in Europe, considering the data limitations and possible replacements or,
even further, modifications to the way the BNA score is calculated, given the available data.
A validation procedure is also within the future research scope, in a way that the score is not
only considered an exploratory index, but a trustful tool for urban planners. The tool could serve to
optimize the current bike network connectivity in cities, by including scenarios of potential low-stress
segment locations within the bike network, and observing the enhancement of the BNA score as a new
bike infrastructure is being planned.
7. Conclusions and Limitations
7.1. Conclusions
The BNA score of Lisbon is 8.6 out of 100 points. The exploratory tool developed has shown how
the use of open data, even with its limitations, can provide a quantification index of sustainable mobility
for a city. For the Lisbon study case, the score per cell can be used by urban planners to thoroughly
analyze the existing biking network, identifying specific areas where low-stress infrastructure should
either be introduced or better connected. Additionally, the methodology can be used to evaluate
proposals for new cycling infrastructure, and guarantee the introduction of a well-connected low-stress
network for bicycle commuters.
The current overall score can be considered an extremely low performance and shows that there
is still a long way to go until the bicycle can be considered a fully-fledged mean of transport, able to
compete with the car, as the municipality aims for. Of course, making radical changes like this is a
slow process and it takes a lot of time for both the inhabitants and policy makers to adapt to them, but,
with a clear vision and a strong belief, significant improvements can be expected in the coming years.
7.2. Limitations
The major limitation of the BNA approach is the level of completeness and accuracy of the
OpenStreetMap data for the study area. PfB is constantly encouraging current and potential users of
their tool to also contribute to the mapping of their OSM area so that the score becomes more reliable.
Another issue is the weighted influence that destinations have on the overall score, as different
weights can have a high impact on the obtained score. It is therefore important to always keep the same
criteria for scores calculations when comparisons want to be performed among different study areas.
Finally, as seen in the background section, validation schemes have been proposed for this type of
connectivity measures. However, the lack of open data and the labor intensity of qualitative methods
could become a problem for some cities to successfully validate the computed index. Therefore,
validation approaches that are automatized, affordable and accessible should be explored to expand
this tool to a broader audience. In addition, a good validation procedure should include an evaluation
of the destination weights to ensure that their value matches the actual importance given to them
by commuters.
Author Contributions: Conceptualization, L.A. and L.v.d.M.; Formal Analysis, L.A. and L.v.d.M.; Methodology,
L.A. and L.v.d.M.; Project Administration, L.A.; Writing—Original Draft, L.A.; Writing—Review and Editing, L.A.
and L.v.d.M.Information 2018, 9, 287 11 of 14
Funding: This research received no external funding.
Acknowledgments: This study was developed as part of the Erasmus Mundus Programme, M.Sc. in Geospatial
Technologies, from which L.A. has been granted an Erasmus Mundus Category A scholarship funded by the
European Commission, Framework No. 2016-2054/001-001-EMJMD. The authors would like to acknowledge
the AGILE Council for the shared grant awarded to both of them to attend the AGILE 2018 conference and
the pre-conference workshop “OPEN DATA FOR OPEN CITIES V 2.0”, where the research was first presented.
Furthermore, the authors would like to thank Joel Silva, from NOVA Information Management School, for his
guidance during the early stages of this study, Fernando Benitez from Universitat Jaume I, for his encouragement
and guidance during the publication process, Lucas Braun for proofreading and giving feedback on the original
manuscript, Rebecca Davies from PeopleForBikes for her feedback and input on the future research scope, and the
reviewers for enhancing the quality of the paper with their suggestions.
Conflicts of Interest: The authors declare no conflict of interest.
Abbreviations
The following abbreviations are used in this manuscript:
BNA Bike Network Analysis
GIS Geographic Information Systems
PfB PeopleForBikes
LTS Level of Traffic Stress
OSM OpenStreetMap
CML Camara Municipal de Lisboa
ETRS89 European Terrestrial Reference System 1989
DTM Digital Terrain Model
Appendix
Figure A1. Destinations, hexagonal grid, and low stress network.Information 2018, 9, 287 12 of 14
Figure A2. Slope percentage for the stress network in Lisbon.
References
1. Banister, D. Cities, mobility and climate change. J. Transp. Geogr. 2011, 19, 1538–1546. [CrossRef]
2. Fraser, S.D.; Lock, K. Cycling for transport and public health: A systematic review of the effect of the
environment on cycling. Eur. J. Public Health 2011, 21, 738–743. [CrossRef] [PubMed]
3. De Hartog, J.J.; Boogaard, H.; Nijland, H.; Hoek, G.; de Hartog, J.J.; Boogaard, H.; Nijland, H.; Hoek, G. Do
the health benefits of cycling outweigh the risks? Environ. Health Perspect. 2010, 118, 1109–1116. [CrossRef]
[PubMed]
4. Torres, P.; Ferreira, J.; Monteiro, A.; Costa, S.; Pereira, M.C.; Madureira, J.; Mendes, A.; Teixeira, J.P. Air
pollution: A public health approach for Portugal. Sci. Total Environ. 2018, 643, 1041–1053. [CrossRef]
[PubMed]
5. Carley, M.; Christie, I.; Christie, I. Managing Sustainable Development; Routledge: London, UK, 2017.
[CrossRef]
6. Bopp, M.; Sims, D.; Piatkowski, D.P. Bicycling for Transportation—An Evidence-Base for Communities, 1st ed.;
Elsevier: Amsterdam, The Netherlands, 2018.
7. Kosha, T.; Rudolph, F. The Role of Walking and Cycling in Reducing Congestion: A Portfolio of Measures; Technical
Report; FLOW Project: Brussels, Belgium, 2016.
8. de Manuel Jerez, E.; Gonzalez Arriero, C.; Donadei, M. Las redes de Movilidad Urbana Sostenible y la
reactivación del Espacio Público: Alcosa. Habitat y Sociedad 2016, 9, 97–131. (In Spanish) [CrossRef]
9. Gira Bicicletas de Lisboa. Sobre a Gira. Available online: https://www.gira-bicicletasdelisboa.pt/sobre-a-
gira/ (accessed on 11 November 2018).
10. Camara Municipal de Lisboa. Mobilidade Ciclavel. Available online: http://www.cm-lisboa.pt/viver/
mobilidade/mobilidade-ciclavel (accessed on 21 February 2018).
11. Marrana, J.; Serdoura, F. Cycling Policies and Strategies: The Case of Lisbon. Int. J. Res. Chem. Metall.
Civ. Eng. 2018, 4. [CrossRef]
12. Camara Municipal de Lisboa. Mobilidade Sustentavel e Prioridade da Cidade. 2016.
Available online: http://www.cm-lisboa.pt/no_cache/noticias/detalhe/article/mobilidade-sustentavel-
e-prioridade-da-cidade (accessed on 10 February 2018).
13. Silva, M.M.d. Mobilidade (In)Sustentável em Lisboa. 2017. Available online: https://jornaleconomico.sapo.
pt/noticias/mobilidade-insustentavel-em-lisboa-160590 (accessed on 10 November 2018).Information 2018, 9, 287 13 of 14
14. Susete, F. Lisboa vai ter 200 km Para Pedalar e Quer ir de Oeiras a Vila Franca. 2016. Available
online: https://www.dn.pt/sociedade/interior/lisboa-vai-ter-200-km-para-pedalar-e-quer-ir-de-oeiras-
a-vila-franca-5400639.html (accessed on 10 November 2018).
15. André, M.R. O Plano Semi-Escondido da Camara Para Tornar Lisboa Ciclavel Ate 2020. 2018. Available
online: https://shifter.sapo.pt/2018/01/rede-ciclavel-lisboa/ (accessed on 10 November 2018).
16. City as a Platform. Rede Ciclavel. 2018. Available online: https://lisboa.city-platform.com/app/?a=
redeciclavel (accessed on 10 November 2018).
17. Baratto, R. Lisboa Planeja Ampliar Sua Rede de Ciclovias Devido ao Aumento de Ciclistas. 2016. Available
online: https://www.archdaily.com.br/br/792640/lisboa-planeja-ampliar-sua-rede-de-ciclovias-devido-
ao-aumento-de-ciclistas (accessed on 19 October 2018).
18. Dietrich, D.; Gray, J.; McNamara, T.; Poikola, A.; Pollock, R.; Tait, J.; Zijlstra, T. The Open Data Handbook;
Technical Report; Open Knowledge Foundation: Cambridge, UK, 2018.
19. European Data Portal. Benefits of Open Data. 2018. Available online: https://www.europeandataportal.eu/
en/using-data/benefits-of-open-data (accessed on 19 October 2018).
20. Manum, B.; Nordström, T. Integrating Bicycle Network Analysis in Urban Design: Improving bikeability in
Trondheim by combining space syntax and GIS-methods using the place syntax tool. In Proceedings of the
9th International Space Syntax Symposium, Seoul, Korea, 31 October–3 November 2013; p. 14.
21. Cooper, C.H. Using spatial network analysis to model pedal cycle flows, risk and mode choice. J. Transp.
Geogr. 2017, 58, 157–165. [CrossRef]
22. Twadell, H.; Rose, E.; Broach, J.; Dill, J.; Clifton, K.; Lust, C.; Voros, K.; Louch, H.; David, E. Guidebook for
Measuring Multimodal Network Connectivity; Technical Report February; Federal Highway Administration:
Portland, OR, USA, 2018.
23. Sorton, A.; Walsh, T. Bicycle Stress Level as a Tool to Evaluate Urban and Suburban Bicycle Compatibility.
Transp. Res. Rec. 1994, 3, 17–24.
24. Geller, R. Four Types of Cyclists; Technical Report; Portland Office of Transportation: Portland, OR, USA,
2006.
25. Mekuria, M.C.; Furth, P.G.; Nixon, H. Low-Stress Bicycling and Network Connectivity Low-Stress Bicycling and
Network Connectivity; Technical Report; Mineta Transportation Institute: San Jose, CA, USA, 2012.
26. Dill, J.; McNeil, N. Revisiting the Four Types of Cyclists. Transp. Res. Rec. J. Transp. Res. Board 2016, 2587,
90–99. [CrossRef]
27. Furth, P.G.; Mekuria, M.C.; Nixon, H. Network Connectivity for Low-Stress Bicycling. Transp. Res. Rec. J.
Transp. Res. Board 2016, 2587, 41–49. [CrossRef]
28. Lowry, M.B.; Furth, P.; Hadden-Loh, T. Prioritizing new bicycle facilities to improve low-stress network
connectivity. Transp. Res. Part A Policy Pract. 2016, 86, 124–140. [CrossRef]
29. Lowry, M.; Hadden, T. Quantifying bicycle network connectivity. Prev. Med. 2017, 95, S134–S140. [CrossRef]
[PubMed]
30. Boettge, B.; Hall, D.; Crawford, T.; Boettge, B.; Hall, D.M.; Crawford, T. Assessing the Bicycle Network in
St. Louis: A PlaceBased User-Centered Approach. Sustainability 2017, 9, 241. [CrossRef]
31. PeopleForBikes. Methodology. 2014. Available online: https://peopleforbikes.org/methodology-
participation-study/ (accessed on 1 November 2018).
32. Abad, L.; Van der Meer, L. Bike Network Analysis Lisbon. In Proceedings of the Workshop Open Data for
Open Cities V 2.0, Lund, Sweden, 12 June 2018; p. 36.
33. Birch, C.P.D.; Oom, S.P.; Beecham, J.A. Rectangular and hexagonal grids used for observation, experiment
and simulation in ecology. Ecol. Model. 2007, 206, 347–359. [CrossRef]
34. Mantas, A.I.J.S. (I)mobilidades em Espaço Urbano: Representações e Práticas em torno da Deslocação
Pedonal e Velocipédica em Portugal. Ph.D. Thesis, Universidade de Coimbra, Coimbra, Portugal, 2015.
(In Portuguese)
35. Broach, J.; Dill, J.; Gliebe, J. Where do cyclists ride? A route choice model developed with revealed preference
GPS data. Transp. Res. Part A Policy Pract. 2012, 46, 1730–1740. [CrossRef]
36. Heinen, E.; van Wee, B.; Maat, K. Commuting by bicycle: An overview of the literature. Transp. Rev. 2010,
30, 59–96. [CrossRef]Information 2018, 9, 287 14 of 14
37. Vandenbulcke, G.; Dujardin, C.; Thomas, I.; Geus, B.d.; Degraeuwe, B.; Meeusen, R.; Panis, L.I. Cycle
commuting in Belgium: Spatial determinants and ’re-cycling’ strategies. Transp. Res. Part A Policy Pract.
2011, 45, 118–137. [CrossRef]
38. Jestico, B.; Nelson, T.; Winters, M. Mapping ridership using crowdsourced cycling data. J. Transp. Geogr.
2016, 52, 90–97. [CrossRef]
39. Pucher, J.; Buehler, R. Cycling towards a more sustainable transport future. Transp. Rev. 2017, 37, 689–694.
[CrossRef]
40. European Commission. Indicator 3: Sustainable Urban Mobility. Application form for the European Green Capital
Award 2016; Technical Report; European Commission: Brussels, Belgium, 2016.
41. Moura, F.; Da Silva, J.M.; Picado Santos, L. Growing from incipient to potentially large cycle networks:
Screening the road network of the consolidated urban area of Lisbon. Eur. J. Transp. Infrastruct. Res. 2017,
17, 170–190.
42. Boldry, J.; Anderson, M.; Roskowski, M. Defining Connected Bike Networks; Technical Report May; Pedestrian
and Bicycle Information Center: Chapel Hill, NC, USA, 2017.
c 2018 by the authors. Licensee MDPI, Basel, Switzerland. This article is an open access
article distributed under the terms and conditions of the Creative Commons Attribution
(CC BY) license (http://creativecommons.org/licenses/by/4.0/).You can also read