Fixed Income Presentation Q1 2021 results - May 11, 2021 - Aareal Bank
←
→
Page content transcription
If your browser does not render page correctly, please read the page content below
Fixed Income Presentation
Q1 2021 results

May 11, 2021

Agenda

         (1)   Introduction of Aareal Bank
         (2)   Highlights
         (3)   Group Results
         (4)   Segments
         (5)   Capital, Funding & Liquidity
         (6)   Outlook
         (7)   Key Takeaways

         ▪ Appendix

2
Introduction of Aareal Bank

3

Aareal Bank Group
The new lineup - THREE segments

    Structured Property Financing (SPF)            Consulting/Service (C/S) Bank                        Aareon

    Commercial real estate financing            Integrated payment transaction            European leader for real estate
    solutions across 3 continents: Europe,      system for the housing industry           software, 60+ years in the market
    North American and Asia/Pacific             (market-leading) and the utility sector   serving c.3k customers and 10m+ units
                                                                                          with 40 locations in DACH,
    Diverse property types                      Financial solutions                       Netherlands, France, Nordics and UK
    ▪ Hotels, logistics, offices, retail,       ▪ Payment processing provider             Mission-critical ERP and broad set of
      residential and student housing           ▪ Deposit bank                            modular Digital Solutions built on a
    ▪ Additional industry experts in                                                      cloud-enabled PaaS platform
      hotels, logistics and retail properties   Software solutions
                                                ▪ Intelligent solutions to improve        Sustainable and resilient business
    Investment finance                            connectivity and efficiency for bank    model with strong downside
    ▪ Single asset, portfolio, value add          and non-bank customers                  protection delivers decades of
    ▪ Portfolio size: c.€ 28,2 bn; average      ▪ Average deposit volume of € 11.6 bn     consistent profitable growth
       LTV: 60%                                   in Q1 2021                              Experienced leadership team
                                                                                          combining deep software expertise
                                                                                          and longstanding real estate
                                                                                          experience with a strong M&A roll-up
                                                                                          track-record

                “Activate”                                   “Elevate”                              “Accelerate”

4
Aareal Bank Group
One Bank – three segments – three continents
International property financing in more than 20 countries –
Europe, North America and Asia / Pacific
5Aareal’s ownership structure
100% Free Float
Aareal Bank AG
▪ Listed in the German SDAX
▪ 59,857,221 outstanding shares
▪ 100% free float
▪ 3,010 employees
100%
▪ Balance Sheet: 46.5 bn €
▪ Flat hierarchies
Stock performance since 01. Jan 2003
45 €
40 €
35 €
30 €
25 €
20 €
15 €
10 €
5€
0€
6Aareal Bank Ratings
Issuer Default Rating 1) BBB+ Issuer Rating A3
Short-term Issuer
Short-term F2 P-2
Rating
Deposit Rating 1) A- Bank Deposit Rating A3
Baseline Credit
Senior Preferred 1) A- baa3
Assessment
Senior non Preferred 1) BBB+ Mortgage Pfandbriefe Aaa
Viability Rating 1) bbb+
Subordinated Debt 1) BBB-
Additional Tier 1 1) BB
1) Rating changes as of 27.03.2020
Fitch has downgraded Aareal Bank AG's Long-Term IDR to 'BBB+ and
7 placed Aareal's VR, Long-Term IDR, DCR and debt ratings on RWNHighlights 8
Highlights
Solid performance – Outlook confirmed

                                  Still uncertain                 ▪ Sticking to swoosh scenario (economic recovery)
                                  environment                     ▪ Positive developments in the US, UK and Asia -
                                                                    Continental Europe still lagging behind triggered by slower vaccination
                                                                    process

                                  Solid                           ▪ Solid Q1 with operating profit in line with FY-guidance
                                  performance                     ▪ Strong double digit NII growth yoy
                                                                  ▪ Low Q1-LLP after Covid-19 related comprehensive risk provisioning in 2020
                                                                  ▪ Growth in all three segments
  Aareal Bank                                                     ▪ SPF:        - New business and promising deal pipeline support growth plan,
  Group                                                                           attractive margins and good LTVs
                                                                                - Portfolio further increased towards target size
                                                                  ▪ BDS:        - Growing NCI
                                                                                - Deposit volume at high level
                                                                  ▪ Aareon:     - Sales revenues further increased yoy despite Covid-19
                                                                                  related burden in Consulting business

                                  Outlook                         ▪ Outlook confirmed
                                  confirmed                       ▪ AGM dividend1) proposal of € 0.40 – remaining € 1.10 intended to be paid
                                                                    out after an extraordinary Annual General Meeting which could possibly
                                                                    take place in the fourth quarter
1) The dividend payment of € 1.50 per share in 2021 for the financial year 2020 would need to be made in two steps. In compliance with the
   requirements published by the European Central Bank (ECB) on 15 December 2020, the distributable amount is € 0.40 per share.
   The Management Board will submit a proposal for the appropriation of profits to the ordinary Annual General Meeting in May 2021.
9 Depending    on the economic developments, the regulatory requirements, the capital position and the risk situation of the bank,
   an extraordinary Annual General Meeting, which could possibly take place in the fourth quarter, could then decide on the intended
   remaining payout of € 1.10 per share.
Group Results 10
Group Results
Operating profit in line with FY-guidance, strong double digit
NII growth yoy
€ mn                             Q1 ‘20   Q2 ’20   Q3 ’20   Q4 ‘20   Q1 ‘21   Comments
                                                                              Positive impacts from increased portfolio
Net interest income                123      122      128      139      138
                                                                              and TLTRO participation
                                                                              Low Q1-LLP after Covid-19 related comprehensive
Loss allowance                       58      48        61     177        7
                                                                              risk provisioning in 2020
                                                                              Above last year driven by BDS and Aareon growth
Net commission income                57      54        57      66       59
                                                                              despite Covid-19 burdens
                                                                              Positive effects from early loan repayments,
Derecognition result                  7       9         3       9        0
                                                                              de-risking measures (Italian bonds)
                                                                              Negative hedge-result and minor value adjustments
FV- / hedge-result                   11      -16       -2      -19       -4
                                                                              (NPLs)
                                                                              In line with FY-guidance despite higher deposit
Admin expenses                     129      109      114      117      150    guarantee fees and bank levy, Q1/20 contained
                                                                              Covid-19 related underspend
Others                                0      -10        0       -1       -4   Covid-19 related lower income from own assets

Operating profit (EBT)               11       2        11      -99      32    In line with FY-guidance
Income taxes                          4       -7       10      -13      11
Minorities                            1       0         1       3        1
AT1                                   4       4         4       4        4
Consolidated net income
                                      2       5        -4      -93      16
allocated to ord. shareholders
Earnings per share (€)             0.04     0.07    -0.05    -1.56    0.27

11
Net interest income (NII) / Net commission income (NCI)
Growth in all three segments reflected in increasing NII and
NCI
NII Positive impacts from increased portfolio and TLTRO
€ mn participation
150
▪ Significant NII increase of 12% vs Q1/20 due to higher
125
portfolio and TLTRO effects
100
▪ Solid new business with margins significantly above plan
75 139 138 ▪ REF portfolio further increased towards targeted
123 122 128
50 € ~29 bn by YE 2021
25
0
Q1 2020 Q2 2020 Q3 2020 Q4 2020 Q1 2021
NCI Above last year driven by BDS and Aareon growth
80 € mn
despite Covid-19 burdens
70 ▪ BDS with positive development YoY
60
▪ Aareon’s contribution further increased despite
50 66
Covid-19 related burdens
40 57 57 59
54 ▫ Q1/20 virtually unaffected by Covid-19
30
▫ Q4 regularly boosted by seasonal effects
20
10
0
Q1 2020 Q2 2020 Q3 2020 Q4 2020 Q1 2021
12Loan loss provisions (LLP) / Admin expenses
Low LLP, Admin expenses in line with FY-guidance
LLP Low Q1-LLP after Covid-19 related comprehensive risk
200 € mn provisioning in 2020
▪ Q1 LLP of € 7 mn (Q1/20: € 58 mn).
Last years’ figures largely impacted by Covid-19 effects
150 ▪ Due to remaining Covid-19 related uncertainties
FY-LLP guidance confirmed despite low Q1 figure
100 ▪ € 2 mn value adjustments of NPLs in FVPL
177
50
58 61
48
7
0
Q1 2020 Q2 2020 Q3 2020 Q4 2020 Q1 2021
Admin expenses In line with FY-guidance despite higher deposit guarantee fees
and bank levy, Q1/20 contained Covid-19 related underspend
€ mn
175 Bank:
150
150 ▪ Deposit guarantee fees and bank levy higher than plan and
129 24
114 117 previous year (€ +6 mn) due to a deposit protection event
125 18 109 (Greensill) and other effects
100 ▪ Q1/21 incl. € 3 mn from share price increase by ~25% while
67 76
75 65 63 68 Q1/20 benefitted from Covid-19 related underspend (€ -10 mn)
50 ➢ Hence underlying costs € 2 mn better than Q1/20 and in line
with FY-target despite unforeseen burdens
25 46 46 46 50 50
Aareon:
0 ▪ Increased cost base from higher FTE, anticipating further growth.
Q1 2020 Q2 2020 Q3 2020 Q4 2020 Q1 2021 First investments in VCP
Bank Aareon Bank levy, et al
13Segments 14
Segment: Structured Property Financing
Vaccination is speeding up normalisation

               General observations

               ▪ Rate of vaccinations against Covid-19 is picking up largely across the globe, though some
                 countries are further progressed than others
               ▪ Vaccination passports or proof of recovery from infection and negative tests are to enable
                 normal freedom of movement in- and across borders and to facilitate a return to normality
                 in everyday activities
               ▪ Economic forecasts are increased by governments across North America, Europe and
 Business        Asia-Pacific
 Environment
               ▪ Real estate value declines have slowed significantly or completely stopped, with first signs
                 of value recovery in sight due to decreasing Covid-19 restrictions and openings of shopping
                 centres and hotels as well as increasing tendencies to return to offices.
                 Individual declines can however not be fully excluded, yet, and are also subject to any
                 unforeseen new restrictions and developments
               ▪ Investor sentiment is improving across the board in respect of travel and tourism such as
                 with Blackstone investing approx. USD 17 bln ytd 2021 buying hotels including Extended
                 Stay America INC, private-jet-operator Signature Aviation Plc and U.K. travel company
                 Bourne Leisure

15
Segment: Structured Property Financing
Investment markets
▪ Close to 50% of the US-adult population have received the vaccine
▪ US consumer sentiment in April is at its highest level in 14 months
▪ 90% of cinemas are open selling >20% more tickets in Q1/21 vs. Q4/20
North
▪ CDC has lifted travel warning within the US, number of flights are approaching
America pre-covid levels
▪ NYC is opening up all remaining venues latest on July 1st
▪ GDP grew at an annual rate of 6.4% during the first quarter of 2021
▪ Lagging behind due to remaining lockdown measures to fight 3rd wave, but vaccination
Continental speed is picking up, openings of retail and restaurants are starting in several countries
Europe ▪ In Germany, Union Investment made a comeback into the hotel market acquiring a
21 storey hotel in Stuttgart with completion by December of this year
▪ Vaccination ahead continental Europe
▪ Reopening of facilities such as retailers, pubs, etc.
▪ Restaurants with reservation rates at 80% of April 2019 although open only outside
UK ▪ Footfall across all UK shopping destinations was estimated to be up approx. 88% week-
on-week during the first week of opening, with footfall across high streets, retail parks
and shopping centers up 330% from April 11 to 17 versus the same week in 2020
▪ Recovery is however still at an early stage and is still subject to possible further volatility
in individual cases
▪ China is mostly back to pre-covid activity and in parts already above
Asia / Pacific
▪ Travel bubbles established between countries i.e. Australia and New Zeeland
16Segment: Structured Property Financing
New business with attractive margins and good LTVs,
promising deal pipeline
New business by quarter ▪ Newly acquired business
2.000
€ mn ▫ Pre-FX margins of ~250 bp significantly above plan
(~215 bps)
1.500
1,333 ▫ Conservative Ø-LTV of 61% on post-covid valuations
1,094 ▫ Good deal pipeline
243 ▪ Share of retail contractually and opportunity driven e.g.
1.000
the prolongation of an Italian shopping center portfolio
638
(LTV: 63%) and a newly originated Highstreet real estate
500 1.090
in Manhattan with interesting risk-return profiles
456 ▪ Focus on ESG aspects in all geographies
0 ▫ Green finance framework put into place with first
Q1 2020 Q1 2021 transaction expected to follow during Q2
Newly acquired business Renewals
New business by country New business by property type
Others: 6% Residential: > 0%
France: 7% Logistic: 10%
Sweden: 7%
US: 35% Office: 17%
Poland: 9% € 1,094 mn € 1,094 mn
2)
Retail: 55%
UK: 14% Hotel: 18%
1)
Italy: 22%
1) Renewals only
2) Thereof 40% Italian renewals
17Segment: Structured Property Financing
Aareal “Green Finance Framework - Lending” put into place
ESG Integration – achievements & next steps
Important milestones reached in expanding a risk-conscious and ESG-orientated portfolio:
▪ Aareal “Green Finance Framework – Lending” put into place
▫ Aareal‘s Green Finance Framework confirmed through Second Party Opinion (SPO):
“Sustainalytics is of the opinion that the Aareal Bank Green Finance Framework is credible and impactful and
aligns with the four core components of the Green Bond Principles 2018 and Green Loan Principles 2020.“
▫ Explicit customer demand in Aareal Green Lending internationally identified and interest is high for the new product
▫ As such first green lending within the new framework expected to have taken place by end of 2 nd quarter
▪ Continue to enlarge climate transparency in the portfolio
▫ Portfolio transparency significantly improved in 2020
▫ Continue improving for the existing, as well as for new lending engagements
▫ Aareal involved in international initiatives to calculate financed emissions (PCAF)
18Segment: Structured Property Financing
Portfolio further increased towards target size
Development REF portfolio ▪ Portfolio further increased towards target size of
€ bn € ~29 bn by YE 2021
32
~ 30 ▪ Ø-portfolio LTV1) at 60%
~ 29
27.8 28.2 ▪ Ø-portfolio YoD1) at 6.3%
28 0,6
26.7 0,6
0,8 ▪ Covid-19 related demand for liquidity lines and
postponements of amortisation remains moderate
24
27,2 27,6 in Q1/21: € 53 mn
25,9
(Q2/20: € 160 mn, Q3/20: € 27 mn, Q4/20: € 79 mn)
20
12/2019 12/2020 03/2021 12/2021e 12/2022e
CREF others
CREF portfolio by region CREF portfolio by property type
2)
Asia / Pacific: Residential: 4% Others: 1%
3%
Logistic: 11%
North America:
32% Europe West: Hotel: 33%
34%
€ 27.6 bn € 27.6 bn
Retail: 22%
Germany: 11%
Europe North: 5%
Europe East: 5% Office: 29%
Europe South: 10%
1) Performing CREF-portfolio only (exposure)
2) Incl. Student housing (UK & Australia only)
19Segment: Structured Property Financing
Update on hotel- and retail portfolio
Hotel Retail
100% 100%
Ø LTV1) Ø LTV1)
75% 75%
50% 50%
25% 56% 62% 63% 25% 59% 61% 61%
0% 0%
Q3/20 Q4/20 Q1/21 Q3/20 Q4/20 Q1/21
12% 12%
Ø YoD1) Ø YoD1)
8% 8%
4% 4% 8,4% 8,8% 8,9%
3,6% 3,0% 2,0%
0% 0%
Q3/20 Q4/20 Q1/21 Q3/20 Q4/20 Q1/21
▪ Hotel values are stabilising, however still affected by ▪ Recovery gaining momentum with the opening of
longer than expected lockdown measures and travel shopping centers e.g. in UK and the US
bans ▪ Stable LTV ratio with updated valuations and selective
▪ Stable LTV ratio with updated valuations and attractive attractive new business opportunities
new business opportunities ▪ YoD already showing gradual re-opening- and
▪ YoD expected to pick up, decrease per Q1 due to amortisation effects, stabilising and increasing slightly
extended mandated closures in numerous countries to 8.9% overall
▪ No additional NPLs ▪ The industry is at an early stage in the recovery with
fluctuation in actual performance in individual cases
still possible
▪ No additional NPLs
1) Performing CREF-portfolio only (exposure)
20Non performing loans (NPL)
Stable NPL portfolio
Development NPLs ▪ Stable in Q1 2021
€ mn Total NPL / Total CREF portfolio % NPL ratio
▪ Minor overall changes incl. FX-effects
2.500 9,0%
6,9% 6,9%
▪ Close and dedicated monitoring of exposure continued
2.000 6,3% 6,1% 6,0%
6,0%
1.500 4,2%
1.000 1.929
1.721 1.664 1.651 3,0%
1.645
500 1.085
0 0,0%
12/2016 12/2017 12/2018 12/2019 12/2020 03/2021
NPLs by country NPLs by property type
others: 4% (4%) (vs 12/2020) others: 12% (12%) (vs 12/2020)
Office: 1% (1%)
USA: 17% (18%) Italy: 30% Residential: 3% (2%)
(30%)
Logistic: 12% (12%)
Finland: 6% (6%)
€ 1,651 mn € 1,651 mn Retail: 53%
(55%)
France: 7% (7%)
Hotel: 19% (18%)
Spain: 10% (10%) UK: 26%
(25%)
21Segment: Banking & Digital Solutions
Growing NCI, deposits at high level
NCI Growing NCI
€ mn
12 ▪ NCI increased by ~35% vs. Q1/20 fully in line with
FY-guidance
9 ▪ Further progress in digital solutions
▫ Integration of PayPal and credit card payments
6 in Aareal Exchange & Payment Platform
8 ▫ Roll-out of Aareal Meter on track
7 7
3 6 ▪ Further development of product range also via new
5
partnerships
0
Q1 2020 Q2 2020 Q3 2020 Q4 2020 Q1 2021
Deposits by type Deposits at high level
Maintanance ▪ Deposits from rental guarantees and maintenance
reserve: 18% reserves further increased
>
▪ Stickiness during crises proven:
Even Corona did not have negative impact on deposits
€ 11.6 bn
Rental guaranty
deposits: 19%
Sight
deposits:
63%
22Segment: Aareon
M&A activities and Products / Markets
Progress on M&A activities and the development of products, markets
▪ Signing of Twinq acquisition, Netherlands, in Q2/21 - market-leading software
specialist for private owned housing market – complementing the offering of
Aareon NL and manifesting its leading position in the market
▪ Extensive market screening, numerous opportunities have been identified. They are
systematically pursued: The promising M&A pipeline will lead to upside potential on
M&A activities top of communicated mid-term adj. EBITDA-target
▪ Credit facility of € 250 mn provided by Aareal to finance M&A
▪ Arthur Online Ltd., UK: Transaction successfully closed in January. Post merger
integration project has started. Enables Aareon to develop the market for small and
medium-sized property managers in the UK
▪ High demand for next generation ERP product Wodis Yuneo in Germany with more
than 320 customer (30% of Wodis customers) already contracted. Wodis Yuneo has
high flexibility due to web-based technology and features with intelligent tools and
analytics components as well as optimised user interface
Products/Markets
▪ Neela AI based Virtual Assistant: First Pilot customers.
Marketing Launch in France in January.
▪ CalCon – new Logos for new product generation AiBATROS
23Segment: Aareon
Increased sales revenue yoy despite Covid-19 effects, Adj.
EBITDA stable
Sales revenue ▪ Sales revenues increased by € 2 mn to € 66 mn
€ mn (+2% yoy) despite Covid-19 interference,
75
66
64 Q1/20 revenues (almost) unaffected from the crisis
15 16 ▪ Digital revenues ex PS1) up 16% yoy (incl. PS up 9%),
50 PS revenues were impacted by Covid-19
▪ ERP revenues ex PS up 3% yoy (incl. PS flat)
▪ Healthy license traction in DACH, e.g. Wodis Yuneo,
25 49 49 thriving recurring stream
▪ High share of recurring revenue (>67%, Q1/20: 65%),
steadily growing
0
▪ FY-outlook confirmed despite ongoing Covid-19 related
Q1 2020 Q1 2021
ERP revenue Digital revenue challenges in Professional Services
Adj. EBITDA ▪ Q1/21-adj. EBITDA on last year’s (pre Covid-19) level
€ mn
25 ▪ Good sales revenue momentum compensated
Adj. EBITDA margin increased cost base from higher FTE, anticipating
23% 22%
20
further growth
15 ▪ EBITDA Q1/21 adjusted by € 4 mn (Q1/20: € 1 mn)
from ramping-up strategic M&A roadmap and
10 investments in New Products and VCP strategy
15 15
5
0
Q1 2020 Q1 2021
Note: Numbers not adding up refer to rounding
1) PS (Professional Services) = Consulting business
24Capital, Funding & Liquidity 25
Capital
CET1 ratios in Q1/21 up despite portfolio growth
                                     Capital ratios                                          ▪ RWA decrease
40%                 Basel 3                                Basel 4   (phase-in)1)                ▫ Quality improvements and relief in operational risk
35%                                                                                                overcompensating effects from portfolio growth
30%          28.0%
                              26.0%                       25.7%                              ▪ CET1 increase
                                                                          23.7%
25%          6,7%             4,0%           T2
                              2,5%
                                                           6,1%           3,7%                   ▫ Mainly due to relief from reduced pension liabilities
20%          2,5%                            AT1                          2,3%
                                                           2,3%
15%                                          CET1                                                ▫ Intended dividend payout of a total of € 1.50 per
10%
                                                                                                   share in 2021 for 2020 and pro rata 2021 dividend
             18,8%            19,5%                       17,3%           17,7%                    in line with dividend policy already deducted1)
5%
0%                                                                                           ▪ Redemption of € 300 mn Tier 2 Notes in Q1 reflected
        31.12.2020 31.03.2021                          31.12.2020 31.03.2021                   in total capital ratios, further optimisation potential
                                                                                             ▪ T1-Leverage ratio at 5.7% despite TLTRO participation
                                         RWA
                                                                                             ▪ Remaining regulatory uncertainties
15                  Basel 3                                Basel 4 (phase-in)1)
      € bn
                                                                                               (models, ICAAP, ILAAP, B4 etc.)

10
                                                            13,2
             12,1                                                           13,1
                              11,9
 5

 0
       31.12.2020        31.03.2021                     31.12.2020       31.03.2021

      1) The dividend payment of € 1.50 per share in 2021 for the financial year 2020 would need to be made in two steps. In compliance with the
         requirements published by the European Central Bank (ECB) on 15 December 2020, the distributable amount is € 0.40 per share.
         The Management Board will submit a proposal for the appropriation of profits to the ordinary Annual General Meeting in May 2021.
26       Depending on the economic developments, the regulatory requirements, the capital position and the risk situation of the bank,
         an extraordinary Annual General Meeting, which could possibly take place in the fourth quarter, could then decide on the intended
         remaining payout of € 1.10 per share.
SREP (CET 1) requirements
Demonstrating conservative and sustainable business model
CET1 ratios vs. SREP (CET1) requirements
25% ▪ Capital ratios significant above SREP requirements
▪ P2R relief by using possibility of partially fulfilling
requirements with AT1 and T2 capital
19.5%
20% ▪ Total capital requirement 2021 (Overall Capital
17.7% Requirement (OCR)) amounts to 12.8% compared
to 26.0% total capital ratio
▪ All ratios already include TRIM effects as well as
15%
13.2% prudential provisioning
9.26%
10% 0.01% 8.28%
0.01%
2,50%
2,50%
2,25%
5% 1,27%
4,50% 4,50% Countercyclical Buffer
Capital Conservation Buffer
0% Pillar 2 Requirement
31.03.2021 31.03.2021 31.03.2021 SREP 2021 SREP 2021 Pillar 1 Requirement
B3 CET1 B4 CET1 B4 CET1 incl. P2R
(phase-in) (fully relief
phased)
27B/S structure according to IFRS
Well balanced
€ bn
50
As at 31.03.2021 € 46.5 bn (31.12.2020 € 45.5 bn)
45
7.2 (5.8) Money Market 9.0 (8.7) Money Market
40
8.5 (8.6)
35 Treasury portfolio 10.7 (10.6)
Deposits from housing
of which cover pools industry clients
30
27.6 (27.2)
Commercial real estate
25 finance portfolio 24.0 (23.4)
Long-term funds
and equity
20 of which
▪ 20.4 (19.5)
Long-term funds
15
− 12.6 (11.7) PB
− 7.8 ( 7.8) SU
10 ▪ 0.9 (1.2)
Subordinated capital
▪ 2.7 (2.7)
5 Shareholders’ equity
3.2 (3.9) Other assets1) 2.8 (2.8) Other liabilities
0
Assets Liabilities & equity
1) Other assets includes € 0.3 bn private client portfolio and WIB’s € 0.3 bn public sector loans
28Funding & Liquidity
Diversified funding sources and distribution channels
▪ Sustainable and strong housing industry deposit base
€ part of well diversified funding mix
▪ Successful funding activities in 2021
▫ January:
€ 500 mn Pfandbrief Benchmark with a 7 year tenure
very successfully placed
▫ February:
$ 750 mn Pfandbrief Benchmark with a 4 years
maturity and a well oversubscribed orderbook
placed mainly outside Germany (GER < 30%)
▫ April:
Inaugural SONIA linked £ 500 mn Pfandbrief
predominantly distributed to new UK investors
▪ First Green bond issuance planned in H2 2021
▪ Participation in ECB’s TLTRO (€ +1 bn) increased
to a total of € 5.3 bn
Deposits: Deposits: Senior ▪ Overall refinancing activities exceed more than € 2 bn
Pfandbriefe
Housing industry customers Inst. customers unsecured equivalent and is slightly above funding plan
▪ Liquidity ratios significantly over fulfilled:
▫ NSFR > 100%
▫ LCR >> 100%
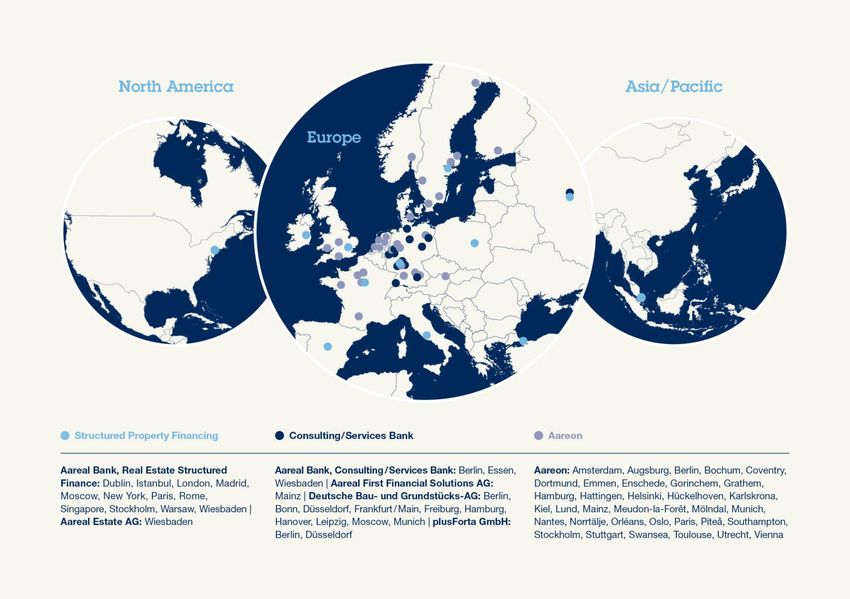
29Mortgage Cover Pool
Well diversified regarding Geography and Property Type
– Cover pool of € 12.5 bn including € 0.7 bn substitute assets diversified over 19 countries
– High quality of assets: first-class mortgage loans (mortgage-lending-value 55.9%)
– Mortgage-lending-value with high discount from market-value
– Ø LTV of the mortgage cover pool 33.5%
– Moody´s has calculated a 'Aaa' supporting over-collateralisation ratio of 16.0% on a PV basis
– Over-collateralisation on a PV basis as of 31.03.2021: 17.5%
– High diversification within property types
Cover Pool by Geography Cover Pool by Property Typ
3.000 2.820 30%
Residential
2.500 25%
property
9%
2.000 1.857 20%
1.760 Office
million
Logistic properties
1.500 1.295 15% 10% 33%
1.000 741
10%
571
488
408
500 283 336 318 5%
221 199
91 145 78
37 19 52
Hotel
0 0%
23%
Retail
properties
25%
30Funding
Favourable market environment used for strong funding activities
Capital markets refinancing activities 2021
0.010% 0.625% 0.250% SONIA +31bps
EUR 500.000.000 USD 750.000.000 TAP EUR 200mn to 500mn GBP 500.000.000
Hypothekenpfandbrief Hypothekenpfandbrief Senior Preferred Hypothekenpfandbrief
7 Years 4 Years 7 Years 4 Years
Maturity 01.02.2028 Maturity 14.02.2025 Maturity 13.11.2027 Maturity 29.04.2025
ISIN: DE000AAR0280 ISIN: XS2297684842 ISIN: DE000A289LU4 ISIN: XS2337339977
Lead Manager Lead Manager Lead Manager Lead Manager
BNPP, Commerzbank, LBBW, Citigroup, Deutsche Bank, Commerzbank, DekaBank, Deutsche Bank, HSBC,
SocGen, UniCredit HSBC, LBBW, NatWest DZ Bank, GS, HSBC NatWest, Nomura
January 2021 February 2021 February 2021 April 2021
Capital markets refinancing activities 2020
0.500% 0.010%
0.250%
EUR 500.000.000 EUR 500.000.000
EUR 300.000.000
Senior Preferred Hypothekenpfandbrief
Senior Preferred
7 Years 6 Years 7 Years
Maturity 07. Apr 2027 Maturity 03. Aug 2026 Maturity 13.11.2027
ISIN: DE000AAR0264 ISIN: DE000AAR0272 ISIN: DE000A289LU4
Lead Manager Lead Manage
BayernLB, Deka Bank, BNP Paribas, Commerzbank, Sole-Lead Manager
DZ Bank, HSBC, Natixis Deutsche Bank, Helaba, Goldman Sachs
UniCredit
September 2020 October 2020 November 2020
31Treasury portfolio
€ 7.3 bn of high quality and highly liquid assets
TR portfolio development ▪ Regional portfolio split further diversified with additional
€ bn investments in France and the Netherlands
10
▪ Investments in Covered Bonds significantly supported
8 the spread improvement
6 ▪ Further de-risking of Italian bonds supporting
optimisation of the TR-portfolio regarding the
4 8,0 8,7 economic perspective
7,3 7,2 7,3
2
0
12/2017 12/2018 12/2019 12/2020 03/2021
TR portfolio by rating1) TR portfolio by asset class
€ mn € mn Covered Bonds / (vs Q4/2020)
BBB: 10% (11%) 0% Financials: 3%
A: 5% (2%)
(5%)
AAA: 38%
(38%)
Public Sector
Debtors: 97%
(98%)
AA: 47%
(46%)
As at 31.03.2021 – all figures are nominal amounts
1) Composite Rating
32Outlook 2021 33
Outlook 2021
Confirmed

                                     METRIC                                                             2020                                         OUTLOOK 20211)

                    ▪ Net interest income                                                            € 512 mn                                           € 550 - 580 mn
                    ▪ Net commission income                                                          € 234 mn                                           € 250 - 270 mn
                    ▪ LLP                                                                            € 344 mn                                           € 125 - 200 mn
 Group

                    ▪ Admin expenses                                                                 € 469 mn                                           € 520 - 540 mn

                    ▪ Operating profit                                                                € -75 mn                                         € 100 - 175 mn
                    ▪ Earnings per share (EPS)                                                         € -1.50                                          € 0.70 - 1.50

                       Aareal Next Level                                                                METRIC                           2020                OUTLOOK 20211)

                                                             Structured                       ▪ REF Portfolio                         € 27.8 bn                  € ~29 bn2)
                           „Activate“
                                                         Property Financing                   ▪ New business                          € 7.2 bn                 € 7 bn - € 8 bn
 Segments

                                                           Banking & Digital                  ▪ Deposit volume                        € 11.0 bn                   € ~11 bn
                            „Elevate“
                                                              Solutions                       ▪ NCI                                   € 26 mn                     € ~28 mn

                                                                                              ▪ Revenues                              € 258 mn               € 276 mn - € 280 mn
                         „Accelerate“                              Aareon
                                                                                              ▪ Adj. EBITDA                           € 62 mn                 € 63 mn - € 65 mn

            1) Based on “Swoosh” scenario. In the current environment, this forecast is subject to significant uncertainty, especially with regard to the
               assumed duration and intensity of the crisis, the pace of recovery and the associated effects on our clients, as well as prevailing unclear
               regulatory and accounting provisions, and the possibility that individual loan defaults cannot be reliably predicted.
34          2) Subject to FX development
Key Takeaways 35
Key takeaways

     Strong start into the year: immediate return to profitability
     ▪ Earnings in the first quarter of 2021 tripled year-on-year
     ▪ Net interest and commission income increased as expected
     ▪ Low loan loss provision after comprehensive risk provisioning in 2020
     ▪ Increased FY-effect of bank levy considered in Q1

     Robust operating performance: growth in all three segments
     ▪ SPF: Loan portfolio increased further at attractive margins and good LTVs on track to reach € 29 bn
     ▪ BDS: Product portfolio expanded, fee income increased
     ▪ Aareon: Revenue increased despite ongoing Covid-19 challenges in Consulting business

     Outlook confirmed despite ongoing uncertainties
     ▪ Gradual economic recovery expected in the course of 2021 and 2022
     ▪ Aareal Next Level: Strategic growth initiatives in all segments well on track
     ▪ Operating profit outlook for 2021 confirmed – between € 100 mn and € 175 mn

36
Group results Q1 2021 37
Aareal Bank Group
Results Q1 2021

                                                                                                                           01.01.-                 01.01.-
                                                                                                                                                             Change
                                                                                                                       31.03.2021              31.03.2020
                                                                                                                        € mn                   € mn
Profit and loss account
Net interes t incom e                                                                                                            138                  123             12%
Los s allowance                                                                                                                     7                  58         -88%
Net com m is s ion incom e                                                                                                        59                   57             4%
Net derecognition gain or los s                                                                                                     0                   7
Net gain or los s from financial ins trum ents (fvpl)                                                                              -1                  10        -110%
Net gain or los s on hedge accounting                                                                                              -3                   1        -400%
Net gain or los s from inves tm ents accounted for us ing the equity m ethod                                                        0                   0
Adm inis trative expens es                                                                                                       150                  129             16%
Net other operating incom e / expens es                                                                                            -4                   0
Operating Profit                                                                                                                  32                   11         191%
Incom e taxes                                                                                                                     11                    4         175%
Consolidated net income                                                                                                           21                    7         200%
Cons olidated net incom e attributable to non-controlling interes ts                                                                1                   1
Cons olidated net incom e attributable to s hareholders of Aareal Bank AG                                                         20                    6         233%

Earnings per share (EpS)
                                                                                        1)
Cons olidated net incom e attributable to s hareholders of Aareal Bank AG                                                         20                    6         233%
 of which: allocated to ordinary s hareholders                                                                                    16                    2         700%
 of which: allocated to AT1 inves tors                                                                                              4                   4             0%
Earnings per ordinary s hare (in €) 2)                                                                                          0.27                 0.04         575%
                                           3)
Earnings per ordinary AT1 unit (in €)                                                                                           0.04                 0.04             0%

     1) The allocation of earnings is based on the assumption that net interest payable on the AT1 bond is recognised on an accrual basis.
     2) Earnings per ordinary share are determined by dividing the earnings allocated to ordinary shareholders of Aareal Bank AG by the
        weighted average of ordinary shares outstanding during the financial year (59,857,221 shares). Basic earnings per ordinary share
        correspond to diluted earnings per ordinary share.
     3) Earnings per AT1 unit (based on 100,000,000 AT1 units with a notional amount of 3 € each) are determined by dividing the earnings
        allocated to AT1 investors by the weighted average of AT1 units outstanding during the financial year. Earnings per AT1 unit (basic)
38      correspond to (diluted) earnings per AT1 unit.
Aareal Bank Group
Results Q1 2021 by segments
A
Structured Banking &
a Consolidation/ Aareal Bank
Property Digital Aareon
r Reconciliation Group
Financing Solutions
e
01.01.- 01.01- 01.01.- 01.01- 01.01.- 01.01- 01.01.- 01.01- 01.01.- 01.01-
31.03. 31.03. 31.03. 31.03. 31.03. 31.03. 31.03. 31.03. 31.03. 31.03.
2021 2020 2021 2020 2021 2020 2021 2020 2021 2020
€ mn
Net interest income 127 113 11 10 0 0 0 0 138 123
Loss allowance 7 58 0 0 7 58
Net commission income 2 2 7 5 53 53 -3 -3 59 57
Net derecognition gain or loss 0 7 0 7
Net gain or loss from financial instruments (fvpl) -1 10 0 -1 10
Net gain or loss on hedge accounting -3 1 -3 1
Net gain or loss from investments
0 0 0 0
accounted for using the equity method
Administrative expenses 84 68 19 18 50 46 -3 -3 150 129
Net other operating income / expenses -5 0 0 0 1 0 0 0 -4 0
Operating profit 29 7 -1 -3 4 7 0 0 32 11
Income taxes 10 3 0 -1 1 2 11 4
Consolidated net income 19 4 -1 -2 3 5 0 0 21 7
Allocation of results
Cons. net income attributable to non-controlling
0 0 0 0 1 1 1 1
interests
Cons. net income attributable to shareholders of
19 4 -1 -2 2 4 0 0 20 6
Aareal Bank AG
39Aareal Bank Group
Results – quarter by quarter
Structured Property Banking & Digital Consolidation /
Aareon Aareal Bank Group
Financing Solutions Reconciliation
Q1 Q4 Q3 Q2 Q1 Q1 Q4 Q3 Q2 Q1 Q1 Q4 Q3 Q2 Q1 Q1 Q4 Q3 Q2 Q1 Q1 Q4 Q3 Q2 Q1
2021 2020 2021 2020 2021 2020 2021 2020 2021 2020
€ mn
Net interest income 127 129 119 113 113 11 10 9 10 10 0 0 0 -1 0 0 0 0 0 0 138 139 128 122 123
Loss allow ance 7 177 61 48 58 0 0 0 0 0 7 177 61 48 58
Net commission income 2 4 1 1 2 7 8 6 7 5 53 58 53 49 53 -3 -4 -3 -3 -3 59 66 57 54 57
Net derecognition
0 9 3 9 7 0 9 3 9 7
gain or loss
Net gain / loss from fin.
-1 -21 -4 -17 10 0 0 0 0 0 -1 -21 -4 -17 10
instruments (fvpl)
Net gain or loss on
-3 2 2 1 1 -3 2 2 1 1
hedge accounting
Net gain / loss from
investments acc. for 2 0 -1 0 0 0 0 1 0 0 0
using the equity method
Administrative
84 54 56 49 68 19 18 15 17 18 50 50 46 46 46 -3 -5 -3 -3 -3 150 117 114 109 129
expenses
Net other operating
-5 -3 0 -11 0 0 0 0 0 0 1 3 0 1 0 0 -1 0 0 0 -4 -1 0 -10 0
income / expenses
Operating profit 29 -109 4 -1 7 -1 0 0 0 -3 4 10 7 3 7 0 0 0 0 0 32 -99 11 2 11
Income taxes 10 -18 9 -8 3 0 1 -1 0 -1 1 4 2 1 2 11 -13 10 -7 4
Consolidated net
19 -91 -5 7 4 -1 -1 1 0 -2 3 6 5 2 5 0 0 0 0 0 21 -86 1 9 7
incom e
Cons. net income
attributable to non- 0 0 0 0 0 0 0 0 0 0 1 3 1 0 1 1 3 1 0 1
controlling interests
Cons. net income
attributable to ARL 19 -91 -5 7 4 -1 -1 1 0 -2 2 3 4 2 4 0 0 0 0 0 20 -89 0 9 6
shareholders
40Asset quality 41
CREF portfolio by country
€ 27.6 bn highly diversified

                                                                      CREF portfolio (€ mn)
8.000        7.339
                                                                                                                € 27.6 bn (12/2020: € 27.2 bn)
6.000
                              4.432
4.000                                         2.966           2.634
                                                                       1.502                                                        3.130
2.000                                                                             1.364   1.274      1.224   920          806
      0
               US              UK              DE              FR        IT        CA         ES      NL      PL          SE        others
                                                                               LTV1)
100%
               66%                                                                71%                              Ø LTV: 60% (12/2020: 60%)
 80%                          57%
                                               54%             54%      59%                   53%    58%     59%         54%         56%
 60%
 40%
 20%
  0%
               US              UK              DE              FR        IT        CA         ES      NL      PL          SE        others
                                                                               YoD1)
 16%
                                                                                                                Ø YoD: 6.3% (12/2020: 6.7%)
 12%                                                                                                         9,6%
                                              8,5%                                            8,8%                     8,3%
     8%       6,7%            5,4%                            6,4%      7,2%
                                                                                                                                  6,2%
                                                                                                     3,3%
     4%                                                                           0,9%
     0%
               US              UK              DE              FR        IT        CA         ES      NL      PL          SE        others
     Note: others incl. countries with a portfolio below € 500 mn
     1) Performing CREF-portfolio only (exposure)

42
CREF portfolio by property types
€ 27.6 bn highly diversified
CREF portfolio (€ mn)
10.000 9.001 8.086
€ 27.6 bn (12/2020: € 27.2 bn)
8.000 5.994
6.000
2.919
4.000
2.000 1.230 360
0
Hotel Office Retail Logistic Residential Others
LTV1)
Ø LTV: 60% (12/2020: 60%)
100%
80% 61%
63% 58% 55% 50% 50%
60%
40%
20%
0%
Hotel Office Retail Logistic Residential Others
YoD1)
Ø YoD: 6.3% (12/2020: 6.7%)
15%
8,9% 9,5% 8,9% 9,1%
10% 8,0%
5% 2,0%
0%
Hotel Office Retail Logistic Residential Others
1) Performing CREF-portfolio only (exposure)
43Western Europe (ex Germany) CREF portfolio
Total volume outstanding as at 31.03.2021: € 9.6 bn
by product type by property type
Developments: 1% Residential: 1) Others: 1%
3%
Logistic: 9%
Retail: 17% Hotel: 45%
Investment
finance: 99%
Office: 25%
by performance by LTV ranges2)
NPLs 60-80%: 3% >80%: > 0%
6%
Performing < 60%: 97%
94%
1) Incl. Student housing (UK & Australia only)
2) Performing CREF-portfolio only (exposure)
44German CREF portfolio
Total volume outstanding as at 31.03.2021: € 3.0 bn
by product type by property type
Others: 80%: > 0%
< 1%
Performing < 60%: 96%
99%
1) Performing CREF-portfolio only (exposure)
45Southern Europe CREF portfolio
Total volume outstanding as at 31.03.2021: € 2.8 bn
by product type by property type
Develop- Others: > 0% Others: 8%
ments: 5% Residential: 1%
Hotel: 7%
Logistic: 15%
Investment Retail: 51%
finance: 95%
Office: 18%
by performance by LTV ranges1)
60-80%: 3% > 80%:< 1%
NPLs
23%
Performing
77%
< 60%: 96%
1) Performing CREF-portfolio only (exposure)
46Eastern Europe CREF portfolio
Total volume outstanding as at 31.03.2021: € 1.4 bn
by product type by property type
Developments: 1% Others: 1% Hotel: 7%
Retail: 20%
Investment Logistic: 47%
finance: 98% Office: 26%
by performance by LTV ranges1)
NPLs 60-80%: 4%
5%
Performing < 60%: 96%
95%
1) Performing CREF-portfolio only (exposure)
47Northern Europe CREF portfolio
Total volume outstanding as at 31.03.2021: € 1.3 bn
by product type by property type
Hotel: 6% Others: < 1%
Logistic: 20%
Retail: 41%
Investment
finance: 100%
Office: 32%
by performance by LTV ranges1)
NPLs 60-80%: 3%
8%
Performing
92% < 60%: 97%
1) Performing CREF-portfolio only (exposure)
48North America CREF portfolio
Total volume outstanding as at 31.03.2021: € 8.7 bn
by product type by property type
Residential: 2% Logistics: 1%
Retail: 14%
Office: 45%
Hotel: 38%
Investment
finance: 100%
by performance by LTV ranges1)
NPLs > 80%: 1%
60-80%: 11%
3%
Performing < 60%: 88%
97%
1) Performing CREF-portfolio only (exposure)
49Asia / Pacific CREF portfolio
Total volume outstanding as at 31.03.2021: € 0.8 bn
by product type by property type
Office: 3%
Logistics 8%
Retail: 14%
Hotel: 43%
Investment
finance 100% 1)
Residentail:
32%
by performance by LTV ranges2)
60-80%: 3%
Performing < 60%: 97%
100%
1) Incl. Student housing (UK & Australia only)
2) Performing CREF-portfolio only (exposure)
50Aareal‘s Green Finance Framework finalised and
endorsed through an SPO by Sustainalytics – publication
to follow shortly
All of the building(s) securing a loan must fulfil at least one of the following criteria in order for the loan to be classified as green
Buildings meet the EU Taxonomy criteria according to the EU Commission Delegated
1. Classification as EU taxonomy compliant
Regulation, Chapter 7.7 “Acquisition and ownership of existing buildings”
Existence of a reputable (referring to the World Green Building Council) green building
certificate with an above-average rating, according to the below listed rating categories
of the following providers:
▪ BREEAM: "Outstanding“, "Excellent“ and “Very Good”
2. Green building certification (type/level) ▪ LEED: "Platinum" and "Gold"
▪ DGNB: "Platinum" and "Gold"
▪ HQE: "Exceptional" and "Excellent"
▪ Green Star: "6 Stars" and "5 Stars"
▪ NABERS: "6 Stars", "5 Stars" and “4 Stars”
The property meets the national requirements for a nearly zero-energy building (nZEB)
valid at the time of the financing commitment and / or
The property falls below the maximum energy reference values
3.Energy efficiency of the property
75 kWh/m² p.a. Residential
140 kWh/m² p.a. Office, Hotel, Retail
65 kWh/m² p.a. Warehouse / Logistics
51Segments: Aareon 52
Segment: Aareon
P&L and other KPIs
P&L Aareon segment -                                                                                    R&D, RPU and operating cashflow
                                                                                 ∆ Q1    ∆ 3M
Industry format1)    Q1’20 3M’20 Q2’20 Q3’20 Q4’20 3M’21
                                                                                ’21/’20 ’21/’20
€ mn
                                                                                                      Revenue per unit (RPU) – LTM (€)       24
Sales revenue                    64        64      61      63       70    66       2%       2%
 ▪ Thereof ERP                    49       49       47         49    53    49      0%       0%
 ▪ Thereof Digital                15       15       15         14    17    16      9%       9%
Costs2)                         -50       -50     -51     -50       -53   -55      9%       9%    R&D spend as % of software revenue – YTD   21%
 ▪ Thereof material              -11       -11     -12     -10      -12   -12      8%       7%             Capitalisation ratio (%)          18%

EBITDA                           14        14      10      13       17    10     -24%     -24%
Adjustments2)                     -1       -1      -2          -2    -4    -4 >100%     >100%          YTD Operating Cash Flow (€ mn)        18
Adj. EBITDA                      15        15      12      14       21    15       0%       0%

EBITDA                           14        14      10      13       17    10    -24%     -24%
D&A / Financial result            -7       -7       -7         -6    -6    -7     1%       1%
EBT / Operating profit             7        7       3          6    10     4    -47%     -47%

       1) Calculation refers to unrounded numbers
       2) Incl. New product, VCP, Ventures, M&A and one-offs

53
Aareal Next Level – 360o-review 54
Aareal enters into first stage evolution of ’Aareal Next Level’
Operating profit target of € ~300 mn to be achieved already in 20231)

      January               ▪ We introduced our strategy ’Aareal Next Level’ with three strategic pillars ACTIVATE!, ELEVATE!
       2020                   and ACCELERATE!

                            ▪ Management initiated a 360° review of ’Aareal Next Level’ in the context of Covid-19 and its
                              mid term structural implications supported by McKinsey
      Q4 2020
                            ▪ Key focus of 360° review: i) create sustainable shareholder value in a new normal after Covid-19
                              with the aim of earning our CoE mid-term1) and ii) resume our track record as reliable dividend payer 2)

                            ▪ 360° review confirms ’Aareal Next Level’ remaining a successful and attractive strategy even in a
                              post Covid-19 environment. Thus, we will enter into first stage evolution of ’Aareal Next Level’

                            ▪ We identified 1 2 3 4 5 additional levers within the ’Aareal Next Level’ strategic framework
                              to significantly improve our successful performance in the future
     Early 2021
                            ▪ We envisage to achieve an operating profit target of € ~300 mn already in 20233) which translates
                              into a return on equity after taxes of ~8%1) on Group as well as on Bank level

                            ▪ Free capital retained for either M&A and/or capital management

      1) 15% CET 1 reference ratio (Basel IV, phase-in, revised IRBA) exceeding the market average as a reference; excluding any potential
          acquisitions; subject to the Covid 19 crisis being fully overcome by then
      2) Subject to ECB approval
55    3) Excluding any potential acquisitions, and subject to the Covid-19 crisis being fully overcome by then
      Note: All 2020 figures preliminary and unaudited
’Aareal Next Level’ strategy confirmed as successful and attractive
Operating profit target of € ~300 mn to be achieved already in 20231)
Strategy and business model confirmed, being successful in a normalised environment post Covid-19
First evolution of ’Aareal Next Level’ enables utilising market opportunities in Covid-19 environment and
increase efficiency in organisation, of processes and infrastructure
Operating profit target of € ~300 mn to be achieved already in 20231) translating into a RoE after taxes
of ~8%2) on Group and Bank level
Transformation, innovation and investment budgets
▪ Aareal Bank: i) transformation budget of € 10 mn fully financed by related positive one-offs and ii) innovation
budget for growth initiatives of on avg. € ~2 mn p.a. (2021 - 2023) to boost NCI in Banking & Digital Solutions 3)
▪ Additional investment budget4) for Aareon with growth costs in context of VCP implementation (2021: € ~8 mn)
leading to a temporary dilution of EBT
1) Excluding any potential acquisitions, and subject to the Covid-19 crisis being fully overcome by then
2) 15% CET 1 reference ratio (Basel IV, phase-in, revised IRBA) exceeding the market average as a reference; excluding any potential
acquisitions; subject to the Covid 19 crisis being fully overcome by then
3) Formerly known as Consulting / Services Bank: has been renamed effective from Jan. 2021
56 4) Excluding costs for Aareon M&A and M&A financing
Note: All 2020 figures preliminary and unauditedACTIVATE! Structured Property Financing
Take advantage of market opportunities, grow book and optimize funding
We continue to leverage on expanded origination, structuring and exit opportunities – “Play the Matrix"
i .e. countries, property types and structures
Lever First stage evolution of ’Aareal Next Level’ Targets
Continue to pursue risk-conscious and ESG conform, organic expansion of financing REF portfolio:
1
business based on attractive margins to increase our on-balance credit portfolio YE 21: € ~29 bn
▪ As done in Q4, utilizing market opportunities in the Covid-19 environment with attractive YE 22: € ~30 bn
risk / return profiles building on our USPs
▪ Increase our NII, leverage our platform and enhance profitability through RoE accretive
business, syndication capability is continuously used to improve structure of new
business and profitability / return
▪ We will continue to further develop our asset light strategy
2 Optimisation of funding mix and capital structure to enhance profitability and return Q1 21:
Termination of
▪ Review and fine-tune our liquidity and ALM strategy, but maintain prudent liquidity ratios
T2 € 300 mn
▪ Enhance our funding mix regarding new products e.g. establishing a CP programme
YE 22:
and optimize funding costs, by speeding up our cover pool process Executed ALM /
▪ Optimize our regulatory capital structure liquidity strategy
57
Note: All 2020 figures preliminary and unauditedACTIVATE! We continue to strive towards greater ESG-transparency
Preliminary data on climate performance for about 85% of our existing
CREF portfolio has been collected – pursuit of further data ongoing
External recognition
Improvement of ESG-Transparency
• Together with our clients we are striving to achieve maximum transparency
relating to the environmental performance of our commercial real estate
finance portfolio
• Through an ongoing dialogue with our clients and research in external
databases we have been able to gather preliminary data on about 85%
of our CREF portfolio
• For approximately 65% of our CREF portfolio we know of robust building
certificates (i.e. DGNB, BREEAM, HQE, LEED, NABERS) or energy-
performance certificates or both
• We continue our effort in improving the extent, level of detail and quality
Transparency of our ESG-data together with our clients
• At the same time we are implementing further enhancements to our IT-Systems
in order to accommodate documentation of relevant climate-performance data
Our target remains to achieve full transparency relating to
climate performance in 2022
58
Note: All 2020 figures preliminary and unauditedELEVATE! Banking & Digital Solutions1)
Leverage on our deeply embedded customer integration and increase NCI
We continue to leverage and grow our housing and adjacent industries business through elevation and
expansion of our product suite with focus on NCI based income and take opportunities in cooperation with
customers and other partners
Lever First stage evolution of ’Aareal Next Level’ Targets
Increase our opportunities for a further expansion with a particular focus on Ø 23: Deposit
3
our net commission income in our Digital Solutions business volume of
▪ Sharpening our strategic profile and enhance our development capabilities € >11 bn
▪ Continue to leverage and grow our housing and adjacent industries business through Grow NCI with
cross selling with an increasing contribution of our innovation portfolio a CAGR of 13%
until 2023
➢ grow NCI with a CAGR of 13% until 2023
▪ On top: Innovation budget for growth initiatives of on average € ~2 mn p.a. between Ambition to
2021 and 2023 together with pursuing selected M&A opportunities with the ambition double NCI
to double NCI until 2025 until 2025
We reconfirm the attractiveness of our deposit base in our Banking business
which is deeply imbedded in our clients’ processes
▪ Sticky deposit base at attractive terms and costs from group perspective, further
upside in a rising rate environment and the opportunity of additional cross selling
1) Formerly known as Consulting / Services Bank: has been renamed effective from Jan. 2021
59
Note: All 2020 figures preliminary and unauditedACCELERATE! Aareon
VCP to increase mid-term adj. EBITDA target to € 135 mn, M&A on top
We continue to strengthen Aareon’s position as the leading and independent software company for the
property industry with a strong value proposition
Lever First stage evolution of ’Aareal Next Level’ Targets
VCP, developed with Advent, Aareon and Aareal, to increase mid-term adj. EBITDA YE 23: VCP with
4 target from € >110 mn to € 135 mn and M&A on top add. positive EBT
▪ Accelerate investment in developing new digital products and offerings impact (organic)
to add to Aareon’s growing portfolio of Digital Solutions
YE 25: Increase
▪ Go to market excellence and accelerate “new logo” wins adj. EBITDA from
€ >110 mn to
▪ Leveraging Aareon’s core ERP installed base to upsell / cross sell new modules
€ ~135 mn;
and digital solutions from Aareon’s Smart World
achieve
▪ Additional investment budget1) for Aareon with growth costs in context of Rule of 402)
VCP implementation (2021: € ~8 mn) leading to a temporary dilution of EBT
Implementing Aareon’s strategic M&A roadmap EBITDA from
M&A M&A on top
▪ Execution of strategic M&A roadmap and EBITDA contribution from M&A activities on top
▪ Initially up to € 250 mn debt funding of M&A roadmap negotiated
▪ Recent acquisition of SaaS company Arthur being the first evidence of the successful
partnership with Advent
1) Excluding costs for Aareon M&A and M&A financing
2) Rule of 40: Sum of Aareon’s annual revenue growth and adj. EBITDA margin will at least reach 40%
60
Note: All 2020 figures preliminary and unauditedAareon unmatched growth opportunity
Substantial upside unlocked through a combination of RPU growth and unit expansion
• Highly integrated digital ecosystem Aareon Increase RPU –
Smart World Following the US Market experience
• End-to-end product suite and roadmaps, from
ERP to Digital Solutions
• Strong pan-European M&A roll-up platform
)
61
Note: All 2020 figures preliminary and unauditedAareon elevated to a “Rule of 40 company”
Well structured M&A process
• Highly attractive M&A platform, with opportunity to
further scale internationally
• New M&A and PMI teams implemented
• Sharpened & expanded M&A pipeline is systematically
pursued – considering mature business & high growth
ventures
• Financing structure for M&A has been negotiated (€250m)
Value Creation Program
• Go-To-Market: Improve GTM excellence with focus on
targeting new logos and driving up-/cross-sell. Opportunity
to extend value based packages to customers while driving
digitalisation of industry
• SaaS Acceleration: Drive SaaS to realise higher share of
recurring revenues
Operational business (as presented at Investor Day)
• ERP 2025: Ambitious continuation of implementation • Software Implementation Efficiency: Accelerate growth
of new ERP product generations from recurring software through highly efficient software
• Offer Digital Solutions, continued investment in implementations
developing innovative and competitive digital products • Operations Excellence: Leverage potential organisational
• Employee Engagement Program: Empower people for value creation levers that could support growth
success • 36One: Provide a data lake for reporting excellence.
Improve back office performance and automation
62
Note: All 2020 figures preliminary and unauditedAareon further increased strong financial outlook
Despite Covid-19 pandemic KPIs remained rather solid in 2020
Former Mid-
2020A 2025E
Term
Revenue growth 2% 7-9% 10%*
% Recurring revenues of total
67% - 70%
revenue
Revenue per unit (RPU) in € 24 35-40 40
Adj. EBITDA in €m (without
62 110 135
M&A)
Rule of 40 27% - ≥40%
% R&D spend**
22% 20% 20%
(of software revenue)
**short-term up to 25% *CAGR 20/25
63
Note: All 2020 figures preliminary and unauditedOrganisation: Implementation of group wide efficiency measures
Maintaining strict cost discipline and implement further efficiency measures
Lever First stage evolution of ’Aareal Next Level’ Targets
5 Objective of further efficiency measures in organisation, processes & infrastructure YE 23:
SPF CIR
▪ IT Next Level: Further reduction of specific internal developments and implementation of
standardized applications in our S4 Hana environment will i) further reduce complexity of of’Aareal Next Level’: Our KPIs and targets
Operating profit target of € ~300 mn to be achieved already in 20231)
On track to achieve
Our KPIs and targets
’Aareal Next Level’
2020
objectives
2023 2025
(February 2020)
Aareal Bank Group
Mid-single digit growth
▪ Revenues2) € 746 mn ✓ CAGR
€ ~300 mn1)
▪ Operating profit € -75 mn Incl. positive
impact of VCP
▪ RoE post tax Group -3.5% ~8%3)
▪ Dividend policy Announced Unchanged, 50% base dividend plus 20-30% supplementary dividend 4)
Aareal Bank
▪ CIR SPF5) 44%2023 Target RoE post tax above peers…
…despite higher CET1 Ratio
2023 RoE post tax – Broker estimates1)
20%
German Banks Target 2023 of 8%
European Banks RoE post tax 3)
10%
5%
0%
2023 CET1 Ratio – Broker estimates2)
28% 15% CET 1 reference
German Banks ratio (Basel IV, phase-
European Banks in, revised IRBA)3)
16%
14%
12%
10%
1) Euro Stoxx Banks as of 18.02.2021, Average FactSet Consensus, where available: EPS divided by average book value per share
(Source: Factset)
2) Euro Stoxx Banks as of 18.02.2021, Average FactSet Consensus, where available: (Source: Factset)
3) 15% CET 1 reference ratio (Basel IV, phase-in, revised IRBA) exceeding the market average as a reference; excluding any potential
66 acquisitions; subject to the Covid 19 crisis being fully overcome by then
Note: All 2020 figures preliminary and unauditedNext Steps in our ESG Journey
Strengthening ESG as an integral part of our DNA by refining
our strategy and setting ambitious goals and targets
by 2021 and beyond
Strategy
▪ ESG targets for long-term compensation schemes in place Quantitative
Development &
measures1)
Implementation
Selected Examples (Action Areas + Measures + KPIs)
by 2021 and beyond
▪ Feedback Culture: Frequent employee surveys and disclosure External recognition1)
Attractive Employer ▪ Young Talent Management Top-Employer, Fair
▪ Lifelong learning: Learning@Aareal Pay, Gender Equality
by 2021 and beyond
▪ ESG product offering (lending, funding)
Green Offering No. of products1)
Establish Expand
by 2022 and beyond
67 ▪ Continued improvement of extent, level of detail and quality Full ESG
Transparency
of ESG-data for our CREF portfolio together with our clients transparency1)
1) e.g. Building certificates (i.e. DGNB, BREEAM, HQE, LEED, NABERS) or energy-performance certificates based on
an ongoing dialogue with our clients as well as research in external databases
67
Note: All 2020 figures preliminary and unauditedDividend Policy 68
Aareal Next Level
Our Dividend Policy temporarily suspended

 Payout ratio of up to 80%1)                                        Significant book value per share growth incl. dividend
                                                                         €
                                                                    60
                           ▪ We intend to distribute approx. 50%                                                     53     54
       Base                                                                                                   52
                             of the earnings per ordinary share                                        49
     Dividend                                                       50                          47
                             (EpS) as base dividend
                                                                                         44

        +                                                           40            37
                          ▪ In addition, we plan to distribute               32
                            supplementary dividends of up to        30
                            20-30% of the EpS under the
                            following prerequisites:
                                                                    20
Supplementary                 ▫ No material deterioration of the
  Dividend                      environment (with longer-term and
                                                                    10
                                sustainably negative effects)
                              ▫ Nor attractive investment
                                                                     0
                                opportunities neither positive
                                                                         2013     2014   2015   2016   2017   2018   2019   2020
                                growth environment

            ▪ Attractive dividend policy and significant book value growth created sustainable value
              for Aareal and hence our shareholders

     1) ECB approval required

69
     Note: All 2020 figures preliminary and unaudited
AT1: ADI of Aareal Bank AG 70
Interest payments and ADI of Aareal Bank AG
Available Distributable Items (as of end of the relevant year)

                                                                            31.12. 31.12. 31.12. 31.12. 31.12.
                                                                             2016 2017 2018 2019 2020
€ mn

Net Retained Profit                                                          122    147    126    120     90
▪ Net income                                                                 122    147    126    120      90
▪ Profit carried forward from previous year                                    -      -      -      -       -
▪ Net income attribution to revenue reserves                                   -      -      -      -       -

+ Other revenue reserves after net income attribution                        720    720    720    720    840

= Total dividend potential before amount blocked1)                           842    870    846    840    930
./. Dividend amount blocked under section 268 (8)
                                                                             235    283    268    314    320
    of the German Commercial Code
./. Dividend amount blocked under section 253 (6)
                                                                              28     35     42     40     43
    of the German Commercial Code
= Available Distributable Items 1)                                           579    552    536    486    566
+ Increase by aggregated amount of interest expenses relating to
                                                                              46     32     24     23     21
  Distributions on Tier 1 Instruments 1)
= Amount referred to in the relevant paragraphs of the terms and
  conditions of the respective Notes as being available to cover Interest    625    584    560    509    587
  Payments on the Notes and Distributions on other Tier 1 Instruments 1)

       1) Unaudited figures for information purposes only

71
Definitions and contacts 72
Definitions

              New Business         =     Newly acquired business + renewals

            Common Equity                CET 1
               Tier 1 ratio        =     Risk weighted assets
                                         Operating profit/income ./. loss attributable to non-controlling interests ./. AT1 coupon
                 Pre tax RoE       =     Average IFRS equity excl. non-controlling interests, AT1 and dividends
                                         Admin expenses (excl. bank levy)
                           CIR     =     Net income
                                         net interest income + net commission income + net result on hedge accounting + net trading income + results from non -trading
                 Net income        =     assets + results from investments accounted for at equity + results from investment properties + net other operating income
         Net stable funding              Available stable funding
                       ratio       =     Required stable funding
        Liquidity coverage               Total stock of high quality liquid assets
                      ratio        =     Net cash outflows under stress
                                         operating profit ./. income taxes ./. income/loss attributable to non controlling interests ./. net AT1 coupon
        Earnings per share         =     Number of ordinary shares
                                         NOI x 100 (Net operating income, based on 12-months forward looking estimate)
               Yield on Debt       =     Outstanding incl. prior/pari-passu loans (without developments)

             CREF-portfolio        =     Commercial real estate finance portfolio excl. private client business and WIB’s public sector loans

               REF-portfolio       =     Real estate finance portfolio incl. private client business and WIB’s public sector loans

                    NPL-ratio      =     Defaulted exposure acc. CRR (excl. exposure in cure period) / Total CREF Portfolio

73
     Note: All 2020 figures preliminary and unaudited
You can also read