Materials Science & Engineering B
←
→
Page content transcription
If your browser does not render page correctly, please read the page content below
Materials Science and Engineering B 263 (2021) 114859
Contents lists available at ScienceDirect
Materials Science & Engineering B
journal homepage: www.elsevier.com/locate/mseb
Properties of DNA-CTMA monolayers obtained by
Langmuir-Blodgett technique
Aleksandra Radko a, Jacek Nizioł b, *, Katarzyna Makyła-Juzak c, Robert Ekiert d, Natalia Górska c,
Andrzej Górecki d, Monika Marzec a
a
Institute of Physics, Jagiellonian University, Łojasiewicza 11, 30-348 Kraków, Poland
b
AGH University of Science and Technology, Faculty of Physics and Applied Computer Science, Mickiewicza 30, 30-059 Kraków, Poland
c
Faculty of Chemistry, Jagiellonian University, Gronostajowa 2, 30-387 Kraków, Poland
d
Faculty of Biochemistry, Biophysics and Biotechnology, Jagiellonian University, Gronostajowa 7, 30-387 Kraków, Poland
A R T I C L E I N F O A B S T R A C T
Keywords: The complex consisting of DNA and cetyltrimethylammonium chloride (DNA-CTMA) is extensively exploited in
Deoxyribonucleic acid organic electronics in form of thin films with submicron or nanometer thickness. In this work, using the
DNA-CTMA complex Langmuir-Blodgett technique, the surface films were prepared from complexes based on different types of
Organic electronics
chromosomal and plasmid DNA. The research focused on changes in their continuity after they were transferred
Self-assembly
Thin films
onto a solid substrate. It was found that only the monolayer of plasmid DNA-CTMA complex remained contin
Langmuir-Blodgett technique uous after being transferred. The other complexes underwent a spontaneous self-assembling and created elon
gated linear patterns. AFM images of these patterns were analysed quantitatively with Fast Fourier Transform. It
was confirmed that self-assembling occurred along one privileged direction.
1. Introduction derivative is more convenient to handle and can be easily processed,
particularly in the form of thin films [7]. The surfactant, most commonly
Deoxyribonucleic acid (DNA), carrying genetic information, is the combined with DNA for applications in devices is cetyl
key macromolecule for all living organisms. The physical and chemical trimethylammonium chloride (CTMA) [3]. CTMA molecules bind to
properties of DNA have their source in the adopted structure of the DNA [8,9] through ion exchange reaction. This latter can be readily run
double stranded helix (dsDNA). This unique feature makes DNA very by mixing aqueous solutions of anionic DNA and cationic CTMA. DNA is
different from synthetic polymers and attracts research interests for this a highly hydrophilic biopolymer [10–12], quite the opposite to DNA
macromolecule also in the fields outside life sciences. complexes, in which surfactants significantly reduce the number of sites
DNA has already been proved to be a promising material for appli available for hydration [13–16]. In general, DNA in complex with sur
cations in areas such as organic electronics, optoelectronics, nonlinear factants seems to preserve its fundamental characteristics, like double
optics or detectors for various chemicals. Comprehensive summary of helix structure [17,18], optical absorption [19] or thermal resistance
these innovative ideas can be found in recent reviews, for example [1] – [20,21].
single DNA macromolecules, [2] – DNA nanostructures built from ar Thin DNA-CTMA films have been incorporated as intermediate
ranged macromolecules (so-called DNA origami) and [3,4] – DNA layers in many optoelectronic devices [22–24]. They are also particu
applied as bulk material in organic electronics. larly efficient hosts to be intercalated with various dyes, what makes
DNA as the bulk material can be used either in its natural form or, them particularly exploited in nonlinear optics [25], lasers technology
more preferably, in complex with an amphiphilic surfactant [5]. [26] and electrochromic devices [27]. Typically DNA-CTMA is pro
Manipulation of natural DNA encounters many difficulties because it is cessed into thin films through solution based techniques (ink-jet print
soluble only in water [6]. In contrast, complexes of DNA and long chain ing, Dr Blade, dip-coating or, the most often, spin-coating). However,
surfactants are insoluble in water. Instead, they are well soluble in a the use of such techniques involves a high loss of material. This is a
number of alcohols and some volatile non-polar solvents. As a result this considerable inconvenience due to the high cost of good quality DNA.
* Corresponding author.
E-mail address: niziol@agh.edu.pl (J. Nizioł).
https://doi.org/10.1016/j.mseb.2020.114859
Received 25 May 2020; Received in revised form 11 September 2020; Accepted 1 October 2020
Available online 16 October 2020
0921-5107/© 2020 The Authors. Published by Elsevier B.V. This is an open access article under the CC BY-NC-ND license
(http://creativecommons.org/licenses/by-nc-nd/4.0/).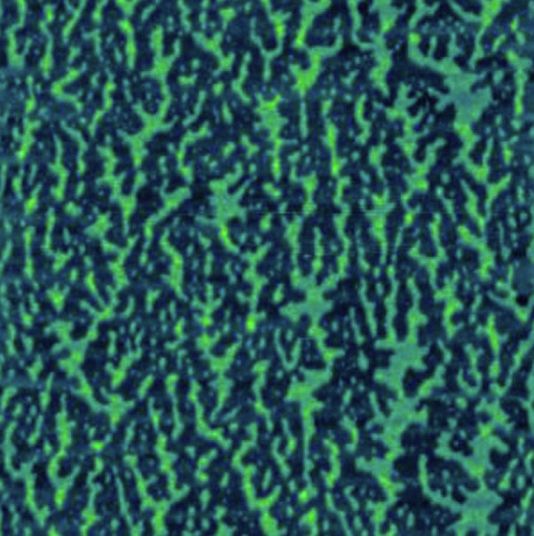
A. Radko et al. Materials Science & Engineering B 263 (2021) 114859
The DNA macromolecule has high aspect ratio with a diameter of 2 surface properties of the Langmuir monolayers deposited on mica and
nm and a typical length measured in tens of micrometers, what makes it silicon substrates.
a very promising building material for self-assembled structures on su At the same time, we hoped to find such a DNA that, in the CTMA
pramolecular level. Such structures can serve as templates to arrange complex, could be transferred onto a solid substrate in the form of LB
other nano-objects in an organized way. For example, clusters of monolayer and maintain its continuity. If it were possible, it would open
different metal atoms like silver and gold [28], copper [29] or platinum up a cost-effective alternative to spin-coating.
[30] were arranged in such DNA scaffolds. Tightly arranged clusters, are We studied chromosomal DNA of three different lengths and one
roughly metallic nanowires with ohmic electronic conductivity [31]. plasmid DNA. DNA in an eukaryotic cell locates in the nucleus con
Not only conductive objects can be arranged in this way. Among the taining double stranded helices packed into chromosomes. In a pro
others, self-assembled clusters of DNA-mediated TiO2 nanoparticles karyotic cells the bacterial circular chromosome is much simpler and
were synthesized for photovoltaic application and supercapacitors [32]. often accompanied by the extrachromosomal DNA, called plasmid DNA
Currently, at the nano-scale, single DNA macromolecules can be (pDNA). In contrast to chromosomal DNA, population of pDNA consists
arranged in a controlled and repetitive manner, but necessary tools are of identical macromolecules [43,44]. The pDNA may occur either in
sophisticated and neither cost effective nor time saving. Such an linear, circular or supercoiled form, while eukaryotic chromosomal
approach is ineffective if micrometer or sub-milimeter size patterns are dsDNA adopts typically the linear form [45]. Various biological research
to be made. In this case less demanding and more productive methods indicate differences between plasmid and chromosomal DNA regarding
are necessary. Surface patterns can be engraved by standard lithography characteristics observed in microscale. Usually, chromosomal DNA is
[33] or written with electron beam [34] on thin solid films from DNA poorly defined in terms of molecular weight distribution. Conversely,
derivatives deposited on a substrate. this problem does not exist for pDNA. However, so far, the majority of
The use of DNA in solution or suspension is an optional approach to the experiments aimed at technological application were carried out
create patterns on a solid surface. For example by spontaneous, ther using cheaper and commercially available chromosomal DNA [45]
modynamically driven pattern formation due to phase segregation. It because large amounts of these macromolecules were needed.
occurred as a result of drying of an aqueous solution containing DNA and
silica nanoparticles was reported [35]. DNA (or derivatives) can be 2. Materials and methods
effectively transferred by an intermediating, already pre-patterned,
support. It was demonstrated that DNA molecules adsorbed on the 2.1. Deoxyribonucleic acid
stamp, made of elastomeric polydimethylsiloxane (PDMS), can be
deposited on a target surface achieving sub-micron resolution [36]. There were four different types of DNA used. Low molecular weight
However, a perfect reproduction of such a pattern is strongly limited by DNA (dsDNA(short)), was purchased from SIGMA Aldrich, while high
irregular inking of the stamp. The reasons are multiple, among the molecular weight DNA (dsDNA(long)) was obtained from CIST (Chitose
others, the opposite chemical nature of PDMS which is hydrophobic Institute of Science and Technology, Japan). The latter was extracted
while DNA is mostly hydrophilic and the uncontrolled drying of the from salmon sperm and is often used in research on organic electronics
deposited solution [37]. or photonics. Both dsDNA(short) and dsDNA(long) were further used as
Linear grids or dot arrays were obtained via a mould of polymethyl delivered.
metacrylate (PMMA) and replicated on a glass slide [38]. DNA deposits A portion of dsDNA(long) was subjected to ion exchange chroma
with submicrometer morphology can be produced by solution micro tography in view to elute fraction consisting of shorter and more
molding in capillaries on a support surface. Simple solution chemistry homogenously distributed molecular masses dsDNA(chrom). Ion ex
allows to control the morphology of the created pattern [39]. Applica change chromatography was performed in single step at room temper
tions of patterned DNA deposited on a surface can be multiple like for ature on ÄKTA Purifier 10 liquid chromatography system. The system
example guides for nanoparticle assembling [40]. was equipped with commercial MonoQ HR10/10 anion exchanger col
An interesting alternative way to obtain self-assembling patterns umn (Amersham Pharmacia Biotech, Sweden) known for its very high
from DNA derivatives is based on Langmuir-Blodgett (LB) technique. capacity and resolution. 50 mL of DNA solution (at 5 mg/mL) was
This two-step method is straightforward and has no side effects, that the loaded on the chromatographic column previously equilibrated with A1
material can be wasted for. A solution of the tested material, in an buffer (100 mM TRIS, pH 8.0). The separation was carried out with a
amount ensuring formation of the monolayer is spread on water surface flow rate of 2.5 mL/min using a sodium chloride gradient over a con
and compressed to constant value of surface pressure (1st step), then centration range up to 1 M NaCl. The gradient length was 3.5 column
transferred vertically onto solid support (2nd step). As soon as the bed volumes. Optical absorbance at 260 nm and conductivity were
monolayers were transferred on the mica support, a kind of self- monitored during the chromatographic procedure. The DNA fraction
assembling linear patterns appeared spontaneously [41]. We demon appearing in the electrophoregram at conductivity between 57 and 70
strated that such organized structures can be controlled by the appro mS/cm was selected for further study.
priate selection of experimental conditions. The latter concerns in Plasmid DNA (pDNA) was extracted from transformed Escherichia
particular the surface pressure, that was pointed out as the key param coli bacteria grown and harvested in the laboratory. E. coli bacteria
eter for the physicochemical properties of DNA-CTMA monolayers at the transformed with phMGFP plasmid was grown at standard LB medium
air/water interface. with the addition of 0.1 mg/mL ampicillin. The bacteria were streaked
Further in-depth examination requires an answer whether the on solid LB medium at Petri dish and incubated overnight at 37 ◦ C. The
observed phenomenon is characteristic only for a given batch of DNA single colony was transferred into 30 mL liquid LB medium and shaked
and experimental conditions, or whether it is a more general feature. vigorously overnight. 10 mL of this culture was transferred to 1 L of
Biological studies have shown that pDNA is delivered to cells more liquid LB medium and shaked overnight at 37 ◦ C. Bacteria were pelleted
efficiently than linear DNA. Plasmid DNA is compacted, retaining a by centrifugation (7000 g, 30 min) and the plasmid DNA purified using
significant number of counterions in its vicinity. This in turn drives to a the NucleoBond PC 10000EF Giga KIT from Macherey-Nagel GmbH&Co
lower effective negative charge [42] that explain why, cationic lipid- according to the manufacturer’s instructions. The obtained DNA was
mediated delivery of plasmid DNA (pDNA) is better than that of linear tested using UV–Vis spectroscopy (to determine its purity and concen
DNA in gene therapy. Many other significant differences between tration) and electrophoresis (in order to determine the length of the
chromosomal and plasmid DNA in terms of their activity in the sur DNA).
roundings have also been confirmed. Therefore, in the current work, we Each of the four different DNAs batch was converted into complex
investigated the effect of the type of DNA as well as its length on the with cetyltrimethylammonium chloride (CTMA). The synthesis started
2
A. Radko et al. Materials Science & Engineering B 263 (2021) 114859
by preparing equimolar solution of DNA and CTMA. Then the CTMA film. In order to adjust the most favorable conditions for the monolayer
solution was dropwise added to DNA solution constantly stirred with a transfer on solid support, the static stability experiment was performed.
magnetic bar. The received precipitate was filtered at Büchnel funnel, The dsDNA(short)-CTMA monolayer was compressed until the chosen
washed excessively with water and freeze-dried. Next it was dissolved in surface pressure (5, 10, 15 and 20 mN/m), kept constant afterwards.
a spectroscopic grade ethanol and later spectroscopic grade chloroform Simultaneously, the decreasing area was monitored as a function of
was added to obtain 4:1 v/v mixture. A volatile solvent was required in time. It occurred that dsDNA(short)-CTMA film was the most stable
Langmuir experiments. when compressed up to 15 mN/m.
Other chemicals like tris(hydroxymethyl)aminomethane (Tris base), Langmuir monolayers were transferred onto mica and silica sub
hydrochloric acid (HCl) and CTMA (>98%) were purchased from strates, using Langmuir- Blodgett deposition technique (LB technique).
SIGMA-Aldrich while organic solvents such as ethanol, chloroform or Before each experiment, solid substrate was placed in a water subphase.
acetone of analytical grade were delivered by POCH (Poland). After spreading solution of DNA-CTMA complex onto a water subphase,
the monolayer was left to equilibrate for 5 min and then compressed to
2.2. Electrophoresis constant value of surface pressure of 15 mN/m. LB deposition was car
ried out by lifting-off the solid substrate from the water subphase
With a view to spatially separate macromolecules of different mo through the monolayer with a dipper speed of 5 mm per minute. The
lecular mass, the studied DNA samples were subjected in aliquots to substrates were either ruby muscovite mica sheets of V1 quality pur
electrophoresis in 3.5% (w/v) agarose (for dsDNA(short) and dsDNA chased from Continental Trade (China) or silica wafers obtained from
(chrom)) or 2% (w/v) agarose (for dsDNA(long) and pDNA) gel in TBE ITME (Poland). Immediately before LB experiments the substrate surface
buffer according to standard procedure using Mupid-exU apparatus. The was cleaned - mica’s with adhesive tape while silicon plate’s in ultra
processed DNA was stained with ethidium bromide and visualized in sonic baths for 15 min both in acetone and ethanol, then treated with
UV-light. plasma for 30 s.
2.3. FTIR measurements 2.6. Atomic Force Microscopy (AFM) imaging
Fourier transform middle-infrared absorption measurements (FT- Atomic Force Microscopy profiling was done in non-contact mode.
MIR) were performed at room temperature using a Bruker VERTEX 70v Images were obtained at room temperature using Agilent 5500 Micro
vacuum spectrometer. The spectra were obtained in the spectral range of scope at resonance frequency of 45–115 Hz. Nanosensor tips of PPP-
400–4000 cm− 1 with a resolution of 2 cm− 1 and 32 scans per each FMR-50 type and thickness of 3.0 ± 1 µm were used. For each layer,
spectrum. Four bulk samples of DNA-CTMA complex, prepared using topography images were collected from several, randomly chosen, areas
different types of DNA (low molecular weight, high molecular weight, and images were acquired with 256 × 256 lines. Set-point and gains
short and plasmid), were mixed with KBr, compressed into pellets, and were adjusted to each measurement in order to obtain a clear, noiseless
then measured. image. The scan rate was determined individually and ranged from 0.9
to 1.3 lines s-1. The background of the images was removed by flattening
2.4. Langmuir monolayer technique algorithm, and the contrast and brightness were adjusted using the
Gwyddion 2.47 software. The AFM images presented are 2.5 µm × 2.5
The surface pressure–area (π–A) isotherm was recorded by using a µm in size and are representative scans for each DNA type complex.
two-barrier Langmuir trough (NIMA) of 503 cm2 total area. Surface Depth profiles provided by AFM were analyzed using Fast Fourier
pressure was measured with accuracy of ± 0.1 mN m− 1 using a Wil Transform (FFT) algorithm embedded in OriginPRO 2019 software
helmy plate made of ashless chromatography paper (Whatman). Before package.
measurement, water subphase was cleaned by closing the barrier and
aspirating water until surface pressure readings were not exceeding ±
0.1 mN m− 1, in comparison with values of surface pressure detected 2.7. Water contact angle measurements
with the opened barriers. The subphase temperature was controlled
thermostatically, by a circulating water system (Julabo), and kept at Static contact angle measurements were performed at room tem
20 ◦ C ± 0.1 ◦ C. Spreading solution was deposited drop by drop onto the perature by the sessile drop technique using a Kruss EasyDrop (DSA15)
water subphase with a 250 μl Hamilton microsyringe, precise to 5.0 μl. instrument. The contact angle values are obtained by averaging the
After spreading, monolayer was left to equilibrate for 5 min and then measurements of five different drops and the error was calculated as
compressed with barrier speed of 20 cm2 min− 1. Recorded π-A isotherm standard deviation.
was repeated at least twice to ensure high reproducibility of the results.
In order to complement the interpretation of the results, the 3. Results and discussion
morphology of examined monolayer was studied with Brewster angle
microscope (BAM) (Accurion GmbH, Germany), equipped with a 50 mW 3.1. Estimation of DNA molecular mass distribution
laser emitting p-polarized light at a wavelength of 658 nm and an
objective with tenfold magnification. The microscope was installed over Deoxyribonucleic acid extracted from bacterial cell culture (pDNA)
a KSV NIMA Langmuir trough (Finland) with two barriers and 841 cm2 is a monodisperse biopolymer with a well-defined molecular weight.
of its total area. Unfortunately, this method does not allow large quantities to be ob
tained. However, for applications in technology, one would need a cost-
2.5. Langmuir- Blodgett deposition technique effective DNA. The latter in large quantities is obtained from various
bulk natural resources (often biological waste). In contrast to bacterial
A series of preliminary control experiments were conducted on DNA, such a material is characterized by a statistical mass distribution.
dsDNA(short)-CTMA to investigate the effect of various factors on sur In our study only pDNA as derived from E.coli bacteria was supposed
face film formation. We observed that π − A isotherms did not depend to have monodispersed molecular mass, given by the supplier as 4707 bp
neither on varied number of molecules deposited on the surface nor on (the number of base pairs is directly related to the molecular mass as
the temperature of the experiment (10–30 ◦ C). Furthermore, even 1bp = 660gmol− 1 ). Somehow, the mass distribution of other types of
different monolayer speed compression (10–30 mm/min), had no sig DNA should be determined. Standard techniques used for synthetic
nificant impact on the characteristics of dsDNA(short)-CTMA surface polymers such as gel permeation chromatography (GPC) or high-
3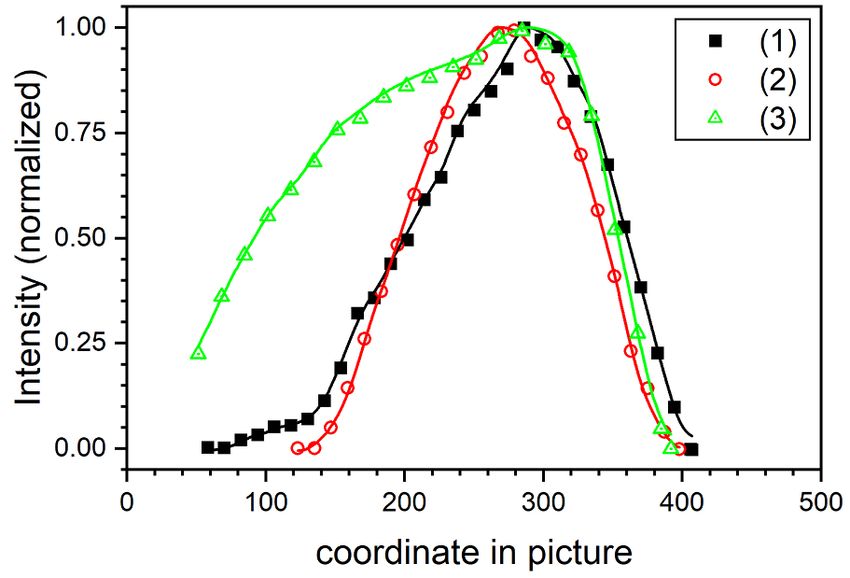
A. Radko et al. Materials Science & Engineering B 263 (2021) 114859
(a) (b) (c)
Fig. 1. (a) from left to right – dsDNA(short), dsDNA(chrom), 10 bp and LMW ladders, (b) from left to right – dsDNA(long), LMW and 1kbp ladders, (c) pDNA.
Fig. 2. An example, data expressing position in the gel (from Fig. 1(a)) are calibrated in bp units. (1),(2) – steps of LMW and 10 bp ladders, respectively. LMW ladder
consists DNA of 766, 500, 350, 300, 250, 200, 150, 100, 75, 50 and 25 bp, while 10 bp ladder DNA of 100, 90, 80, 70, 60, 50, 40, 30, 20 and 10 bp. Solid line
represents double exponential decay fit.
pressure liquid chromatography (HPLC) are useless in the case of DNA DNA (that can be observed in form of stripes) with calibration ladders.
for many reasons, like for example inadequacy of reference standards or For dsDNA(short) and dsDNA(chrom) a different calibration was used
inherent properties of DNA as polyelectrolyte. than for dsDNA(long), so they are shown separately, respectively in
We decided to derive indirectly the necessary data from gel elec Fig. 1(a) and (b). Fig. 1(c) shows an image of a pDNA sample, which
trophoresis, the well-established technique for DNA mass separation. In consists of three bands instead of one, as might have been expected, one
this technique a portion of DNA sample is injected in agarose gel plate, corresponding to 4707 bp. This fact indicates that pDNA adopts also
then travels along applied electric field. The speed depends inversely on forms other than linear (i.e. circular and supercoiled).
molecular mass. Finally, the gel is stained with a UV fluorescent dye, Fig. 2 shows an example of the dependence between the ladder step
that is retained exclusively in the DNA double helix. The reference positions and the corresponding bp number. This dependence fits
sample, (the so-called DNA ladder consisting of macromolecules of perfectly with a double exponential decay function, that was later used
several, well-defined masses) is simultaneously injected. Finally, the gel to convert coordinate of the position occupied by a DNA fraction to its
with mass separated DNA is imaged in UV light, with the tonal span molecular mass in bp. While there are arguments for choosing such a
adjusted so that it falls within the linear region of the dynamic response function, they are beyond the scope of the reported research. Therefore,
of the camera. At the first approximation the dye content in a particular for our purpose, this function only shows a smooth curve through the
place of the gel may be considered proportional to the number of base experimental points.
pairs available there, i.e. the quantity of DNA accumulated. Thus, the Fig. 3 illustrates how one can deduce molecular mass distribution of
recorded fluorescence intensity can be directly related to. The distance the studied DNA samples using data provided by gel electrophoresis. At
travelled from the injection point (well) can be recalculated in bp first, the fluorescence intensity of stripes, derived from images, is rep
numbers using the DNA ladders step positions. In our study we used 1 kb resented as function of the position in the gel (Fig. 3(a)). Then, the ab
DNA Ladder and Low Molecular Weight (LMW) DNA ladder both from scissa is recalculated to bp as in Fig. 3(b). However, it should be stressed,
New England BioLabs Inc. and 10 bp DNA Step Ladder from Promega Co. that such a conversion should not be done outside mass span covered by
In Fig. 1 are shown images of three stained gels containing separated reference ladders. It is especially true for the high mass end, where
4
A. Radko et al. Materials Science & Engineering B 263 (2021) 114859
(a) (b)
Fig. 3. Fluorescence intensities of the studied DNA stripes from Fig. 1(a) and (b), normalized to their maxima: (a) intensity dependence on the position in the picture,
(b) intensity dependence on bp number (note the logarithmic scale). Plots (1), (2) and (3) represents data for dsDNA(short) dsDNA(chrom) and dsDNA(long),
respectively.
conversion function rises very fast and therefore the uncertainty of the
Table 1
result is high. For this reason, dsDNA(long) data was cut out at 10 000
Characteristics of molecular mass distribution deduced from electrophoresis
bp, and the final result is a rather lower estimate of the true value.
results.
Finally, number average (Mn ) and weighted average (Mw ) molar masses
sample Molecular mass range [bp] Mn [bp] Mw [bp] are obtained by numerical integration, according to their definitions.
dsDNA(short) 5–240 82 117 The result are summarized in Table 1.
dsDNA(chrom) 6–190 75 97 The data in Table 1 as well as Fig. 3(a) prove that ion exchange
dsDNA(long) 25–10000 4200 6500 chromatography significantly reduced the molecular mass of dsDNA
pDNA* 4707 – –
(long). The achieved span of the molecular mass was similar to natural
(*) molecular mass for pDNA as stated by the supplier. dsDNA(short). However, in contrast to the latter, dsDNA(chrom) was
deprived of higher mass tail, which is the origin of less substantial dif
ference between Mn and Mw .
Fig. 4. Comparison of FT-IR spectra of the DNA-CTMA complex synthesized using four different types of DNA.
5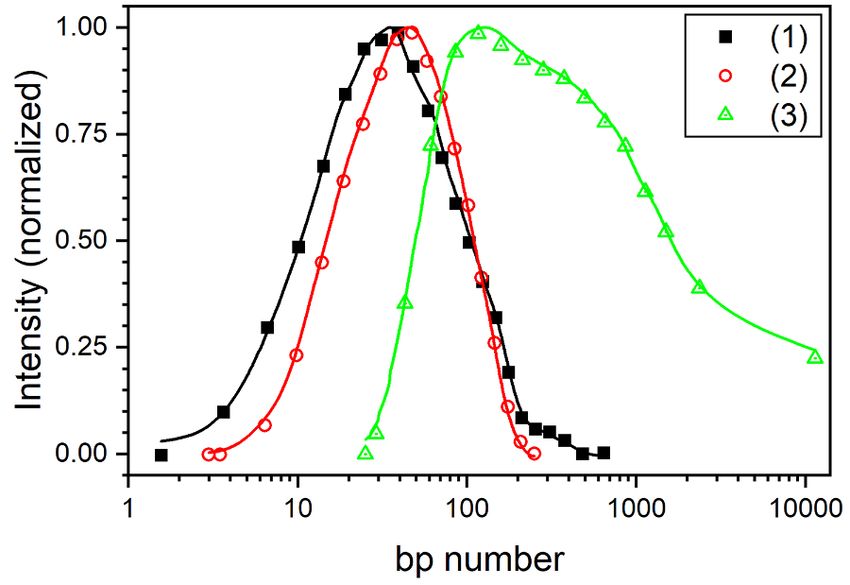
A. Radko et al. Materials Science & Engineering B 263 (2021) 114859
(a) (b)
(c) (d)
Fig. 5. The surface pressure–area (π–A) isotherms registered for different complexes: (a) dsDNA(short)-CTMA, (b) dsDNA(chrom)-CTMA, (c) dsDNA(long)-CTMA, (d)
pDNA-CTMA spread on water subphase at 20 ◦ C. Insets: compression moduli as a function of surface pressure.
3.2. FTIR measurements bands at 641 and 533 cm− 1 in pure DNA are shifted toward larger
wavenumbers by 8 and 7 cm− 1, respectively, in case of all the DNA-
Infrared absorption spectra of four reaction products consisting of complexes.
different types of DNA were measured to determine whether conversion What is important, the spectra obtained for all four DNA-CTMA
to the DNA-CTMA complex had actually occurred and to detect possibly complexes, differing in the type of DNA used in their syntheses, are
existing molecular or structural differences between them (Fig. 4). essentially very similar taking into consideration shapes, positions and
Indeed, all these spectra are very different from the spectrum obtained intensities of all bands. The only visible difference that can be distin
for a physical mixture of DNA and CTMA [41] and thus confirm the guished is for plasmid DNA-CTMA complex, where νas(CH2) and νs(CH2)
creation of DNA-CTMA complexes. In particular, comparing to the stretching bands are slightly shifted toward larger wavenumbers by
spectra of pure DNA and CTMA, some modifications can be observed. about 3 and 2 cm− 1, respectively, comparing to the spectra of the other
The bands resulting from νas(CH2) and νs(CH2) stretching vibrations of three complexes. It may indicate slightly less ordered hydrocarbon
hydrocarbon chains are shifted to larger wavenumbers, which suggests chains of CTMA ligands around DNA strands in the plasmid DNA
slightly less ordered hydrocarbon chains of CTMA as the result of elec complex.
trostatically binding to the phosphate backbones of DNA. In the spectral
range where the in-plane stretching vibration related to cytosine- 3.3. Langmuir monolayer technique
guanine pairs occurs, a band observed at 1536 cm− 1 in pure DNA is
shifted toward smaller wavenumbers by about 8 cm− 1 and additionally a Fig. 5(a–d) presents the surface pressure–area (π–A) isotherms
new band at 1575 cm− 1 appears in the spectra of all DNA-CTMA com registered for different complexes of dsDNA-CTMA as well as pDNA-
plexes. In turn, the band particularly sensitive to a cationic surfactant CTMA. For each examined monolayer a similar course of registered
binding to DNA is connected to the νas(PO-2) vibration observed at 1228 (π–A) isotherm is observed. With the decreasing area, the surface pres
cm− 1 in pure DNA. In the case of all four complexes this band is shifted sure rises very slowly and the slope smoothly becomes steeper. As the
by about 13 cm− 1 towards larger wavenumbers and is of distinctly larger compression progresses, a significant rise in the surface pressure is
intensity. In the low wavenumber range (below 900 cm− 1) some changes observed, however, without any noticeable phase transition, until the
are also noticeable. The band, which is a deoxyribose-phosphate back film collapses (at about 27mN∙m− 1 for dsDNA-CTMA and 24mN∙m− 1 for
bone marker of B-form DNA, observed at 832 cm− 1 in pure DNA, is pDNA-CTMA).
shifted toward smaller wavenumbers by about 5 cm− 1 whereas two Additionally, in order to characterize the physical state of each
6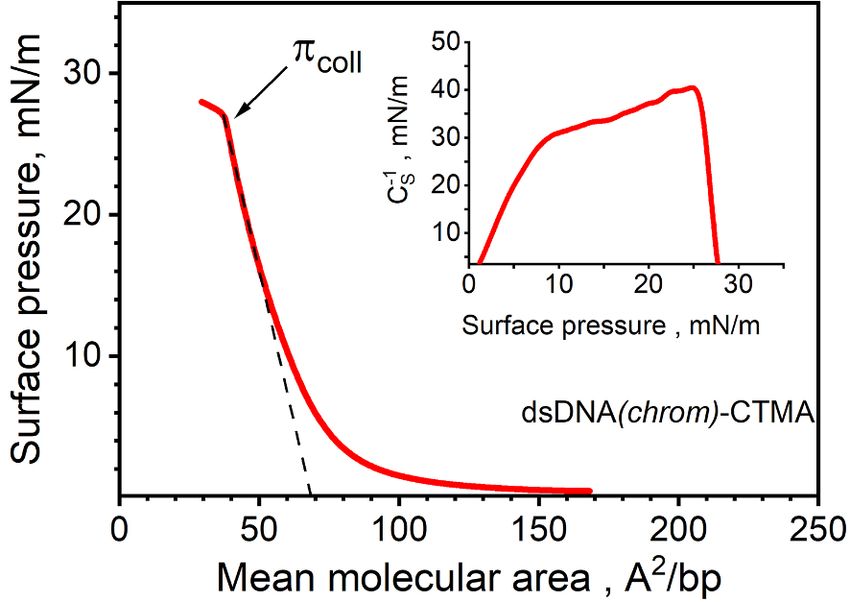
A. Radko et al. Materials Science & Engineering B 263 (2021) 114859
(a) (b) (c) (d)
Fig. 6. BAM images recorded during the compression for different complexes: (a) dsDNA(short)-CTMA, (b) dsDNA(chrom)-CTMA, (c) dsDNA(long)-CTMA, (d) pDNA-
CTMA. These textures were observed at the values of collapse pressure (πcoll) indicated in Fig. 3(a–d).
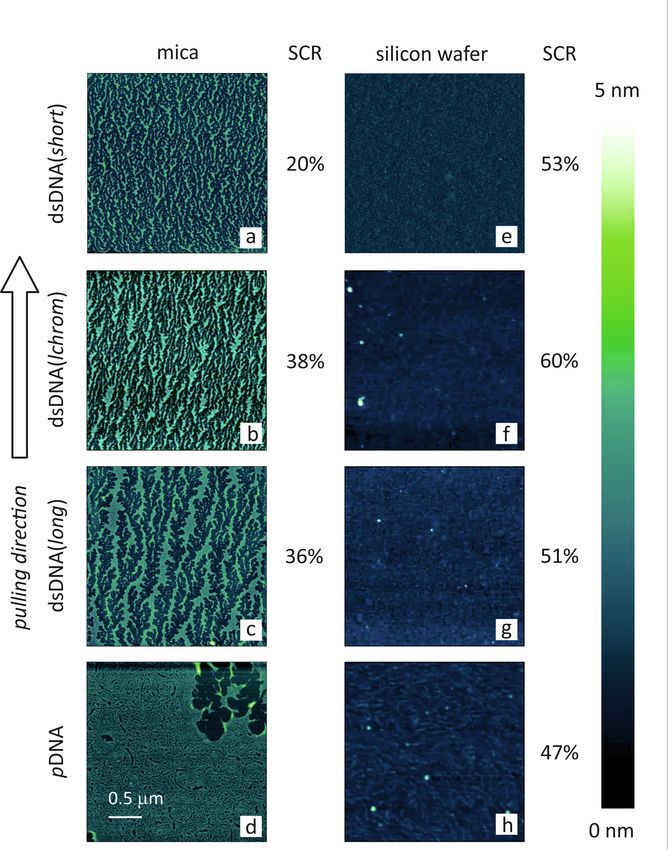
(a) (b)
Fig. 7. SCR calculation procedure: (a) original AFM image, (b) uncovered regions marked in black.
Langmuir monolayer, the compression moduli (defined as C−S 1 = stable Langmuir monolayers at the air/water interface. Usually in
− A(∂π /∂A)T , A denotes average area per base pairs in a monolayer) Langmuir-Blodgett practice, such monolayers when transferred onto a
values were calculated from the isotherm data set and plotted as a solid surface, provide smooth and flawless films. However, in the current
function of surface pressure in the inset in Fig. 5. According to the research, the results were partially different.
physical state classification based on C−S 1 values [46], it is evident that
each investigated DNA-CTMA complex forms liquid-type monolayer. As
one can see Fig. 5(a–c), characteristics obtained for each chromosomal 3.4. AFM imaging and FFT analysis
DNA are almost identical. Extrapolating the rectilinear fragment of the
(π–A) isotherm (i.e. the last rectilinear part of the isotherm, recorded at Based on the recorded AFM images, the surface covering ratio (SCR)
high surface pressure values) to π = 0, the value of the limiting area Alim was calculated by using the ImageJ software. First, we discriminate in
is obtained. In other words, Alim can be defined as the area occupied by the AFM image (Fig. 7(a)) regions considered as uncovered substrate
the base pairs, at the largest packing of molecules in monolayer [47,48]. (black in Fig. 7(b)). Then, the SCR was calculated as SCR =
Estimated values of limiting area for dsDNA-CTMA complexes are
blackpixell
allpixell ∙100%. The uncertainty of this method was in the order of single
2 2 2
71.3 ± 0.2 Å /bp; 68.9 ± 0.2 Å /bp, 71.2 ± 0.1 Å /bp for dsDNA(short)- percent.
CTMA, dsDNA(chrom)-CTMA and dsDNA(long)-CTMA respectively, The morphology of DNA-CTMA layers deposited on mica and silica
2 substrates are presented in Fig. 8. The images of these layers, obtained
while for pDNA-CTMA is slightly larger and equals 83.4 ± 0.1 Å /bp. by Atomic Force Microscopy (AFM), represent the surface of 2.5 µm by
The difference may be due to the diverse structures of plasmid DNA 2.5 µm and the height ranging between 0 and 5 nm. All the samples were
macromolecules in comparison to chromosomal DNA. Plasmid DNA is a prepared under identical experimental conditions: the surface pressure
circular form of DNA that at physiological pH may adopt a supercoiled at the moment of lifting 15 mN/m and the dipper speed 5 mm/min.
conformation depending on the ionic strength, while chromosomal DNA However, a closer visual inspection reveals significant differences be
fragments, i.e., from salmon sperm, remain in a linear form. Further tween layers deposited on mica and silicon wafers. The vertical arrow on
more, supercoiling effect renders a less effective negative charge of the the left side of Fig. 8 indicates the direction of substrate pulling out from
biopolymer than its actual charge [42]. the subphase in Langmuir trough. In the case of mica substrate and
During the compression, the textures of DNA-CTMA films were chromosomal DNA, organized strip-like forms were obtained instead of
observed with Brewster Angle Microscopy (BAM). Such a visualization a homogeneous film. They are clearly aligned along the drawing direc
did not reveal any significant variations in the film morphology until it tion. Monolayers transferred onto silicon substrates disintegrated into
collapsed (at πcoll). Regardless the surface pressure, the morphology of statistically distributed grains.
the each complex was completely smooth and homogeneous (data not DNA is inherently a polar macromolecule, but the DNA-CTMA
shown). A kind of roughness appeared only at the collapse pressure, as complex in aqueous solution exhibits lyotropic liquid crystal (LLC)
shown in Fig. 6. In the case of pDNA-CTMA monolayer grainy objects properties [49]. Two fundamental arrangements were determined. The
appeared, but their origin remained unknown. first is the lamellar phase (Lα ) with alternating lipid bilayers and DNA
The results prove that all investigated DNA-CTMA complexes form monolayers and the second is the inverted hexagonal phase (HII ),
7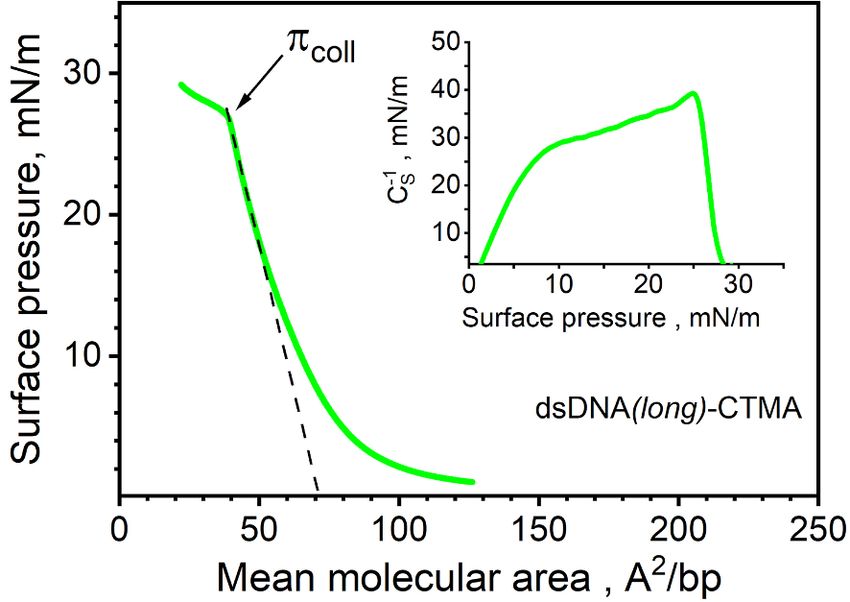
A. Radko et al.                                                                                                 Materials Science & Engineering B 263 (2021) 114859

Fig. 8. Topology of DNA-CTMA deposits obtained from monolayers transferred onto either mica or silicon substrates. Images were obtained by AFM microscopy at
non-contact mode. Surface covering ratio (SCR) expresses the fraction of surface occupied by DNA complex.

composed of DNA inserted within inverse lipid tubules, which are                 and silicon, respectively. Mica plates were freshly cleaved and silicon
organized in a hexagonal lattice [49]). Most likely, such an architecture,       wafers factory polished, so the roughness factor of both should be
at least to some extent, is also preserved also in solid form. This means        negligible and have no significant effect on the formation of layers.
that DNA-CTMA complex is rather hydrophobic, which contrasts with                Considering the latter, it is surprising that the relatively small difference
the hydrophilic nature of mica and silicon. The contact angles measured          in surface wettability resulted in such large variations in the observed
for both substrates used were 17.85 ± 0.27 and 25.55 ± 0.61◦ for mica            ordering.

                                                                             8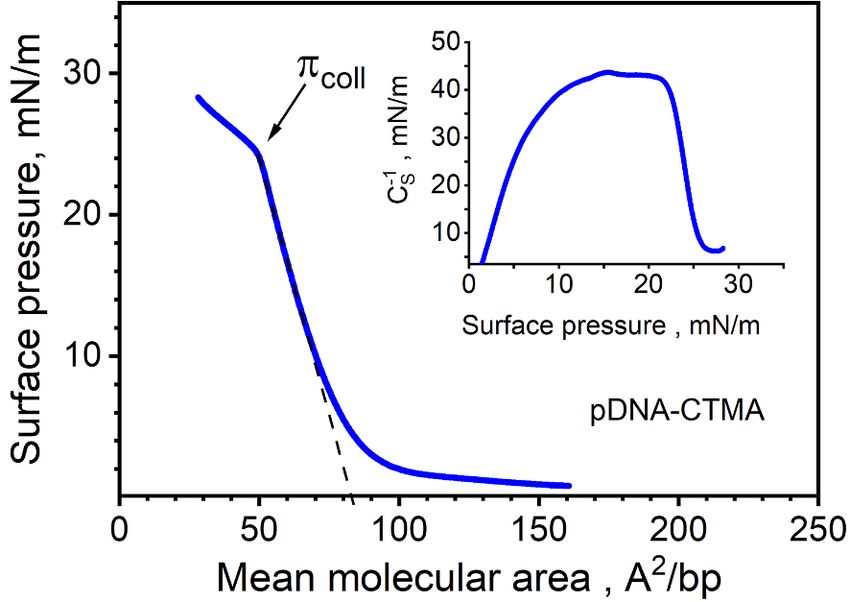
A. Radko et al. Materials Science & Engineering B 263 (2021) 114859
(a) (b)
Fig. 9. Examples of depth profiles from dsDNA(long) AFM image (Fig. 5) cut (a) in parallel and (b) perpendicularly to the drawing direction.
Apparently, the observed behavior is governed also by other factors are located at approximately 10 μm− 1 and 6 μm− 1 respectively for
(like for example surface free energy) that were not controlled in the shorter and longer DNA as can be seen in lower parts of Fig. 10(a, c, e). In
reported study. A more precise determination of these factors indicates a other words, the average spacing between lines obtained from shorter
possible, further direction of this research. It may turn out that a com DNA is about 0.1 µm, while the lines of longer DNA are further apart and
patibilizing agent is required for the successful transfer of DNA-CTMA lie 0.17 µm each from the other. This result clearly indicates that the self-
surface films to silicone substrates. organization of chromosomal DNA in linear patterns is not entirely a
Surprisingly, unlike in the case of chromosomal DNA, the pDNA- random process but depends on the parameters of the material used to
CTMA monolayer retained its initial continuity after being transferred form the monolayer.
onto the mica plate. As one can see in Fig. 7d, such a surface was almost
perfectly free of defects, at least at the spatial scale of this analysis. At a 4. Conclusions
larger scale of observation some artifacts in form of randomly distrib
uted holes were spotted in this layer (as evidenced in upper right corner In this work we studied surface properties of DNA-CTMA complex
in Fig. 8d). However, very similar artefacts are often found also in monolayers prepared by Langmuir-Blodgett technique. We outlined
various other monolayers and usually they are attributed to contami problems related to their transfer on a solid support. To our best
nations entrapped from the air. At this stage of research, it is difficult to knowledge it was demonstrated for the first time, that DNA-CTMA
find credible reasons explaining the uniqueness of pDNA compared to complex derived from plasmid DNA is capable to form stable Lang
chromosomal DNA samples. They are all made up of the same base pairs, muir monolayers at the air–water interface monolayer by Langmuir-
which should result in the same chemistry of basic interaction with the Blodgett technique as well as can be efficiently transferred with
surroundings. It can be speculated that the differences observed are due Langmuir-Blodgett technique onto a solid support without losing its
to the distinctly different macrostructures adopted by these macromol continuity.
ecules. Nevertheless, this finding is highly important for practical ap Therefore, it may seem that the use of plasmid DNA will open a new
plications, because it proves that the Langmuir monolayers of DNA- route in organic electronics. Spin coating commonly used in this field as
CTMA complex can be successfully transferred on a solid substrates. a thin film deposition technique is ineffective due to the generated
To describe the observed patterns in a more quantitative and general material losses. In contrast, Langmuir-Blodgett technique is far less
manner, we analyzed cross-section profiles drawn in parallel and material consuming and virtually lossless. The rest of the tested com
perpendicularly to the direction that the substrates were pulled out of plexes, based on other different chromosomal DNAs, did not meet the
the water subphase. Examples of such a cross-sections obtained for the challenge. Following the transfer, layers underwent a spontaneous self-
AFM image of dsDNA(long)-CTMA are sketched in Fig. 9. The visual organization in linear patterns. Preliminary, cursory observations sug
comparison reveals greater regularity in Fig. 8(b), i.e. for a cross-section gest that this this phenomenon is governed by wettability of the support
cut perpendicularly. and the molecular mass of DNA. On the other hand, such linear patterns,
Fast Fourier Transform (FFT) it is a numerical method that can help useless for organic electronics based on layered architecture, may be
to detect periodicity in a noisy signal. In this study spatial depth profiles advantageous in other applications. For example, they may be used as
(like these in Fig. 9) were transformed in the wavelength space as it is host templates to arrange metals or small molecules in a similar manner
illustrated in Fig. 10. If in the plot representing the FFT amplitude versus to already reported [50], of course if the quality control of the DNA-
the wavenumber occurs a maximum, it means that the analyzed profile CTMA patterns is improved. Such an approach would probably
actually contains a periodic pattern. Its characteristic wavelength can be become an interesting alternative to lithographic techniques.
calculated as the inverse of the maximum wavenumber.
Conversely, a monotonic decrease in FFT amplitude towards higher 5. Data availability
wavenumbers indicates lack of periodicity in the source profile. A closer
inspection of experimental data derived for deposits on silicon does not The raw/processed data required to reproduce these findings cannot
allow any periodicity to be detected. That is, the observed granules are be shared at this time as the data also forms part of an ongoing study.
distributed in a completely random manner. In the case of deposits on
mica, only the graphs for perpendicular cuts have clearly visible max
Declaration of Competing Interest
ima. The latter confirms the presence of a real periodicity in the source
pattern and line orientation along the pulling direction. These maxima
The authors declare that they have no known competing financial
9
A. Radko et al. Materials Science & Engineering B 263 (2021) 114859
(mica) (silicon wafer)
dsDNA(short)
(a) (b)
dsDNA(chrom)
(c) (d)
dsDNA(long)
(e) (f)
Fig. 10. Results of FFT analysis performed on depth profiles extracted from AFM images for different DNA used on the mica (a, c, e) and silicon (b, d, f) substrates.
Each graph is labelled by the cut direction with respect to the drawing direction. Amplitudes were normalized to the maximum.
interests or personal relationships that could have appeared to influence 2017).
the work reported in this paper. This research was carried out with the equipment (ultra-BAM) pur
chased thanks to the financial support of the European Regional
Development Fund in the framework of the Polish Innovation Economy
Acknowledgements
Operational Program (Contract No.POIG.02.01.00-12-023/08).
Aleksandra Radko acknowledges financial support of the Ministry of
Science and Higher Education in Poland (grant no. 7150/E-338/M/
10A. Radko et al. Materials Science & Engineering B 263 (2021) 114859
References [25] I. Rau, J.G. Grote, F. Kajzar, A. Pawlicka, Comptes Rendus Physique 13 (2012)
853–864.
[26] T. Suzuki, Y. Kawabe, Opt. Mater. Express 4 (2014) 1411–1419.
[1] K. Wang, J. Funct. Biomater. 9 (2018) 8.
[27] A. Pawlicka, F. Sentanin, A. Firmino, J.G. Grote, F. Kajzar, I. Rau, Synth. Met. 161
[2] F. Zhang, J. Nangreave, Y. Liu, H. Yan, J. Am. Chem. Soc. 136 (2014)
(2011) 2329–2334.
11198–11211.
[28] K. Keren, M. Krueger, R. Gilad, G. Ben-Yoseph, U. Sivan, E. Braun, Science 297
[3] E.F. Gomez, A.J. Steckl, Engineering DNA and Nucleobases for Present and Future
(2002) 72–75.
Device Applications, in: M. Irimia-Vladu, E.D. Glowacki, N.S. Sariciftci, S. Bauer
[29] C.F. Monson, A.T. Woolley, Nano Lett. 3 (2003) 359–363.
(Eds.) Green Materials for Electronics, Wiley-VCH, 2018, pp. 191-233.
[30] R. Seidel, L. Colombi Ciacchi, M. Weigel, W. Pompe, M. Mertig, J. Phys. Chem. B
[4] E.F. Gomez, V. Venkatraman, J.G. Grote, A.J. Steckl, Adv. Mater. 27 (2015)
108 (2004) 10801–10811.
7552–7562.
[31] T. Bayrak, N.S. Jagtap, A. Erbe, Int. J. Mol. Sci. 19 (2018) 3019.
[5] K. Liu, L. Zheng, C. Ma, R. Göstl, A. Herrmann, Chem. Soc. Rev. 46 (2017)
[32] U. Nithiyanantham, A. Ramadoss, S.R. Ede, S. Kundu, Nanoscale 6 (2014)
5147–5172.
8010–8023.
[6] W. Saenger, Principles of Nucleic Acid Structure, 1 ed., Springer, 1984.
[33] D.E. Diggs, J.G. Grote, C.M. Bartsch, F. Ouchen, A. Sharma, J.M. Taguenang, A.
[7] K. Tanaka, Y. Okahata, J. Am. Chem. Soc. 118 (1996) 10679–10683.
Kassu, R. Sileshi, Proceedings of the SPIE, 7040 (2008) 70400E-1-6.
[8] D.-M. Zhu, R.K. Evans, Langmuir 22 (2006) 3735–3743.
[34] R.A. Jones, W.X. Li, H. Spaeth, A.J. Steckl, J. Vacuum Sci. Technol. 26 (2008)
[9] R.S. Dias, K. Dawson, M.G. Miguel, in: DNA Interactions with Polymers and
2567–2571.
Surfactants, John Wiley & Sons, Inc., Hoboken, NJ, USA, 2008, pp. 89–117,
[35] R. Joksimovic, S. Watanabe, S. Riemer, M. Gradzielski, K. Yoshikawa, Sci. Rep. 4
https://doi.org/10.1002/9780470286364.ch4.
(2014) 3660.
[10] M. Falk, K.A. Hartman, R.C. Lord, J. Am. Chem. Soc. 84 (1962) 3843–3846.
[36] C. Thibault, V. Le Berre, S. Casimirius, E. Trévisiol, J. François, C. Vieu,
[11] H. Haranczyk, J. Czak, P. Nowak, J. Niziol, Acta Phys. Polon. A 117 (2010)
J. Nanobiotechnol. 3 (2005) 7.
397–402.
[37] J. Fredonnet, J. Foncy, S. Lamarre, J.-C. Cau, E. Trévisiol, J.-P. Peyrade, J.
[12] M.G. Kubinec, D.E. Wemmer, J. Am. Chem. Soc. 114 (1992) 8739–8740.
M. François, C. Séverac, Microelectron. Eng. 111 (2013) 379–383.
[13] H. Haranczyk, J. Kobierski, D. Zalitacz, P. Nowak, A. Romanowicz, M. Marzec,
[38] Y. Wang, S.H. Goh, X. Bi, K.-L. Yang, J. Colloid Interface Sci. 333 (2009) 188–194.
J. Niziol, E. Hebda, J. Pielichowski, Acta Phys. Polon. A 121 (2012) 485–490.
[39] E. Bystrenova, M. Facchini, M. Cavallini, M.G. Cacace, F. Biscarini, Angew. Chem.
[14] J. Nizioł, H. Harańczyk, J. Kobierski, E. Hebda, J. Pielichowski, B. Ostachowicz,
118 (2006) 4897–4900.
J. Appl. Phys. 114 (2013) 144701.
[40] B.D. Myers, Q.-Y. Lin, H. Wu, E. Luijten, C.A. Mirkin, V.P. Dravid, ACS Nano 10
[15] H. Haranczyk, J. Kobierski, J. Niziol, E. Hebda, J. Pielichowski, D. Zalitacz,
(2016) 5679–5686.
M. Marzec, A. El-Ghayoury, J. Appl. Phys. 113 (2013), 044702.
[41] J. Nizioł, K. Makyła-Juzak, A. Radko, R. Ekiert, J. Zemła, N. Górska, A. Chachaj-
[16] J. Nizioł, P. Nowak, J. Kobierski, H. Harańczyk, Eur. Polym. J. 66 (2015) 301–306.
Brekiesz, M. Marzec, H. Harańczyk, P. Dynarowicz-Latka, Polymer 178 (2019),
[17] R.S. Dias, A.A.C.C. Pais, M.G. Miguel, B. Lindman, Colloids Surf. Physicochem. Eng.
121643.
Aspects 250 (2004) 115–131.
[42] M. Muñoz-Úbeda, S.K. Misra, A.L. Barrán-Berdón, C. Aicart-Ramos, M.B. Sierra,
[18] E. Grueso, C. Cerrillos, J. Hidalgo, P. Lopez-Cornejo, Langmuir 28 (2012)
J. Biswas, P. Kondaiah, E. Junquera, S. Bhattacharya, E. Aicart, J. Am. Chem. Soc.
10968–10979.
133 (2011) 18014–18017.
[19] N. Kobayashi, K. Nakamura, DNA electronics and photonics, in: H. Ishii, K. Kudo,
[43] D. Janiszek, M.M. Karpinska, A. Niewiadomy, A. Girstun, H. Elzanowska, M. Maj-
T. Nakayama, N. Ueno (Eds.), Electronic Processes in Organic Electronics: Bridging
Zurawska, P.J. Kulesza, Electrochim. Acta 210 (2016) 422–434.
Nanostructure, Electronic States and Device Properties, Springer Japan, 2015,
[44] E. Palecek, Crit. Rev. Biochem. Mol. Biol. 26 (1991) 151–226.
pp. 253–281.
[45] M. Munoz-Ubeda, S.K. Misra, A.L. Barran-Berdon, C. Aicart-Ramos, M.B. Sierra,
[20] J. Nizioł, R. Ekiert, J. Kuczkowska, P. Fryń, M. Marzec, Polym. Test. 80 (2019),
J. Biswas, P. Kondaiah, E. Junquera, S. Bhattacharya, E. Aicart, J. Am. Chem. Soc.
106158.
133 (2011) 18014–18017.
[21] J. Nizioł, J. Fiedor, J. Pagacz, E. Hebda, M. Marzec, E. Gondek, I.V. Kityk, J. Mater.
[46] J.T. Davies, E.K. Rideal, Interfacial Phenomena, 2 ed., Academic Press, 1963.
Sci. Mater. Electron. 28 (2017) 259–268.
[47] G. Roberts (Ed.), Langmuir-Blodgett Films, Springer US, Boston, MA, 1990.
[22] Y. Shi, X. Li, Org. Electron. 15 (2014) 286–293.
[48] D.K. Chattoraj, K.S. Birdi (Eds.), Adsorption and the Gibbs Surface Excess, Springer
[23] M. Reddeppa, S.B. Mitta, B.-G. Park, S.-G. Kim, S.H. Park, M.-D. Kim, Org. Electron.
US, Boston, MA, 1984.
65 (2019) 334–340.
[49] I. Koltover, T. Salditt, J.O. Rädler, C.R. Safinya, Science 281 (1998) 78–81.
[24] P. Stadler, K. Oppelt, T.B. Singh, J.G. Grote, R. Schwodiauer, S. Bauer,
[50] E. Braun, Y. Eichen, U. Sivan, G. Ben-Yoseph, Nature 317 (1998) 775–777.
H. Piglmayer-Brezina, D. Bauerle, N.S. Sariciftci, Org. Electron. 8 (2007) 648–654.
11You can also read