HHS Public Access Author manuscript Nat Methods. Author manuscript; available in PMC 2016 August 11 - SFPMed
←
→
Page content transcription
If your browser does not render page correctly, please read the page content below
HHS Public Access
                                 Author manuscript
                                Nat Methods. Author manuscript; available in PMC 2016 August 11.
Author Manuscript

                    Published in final edited form as:
                     Nat Methods. 2016 July 28; 13(8): 627–638. doi:10.1038/nmeth.3925.

                    A Practical Guide to Photoacoustic Tomography in the Life
                    Sciences
                    Lihong V. Wang1,2 and Junjie Yao1
                    1Optical Imaging Laboratory, Department of Biomedical Engineering, Washington University in St.
                    Louis, St. Louis, MO, USA
Author Manuscript

                    Abstract
                         The life sciences can benefit greatly from imaging technologies that connect microscopic
                         discoveries with macroscopic observations. Photoacoustic tomography (PAT), a highly sensitive
                         modality for imaging rich optical absorption contrast over a wide range of spatial scales at high
                         speed, is uniquely positioned for this need. In PAT, endogenous contrast reveals tissue’s
                         anatomical, functional, metabolic, and histologic properties, and exogenous contrast provides
                         molecular and cellular specificity. The spatial scale of PAT covers organelles, cells, tissues, organs,
                         and small-animal organisms. Consequently, PAT is complementary to other imaging modalities in
                         contrast mechanism, penetration, spatial resolution, and temporal resolution. We review the
                         fundamentals of PAT and provide practical guidelines to the broad life science community for
                         matching PAT systems with research needs. We also summarize the most promising biomedical
                         applications of PAT, discuss related challenges, and envision its potential to lead to further
Author Manuscript

                         breakthroughs.

                    INTRODUCTION
                                      By providing a comprehensive illustration of life from molecular to anatomical aspects,
                                      modern biomedical imaging has revolutionized the life sciences. Imaging technologies have
                                      been used through history to peer into complex biological systems in ever-more informative
                                      ways: finer spatial resolution, richer contrast, higher imaging speed, deeper penetration, and
                                      greater detection sensitivity. At the macroscopic scale, a number of methods including
                                      magnetic resonance imaging, X-ray computed tomography, and ultrasound imaging have
                                      excellent penetration for anatomical imaging. Positron emission tomography and single-
                                      photon emission computed tomography have deep penetration and excellent sensitivity to
Author Manuscript

                                      radioactively-labeled molecular probes. At the microscopic scale, optical microscopy can
                                      detail biological phenomena with subcellular and suborganelle resolutions at superficial
                                      depths. However, the different imaging contrast mechanisms of these imaging tools and their
                                      different length scales have hindered correlative multiscale studies of biological problems. It

                    2
                     Correspondence should be addressed to: L.V.W. (lhwang@wustl.edu).
                    COMPETING FINANCIAL INTERESTS
                    L.V.W. has a financial interest in Microphotoacoustics, Inc., which, however, did not support this work. J.Y. declares no competing
                    financial interests.
Wang and Yao                                                                                             Page 2

                                   is imperative to build a continuum from microscopic to macroscopic imaging in the life
Author Manuscript

                                   sciences.

                                   In the last decade, photoacoustic tomography (PAT, also referred to as optoacoustic or
                                   thermoacoustic tomography) has proven capable of multiscale imaging with a consistent
                                   contrast mechanism; thus, it is well situated to bridge the microscopic and macroscopic
                                   domains in the life sciences. PAT is a hybrid imaging modality that acoustically detects
                                   optical absorption contrast via the photoacoustic (PA) effect, a physical phenomenon that
                                   converts absorbed optical energy into acoustic energy 1. The combination of optical
                                   excitation with ultrasonic detection offers three advantages: (1) PAT is inherently suited for
                                   functional, metabolic, and histologic imaging through endogenous contrast, and for
                                   molecular and cellular imaging through exogenous contrast. (2) Because biological tissue is
                                   orders of magnitude more transparent to sound than to light, in terms of scattering mean free
                                   path, PAT provides far greater penetration with a scalable spatial resolution than optical
Author Manuscript

                                   microscopy. (3) PAT is complementary to and compatible with other imaging modalities,
                                   especially optical imaging and ultrasound imaging.

                                   It took more than a century for photoacoustics to evolve from a known physical phenomenon
                                   to a valuable biomedical imaging modality. Although the PA effect was first reported by Bell
                                   in 1880 with the invention of the photophone 1, one hundred years passed before Bowen
                                   proposed to use this phenomenon for imaging, by excitation using ionizing radiation (e.g.,
                                   high-energy electrons and X-ray photons) or non-ionizing radiation (e.g., radiowaves and
                                   microwaves) 2. He showed radiowave-induced one-dimensional (1D) depth-resolved
                                   imaging without intended lateral resolution, but did not mention the possibility of optical
                                   excitation in his patent. In the 1990s, the laser-induced counterpart of 1D depth-resolved
                                   imaging was demonstrated 3–7. With inverse reconstruction or spherically focused ultrasonic
Author Manuscript

                                   detection, 2D 8 and 3D 9, 10 PAT, with both lateral and axial resolutions, were finally
                                   developed. In the decade that followed, several milestones were reached in anatomical,
                                   functional, and molecular PAT11–15. Particularly, the first functional photoacoustic computed
                                   tomography (PACT) 11 as well as the first functional photoacoustic microscopy (PAM) 12
                                   heralded the fast growth of the field thereafter.

                                   Although turn-key commercial PAT systems are now available for preclinical applications,
                                   users can still benefit from understanding the principles and characteristics of PAT,
                                   especially when choosing or optimizing a PAT system for a specific application. In this
                                   review, we introduce the basic principles of PAT and emphasize its functional and molecular
                                   imaging capabilities in the preclinical life sciences. We provide practical guidelines with
                                   case studies to scientists who want to choose or develop a PAT system that can best serve
Author Manuscript

                                   their research, and we summarize the most exciting biomedical applications. We also discuss
                                   the current technical challenges of PAT, which point to further potential breakthroughs.

                       PRINCIPLES OF PAT
                                   Although PAT has been tailored for diverse applications, its principles remain the same. The
                                   imaging process typically starts with a short laser pulse fired at biological tissue. As photons
                                   propagate into the tissue, some are absorbed by biomolecules (e.g., hemoglobin, DNA/RNA,

                                       Nat Methods. Author manuscript; available in PMC 2016 August 11.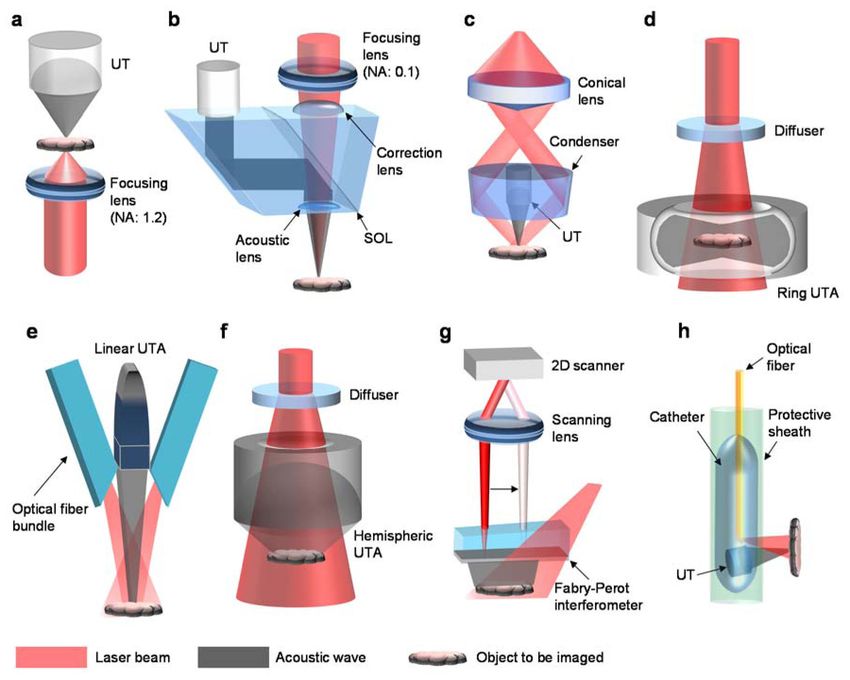
Wang and Yao                                                                                             Page 3

                                   lipids, water, melanin, and cytochrome). The various absorption mechanisms in PAT include
                                   (but are not limited to) electronic absorption, vibrational absorption 16, stimulated Raman
Author Manuscript

                                   absorption 17, and surface plasmon resonance absorption 18. The absorbed optical energy is
                                   usually partially or completely converted into heat through nonradiative relaxation of excited
                                   molecules (Fig. 1a). The heat-induced pressure wave propagates in tissue as an ultrasound
                                   wave. The ultrasound wave is detected outside the tissue by an ultrasonic transducer or
                                   transducer array to form an image that maps the original optical energy deposition inside the
                                   tissue (Fig. 1b). PAT has a 100% relative sensitivity to small optical absorption variations,
                                   which means a given percentage change in the optical absorption coefficient yields the same
                                   percentage change in the PA signal amplitude. By contrast, back-scattering-based confocal
                                   microscopy has a relative sensitivity to optical absorption in blood of only ~6% at 560 nm
                                   and ~0.08% at 800 nm. Because PAT does not rely on fluorescence, which usually has a
                                   quantum yield less than 100%, it can image nearly all molecules 15, 19, 20.
Author Manuscript

                       Major PAT implementations
                                   The major components of a typical PAT system include a short-pulsed laser (e.g., a
                                   nanosecond Q-switched Nd:YAG laser) for efficient wideband PA signal generation (Box 1),
                                   a wideband ultrasonic transducer or transducer array for signal detection, a data acquisition
                                   system for signal amplification and digitization, and a computer for system synchronization,
                                   data collection, and image formation. The bandwidth of the transducer should match the
                                   bandwidth of the PA signals that originate from small optical absorbers at the desired depth
                                   and survive the frequency-dependent acoustic attenuation of tissue. Matched broadband
                                   detection optimizes signal-to-noise ratio, and thus detection sensitivity and axial resolution.

                                   Box 1
Author Manuscript

                                                                       Light sources in PAT
                                   PAM and PACT have different requirements for optimal pulsed lasers, mainly in their
                                   pulse repetition rate, pulse energy, pulse width, and wavelength tunability. In general,
                                   while a high pulse repetition rate is key to PAM, a high pulse energy output is important
                                   to PACT.

                                   For raster-scanning PAM (Fig. 2a–c), the laser pulse repetition rate should be more than 1
                                   kHz for rapid 3D imaging. For example, to raster scan 200 × 200 points within 0.1 s, the
                                   pulse repetition rate must be at least 400 kHz. For PACT (Fig. 2d–g), where a single
                                   pulse can generate a 2D or 3D image, a pulse repetition rate of tens of hertz is usually
                                   sufficient. With a relatively small optical excitation region, PAM usually employs less
                                   pulse energy (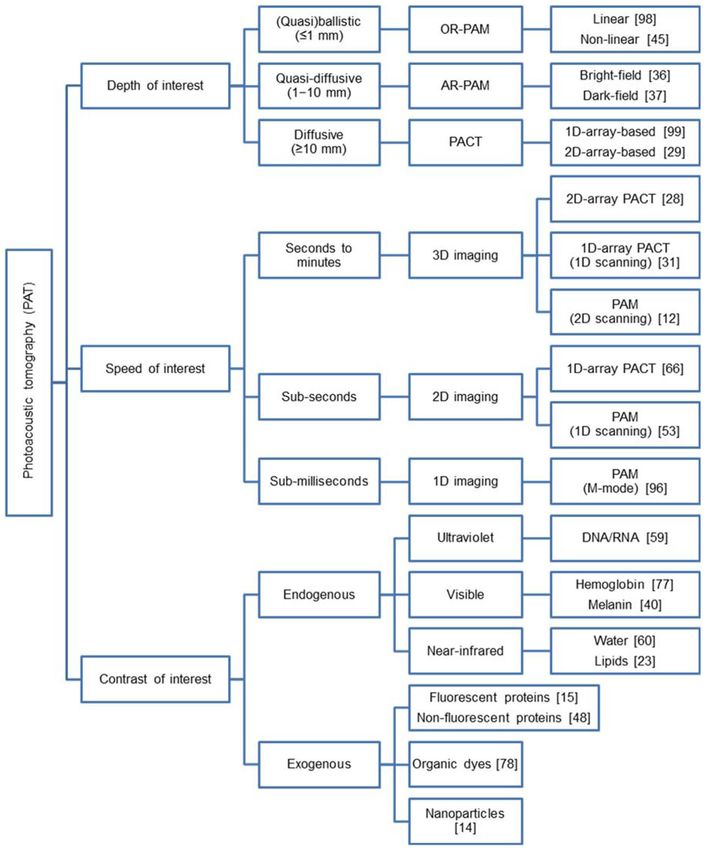
Wang and Yao                                                                                             Page 4

                                   compact and less expensive alternatives; however, they have low pulse energies even
Author Manuscript

                                   when used in group (e.g., stacking multiple laser diodes), resulting in low signal-to-noise
                                   ratio. Employing temporally coded excitation (e.g., Golay codes 103) improves signal-to-
                                   noise ratio at the cost of imaging speed.

                                   PAT has been implemented with two major image formation methods (Fig. 2). The first
                                   method, focused-scanning image formation, commonly used in PAM, is based on
                                   mechanical scanning of a focused excitation light beam and a focused single-element
                                   ultrasonic transducer (Fig. 2a–c). The second method, used in PACT, is inverse
                                   reconstruction image formation, based on wide-field light illumination and acoustic
                                   detection at multiple locations (Fig. 2d–g). PAT can also be implemented for
                                   endoscopy 21–24. Due to the high scalability of PAT, the imaging performances of different
                                   implementations are highly overlapping, with convenient transitions among them. In
Author Manuscript

                                   addition, complementary original implementations can be hybridized in various forms.
                                   Furthermore, combining optical excitation with acoustic detection, PAT is compatible with
                                   complementary imaging modalities, especially optical imaging and ultrasound imaging 25.

                                   PAM can be further classified into optical-resolution PAM (OR-PAM) (Fig. 2a–b), where the
                                   optical focus is much tighter than the acoustic focus, and acoustic-resolution PAM (AR-
                                   PAM) (Fig. 2c), where the acoustic focus is tighter than the diffused optical beam. In both
                                   cases, the axial resolution is determined acoustically. In OR-PAM, the optically-determined
                                   lateral resolution is typically much finer than the axial resolution. The optical focusing can
                                   be either strong or weak, depending on the desired spatial resolution and penetration.
                                   Conversely, in AR-PAM, the axial resolution is typically finer than the lateral resolution.

                                   PACT can be configured with a 1D ultrasonic transducer array 26, 27 (Fig. 2d–e), a 2D
Author Manuscript

                                   transducer array (Fig. 2f) 28, 29, or their scanning equivalents (Fig. 2g) 11, 30, 31. For 1D-
                                   array based PACT, the axial (or radial) and lateral (or tangential) resolutions in the imaging
                                   plane, derived from reconstruction, are typically finer than the elevational resolution,
                                   determined by cylindrical acoustic focusing. In the imaging plane, the axial (or radial)
                                   direction is along the axis that perpendicularly passes the transducer element surface through
                                   the center (i.e., along the acoustic axis), and the lateral (or tangential) direction is
                                   perpendicular to the axial (or radial) direction. The elevational direction is orthogonal to the
                                   imaging plane. For 2D-array based PACT, the resolutions can be nearly isotropic at the
                                   center of the field of view. Compared with PAM, state-of-the-art PACT generally has higher
                                   imaging speeds and greater penetration, but lower spatial resolutions.

                       Image formation in PAT
Author Manuscript

                                   Simply speaking, with a known speed of sound, PAT forms images by numerically reversing
                                   the received PA signals in time back to their original positions in space. In PAM (Fig. 2a–c),
                                   each PA signal is received primarily from the volume laterally confined by the optical focus
                                   or acoustic focus, whichever is smaller; it is converted into a 1D image of the optical energy
                                   deposition along the acoustic axis by extracting its envelope—the amplitude modulation
                                   curve of the radio-frequency PA signal. In PACT (Fig. 2d–g), each ultrasonic transducer
                                   element receives PA signals over a large acceptance angle, and data from all transducer

                                       Nat Methods. Author manuscript; available in PMC 2016 August 11.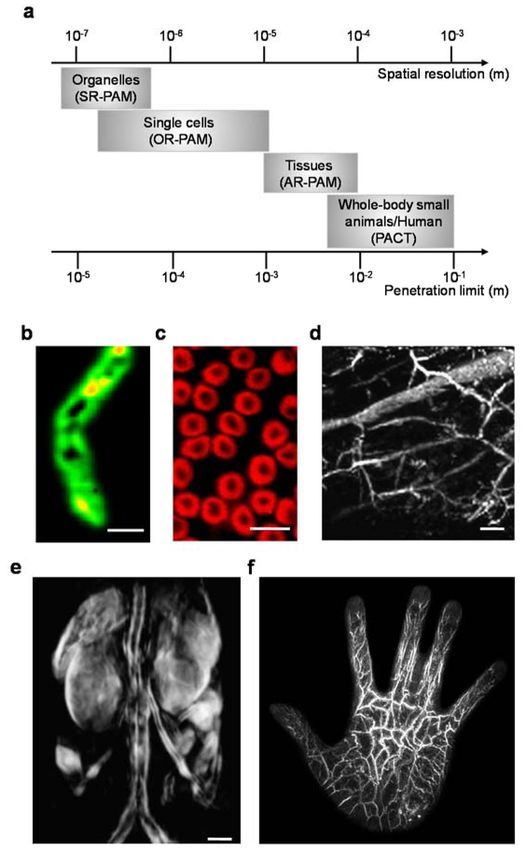
Wang and Yao                                                                                               Page 5

                                   elements are used to reconstruct an image using the inverse spherical Radon transformation,
                                   which is approximately similar to triangulation used in the Global Positioning System 32, 33.
Author Manuscript

                                   Depending on the image formation method, PAT may require mechanical or electronic
                                   scanning. For PAM, where a single laser pulse generates a 1D depth-resolved image, 2D
                                   raster scanning or arbitrary trajectory scanning of the ultrasonic transducer is employed to
                                   obtain a 3D image. For PACT with a 1D transducer array, where a single laser pulse
                                   generates a 2D cross-sectional image, orthogonal scanning along the elevational direction or
                                   rotational scanning around the object is needed to obtain a 3D image. For PACT with a 2D
                                   transducer array, a single laser shot can theoretically generate a 3D image 28; in practice,
                                   however, either electronic or mechanical scanning of the transducer array is needed to
                                   complete data acquisition.

                       MATCHING PAT SYSTEMS WITH APPLICATIONS
Author Manuscript

                                   A given study may be best matched with a particular PAT system. The three typical
                                   questions concern (1) the imaging depth, (2) the imaging speed or temporal resolution, and
                                   (3) the imaging contrast. To best address a specific problem, one may need to optimally
                                   trade off the performance parameters of PAT. As a guide, Fig. 3 categorizes the major PAT
                                   implementations according to these three criteria—depth, speed, and contrast of interest.

                       Imaging depth
                                   Photon propagation in soft tissue can be loosely classified into four regimes, which define
                                   the penetration limits of various high-resolution optical imaging modalities (Fig. 4a) 34. The
                                   spatial resolution of PAT scales with the imaging depth over a wide range from the
                                   (quasi)ballistic regime (typically ≤1 mm in tissue) to the diffusive regime (typically ≥10 mm
Author Manuscript

                                   in tissue), up to the dissipation limit (~10 cm in tissue) 35. Reducing the imaging depth of
                                   PAT improves its spatial resolution, approximately in proportion. As a rule of thumb, the
                                   ratio of the imaging depth to the resolution is ~200, permitting PAT to provide high-
                                   resolution imaging across a wide range of imaging depths (Fig. 3).

                                   Considering the prevalence of confocal microscopy and two-photon microscopy in the life
                                   sciences, we illustrate how they compare to PAM and PACT in terms of imaging depth (Fig.
                                   4b). The imaging depth of confocal microscopy is limited to 100–200 μm in biological
                                   tissue, because it relies on the miniscule number of ballistic photons that have survived the
                                   round-trip optical attenuation. Two-photon microscopy improves the imaging depth by using
                                   longer excitation wavelengths, which reduces optical attenuation and broadens optical
                                   focusing. Nevertheless, the low two-photon excitation efficiency and the overwhelming
Author Manuscript

                                   surface signal still limit the penetration to ~1.5 mm. Compared with two-photon microscopy,
                                   OR-PAM can achieve a similar, if not greater, imaging depth for two reasons: (1) the signal
                                   amplitude depends linearly instead of quadratically on the excitation light intensity, and the
                                   detection suffers negligible acoustic attenuation; (2) time-resolved acoustic detection
                                   effectively suppresses the interference of the surface signal. Nevertheless, OR-PAM still
                                   relies on (quasi)ballistic photons to provide optically-defined lateral resolution. If the spatial
                                   resolution is relaxed to tens of micrometers, which is achievable with high-frequency
                                   ultrasonic detection, AR-PAM can be used to break into the quasi-diffusive regime (e.g., a

                                       Nat Methods. Author manuscript; available in PMC 2016 August 11.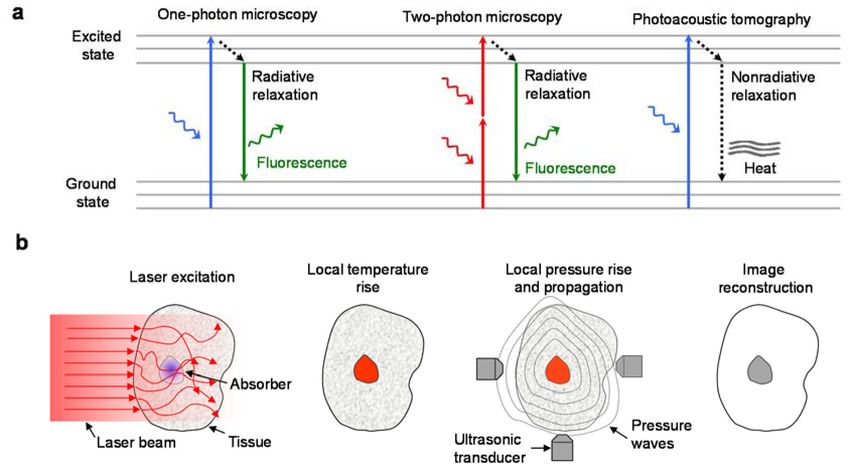
Wang and Yao                                                                                              Page 6

                                   penetration of ~5 mm at 50 MHz ultrasonic detection 36), where most photons have
Author Manuscript

                                   experienced many scattering events. With acoustically defined lateral resolution, both
                                   ballistic and scattered photons reaching the target contribute to the PA signal. The
                                   penetration of AR-PAM is largely limited by high-frequency acoustic attenuation, and can
                                   potentially be extended to at least 10 mm with proportionately relaxed resolutions 37. If the
                                   desired spatial resolution is further relaxed to hundreds of micrometers, which is attainable
                                   with low-frequency ultrasonic detection (e.g., 5 MHz), PACT can be used to reach the
                                   diffusive regime with penetration demonstrated up to 70 mm in living tissue 38. However,
                                   PACT is still limited by dissipation to less than ~10 cm in soft tissue, where the optical
                                   fluence—the photon energy received per unit area (J/cm2)—is substantially attenuated due
                                   to both absorption and scattering. When the optical scattering effect is compensated for by
                                   using wavefront engineering technologies 39, it may be possible to approach a sufficient
                                   penetration toward the absorption limit (~1 m) for whole-body human imaging (Fig. 4a).
Author Manuscript

                       Spatial resolution
                                   Once a desired imaging depth is determined, one can estimate the achievable spatial
                                   resolution (Fig. 5a). For imaging in the (quasi)ballistic regime, OR-PAM is preferred, as it
                                   can resolve single cells or organelles (Fig. 5b–c). OR-PAM is useful for studying cancer
                                   angiogenesis, where neo-capillaries are less than 10 μm in diameter, and for single-cell
                                   flowmetry, where the functions of individual cells are of interest 40. AR-PAM is preferred
                                   for imaging in the quasidiffusive regime. An imaging depth of ~5 mm and tissue-level (~50
                                   μm lateral and 15 μm axial) spatial resolutions have been achieved (Fig. 5d) 12. For imaging
                                   in the diffusive regime—reaching the depths of whole-body small animals (Fig. 5e), PACT
                                   with spatial resolution of hundreds of micrometers is preferred (Fig. 5f) 31.

                                   The spatial resolution of PAT can be tuned optically and acoustically (Fig. 5a). For OR-
Author Manuscript

                                   PAM, a shorter excitation wavelength and tighter optical focusing yield finer lateral
                                   resolution, and a wider ultrasonic detection bandwidth in MHz provides better axial
                                   resolution. Nevertheless, it is worth noting that the axial resolution of OR-PAM with a tens
                                   of MHz detection bandwidth is on the level of tens of micrometers. The recent development
                                   of OR-PAM with an ultra-wide detection bandwidth (in GHz) has provided approximately
                                   isotropic resolutions 41. However, the strong acoustic attenuation at ultra-high ultrasound
                                   frequencies limits the applications to single-cell studies. For AR-PAM, a wider ultrasonic
                                   detection bandwidth similarly provides better axial resolution, while a higher central
                                   ultrasonic detection frequency benefits lateral resolution. Further, a tighter acoustic focusing
                                   improves lateral resolution at the cost of focal zone, which is defined as the depth range
                                   within which the lateral resolution degrades up to ~1.4 times. The spatial resolutions of
                                   PACT can be improved by increasing the central frequency and bandwidth of the ultrasonic
Author Manuscript

                                   transducer array. However, in all cases, spatial resolution is improved at the expense of
                                   penetration.

                                   Super-resolution OR-PAM that beats the optical diffraction limit has recently been achieved.
                                   Various nonlinear mechanisms have been used to increase resolution, including optical
                                   absorption saturation (Fig. 5b) 42, photothermal nonlinearity 43, two-photon absorption 44,
                                   nano-bubble cavitation 45, thermal or Grueneisen relaxation 46, photothermal bleaching 47,

                                       Nat Methods. Author manuscript; available in PMC 2016 August 11.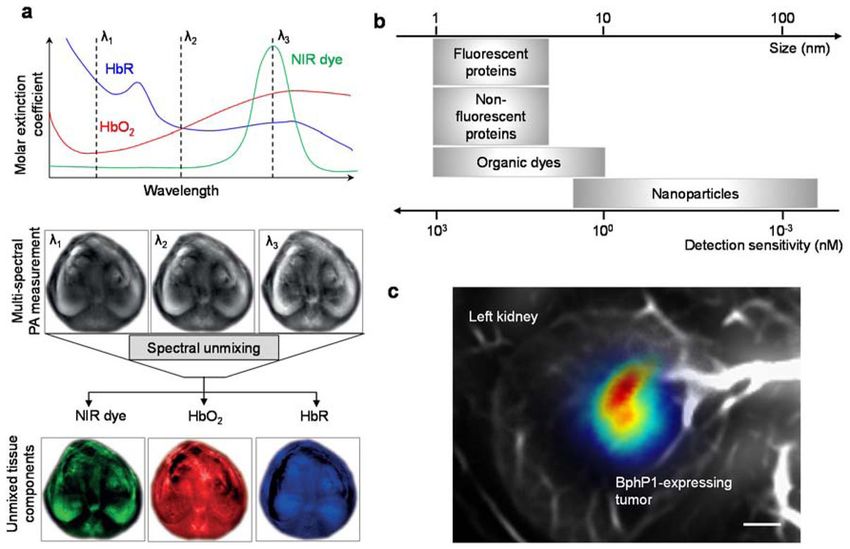
Wang and Yao                                                                                            Page 7

                                   and reversible photoswitching 48. Just as in confocal microscopy and two-photon
Author Manuscript

                                   microscopy, in addition to the enhancement in lateral resolution, nonlinear OR-PAM
                                   automatically enables optical sectioning, which provides at least 10-fold finer axial
                                   resolution than the time-resolved acoustic sectioning in conventional linear OR-PAM.

                       Imaging speed
                                   Biological functions occur on a wide variety of temporal scales. Various implementations of
                                   PAT offer a wide range of imaging speeds with associated tradeoffs (Fig. 3). Scientists
                                   should choose imaging systems with only the needed imaging speeds so that the other
                                   performance parameters can be optimized.

                                   For OR-PAM (Fig. 2a–b), different scanning mechanisms can be employed according to the
                                   desired imaging speeds 49. Unlike confocal or two-photon microscopy, PAM does not
                                   require depth scanning for 3D imaging, due to its time-resolved acoustic detection. When
Author Manuscript

                                   video-rate 3D imaging is needed, the excitation laser beam can be raster-scanned within the
                                   acoustic focal spot (~50 μm in diameter), although this confines the field of view. A 3D
                                   imaging rate of ~30 Hz, limited largely by the laser pulse repetition rate, has been used to
                                   image single red blood cells flowing in capillaries. Random-access scanning over only the
                                   features of interest while skipping the background, enabled by a digital micromirror array,
                                   can further improve the imaging speed 50. Unfocused acoustic detection can enlarge the field
                                   of view—up to ~6 mm in diameter as demonstrated thus far—at the expense of signal
                                   amplitude 51. Recently, hybrid scanning, using a water-immersible MEMS mirror that
                                   confocally steers both the excitation laser beam and the emitted acoustic beam, has achieved
                                   a 3D imaging rate of ~1 Hz, with a moderate field of view of ~3 × 4 mm2 and
                                   uncompromised detection sensitivity 52, 53. If lower-dimensional imaging suffices, the
                                   imaging rate improves with each reduced dimension by approximately two orders of
Author Manuscript

                                   magnitude.

                                   For AR-PAM (Fig. 2c), the imaging speed is mainly limited by the mechanical scanning
                                   speed and the pulse repetition rate of the higher pulse-energy laser, the latter of which is
                                   limited by safety of laser exposure on the tissue. In AR-PAM, mechanical scanning by a step
                                   motor or a voice-coil scanner is typically used with a scanning step size ~10 times that in
                                   OR-PAM. A 2D imaging rate of 40 Hz has been achieved by AR-PAM over a scanning
                                   range of ~9 mm, sufficient to capture the oxygenation dynamics in a mouse heart within a
                                   heart beat 36.

                                   For PACT that provides a large field of view, the imaging speed is usually limited by the
                                   pulse repetition rate of the laser and the time required for multiplexed data acquisition.
Author Manuscript

                                   Using a 1D or 2D ultrasonic transducer array, a single laser shot can theoretically generate a
                                   2D or 3D image over the entire field of view. However, multiplexed data acquisition, which
                                   is usually adopted to reduce costs, slows down data collection. Commercially-available
                                   high-pulse-energy lasers used in PACT typically operate at a repetition rate less than 50 Hz.
                                   In addition, because repeated wide-field illumination may cause tissue damage due to
                                   accumulated heating, the average fluence rate (W/cm2) in addition to the fluence (J/cm2) per
                                   pulse on the tissue surface should be controlled to prevent damage 54. A recently developed
                                   PACT system with a hemispherical ultrasonic transducer array (256 elements) has achieved

                                       Nat Methods. Author manuscript; available in PMC 2016 August 11.
Wang and Yao Page 8
a 3D imaging rate of ~50 Hz over a field of view of 15 × 15 × 7 mm3 (Fig. 2f), which is
Author Manuscript
sufficient to image in real time the beating heart of a mouse and the neuronal activities of a
swimming zebra fish 28. However, the sparse spatial sampling due to the limited number of
transducer elements induces imaging artifacts outside the central field of view. For PACT
systems based on a Fabry-Perot interferometer (Fig. 2g), the spatial resolutions can be well
maintained with dense spatial sampling over the field of view, but the imaging speed is
limited by the point-by-point scanning of the probing beam 30. Wide-field detection of the
interference pattern, using time-gated light illumination and a high-speed CCD camera, can
potentially speed up imaging 55, 56.
Imaging contrast and sensitivity
To study a given biological phenomenon, scientists also need to identify an optimal imaging
contrast that can report the phenomenon with high sensitivity or specificity or both. Because
Author Manuscript
PAT does not rely on fluorescence, any molecule can theoretically be imaged as PA contrast
as long as nonradiative relaxation occurs. Both endogenous and exogenous contrast agents
have been extensively explored by PAT 57, 58.
Endogenous contrast agents have several major advantages: (1) nontoxicity, (2)
nonperturbation to biology, (3) abundance, and (4) freedom from regulatory approval. The
most commonly imaged endogenous contrast agents in PAT include DNA/RNA 59,
hemoglobin 31, melanin 40, lipids 36, and water 60 (Fig. 3). Among them, hemoglobin is
most commonly used for label-free hemodynamic imaging, providing anatomic, functional
and metabolic information about blood vessel diameter, total hemoglobin concentration,
blood oxygenation, blood flow, and oxygen metabolism.
Exogenous contrast agents have two advantages over endogenous ones: (1) optimization for
Author Manuscript
greater detection sensitivity and (2) conjugation with targeting molecules (e.g., antibodies)
to selectively bind to receptors for molecular imaging. A wide range of exogenous contrast
agents—including organic dyes 61, fluorescent proteins 62, non-fluorescent proteins 48, and
nanoparticles 63—have been investigated for high-sensitivity PA molecular imaging (Fig. 3).
Quantitative spectroscopic PA imaging, where the tissue is sequentially illuminated at
multiple wavelengths, has been commonly used to separate signals from multiple types of
optical absorbers (Fig. 6a) 64. However, quantifying the absorber concentrations generally
requires knowledge of the local optical fluence at different wavelengths, which is often
difficult to estimate, especially in deep tissue, due to the strong but usually unknown
wavelength-dependent light attenuation. Other factors, including PA signal generation
efficiency, nonlinear optical absorption, and non-uniform light illumination and acoustic
Author Manuscript
attenuation, also complicate the quantification. Recently, statistical unmixing methods using
adaptive matched filters have demonstrated better performance than the conventional least-
squares-based methods, showing more robustness to the uncertainties of the background
signals 65. However, these methods are more suitable for identifying sparsely distributed
absorbers rather than quantifying their concentrations. For more detailed discussion, readers
are referred to comprehensive reviews of inverse methods for quantitative spectroscopic PA
imaging 64.
Nat Methods. Author manuscript; available in PMC 2016 August 11.Wang and Yao Page 9
To achieve high detection sensitivity at depths, contrast agents with large optical absorption
Author Manuscript
cross-sections in the red or near-infrared (NIR) spectral region are usually preferred (Fig.
6b) as detailed in the companion review 58. Due to their large particle sizes and/or the
surface plasmon resonance effect, nanoparticles generally provide high sensitivity and thus
have been widely studied for PAT 14, although they usually have long circulating times in the
bloodstream and poor clearance from the body. Organic dyes are also widely used as PA
contrast agents, due to their relatively short circulating times and fast clearance from the
body 66. Genetically encodable proteins (fluorescent or not) have become increasingly
popular in PA molecular imaging, due to their high selectivity and ease of exogenous
delivery 15, 20, 62, 67–71. Novel methods using activatable nanoparticles or photoswitchable
proteins have been reported (Fig. 6c) 48, 72, which can effectively enhance the detection
sensitivity.
To further improve PA detection sensitivity, which is often quantified as the noise-equivalent
Author Manuscript
detectable concentration of a contrast agent, one can maximize the target signal amplitude,
suppress the background signal amplitude, optimize the electronics, and reduce the noise
amplitude. Increasing the optical fluence and tuning the laser wavelength toward the
absorption peak, in addition to choosing contrast agents with large optical absorption cross-
sections, increase the target signal amplitude, as long as the temperature rise per laser pulse
is within the safety range. The American National Standards Institute (ANSI) has detailed
standards for laser exposure to the skin and eye 54. Within the ANSI limit, PAT is safe for in
vivo imaging, due to the adequate conversion efficiency from temperature rise to acoustic
pressure (i.e., 1 mK temperature rise leads to a detectable ~800 Pa pressure rise). Also,
matching the ultrasonic transducer with the detectable PA signal spectrum, which is
primarily limited by the depth of the target, maximizes the detection efficiency. While the
detection sensitivity of a conventional piezoelectric ultrasonic transducer degrades with
Author Manuscript
decreasing element size, the sensitivity of optical sensors of acoustic waves, typically based
on interferometry, does not. Therefore, optical detection holds great promise for high-
sensitivity PAE, where the ultrasonic transducer must be miniaturized. The electronics of
PAT systems can be optimized by matching the impedances of the ultrasonic transducers and
the amplifiers, in addition to picking low-noise amplifiers. The noise level can be reduced by
shortening the cables, grounding the amplifiers, and shielding external interferences.
SELECTED APPLICATIONS
PAT has found broad applications in the life sciences, especially in functional brain
mapping, cancer diagnosis, tissue engineering, developmental biology, and cell biology, as
comprehensively reviewed elsewhere 19. Here, we sample only several representative
Author Manuscript
application areas where PAT has played increasingly important roles. We also highlight two
case studies in Table 1.
PAT has enabled functional and metabolic brain imaging at both microscopic and
macroscopic scales, providing valuable information about brain vasculature 73, oxygenation
(Fig. 7a) 27, metabolism of oxygen and glucose 74, resting state connectivity 75, and brain
responses to various physiological and pathological challenges 76–78. PAT can provide
neuronal imaging using either endogenous contrast from lipids or exogenous contrast from
Nat Methods. Author manuscript; available in PMC 2016 August 11.Wang and Yao Page 10
dyes 79. In addition, PAT has been increasingly used to study small-animal models of brain
diseases, including stroke 80, epilepsy 81, and edema 60. Recently, light-weight head-
Author Manuscript
mounted PACT systems have been developed, an important step towards functional PA
imaging of brains in free-moving animals 82.
High-resolution imaging of single cells is crucial in cell biology. OR-PAM, with sub-
micrometer to micrometer resolution, is well suited for imaging single-cell morphology and
function 83. For cell morphology, OR-PAM can perform in vivo histologic imaging without
staining, by imaging DNA and RNA within the cell nuclei and cytochromes within the
cytoplasm. Using ultrasonic transducers with extremely high frequencies (>1 GHz), OR-
PAM has revealed morphological abnormality of diseased red blood cells, and can
differentiate white blood cell types according to the frequency features of their PA
signals 41, 84, 85. For cell function, PA oxymetry is capable of label-free imaging of oxygen
unloading in single red blood cells in vivo (Fig. 7b) 86. PA flowmetry can detect circulating
Author Manuscript
tumor cells in the blood stream, with high sensitivity and high throughput, using endogenous
contrast (e.g., melanin 40, 87) or targeted exogenous contrast (e.g., gold nanoparticles
targeting breast cancer cells 18).
PAT has been widely used for cancer studies 88, including fundamental research in
carcinogenesis89, cancer detection and staging63, and navigation and evaluation in cancer
treatment 90. In particular, PAT is a perfect tool for label-free imaging of melanoma with
melanin as the intrinsic contrast agent, because melanoma cells have orders of magnitude
stronger optical absorption in the red and NIR spectral regions than red blood cells. OR-
PAM can resolve single melanosomes in melanoma cells 42, AR-PAM can monitor
melanoma development in deep small-animal brains 91, and PACT has successfully imaged
transgenic cancer cells expressing high-level melanin with a tyrosinase-based genetic
Author Manuscript
reporter (Fig. 7c) 70. For cancers that are devoid of high-contrast intrinsic pigments, targeted
nanoparticles or organic dyes can provide exogenous contrast by selectively binding to the
surface receptors of cancer cells 13, 18, 88, 92–95. In addition to the tumor itself,
microenvironmental cancer hallmarks can be imaged. Both high-resolution PAM and deep-
penetration PACT have provided label-free imaging of tumor angiogenesis and tumor
hypoxia, two major cancer hallmarks 13, 96, 97. The abnormal metabolisms of oxygen and
glucose in cancers, also major cancer hallmarks, have been investigated by using PAT with
endogenous and exogenous contrasts, respectively 74, 96.
OUTLOOK
The strong momentum of PAT development is fueled by its increasingly popular applications
in the life sciences and its commercialization for pre-clinical and clinical research. Several
Author Manuscript
typical engineering challenges of PAT implementations and their solutions are summarized
in Box 2.
Nat Methods. Author manuscript; available in PMC 2016 August 11.Wang and Yao Page 11
Box 2
Author Manuscript
Engineering challenges in PAT implementations
As discussed above, when implementing a PAT system for a particular life science study,
the major components, such as the light source, ultrasonic detection system, and scanning
system, should be chosen according to the required imaging performance. Several typical
engineering challenges in PAT implementations deserve attention. For OR-PAM, the
major engineering challenge is the confocal alignment of the focused optical excitation
and acoustic detection. Different optical/acoustic beam combiners have been developed
to achieve confocal alignment with a low numerical aperture (NA) optical focusing
lens 49. Dark-field optical excitation and dark-field acoustic detection have also been
used for confocal alignment 59. However, this challenge remains for reflection-mode OR-
PAM with a high NA (>0.6) optical focusing lens, which has a very limited working
Author Manuscript
distance (Wang and Yao Page 12
efficiency. New imaging methods and mathematical models are needed to better map the
Author Manuscript
optical properties of the tissue. (6) Finally, for PAT of neuronal activities in the deep brain,
novel genetically encodable indicators of action potentials or surrogates (e.g., voltage- or
calcium-sensitive proteins), with large absorption cross-sections in the NIR spectral region,
have to be found in nature or engineered from existing proteins. Along this line, non-
fluorescent NIR phytochromes (e.g., RpBphP) can be potentially engineered as PA imaging
contrasts to report action potentials. The strong acoustic attenuation and aberration by the
skull (especially the side skull) is another challenge for single-neuron PAT of the deep brain.
A potential solution is to integrate PAT with X-ray CT, which provides data for accurate 3D
modeling of the skull for acoustic correction.
In conclusion, with its rich optical absorption contrast and high ultrasonic scalability, PAT
provides a comprehensive toolbox for the life sciences, complementing other imaging
methods in its contrast mechanism, spatial-temporal resolution, and penetration. We expect
Author Manuscript
PAT to find more high-impact applications in biomedical research.
Acknowledgments
We thank James Ballard for reading the manuscript and Ruiying Zhang for preparing the figures. This work was
sponsored by the US National Institutes of Health grants DP1 EB016986 (NIH Director’s Pioneer Award), R01
CA186567 (NIH Director’s Transformative Research Award), and U01 NS090579 (BRAIN Initiative), all to L.V.W.
References
1. Bell AG. Upon the production and reproduction of sound by light. American Journal of Science.
1880; 20:305–324.
2. Bowen, T. Radiation-induced thermoacoustic imaging. US Patent. 4,385,634. 1983.
3. Oraevsky, AA.; Jacques, SL.; Tittel, FK. Laser-Tissue Interaction IV. Jacques, SL.; Katzir, A.,
Author Manuscript
editors. Vol. 1882. SPIE; San Jose, CA: 1993. p. 86-101.
4. Kruger RA, Liu PY. Photoacoustic Ultrasound - Pulse Production and Detection in 0.5-Percent
Liposyn. Med Phys. 1994; 21:1179–1184. [PubMed: 7968851]
5. Kruger RA. Photoacoustic Ultrasound. Med Phys. 1994; 21:127–131. [PubMed: 8164577]
6. Oraevsky, AA.; Esenaliev, RO.; Jacques, SL.; Thomsen, SL.; Tittel, FK. ptical Tomography, Photon
Migration, and Spectroscopy of Tissue and Model Media. In: Chance, B.; Alfano, RR., editors.
Theory, Human Studies, and Instrumentation. Vol. 2389. SPIE; San Jose, CA: 1995. p. 198-208.
7. Esenaliev, RO.; Oraevsky, AA.; Jacques, SL.; Tittel, FK. Biomedical Sensing, Imaging, and
Tracking Technologies I. Lieberman, RA.; Podbielska, H.; Vo-Dinh, T., editors. Vol. 2676. SPIE;
San Jose, CA: 1996. p. 84-90.
8. Kruger RA, Liu PY, Fang YR, Appledorn CR. Photoacoustic Ultrasound (Paus) - Reconstruction
Tomography. Med Phys. 1995; 22:1605–1609. [PubMed: 8551984]
9. Hoelen CGA, de Mul FFM, Pongers R, Dekker A. Three-dimensional photoacoustic imaging of
blood vessels in tissue. Opt Lett. 1998; 23:648–650. [PubMed: 18084605]
Author Manuscript
10. Wang LV, Zhao X, Sun H, Ku G. Microwave-induced acoustic imaging of biological tissues.
Review of Scientific Instruments. 1999; 70:3744–3748.
11. Wang XD, et al. Noninvasive laser-induced photoacoustic tomography for structural and functional
in vivo imaging of the brain. Nat Biotechnol. 2003; 21:803–806. [PubMed: 12808463]
12. Zhang HF, Maslov K, Stoica G, Wang LHV. Functional photoacoustic microscopy for high-
resolution and noninvasive in vivo imaging. Nat Biotechnol. 2006; 24:848–851. [PubMed:
16823374]
13. Li M, et al. Simultaneous Molecular and Hypoxia Imaging of Brain Tumors In Vivo Using
Spectroscopic Photoacoustic Tomography. Proceedings of the IEEE. 2008; 96:481–489.
Nat Methods. Author manuscript; available in PMC 2016 August 11.Wang and Yao Page 13
14. De La Zerda A, et al. Carbon nanotubes as photoacoustic molecular imaging agents in living mice.
Nat Nanotechnol. 2008; 3:557–562. [PubMed: 18772918]
Author Manuscript
15. Razansky D, et al. Multispectral opto-acoustic tomography of deep-seated fluorescent proteins in
vivo. Nat Photonics. 2009; 3:412–417.
16. Wang HW, et al. Label-Free Bond-Selective Imaging by Listening to Vibrationally Excited
Molecules. Phys Rev Lett. 2011; 106:238106. [PubMed: 21770549]
17. Yakovlev VV, et al. Stimulated Raman photoacoustic imaging. P Natl Acad Sci USA. 2010;
107:20335–20339.
18. de la Zerda A, Kim JW, Galanzha EI, Gambhir SS, Zharov VP. Advanced contrast nanoagents for
photoacoustic molecular imaging, cytometry, blood test and photothermal theranostics. Contrast
Media Mol I. 2011; 6:346–369.
19. Zackrisson S, van de Ven SMWY, Gambhir SS. Light In and Sound Out: Emerging Translational
Strategies for Photoacoustic Imaging. Cancer Res. 2014; 74:979–1004. [PubMed: 24514041]
20. Burgholzer P, Grun H, Sonnleitner A. Sounding out fluorescent proteins. Nat Photonics. 2009;
3:378–379.
21. Yang JM, et al. Simultaneous functional photoacoustic and ultrasonic endoscopy of internal organs
Author Manuscript
in vivo. Nat Med. 2012; 18:1297–1302. [PubMed: 22797808]
22. Bai XS, et al. Intravascular Optical-Resolution Photoacoustic Tomography with a 1.1 mm
Diameter Catheter. Plos One. 2014; 9:e92463. [PubMed: 24651256]
23. Jansen K, van der Steen AFW, van Beusekom HMM, Oosterhuis JW, van Soest G. Intravascular
photoacoustic imaging of human coronary atherosclerosis. Opt Lett. 2011; 36:597–599. [PubMed:
21368919]
24. Zhang, EZ.; Beard, PC. Photons Plus Ultrasound: Imaging and Sensing 2011. Vol. 7899. SPIE;
2011. p. 78991Fp. 78991F-78996.
25. Kim J, Lee D, Jung U, Kim C. Photoacoustic imaging platforms for multimodal imaging.
Ultrasonography. 2015; 34:88–97. [PubMed: 25754364]
26. Vionnet L, et al. 24-MHz Scanner for Optoacoustic Imaging of Skin and Burn. Medical Imaging,
IEEE Transactions on. 2014; 33:535–545.
27. Burton NC, et al. Multispectral Opto-acoustic Tomography (MSOT) of the Brain and Glioblastoma
Characterization. Neuroimage. 2013; 65:522–528. [PubMed: 23026761]
Author Manuscript
28. Dean-Ben XL, Razansky D. Adding fifth dimension to optoacoustic imaging: volumetric time-
resolved spectrally enriched tomography. Light-Sci Appl. 2014; 3:e137.
29. Kruger RA, Lam RB, Reinecke DR, Del Rio SP, Doyle RP. Photoacoustic angiography of the
breast. Med Phys. 2010; 37:6096–6100. [PubMed: 21158321]
30. Zhang E, Laufer J, Beard P. Backward-mode multiwavelength photoacoustic scanner using a planar
Fabry-Perot polymer film ultrasound sensor for high-resolution three-dimensional imaging of
biological tissues. Appl Optics. 2008; 47:561–577.
31. Brecht HP, et al. Whole-body three-dimensional optoacoustic tomography system for small
animals. J Biomed Opt. 2009; 14:064007. [PubMed: 20059245]
32. Xu MH, Wang LHV. Time-domain reconstruction for thermoacoustic tomography in a spherical
geometry. Ieee T Med Imaging. 2002; 21:814–822.
33. Treeby BE, Cox BT. k-Wave: MATLAB toolbox for the simulation and reconstruction of
photoacoustic wave fields. J Biomed Opt. 2010; 15:021314. [PubMed: 20459236]
34. Yao J, Xia J, Wang LV. Multiscale Functional and Molecular Photoacoustic Tomography.
Author Manuscript
Ultrasonic Imaging. 2016; 38:44–62. [PubMed: 25933617]
35. Wang LHV, Hu S. Photoacoustic Tomography: In Vivo Imaging from Organelles to Organs.
Science. 2012; 335:1458–1462. [PubMed: 22442475]
36. Wang LD, Maslov K, Xing WX, Garcia-Uribe A, Wang LHV. Video-rate functional photoacoustic
microscopy at depths. J Biomed Opt. 2012; 17:106007. [PubMed: 23224006]
37. Jeon M, Kim J, Kim C. Multiplane spectroscopic whole-body photoacoustic imaging of small
animals in vivo. Med Biol Eng Comput. 2014:1–12.
38. Mitcham T, Dextraze K, Taghavi H, Melancon M, Bouchard R. Photoacoustic imaging driven by
an interstitial irradiation source. Photoacoustics. 2015; 3:45–54. [PubMed: 26236640]
Nat Methods. Author manuscript; available in PMC 2016 August 11.Wang and Yao Page 14
39. Horstmeyer R, Ruan HW, Yang CH. Guidestar-assisted wavefront-shaping methods for focusing
light into biological tissue. Nat Photonics. 2015; 9:563–571. [PubMed: 27293480]
Author Manuscript
40. Galanzha EI, Shashkov EV, Spring PM, Suen JY, Zharov VP. In vivo, Noninvasive, Label-Free
Detection and Eradication of Circulating Metastatic Melanoma Cells Using Two-Color
Photoacoustic Flow Cytometry with a Diode Laser. Cancer Res. 2009; 69:7926–7934. [PubMed:
19826056]
41. Strohm EM, Berndl ES, Kolios MC. High frequency label-free photoacoustic microscopy of single
cells. Photoacoustics. 2013; 1:49–53. [PubMed: 25302149]
42. Danielli A, et al. Label-free photoacoustic nanoscopy. J Biomed Opt. 2014; 19:086006. [PubMed:
25104412]
43. Goy AS, Fleischer JW. Resolution enhancement in nonlinear photoacoustic imaging. Applied
Physics Letters. 2015; 107:211102.
44. Lee SY, et al. In vivo sub-femtoliter resolution photoacoustic microscopy with higher frame rates.
Scientific reports. 2015; 5:15421. [PubMed: 26487363]
45. Nedosekin DA, Galanzha EI, Dervishi E, Biris AS, Zharov VP. Super-resolution nonlinear
photothermal microscopy. Small. 2014; 10:135–142. [PubMed: 23864531]
Author Manuscript
46. Wang L, Zhang C, Wang LV. Grueneisen relaxation photoacoustic microscopy. Phys Rev Lett.
2014; 113:174301. [PubMed: 25379919]
47. Yao JJ, Wang LD, Li CY, Zhang C, Wang LHV. Photoimprint Photoacoustic Microscopy for Three-
Dimensional Label-Free Subdiffraction Imaging. Phys Rev Lett. 2014; 112:014302. [PubMed:
24483902]
48. Yao J, et al. Multiscale photoacoustic tomography using reversibly switchable bacterial
phytochrome as a near-infrared photochromic probe. Nature methods. 2016; 13:67–73. [PubMed:
26550774]
49. Yao JJ, Wang LHV. Photoacoustic microscopy. Laser Photonics Rev. 2013; 7:758–778.
50. Liang JY, et al. Random-access optical-resolution photoacoustic microscopy using a digital
micromirror device. Opt Lett. 2013; 38:2683–2686. [PubMed: 23903111]
51. Song W, et al. Integrating photoacoustic ophthalmoscopy with scanning laser ophthalmoscopy,
optical coherence tomography, and fluorescein angiography for a multimodal retinal imaging
platform. J Biomed Opt. 2012; 17:061206. [PubMed: 22734736]
Author Manuscript
52. Kim JY, Lee C, Park K, Lim G, Kim C. Fast optical-resolution photoacoustic microscopy using a
2-axis water-proofing MEMS scanner. Scientific reports. 2015; 5:7932. [PubMed: 25604654]
53. Yao J, et al. High-speed label-free functional photoacoustic microscopy of mouse brain in action.
Nature methods. 2015; 12:407–410. [PubMed: 25822799]
54. America, L.I.o. ANSI Z136.1–2007. American National Standard Institute; New York: 2007.
55. Nuster R, Zangerl G, Haltmeier M, Paltauf G. Full field detection in photoacoustic tomography.
Opt Express. 2010; 18:6288–6299. [PubMed: 20389652]
56. Lamont M, Beard PC. 2D imaging of ultrasound fields using CCD array to map output of Fabry-
Perot polymer film sensor. Electron Lett. 2006; 42:187–189.
57. Luke GP, Yeager D, Emelianov SY. Biomedical applications of photoacoustic imaging with
exogenous contrast agents. Ann Biomed Eng. 2012; 40:422–437. [PubMed: 22048668]
58. Beard PC. Review on PAI probes. Nature methods. 2016 To be publised along with our Review.
59. Yao DK, Chen RM, Maslov K, Zhou QF, Wang LV. Optimal ultraviolet wavelength for in vivo
photoacoustic imaging of cell nuclei. J Biomed Opt. 2012; 17:056004. [PubMed: 22612127]
Author Manuscript
60. Xu Z, Zhu QI, Wang LHV. In vivo photoacoustic tomography of mouse cerebral edema induced by
cold injury. J Biomed Opt. 2011; 16:066020. [PubMed: 21721821]
61. Akers WJ, et al. Multimodal sentinel lymph node mapping with single-photon emission computed
tomography (SPECT)/computed tomography (CT) and photoacoustic tomography. Transl Res.
2012; 159:175–181. [PubMed: 22340767]
62. Krumholz A, Shcherbakova DM, Xia J, Wang LV, Verkhusha VV. Multicontrast photoacoustic in
vivo imaging using near-infrared fluorescent proteins. Scientific reports. 2014; 4:3939. [PubMed:
24487319]
Nat Methods. Author manuscript; available in PMC 2016 August 11.Wang and Yao Page 15
63. Kim JW, Galanzha EI, Shashkov EV, Moon HM, Zharov VP. Golden carbon nanotubes as
multimodal photoacoustic and photothermal high-contrast molecular agents. Nat Nanotechnol.
Author Manuscript
2009; 4:688–694. [PubMed: 19809462]
64. Cox B, Laufer JG, Arridge SR, Beard PC. Quantitative spectroscopic photoacoustic imaging: a
review. J Biomed Opt. 2012; 17:061202. [PubMed: 22734732]
65. Tzoumas S, Nunes A, Deliolanis NC, Ntziachristos V. Effects of multispectral excitation on the
sensitivity of molecular optoacoustic imaging. J Biophotonics. 2015; 8:629–637. [PubMed:
25284265]
66. Taruttis A, Morscher S, Burton NC, Razansky D, Ntziachristos V. Fast multispectral optoacoustic
tomography (MSOT) for dynamic imaging of pharmacokinetics and biodistribution in multiple
organs. Plos One. 2012; 7:e30491. [PubMed: 22295087]
67. Deliolanis NC, et al. Deep-Tissue Reporter-Gene Imaging with Fluorescence and Optoacoustic
Tomography: A Performance Overview. Mol Imaging Biol. 2014
68. Filonov GS, et al. Deep-Tissue Photoacoustic Tomography of a Genetically Encoded Near-Infrared
Fluorescent Probe. Angew Chem Int Edit. 2012; 51:1448–1451.
69. Galanzha EI, et al. Photoacoustic and photothermal cytometry using photoswitchable proteins and
Author Manuscript
nanoparticles with ultrasharp resonances. J Biophotonics. 2013; 8:81–93. [PubMed: 24259123]
70. Jathoul AP, et al. Deep in vivo photoacoustic imaging of mammalian tissues using a tyrosinase-
based genetic reporter. Nat Photonics. 2015; 9:239–246.
71. Laufer J, Jathoul A, Pule M, Beard P. In vitro characterization of genetically expressed absorbing
proteins using photoacoustic spectroscopy. Biomed Opt Express. 2013; 4:2477–2490. [PubMed:
24298408]
72. Levi J, et al. Design, Synthesis, and Imaging of an Activatable Photoacoustic Probe. J Am Chem
Soc. 2010; 132:11264–11269. [PubMed: 20698693]
73. Laufer J, Zhang E, Raivich G, Beard P. Three-dimensional noninvasive imaging of the vasculature
in the mouse brain using a high resolution photoacoustic scanner. Appl Optics. 2009; 48:D299–
D306.
74. Yao J, et al. Noninvasive photoacoustic computed tomography of mouse brain metabolism in vivo.
Neuroimage. 2013; 64:257–266. [PubMed: 22940116]
75. Nasiriavanaki M, et al. High-resolution photoacoustic tomography of resting-state functional
Author Manuscript
connectivity in the mouse brain. Proc Natl Acad Sci U S A. 2014; 111:21–26. [PubMed:
24367107]
76. Jo J, Yang X. Functional photoacoustic imaging to observe regional brain activation induced by
cocaine hydrochloride. J Biomed Opt. 2011; 16:090506. [PubMed: 21950909]
77. Liao LD, et al. Imaging brain hemodynamic changes during rat forepaw electrical stimulation
using functional photoacoustic microscopy. Neuroimage. 2010; 52:562–570. [PubMed: 20362680]
78. Pilatou MC, Marani E, de Mul FF, Steenbergen W. Photoacoustic imaging of brain perfusion on
albino rats by using evans blue as contrast agent. Arch Physiol Biochem. 2003; 111:389–397.
[PubMed: 15764079]
79. Yao J, Wang LV. Photoacoustic Brain Imaging: from Microscopic to Macroscopic Scales.
Neurophotonics. 2014; 1:011003.
80. Deng ZL, Wang Z, Yang XQ, Luo QM, Gong H. In vivo imaging of hemodynamics and oxygen
metabolism in acute focal cerebral ischemic rats with laser speckle imaging and functional
photoacoustic microscopy. J Biomed Opt. 2012; 17:081415. [PubMed: 23224176]
81. Tsytsarev V, Rao B, Maslov KI, Li L, Wang LHV. Photoacoustic and optical coherence
Author Manuscript
tomography of epilepsy with high temporal and spatial resolution and dual optical contrasts. J
Neurosci Meth. 2013; 216:142–145.
82. Tang JB, et al. Noninvasive high-speed photoacoustic tomography of cerebral hemodynamics in
awake-moving rats. J Cerebr Blood F Met. 2015; 35:1224–1232.
83. Strohm EM, Moore MJ, Kolios MC. Single cell photoacoustic microscopy: a review. Selected
Topics in Quantum Electronics, IEEE Journal of. 2015; 1
84. Bost W, et al. High frequency optoacoustic microscopy. Conf Proc IEEE Eng Med Biol Soc. 2009;
2009:5883–5886. [PubMed: 19964880]
Nat Methods. Author manuscript; available in PMC 2016 August 11.Wang and Yao Page 16
85. Strohm EM, Berndl ESL, Kolios MC. Probing Red Blood Cell Morphology Using High-Frequency
Photoacoustics. Biophysical Journal. 2013; 105:59–67. [PubMed: 23823224]
Author Manuscript
86. Wang LD, Maslov K, Wang LHV. Single-cell label-free photoacoustic flowoxigraphy in vivo. P
Natl Acad Sci USA. 2013; 110:5759–5764.
87. He G, Xu D, Qin H, Yang S, Xing D. In vivo cell characteristic extraction and identification by
photoacoustic flow cytography. Biomed Opt Express. 2015; 6:3748–3756. [PubMed: 26504626]
88. Wilson KE, Wang TY, Willmann JK. Acoustic and Photoacoustic Molecular Imaging of Cancer. J
Nucl Med. 2013; 54:1851–1854. [PubMed: 24187042]
89. Herzog E, et al. Optical Imaging of Cancer Heterogeneity with Multispectral Optoacoustic
Tomography. Radiology. 2012; 263:461–468. [PubMed: 22517960]
90. Laufer J, et al. In vivo preclinical photoacoustic imaging of tumor vasculature development and
therapy. J Biomed Opt. 2012; 17:056016. [PubMed: 22612139]
91. Staley J, et al. Growth of melanoma brain tumors monitored by photoacoustic microscopy. J
Biomed Opt. 2010; 15:040510. [PubMed: 20799777]
92. Brannon-Peppas L, Blanchette JO. Nanoparticle and targeted systems for cancer therapy. Adv Drug
Deliv Rev. 2004; 56:1649–1659. [PubMed: 15350294]
Author Manuscript
93. Mallidi S, Luke GP, Emelianov S. Photoacoustic imaging in cancer detection, diagnosis, and
treatment guidance. Trends Biotechnol. 2011; 29:213–221. [PubMed: 21324541]
94. Ray A, et al. Targeted blue nanoparticles as photoacoustic contrast agent for brain tumor
delineation. Nano Res. 2011; 4:1163–1173.
95. Levi J, et al. Molecular Photoacoustic Imaging of Follicular Thyroid Carcinoma. Clin Cancer Res.
2013; 19:1494–1502. [PubMed: 23349314]
96. Yao J, Maslov KI, Zhang Y, Xia Y, Wang LV. Label-free oxygen-metabolic photoacoustic
microscopy in vivo. J Biomed Opt. 2011; 16:076003. [PubMed: 21806264]
97. Shao Q, et al. In vivo photoacoustic lifetime imaging of tumor hypoxia in small animals. J Biomed
Opt. 2013; 18:076019. [PubMed: 23877772]
98. Zhang C, Maslov K, Wang LHV. Subwavelength-resolution label-free photoacoustic microscopy of
optical absorption in vivo. Opt Lett. 2010; 35:3195–3197. [PubMed: 20890331]
99. Xia J, et al. Whole-body ring-shaped confocal photoacoustic computed tomography of small
animals in vivo. J Biomed Opt. 2012; 17:050506. [PubMed: 22612121]
Author Manuscript
100. Erpelding TN, et al. Sentinel Lymph Nodes in the Rat: Noninvasive Photoacoustic and US
Imaging with a Clinical US System. Radiology. 2010; 256:102–110. [PubMed: 20574088]
101. Taruttis A, Ntziachristos V. Advances in real-time multispectral optoacoustic imaging and its
applications. Nat Photonics. 2015; 9:219–227.
102. Daoudi K, et al. Handheld probe integrating laser diode and ultrasound transducer array for
ultrasound/photoacoustic dual modality imaging. Opt Express. 2014; 22:26365–26374. [PubMed:
25401669]
103. Allen TJ, Beard PC. High power visible light emitting diodes as pulsed excitation sources for
biomedical photoacoustics. Biomed Opt Express. 2016; 7:1260–1270. [PubMed: 27446652]
104. Li H, Dong B, Zhang Z, Zhang HF, Sun C. A transparent broadband ultrasonic detector based on
an optical micro-ring resonator for photoacoustic microscopy. Sci Rep. 2014; 4:4496. [PubMed:
24675547]
105. Favazza, CP.; Guo, Z.; Maslov, K.; Wang, LV. Photons Plus Ultrasound: Imaging and Sensing
2011. Vol. 7899. San Francisco, California, USA: 2011. p. 78990O-78996.
Author Manuscript
106. Cho Y, et al. Handheld photoacoustic tomography probe built using optical-fiber parallel acoustic
delay lines. J Biomed Opt. 2014; 19:086007. [PubMed: 25104413]
Nat Methods. Author manuscript; available in PMC 2016 August 11.Wang and Yao Page 17
Author Manuscript
Author Manuscript
Figure 1. Principles of photoacoustic tomography (PAT)
(a) Jablonski diagram, illustrating the photon energy transfer in one-photon fluorescence
microscopy, two-photon fluorescence microscopy, and PAT. The most common electronic
absorption in the visible and ultraviolet spectral region is shown. (b) Imaging principle of
PAT.
Author Manuscript
Author Manuscript
Nat Methods. Author manuscript; available in PMC 2016 August 11.Wang and Yao Page 18
Author Manuscript
Author Manuscript
Author Manuscript
Figure 2. Representative implementations of PAT
(a) Transmission-mode OR-PAM system, where the ultrasonic transducer (UT) and the
water-immersion focusing lens are on opposite sides of the object 98. Note that the focusing
lens has a numerical aperture (NA) of 1.2 and a working distance of only ~200 μm. (b)
Reflection-mode OR-PAM system with an optical-acoustic combiner that transmits light but
reflects sound 96. SOL, silicone oil layer sandwiched between two prisms. (c) AR-PAM
system with a dark-field illumination 12. The laser light is only weakly focused, with the UT
in the dark cone. (d) PACT system with a ring-shaped ultrasonic transducer array (UTA) 99.
The laser beam is expanded and homogenized by a diffuser to provide wide-field
illumination. (e) PACT system with a linear UTA 100. The excitation light is delivered
through a fused-end, bifurcated fiber bundle that flanks both sides of the UTA. (f) PACT
system with a hemispherically shaped UTA 29. The UTA is rotated around the object to be
Author Manuscript
imaged to provide dense spatial sampling for 3D imaging. (g) PACT system with a 2D
Fabry-Perot interferometer as the acoustic sensor 70. The PA waves are recorded by raster
scanning a probing laser beam over the surface of the interferometer. (h) Side-viewing
intravascular PA catheter with an outer diameter of 1.25 mm, including the protective sheath
in which the catheter rotates 23. Note that the acoustic coupling medium (typically water or
ultrasound gel) is not shown in the schematics.
Nat Methods. Author manuscript; available in PMC 2016 August 11.You can also read