Development of a Flexible Coupling Framework for Coastal Inundation Studies.
←
→
Page content transcription
If your browser does not render page correctly, please read the page content below

Development of a Flexible Coupling Framework for
                                                              Coastal Inundation Studies.

                                                  Saeed Moghimia,b,∗, Andre Van der Westhuysenc,∗∗, Ali Abdolalic,∗∗, Edward
                                                     Myersa,∗∗, Sergey Vinogradova,∗∗, Zaizhong Mac,∗∗, Fei Liud,∗∗, Avichal
arXiv:2003.12652v1 [physics.ao-ph] 27 Mar 2020

                                                                        Mehrac,∗∗, Nicole Kurkowskie,∗∗
                                                   a NOAA    Coast Survey Development Laboratory, National Ocean Service, Silver Spring,
                                                                                             USA.
                                                              b University Corporation for Atmospheric Research, Boulder, USA.
                                                          c NOAA Center for Weather and Climate Prediction, College Park, USA.
                                                                  d NOAA Earth System Research Laboratory, Boulder, USA.
                                                         e NOAA Office of Science and Technology Integration, Silver Spring, USA.

                                                 Abstract

                                                 To enable flexible model coupling in coastal inundation studies, a coupling
                                                 framework based on ESMF/NUOPC technology under a common modeling frame-
                                                 work called the NOAA Environmental Modeling System (NEMS) was developed.
                                                 The framework is essentially a ‘software wrapper around atmospheric, wave and
                                                 storm surge models that enables its components communicate seamlessly, and
                                                 efficiently run in massively parallel environments. We implemented the coupled
                                                 application including ADCIRC and unstructured WWAVEWATCHIII caps as well as
                                                 NUOPC compliant caps to read Hurricane Weather Research and Forecasting

                                                   ∗ Corresponding   author (Saeed Moghimi; Email: Saeed.Moghimi@noaa.gov)
                                                  ∗∗ Co-authors     contribution:
                                                 1. Saeed Moghimi: Responsible for development of the ADCIRC, WW3-data and HWRF-
                                                 data Caps and developing the coupled application. Writing the body of the manuscript and
                                                 plotting figures.
                                                 2. Andre Van der Westhuysen: Responsible for unstructured WW3 cap development. In-
                                                 clusion of the WW3 cap in the coupled application and running full coupled cases; manuscript
                                                 preparation and analysis of the results.
                                                 3. Ali Abdolali: Responsible for WW3 cap development and running stand alone wave
                                                 model, plotting wind and wave related parts of manuscripts, manuscript preparation and
                                                 analysis of the results.
                                                 4. Edward Myers: Scientific support, discussion and project management;
                                                 5. Sergey Vinogradov: Scientific support and discussions.
                                                 6. Zaizhong Ma: Responsible for wind field modeling using HWRF.
                                                 7. Fei Liu: Support for ESMF/NUOPC cap development.
                                                 8. Avichal Mehra: Scientific support and project management.
                                                 9. Nicole Kurkowski: Scientific support and project management.

                                                 Preprint submitted to To be decided                                         March 31, 2020
Model (HWRF) generated forcing fields. We validated the coupled application for
a laboratory test and a full scale inundation case of the Hurricane Ike, 2008,
on a high resolution mesh covering the whole US Atlantic coast. We showed
that how nonlinear interaction between surface waves and total water level re-
sults in significant enhancements and progression of the inundation and wave
action into land in and around the hurricane landfall region. We also presented
that how the maximum wave setup and maximum surge regions may happen at
the various time and locations depending on the storm track and geographical
properties of the landfall area.
Keywords: wave-current interaction, tidal inlet, river plume, wind waves,
three-dimensional circulation, wave breaking

1. Introduction

   To establish a coastal flooding modeling system, several model components
based on the target geographical region need to be coupled. To accurately simu-
late the total water level in a tropical hurricane land-falling inundation study, a
dynamically coupled system of numerical models including storm surge, surface
waves, inland river flooding and numerical weather prediction are necessary.
On top of that based on the geographical location other model components
may need to be employed. For instance, to setup an efficient coastal flooding
prediction system for Alaska region, inclusion of a sea-ice model is essential.
   In recent years, Earth System Models were proven to be invaluable tools that
enabled us to better understand and more accurately predict our environment.
Each system includes a coupled applications that consists of several model com-
ponents to represent relevant physical processes. The model components are
expected to interact with each other similar to what takes place in nature.
   There are several Earth System Model software flavors that enable model
components to communicate by importing and exporting data (Jacob et al.,
2005; Valcke et al., 2012; Hill et al., 2004). The Earth System Modelling Frame-
work (ESMF) has been utilized to develop several earth system coupled applica-

                                        2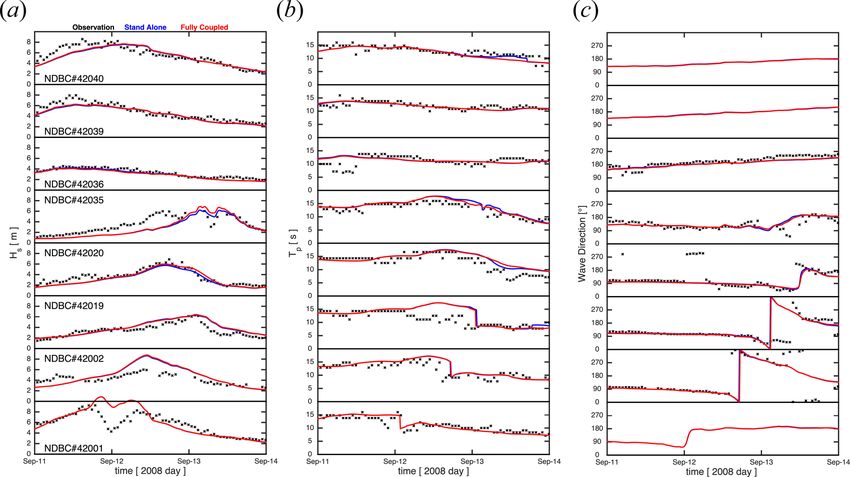
tions worldwide (e.g. Warner et al., 2008; Moghimi et al., 2012; Lemmen et al.,
2017). To increase ESMF interoperability, the National Unified Operational Pre-
diction Capability (NUOPC) consortium developed a layer consisting of a set of
generic components (Theurich et al., 2016). NUOPC layer is a software wrap
around ESMF and was developed collaboratively by several research and opera-
tional centers. The primary objectives behind NUOPC design are to be reusable,
extensible and portable framework for ESM coupling.
   The NOAA Environmental Modeling System (NEMS) is a coupled modeling
infrastructure designed to address increasing needs for prediction of the earth
environment at a range of time scales. NEMS includes several external model
components that have a primary source code outside NOAA. Therefore, NOAA
only needs to maintain and develop the coupling interfaces (so-called model
caps) of the given modeling component. In turn, the NEMS ecosystem allows
connecting various combinations of model components into a number of different
coupled model applications to address specific environmental phenomena at
specific time scales.
   The present research goals are to develop a flexible and generic coupling
between ADvanced CIRCulation model (ADCIRC; Luettich Jr et al., 1992) and
WAVEWATCH III (WW3; Tolman et al., 2009) via their respective NUOPC caps, and
to provide an infrastructure to make future development and inclusion of var-
ious model components, such as river and inland flooding coupling, seamlessly
possible. The current development of the NUOPC caps provides the possibility
to perform dynamical coupling of ADCIRC and the unstructured version of WW3,
as well as various atmospheric models ATM. The cap developed for ADCIRC is
capable of importing atmospheric forcing and surface wave fields, and exporting
water surface elevation and current velocity to the connected model components.
Conversely, the cap developed for unstructured WW3 imports atmospheric forc-
ing, water levels and current, and exports the wave radiation stresses required
to force ADCIRC.
   The first application of this new coupled system is the so-called Named
Storm Event Model (NSEM), a high-fidelity model for hindcasting coastal inun-

                                      3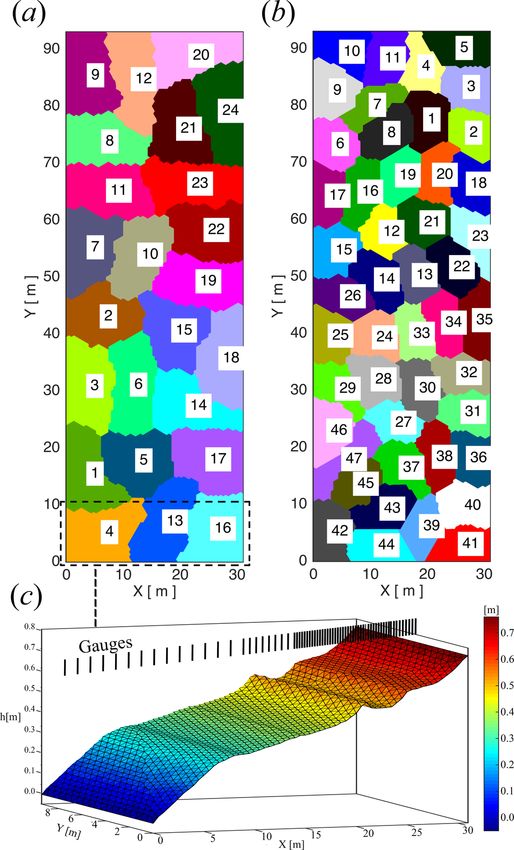
dation and total water level. It is being developed to meet the requirements
of the NOAA’s Consumer Option for an Alternative System to Allocate Losses
(COASTAL) Act of 2012. This modeling system includes ADCIRC as the hydro-
dynamic component, WW3 as the wave model, the Hurricane Weather Research
and Forecasting Model (HWRF) as the atmospheric component (Tallapragada
et al., 2014), and in future the National Water Model (NWM) as the inland hy-
drological component (Gochis et al., 2013), see Fig. 1.
   The structure of this paper is as follows. First, we describe the envisioned
design of the NEMS ADCIRC-WW3 coupled application and the methodology. Then
a detailed description of the ADCIRC cap implementation and available coupling
options is given. This is followed by a similar description of the WW3 cap. Sub-
sequently, we present the results of the coupled system. Finally we present ver-
ification of the coupled ADCIRC-WW3 application for the laboratory flume case of
Boer (1996), as well as a full scale storm surge inundation event during Hurri-
cane Ike, 2008 in the US Gulf of Mexico.

2. Structure of the coupled application

   A typical NUOPC application includes a number of generic components that
provide an interface to the underlying ESMF infrastructure for generating and
operating a coupled application in a fairly straightforward and seamless manner.
The generic components are defined as follows:

   • A Driver manages all the components to initialize, run, finalize and keep
     track of time for exchanging information among model components.

   • Connectors are used to execute field matching, grid remapping and data
     redistribution among model components.

   • A Model (cap) wraps each model component code (e.g. ADCIRC and WW3) to
     provide a generic interface and standard metadata suitable to be plugged
     into the Driver, and form a multi-model coupled application.

                                       4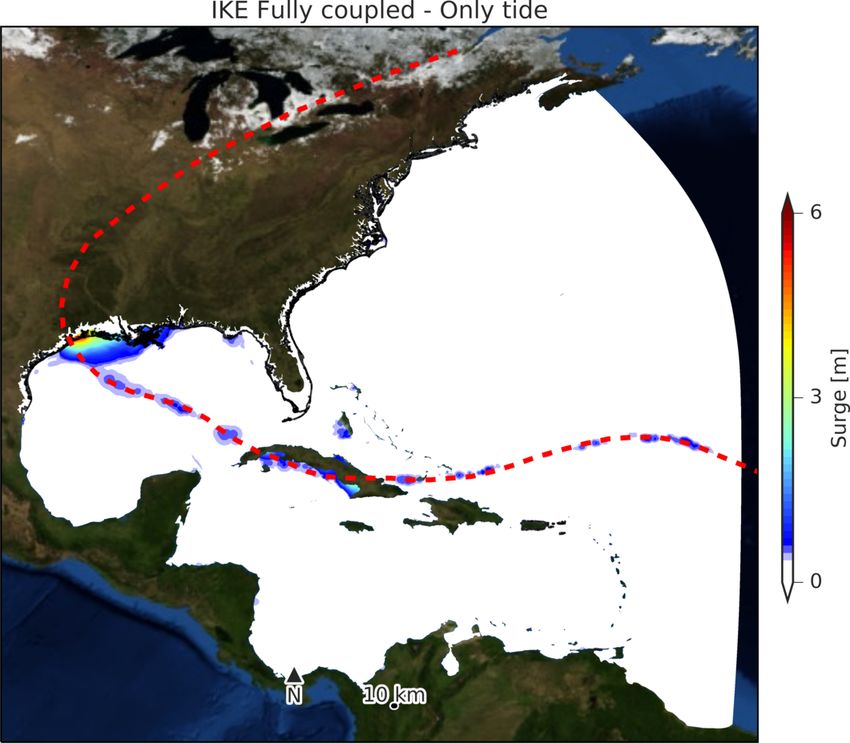
• An optional Mediator wraps custom coupling code to calculate quantities
     which includes data from several model components or requires operations
     such as time averaging.

   The system includes methods and utilities for time management, error han-
dling, high performance inputs/outputs (I/O), grid remapping and field interpo-
lation. Since NUOPC is a layer around ESMF library, function calls to both NUOPC
and ESMF are possible and sometimes are necessary.
   In this research, we developed a NUOPC application that includes a driver,
three NUOPC enabled model components and four connectors. The components
are not allowed to directly access each other’s data. The only way the data
moves in or out of a component is via instances of an ESMF state class. The
state is a container that wraps native data and also includes a metadata to let
the other components know about name, coordinates and decomposition of the
actual packed data.
   The driver component accesses ADCIRC, WW3 and ATMesh model components
via their SetServices() methods. It reads basic information for how to initial-
ize and run the model components from a configuration text file (Fig. 2). The
configuration file contains information about name of the model components,
number of processes to be associated to each model component, the coupling
time intervals, and the order of data exchange among the components. The
driver also initializes the number of connectors by providing the name of the
sending and receiving model components. Therefore, for a dynamical two-way
coupling between two model components, two connectors are required.
   The connector component initializes at the run time by matching the list of
available import and export fields advertised by the model components. The
connector establishes the connection based on matched import and export fields.
The connector also has access to the domain decomposition and computational
domain discretization of the connected model components. It will generate a
remapping and necessary weight matrices for interpolation of the fields among
model components at the initialization phase. In other words, the connector

                                       5
Figure 1: Design of the coupled application for coastal flooding inundation studies (NSEM).
All model configurations and results are pre-decisional and for official use only.

receives exported data in the form of an ESMF state in the native grid or mesh
from the exported model component and passes it to the importing model com-
ponents in its own native grid or mesh definition. This remapping facility allows
the coupled system the freedom to use different meshes for, say, the circulation
and wave modeling components, and/or different domain decompositions. This
is useful in cases where the wave model component requires a different mesh op-
timization to resolve its distinct physics, or more computational cores for load
balancing.
    The ATMesh cap was developed as a placeholder interface for a full live atmo-
spheric model, which was not included in our NSEM application due to scope
limitations. This so-called data cap reads weather prediction outputs (from a
NetCDF data file), initialize required NUOPC/ESMF objects and provide requested
data and information to ADCIRC and WW3 caps via the NOUPC/ESMF backbone.
The NWM hydrological model component and its associated connectors are not
yet implemented (Fig. 1).

3. ADCIRC model

    The ADvanced CIRCulation model (ADCIRC) is a finite element hydrody-
namic community model originally developed by Luettich Jr et al. (1992). ADCIRC
is undergoing continuous development by groups of scientists and engineers. Its

                                              6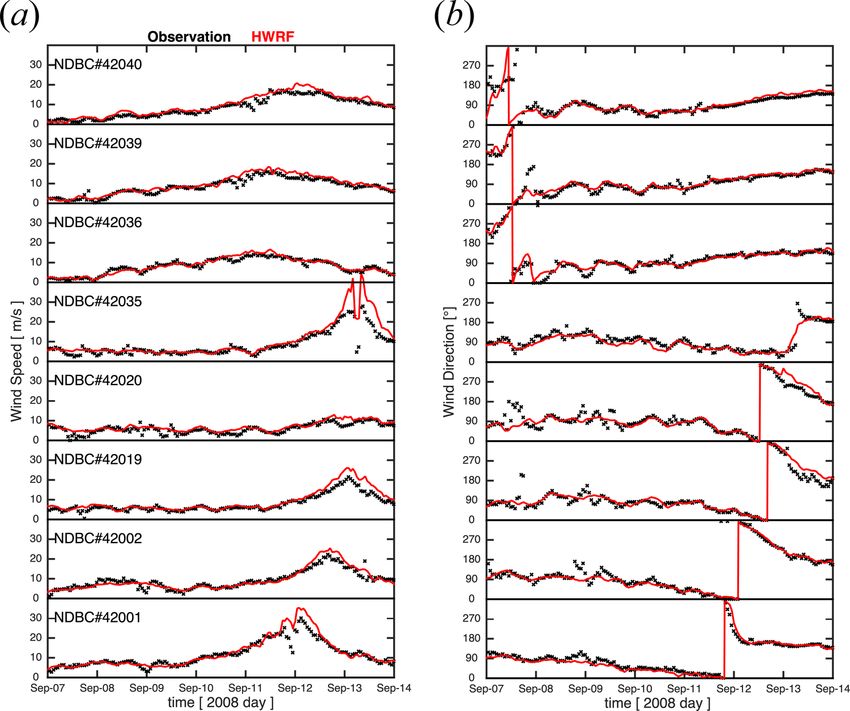
natural finite element unstructured mesh capability, and several modules specif-
ically addressing various aspects of the coastal flooding and tropical cyclone
forcing, make it one of the best tools available for coastal inundation stud-
ies. ADCIRC operates in either two-dimensional depth-integrated (2D) depth-
averaged (barotropic) and three-dimensional (baroclinic) modes. In the 2D
mode, it solves equations for both water surface elevation and the depth-averaged
velocity fields. For more details about ADCIRC governing equations, numerical
methods and wave forcing implementation please see (Luettich Jr et al., 1992;
Dietrich et al., 2011).
   ADCIRC is written in modular FORTRAN and supports parallel execution on
massive supercomputers using MPI architecture. The code structure is parti-
tioned in three distinct initializing, running and finalizing phases ready for the
ESMF coupling. The model initializes by a call to ADCIRC Init() which also
receives a MPI communicator from the driver. The subroutine reads necessary
input files for constructing the computational mesh including nodes location
and connectivity. It also builds a local and global nodal map to reference which
nodes reside on which MPI process, and to identify their global relationships. It
reads input information to constrain the model such as bathymetry, meteoro-
logical forcing, and freshwater inflow and open boundary conditions. As a part
of the initialization, ADCIRC also checks and connects to all requested output
files that will be used as containers to fill in the model results.
   ADCIRC enters the run phase by a call to ADCIRC Run() subroutine, which
also receives an argument for the number of time steps (NTIME STP) for that
specific run request. The start time and end time of the simulation is determined
during the initialization phase. The model run takes place via a time loop in
which, at every time step, a single call to the TIMESTEP() subroutine occurs.
All the computational steps for applying forcing and boundary conditions to
produce the final results are being performed in this subroutine. The ADCIRC
concludes its run by a call to ADCIRC Final() subroutine where some of the
final post-processing and check for MPI finalizing are performed.

                                         7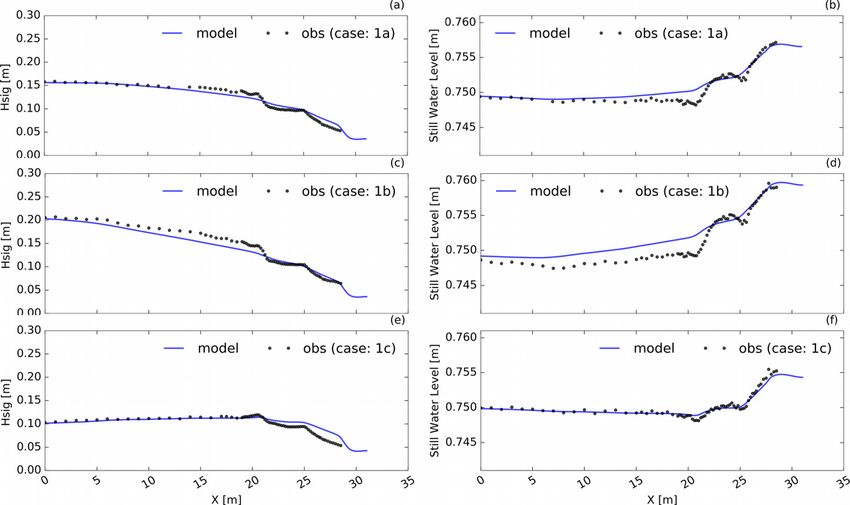
Figure 2: Coupled application configuration file.
All model configurations and results are pre-decisional and for official use only.

                                              8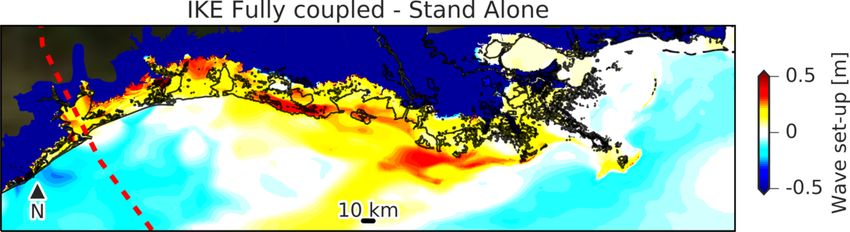
3.1. ADCIRC coupling interface (cap)

   The ADCIRC NUOPC cap performs the coupling in all the three phases: initial-
ize, run and finalize. In the development of the NUOPC cap for ADCIRC, extreme
care and attention were paid to minimize changes to the original ADCIRC code.
At the initialization of the NUOPC application, a global MPI communicator is cre-
ated by ESMF infrastructure and a dedicated set of processes passed to ADCIRC
via a MPI communicator based on the number of processes requested for ADCIRC
in the configuration file. At the initialization, ADCIRC cap also gets connected
to available import and export field matches accepted by the communicators.
   After information exchange among the model components, the ModelAdvance()
subroutine of the ADCIRC cap calls the ADCIRC Run() subroutine to perform the
next run interval. Tab. 1 shows the list of the exported and imported fields
currently accepted by the ADCIRC cap. The naming conventions of these vari-
ables are defined in the NUOPC field dictionary to allow interoperability with
other NUOPC components. We modified and tested ADCIRC preprocessing and
main model code to accommodate various coupling arrangements. The NWS in-
put parameters in fort.15 input file are described in Tab. 2 (Moghimi et al.,
2019).

4. WAVEWATCH III

   WAVEWATCH III (WW3) (Tolman et al., 2009) is a third-generation spectral
wave model that solves the wave action balance equation that accounts for the
growth, propagation, non-linear interaction and dissipation of wind waves in the
ocean by:

              ∂N                    ∂        ∂        S
                 + ∇x · (cg + U)N +    k̇N +    θ̇N =                         (1)
              ∂t                    ∂k       ∂θ       σ

where N (k, θ) is the wave action density spectrum, related to the wave energy
density spectrum F (k, θ) where N (k, θ) = F (k, θ)/σ. Here k is the wavenumber
and k̇ its propagation speed due to depth- or current-induced Doppler shift-
ing, θ is the wave direction and θ̇ its propagation speed due to depth- or

                                       9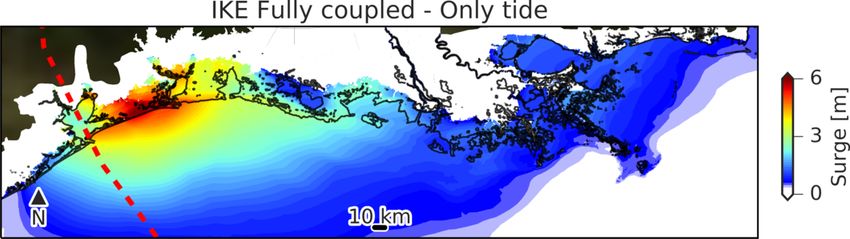
Table 1: Exported and imported fields in coupled system.
All model configurations and results are pre-decisional and for official use only.

    Data field                                      Units                    Variable      Exported by   Imported by
    Eastward sea water velocity                     ms−1                     UU2           ADCIRC        WW3
                                                        −1
    Northward sea water velocity                    ms                       VV2           ADCIRC        WW3
    Sea surface height above mean sea level         m                        ETA2          ADCIRC        WW3
                                                       2 −2       −2
    Eastward radiation stress                       m s       (N m     /ρ)   ADCIRC SXX    WW3           ADCIRC
    Northward radiation stress                      m2 s−2 (N m−2 /ρ)        ADCIRC SYY    WW3           ADCIRC
                                                       2 −2       −2
    Cross radiation stress                          m s       (N m     /ρ)   ADCIRC SXY    WW3           ADCIRC
    Air pressure at sea level                       mH2 O                    PRN2          ATMesh        ADCIRC
    Eastward wind at 10m height                     ms−1                     WVNX2         ATMesh        ADCIRC, WW3
    Northward wind at 10m height                    ms−1                     WVNY2         ATMesh        ADCIRC, WW3

Table 2: New implemented and tested ADCIRC options.
All model configurations and results are pre-decisional and for official use only.

    NWS parameter     Meteorological forcing                                            Wave forcing
    17                ATM∗                                                              None
    517               ATM∗                                                              WAV∗∗
    500               None                                                              WAV∗∗
    519               Best Track (Holland Model)                                        WAV∗∗
    520               Best Track (Generalized Asymmetric Holland Model)                 WAV∗∗

∗
     Any NUOPC enebaled numerical weather prediction model providing required
data fields e.g. ATMesh cap.
∗∗
     Any NUOPC enebaled wave model model providing required data fields e.g.
WW3 cap.

                                              10
current refraction, σ is the wave frequency, cg is the group velocity, and U
the depth-averaged current velocity. On the right-hand side, S represents the
sum of source terms, including wave growth, nonlinear interaction and dissi-
pation. WW3 was originally developed on a regular grid for global operational
wave forecasting, with 2-way nesting for regional applications. More recently,
it has been extended to curvilinear grids for Arctic applications (Rogers et al.,
2018), as well as unstructured meshes for high-resolution coastal application
(Ardhuin and Roland, 2013). Most recently, its traditional ‘card deck’ MPI
parallel implementation (Tolman, 2002) has been supplemented with a more
conventional domain-decomposition approach using ParaMETIS Roland et al.
(2012) equipped with an optional implicit equation solver. Along with these
improvements in numeric, source terms suitable for nearshore application have
been added, including depth-induced breaking, reflection, three-wave non-linear
interaction, and wave-ice interaction, amongst others.
The WW3 code is written in modular FORTRAN, similar to ADCIRC, and is
broken up into a collection of sub-programs which are run in sequence to carry
out a simulation. The most important of these are ww3 grid, which compiles
the computational mesh, and physics and numerics settings into mod def.ww3,
a binary resource file, ww3 prep, which preprocesses all forcing files, ww3 multi,
the multi-grid core wave model, and ww3 ounf and ww3 ounp, which are NetCDF
postprocessing routines. To comply with the ESMF protocol, the core wave model
ww3 multi has been broken up into w3init, w3wave, and w3final to perform
the main steps of model initialization, model advancing, and model finalization,
respectively (Campbell and Whitcomb, 2013). During the initialization step
with w3init, the configuration of the computational mesh file, including node
indices, geographical location, and the mesh connectivity is read from the binary
resource file mod def.ww3. Using the domain decomposition from the PDLIB
library, a local and global nodal map is built that references which nodes reside
on which MPI process, and how they are related globally. During the model
advance step w3wave, forcing fields such as water depth, wind velocity and
currents as well as boundary conditions are updated, followed by the solution of
11the wave action equation equation by means of fractional stepping. Output is
written to a set of binary output files for later postprocessing (using ww3 ounf
and ww3 ounp). Model finalization is completed by calling w3final.
4.1. WAVEWATCH III NUOPC cap
The WW3 NUOPC cap carries out the coupling in the three phases (initializa-
tion, advancing and finalizing) described above. A regular grid version of this
cap was developed by Campbell and Whitcomb (2013) for global and regional-
scale NUOPC applications. In the present work, this cap was extended to sup-
port unstructured meshes and domain decomposition for high-resolution coastal
modeling. During the initialization of the NUOPC application, import and export
meshes are defined based on the PDLIB decomposition, a global MPI commu-
nicator is created by the ESMF infrastructure, and a dedicated set of processes
are passes to WW3 via a MPI communicator based on the number of processes
requested for WW3 in the configuration file (Fig. 2). During this initialization
step, the WW3 cap is also connected to available import and export field matches
accepted by the communicators.
After the information exchange among the model components, the ModelAdvance()
subroutine of the WW3 cap calls the w3wave subroutine to perform the next run
interval. Tab. 1 shows the list of the exported and imported fields accepted by
the WW3 cap for the current application. It is noted that a larger set of import
and export variables is supported by the WW3 cap in general, including surface
roughness variables, Stokes drift and bed roughness, used in other NUOPC ap-
plications featuring wind waves. For more details, see Campbell and Whitcomb
(2013).
4.2. Wave-induced stresses
Breaking waves transfer their momentum to ocean currents. Mathemati-
cally, this forcing is expressed in the circulation model as the divergence in the
radiation stresses, as described in some detail below. From spectral wave models
such as WW3, the radiation stress vectors can be evaluated from the computed
12wave energy density as follows (Tolman et al., 2009):
(n − 0.5 + n cos2 (θ))F (k, θ)dθdt
RR
SXX = ρw g
RR
SXY = ρw g n sin(θ) cos(θ)F (k, θ)dθdt
(n − 0.5 + n sin2 θ)F (k, θ)dθdt
RR
SY Y = ρw g (2)
where ρw is the water density, g is the gravitational acceleration, the directional
wave energy density spectrum F (k, θ) = σN (k, θ), d is the water depth, and n
is the ratio of the wave group cg to wave phase speed cp for a given depth and
1 kd
frequency, given by: n = 2 + sinh(2kd) .
In order to account for the impact of the waves on the mean circulation, the
spatial gradient of wave radiation stress per unit area τs,waves are calculated as:
∂SXX ∂SXY
τsx,waves = − +
∂x ∂y
∂SY Y ∂SXY
τsy,waves = − + (3)
∂y ∂x
and incorporated as additional surface stresses alongside wind stresses and bot-
tom stresses into ADCIRC’s Generalized Wave Continuity Equation and vertically-
integrated momentum equations, following Dietrich et al. (2011).
5. Model setup
We utilized the existing Hurricane Surge On-demand Forecast System un-
structured triangular mesh as the base of the computational domain for the
coupled model setup. The HSOFS mesh covers the entire Gulf of Mexico and
extends into the Atlantic Ocean to the approximate longitude of 65◦W, allow-
ing for appropriate generation of storm surge from atmospheric effects over a
large region. The HSOFS mesh has 1.8 M nodes and covers the shallow coastal
regions up to a topographic height of 10 m above local mean sea level with the
mesh resolution of approximately 250 m (See Sec. 7.2.
136. Results
The importance of dynamical coupling of surge and surface waves on the
spatial extent of the inundation and active wave action area were investigated
for Hurricane Ike, 2008.
Hurricane Ike was a powerful tropical cyclone that swept through portions of
the Greater Antilles and Northern America in September 2008, wreaking havoc
on infrastructure and agriculture, particularly in Cuba and Texas. The ninth
tropical storm, fifth hurricane, and third major hurricane of the 2008 Atlantic
hurricane season, Ike developed from a tropical wave west of Cape Verde on
September 1 and strengthened to a peak intensity as a Category 4 hurricane over
the open waters of the central Atlantic on September 4 as it tracked westward.
Several fluctuations in strength occurred before Ike made landfall on eastern
Cuba on September 8. The hurricane weakened prior to continuing into the
Gulf of Mexico, but increased its intensity by the time of its final landfall on
Galveston, Texas on September 13.
The wave-surge coupled application (hearafter Fully coupled) and stand
alone models (hearafter “Stand alone”) were forced with an identical HWRF
meteorological forcing (See Sec. 7.2.1). As a reference, the ADCIRC model re-
sults forced with tidal boundary condition is also presented (heresafter “Only
tide”).
The map of the maximum surge level during the whole simulation for the
Fully coupled case is shown in Fig. 3a. The maximum surge level is calculated
by subtracting tidal water level from Fully coupled results. The results reveal
that the most severe inundation during Ike, 2008 with more than 6 m above the
maximum tide level was took place on the east side of the hurricane track in
the region between the Galveston Bay, Tx and the Sabine Lake, Tx.
The maximum wave contribution to total water level is calculated by sub-
tracting Stand alone water level from Fully coupled results (Fig. 3b). It is shown
that some of the wave induced inundation (wave setup) occurs at the edge of
the maximum surge where the atmospheric wind setup and negative pressure
14are at their maximum strength. This is significant because it shows how wave
induced momentum released from breaking waves increases the total water level
which in turn causes the wave active breaking region to advance further into
the land and release wave action on the structures further landwards.
Wave height significantly enhanced due to the dynamical coupling of the
surge and wave components. Fig. 4a, b represents the maximum wave height
difference during the whole storm between Fully coupled and Stand alone (which
includes no tidal or surge/inundation effects) cases. Wave height increases more
than 2 m along the track as well as in the east of the Galveston Bay at the coastal
and landfall region. The comparison at the 6 quick deployed wave gauges shows
significant contribution of the surge on the eastern side of hurricane track in
nearshore region (Fig. 17.
It should be noted that wave setup contribution seen in Fig. 3b at the Mis-
sissippi and Atchafalaya rivers delta region occurred hours before the actual
landfall therefore the maximum surge and wave setup in this region did not
happen at the same time. However, it also points to the possibility of expe-
riencing large swells and rip-current events hours before hurricane makes its
actual landfall.
To further analyze this mechanism, we plot changes of the total water level
(TWL) and wave height for the Fully coupled and Stand alone cases at a transect
shown in Fig. 6 (The location of the transect is shown in Fig. 5). We also shown
the topobathy values along the transect in a positive upward vertical coordinate
system where Z=0 m located at the local mean sea level (black line in 6b). We
plotted High Water Mark observations in the 1 km radius from the transect
with red squares. The TWL and wave height line plots start from the land
(kilometer 0) in which ground level is almost 6 m above the local mean sea
level (latitude ∼ 29.80 N) and continues towards the ocean to 8 m water depth
(kilometer 30) in the ocean side (latitude ∼ 29.55 N). Fully coupled solution
for the total water level continuously show enhancement over the Stand alone
results (Fig.6a). Around the shoreline where the Z∼0 m and farther off-shore,
the Stand alone model show greater total water level in comparison with the
15Stand alone solution. This directly relates to wave height and its dissipation
shown in Fig. 6b.
We see that Stand alone model (forced without water surface elevation from
surge component) shows wave height of almost zero right after waves cross the
shoreline (landwards of the Z=0 m; Kilometer∼24). On the other hand, the
wave height from the coupled model show significant wave height of ∼ 2.2 m
in the same region (landwards of the Z=0 m; Kilometer∼24). This pattern is
visible for the wave height evolution even more landwards. This mechanism in
which greaer total water level (∼0.5 m) leads to the potential for more active
local wave generation and propagation and therefore greater wave dissipation
and release wave action which re-ignite enhancement of total water level in
inundated region is presented here.
We also looked at a timeseries of water level at P shown as a blue triangle
in the Fig. 5. This point is located very close to the maximum spatial extent
of the inundated region (Fig. 7) which is helpful to examine time variation of
the total water level for Full coupled and Stand alone cases. The ground level
is also plotted by a black dashed-line which shows that P is not wet before the
storm as it is located ∼3 m above the local mean sea level. During the land
fall both Fully coupled and Stand alone cases produced total water level that
inundated the area. Full coupled shows innudation of ∼1 m above the ground
level which is ∼0.5 m above the water level resulted by Stand alone case at the
time of the peak of the storm.
7. Model system validation
We verified the coupled ADCIRC-WW3 application in a step-by-step manner.
In the first step, we verified all the ESMF intermediate exchange ESMF state
fields before sending and after receiving by the other model component. Then
we performed a basic verification using a small setup to make sure the coupled
ADCIRC-WW3 application runs smoothly. Finally, we switched to the full scale
16a)
b)
Figure 3: Total surge level computed by subtracting the tide only run from fully coupled
case which includes both atmospheric and wave coupling contributions (a). The maximum
wave contribution in total water level computed by subtracting stand alone case from fully
coupled (b). Red line represents the Hurricane Ike best track. Black contour line represents
the shoreline, and the areas beyond the black contour line are the inundated regions.
All model configurations and results are pre-decisional and for official use only.
inundation test case for Hurricane Ike, 2008.
7.1. Laboratory Case (Boers 1996)
To validate the ADCIRC-WW3 coupled system, we first compared the coupled
system results against the laboratory flume experiment of Boer (1996). This
experiment was carried out at Delft University of Technology in Spring 1993
to investigate the interaction between wind waves and the mean circulation via
wave dissipation and radiation stress transfer. The geometry of the flume is
shown in Fig. 8c. The bathymetry represents an immovable (concrete) profile
of a typical barred beach along the western Dutch coastline. The Boer (1996)
experiment features three test cases, 1A, 1B and 1C, in which 1A and 1B rep-
resent violently-breaking, locally-generated wind waves, and 1C represents a
mildly-breaking swell. Tab. 3 shows the wave height and peak period parame-
ters of the imposed wave conditions at the wave maker, while Fig. 9 shows their
corresponsing energy spectra.
17Figure 4: Wave model sensitivity to dynamic exchange between wave and surge models in
term of the spatial distribution of the absolute difference between significant wave height Hs ,
extracted from the fully coupled Wave-Surge and Stand Alone WW3 models; Gulf of Mexico
(a) landfall region(b).
All model configurations and results are pre-decisional and for official use only.
18Figure 5: Red markers are the locations of the tidal gauges. The legend shows the stations
ID numbers. Red dashed line is the Hurricane Ike best track. The blue line and blue triangle
are transect and time serie plot shown in Fig. 6 and time series of the test point is presented
in Fig. 7 respectivly.
All model configurations and results are pre-decisional and for official use only.
Fig. 8a,b show the domain decompositions of the WW3 and ADCIRC model
components, respectively. In both cases the decomposition was generated using
METIS (Karypis, 2011), but recall that in NUOPC/ESMF they do not necessar-
ily need to match - for WW3 the decomposition was done for 24 cores, while
for ADCIRC it was done for 47 cores. The wave component of the coupled
ADCIRC-WW3 was forced with the observed spectra at the upstream wave maker,
and the water level in the flume is initially set to rest. The WW3 component
is configured with a time step of 1 s. The relevant wave physics processes are
depth-induced breaking and three-wave nonlinear interaction, using the source
term formulations of, respectively, Battjes and Janssen (1978), with γBJ = 0.80
and α = 1, and Eldeberky and Battjes (1996). The ADCIRC model component
was run at a time step of 1 s, and forced from rest by only the coupled wave
radiation stresses. The NEMS coupling time step for the two model components
is 1 s.
Fig. 10 shows that the modeled significant wave heights and the wave setup
produced by coupled ADCIRC-WW3 application are in good agreement in terms of
significant wave heights and the maximum water surface for all three cases. For
the more energetic wave case 1B, wave heights are somewhat underestimated
19Figure 6: Comparison of the results for the transect(blue line in Fig. 5) of the total water
level (a) and wave height (b) for Fully coupled and Stand alone cases are presented. The bold
black line represents topobathy level refrenced to the mean sea level (MSL).
All model configurations and results are pre-decisional and for official use only.
Table 3: Boers 1996 Wave conditions.
All model configurations and results are pre-decisional and for official use only.
Wave condition Hs [m] Tp [s]
1A 0.157 2.05
1B 0.206 2.03
1C 0.103 3.33
20Figure 7: Time series of the total water level at the test point (locations shown in Fig. 5).
Black dahsed-line is the ground level.
All model configurations and results are pre-decisional and for official use only.
offshore of the outer bar. This overestimated dissipation appears to result in
the overestimation of the wave setup over this region leading up to the outer
bar. Conversely, in the milder-breaking swell case 1C we observe an overesti-
mation of wave heights inshore of the outer bar, presumably due to insufficient
depth-induced breaking. This results in a slight underestimation of nearshore
water levels. Nevertheless, these results show good overall skill of our coupled
ADCIRC-WW3 application in capturing the wave height and wave setup evolution
correctly.
7.2. Full scale inundation case
Here we present the results of the full scale inundation study for Hurricane
Ike, 2008. To simulate the combined waves and storm surge for Hurricane
Ike, we utilized the unstructured triangular mesh used by NOAA’s operational
Hurricane Surge On-demand Forecast System (HSOFS). We applied 8 tidal
constituents (M2, K1, O1, P1, Q1, N2, S2, K2) at the model open boundaries
(Figs. 12).
7.2.1. Atmospheric forcing
The atmospheric forcing for this study is provided by NOAA’s Hurricane
Weather Research and Forecasting (HWRF) modeling system, coupled to the
21Figure 8: Schematic view of parallelization via domain decomposition algorithm in (a) WW3
with 24 subdomains; and (b) ADCIRC with 47 subdomains forBoer (1996) experiment. (c)
The numerical domain with unstructured triangulated mesh.
All model configurations and results are pre-decisional and for official use only.
220.2
Obs
0
-0.2
h [m]
-0.4
-0.6
-0.8
0 5 10 15 20 25 30
x [m]
#10 -3
8
SET 1A
SET 1B
6 SET 1C
[m2/Hz]
4
2
0
0 0.5 1 1.5 2 2.5 3
f [Hz]
Figure 9: Energy spectra of the three different wave conditions which are summarized in Tab.
3.
All model configurations and results are pre-decisional and for official use only.
Figure 10: Significant wave height (a, c, e) and wave setup (b, d, f) for three different wave
conditions which are summarized in Tab. 3.
All model configurations and results are pre-decisional and for official use only.
23MPIPOM ocean model, and empowered by a movable multi-level nesting technol-
ogy (Zhang et al., 2016; Biswas K et al., 2018). The model grid is triple-nested
using telescopic, two-way interactive horizontal grid resolutions from synoptic
with 0.18◦ resolution as the outer domain (spanning about 75◦ × 75◦ ), to mov-
ing storm nest with 0.06◦ resolution (10◦ × 10◦ ) and core of about 6◦ × 6◦ with
0.02◦ resolution. These nests follow the hurricane best track, ensuring the high-
est resolution around the eye of a hurricane. In this study, we have interpolated
the hourly HWRF model outputs from multiple cycles initiated with analysis data
and 9 forecast time steps. Every 6 hours, reanalysis data from the next cycle are
smoothly ramped into the wind and pressure fields. The atmospheric forcing
has been validated against National Data Buoy Center (NDBC) and satellite
altimeter data. We extracted wind velocity at 10 m height and surface pressure
from the original GRIB2 output files and saved them in NetCDF format. The
ATMesh NUOPC data cap reads the meteorological forcing from NetCDF file and
provides it to ADCIRC and WW3 caps at every coupling time step. The HWRF model
was forced with initial and boundary conditions provided by NOAA’s Global
Forecast System (GFS) with 0.5◦ spatial grid resolution.
Fig. 11 gives an impression of the quality of the HWRF atmospheric forcing
fields used to force the coupled ADCIRC-WW3 model, by comparing 10 m wind
speed and direction against NDBC buoy observations in the Gulf of Mexico (see
Fig. 4 for locations). We can see that the agreement is generally good, in partic-
ular for wind directions. However, a tendency to overestimate the wind speeds
at the storm peak is found at the mid-Gulf NDBC buoys 42001 and 42002,
and the shelf buoy 42019. The high bias in the wind speed is particularly ev-
ident at landfall, as seen at NDBC 42035, located on the shelf just offshore of
Galveston. It would be expected that these overestimated winds would lead
to a degree of overestimation of the locally-generated significant wave heights.
It is also worth mentioning that the NOAA buoy 42035 broke free during the
storm (See Blockedhttps://www.ndbc.noaa.gov/hurricanes/2008/ike/). There-
fore, the observation time series might not be at the same location of extraction
coordinate from the models.
24Figure 11: Atmospheric Model validation at NDBC buoy locations, Model (red) versus obser-
vation (black): (a) Wind speed (b) Wind direction.
All model configurations and results are pre-decisional and for official use only.
257.2.2. ADCIRC model component validation
We validated the total water level results against two sets of water level ob-
servations. The tidal gauge time-series were measured by the NOAA’s Center
for Operational Oceanographic Products and Services (CO-OPS) and High Wa-
ter Marks (HWM) were measured and provided by United States Geographical
Survey (USGS).
Comparison between the total water surface elevation from the coupled
ADCIRC-WW3 application and tidal gauges time series for four stations close to
the actual hurricane track (location of the tidal gauges in Fig. 5 are presented
in Fig. 13a-d). The modeled water surface elevation agrees well with the obser-
vation in terms of the level and timing of the peak of the storm inundation.
High Water Marks are an important source of observations for validation and
enhancement of the storm surge and flood inundation studies. After significant
flooding due to a land-falling hurricane, a rapid high water mark (HWM) data
collection by USGS takes place to document the event and to help improving
future disaster preparedness activities. Comparison of the total water level from
the coupled ADCIRC-WW3 application and HWMs observation reveal that both
are in general agreement in particular around the hurricane track in the land-fall
region (Fig. 14).
We also compared scatter plots and a number of statistical metrics of the
total water levels and HWM data (Fig. 15). Both Fully coupled and Stand
alone results show underestimation of the model in comparison to observations.
However, upon inclusion of the wave forcing, an improvement in the error statis-
tics is found, such that a reduction in the relative bias (RB) from -0.594 m to
-0.392 m, and a reduction in root mean square error (RMSE) from 0.899 m to
0.832 m were presented.
7.2.3. WW3 component verification
The coupled ADCIRC-WW3 coupled application performance with respect to
the wave modeling aspects was firstly assessed in the offshore and over the
shelf of the Gulf of Mexico using NDBC monitoring buoys, and secondly at
26Figure 12: Surge level is computed by subtraction of tide elevation from maximum total water
level for the whole HSOFS mesh. Hurricane Ikes best track is shown by a red dashed-line.
All model configurations and results are pre-decisional and for official use only.
27Station: 8771510 at Galveston Pleasure Pier, TX (a)
4 Stand Alone Fully coupled Data
3
Elev. [m]
2
1
0
Station: 8771013 at Eagle Point, TX (b)
Stand Alone Fully coupled Data
3
Elev. [m]
2
1
0
Station: 8770570 at Sabine Pass North, TX (c)
6 Stand Alone Fully coupled Data
5
4
Elev. [m]
3
2
1
0
Station: 8768094 at Calcasieu Pass, LA (d)
4 Stand Alone Fully coupled Data
3
Elev. [m]
2
1
0
:00 :00 :00 :00 :00 :00 :00
-0 9 00 -10 00 - 11 00 - 1 2 00 - 13 00 - 14 00 -1 5 00
9 9 9 9 9 9 9
8-0 8-0 8-0 8-0 8-0 8-0 8-0
200 200 200 200 200 200 200
Time
28
Figure 13: Time series of the total water level observations at the tidal gauges (locations
shown in Fig. 5). Black dots are the observations. Red line is the tide only water level. Blue
(GFS05d OC) and green (GFS05d OC Wav) are storm induced total water level without and
with wave forcing. Station names and ID numbers are shown in each panel titles.
All model configurations and results are pre-decisional and for official use only.Figure 14: High water marks observations for Hurricane Ike, 2008. The contour plot is the
total water level for GFS05d OC DA Wav case.
All model configurations and results are pre-decisional and for official use only.
Figure 15: Statistical comparisons of High water marks observation and model results. Loca-
tion of the high water mark observations are shown in Fig. 14.
All model configurations and results are pre-decisional and for official use only.
29the location of landfall by using rapid-deployment pressure sensors, placed by
Kennedy et al. (2011).
Considering the NDBC monitoring buoys, four groups can be distinguished.
At mid-Gulf (NDBC 42001 and 42002), we find some overestimation of sig-
nificant wave heights during the passing of the hurricane in response to the
somewhat overestimated wind speeds seen above (Fig. 16a). Similarly, the
peak wave periods are overestimated, reflecting excessive wind-sea growth (Fig.
16b). However, wave direction is reproduced well (Fig. 16c). Interestingly, in
the far-field, towards the eastern half of the Gulf (NDBC 42036, 42039 42040),
significant wave heights tended to be underestimated during the passing of the
storm, while the peak period and direction were captured well. Moving onto
the shelf in the region of landfall (NDBC 42019 and 42020) the agreement of
the model results with the observations improved in general, although there is
still overestimation in the significant wave height and peak period. Finally, at
NDBC 42035, just offshore of the landfall location at Galveston, all wave model
parameters are in good agreement with the observations at the storm peak.
However, the significant wave height is underestimated at this shallow water
location just ahead of the storm peak which could be related to the omission of
the forerunner effect in the coupled surge model component. Regarding the dif-
ferences between the coupled and stand-alone versions of the wave model, these
can only be seen, as expected, at the two shallower stations NDBC 42020 and
42035. As expected, the increased water levels seen above increase the modeled
significant wave height at these stations.
It should be noted that our concentration here is to ascertain general perfor-
mance of the coupled model. In terms of forerunner, we reference our reader to
Kennedy et al. (2011). We diagnose the forerunner surge as being generated by
Ekman setup on the wide and shallow shelf. The longer forerunner time scale
additionally served to increase water levels significantly in narrow-entranced
coastal bays.
Moving more towards shoreline, model results at the pressure sensors de-
ployed in the surf zone by Kennedy et al. (2011) show a significant sensitivity
30Figure 16: Model validation at NDBC buoy locations, forced by HWRF atmospheric model,
extracted from stand-alone WW3 simulations (blue), fully coupled Wave-Surge simulation
(red) versus observation (black): (a) Significant wave height (Hs ); (b) peak period (Tp ) and
(c) mean wave direction. All model configurations and results are pre-decisional and for official
use only.
All model configurations and results are pre-decisional and for official use only.
31to the inclusion of variable water levels from the coupled ADCIRC model (Fig.
17). Referring to Fig. 4b for the station locations, the most significant of these
are the stations ANDKNDY-X, Y and Z located under the eastern half of the
landfalling hurricane. For these three stations, we can see a large influence of
the added surge level on the significant wave height at the storm peak, in all
cases improving the agreement with observations. We note that, as discussed
above, the stations U to Z also might relate to underestimation of the water
surface elevation during forerunner. Stations S and R, located to the south of
the landfall location received mostly offshore winds and a water level set-down.
The significant wave heights at these stations are reproduced well.
Fig. 18 provide a more in-depth view of the results at the Kennedy et al.
(2011) nearshore stations by considering their spectrograms. This figure shows
a number of important features of the nearshore wave field transformation under
both the coupled and stand-alone models. Up to September 13, the simulated
variance density at the northerly stations ANDKNDY-X, Y and Z is under-
estimated by both the stand-alone (Fig. 18b) and coupled (Fig. 18c) models
in connection with non-resolved forerunner effects. After September 13, the
variance density abruptly increases, as the main storm peak arrives with land-
fall. At this time, the coupled model (panel c) shows greater levels of variance
density than the stand-alone model (panel b), which agrees better with the ob-
servations. A final important feature of the nearshore spectra is the frequency
upshift of the spectral peak, due to the nonlinear three-wave interactions. This
strong upshift at stations V, W, X, Y, Z is not seen as intensely in the model
results, indicating an underestimation of the magnitude of this process by the
LTA nonlinear interaction source term. Interestingly, the stand-alone model
captured this upshift process somewhat better than the coupled model, since
the depth underestimation in the former fortuitously enhances the computed
nonlinear interaction (see stations X, Y, Z).
32Figure 17: Model validation at quick deployed gauges, forced by HWRF atmospheric model,
extracted from stand-alone WW3 simulations (blue), fully coupled Wave-Surge simulation
(red) versus observation (black): (a) Significant wave height (Hs ); and (b) peak period (Tp ).
All model configurations and results are pre-decisional and for official use only.
All model configurations and results are pre-decisional and for official use only.
33Figure 18: Frequncy spectrum at nearshore quick deployed gauges comparing observation (a)
versus stand-alone WW3 simulations (b) and fully coupled Wave-Surge simulation (c). The
time series of peak frequency is shown in each subplot. All model configurations and results
are pre-decisional and for official use only.
All model configurations and results are pre-decisional and for official use only.
348. Summary and Conclusions
We developed a flexible coupling application for coastal inundation studies
in the framework of NEMS using NUOPC/ESMF infrastructure. This application
includes NUOPC model interfaces (or caps) for ADCIRC and WW3, and also a data
cap to read and provide atmospheric forcing fields from HWRF model results.
The application is examined using a standard laboratory flume case for set-up
and wave dissipation, and validated for Hurricane Ike, 2008 on NOAA’s HSOFS
mesh, a 1.8 M node triangular mesh with a nominal resolution of ∼500 m. The
model skills and improvement due to wave effects on the final inundation were
examined and discussed using time series from tide gauges and high water marks
observations.
In general, it can be concluded that the coupling improves the performance
of the ADCIRC and WW3 model components. The Boer (1996) case shows that
the coupling between these two models behaves correctly under laboratory con-
ditions. In the Ike field case, the simulated water levels of ADCIRC showed gen-
erally better agreement with observations upon inclusion of the coupled wave
effects from WW3. Accounting for the forerunner effect is expected to improve the
results further. Conversely, the coastal wave field simulated by WW3 improves
significantly upon coupling with ADCIRC, in particular in the surf zone and in
inundated regions.
As outlined in the Introduction, the first application of the NUOPC model com-
bination (or App) described here is the Named Storm Event Model (NSEM),
a high-resolution hindcast model which is being developed to meet the require-
ments of the COASTAL Act (2012). However, we anticipate that these flexible
and generic NUOPC coupling caps for ADCIRC and WW3 will enable future
development and seamless inclusion of various additional model components for
forecasting applications. For example, the current cap development provides the
possibility to perform three-way dynamical coupling of ADCIRC, WW3 and atmo-
spheric prediction models. In the hindcast application described here, we limited
the atmospheric model, run offline, to a one-way forcing to ADCIRC-WW3 via a
35data cap. However, the ADCIRC and WW3 caps are capable of dynamically im-
porting atmospheric model forcing, and exporting current velocity, water surface
elevation (accounting for inundated zones which alter the surface roughness),
and enhanced sea surface roughness due to the presence of waves (Charnock
parameter) back to the connected atmospheric model component.
Further future coastal applications of the presented flexible NUOPC modeling
framework are incorporating processes such as river and inland flooding and sea
ice. As part of the Named Storm Event Model, work is currently under way
to incorporate river flow into this coupled system by including a NUOPC cap for
WRFHydro. This extension will allow the modeling of complex coastal flooding
events such as Hurricane Harvey (2017), which featured extreme rainfall and
inland flooding alongside the surge and wave forcing from the ocean. Sea ice
has significant and complex impacts on coastal surge (Westerink et al., 2018) as
well as dissipative and dispersive effects on the coastal wave field (Rogers et al.,
2018). The flexible coastal modeling system presented here can be extended to
include these coupled processes via an existing NUOPC cap for the sea ice model
CICE (Campbell and Whitcomb, 2013).
Acknowledgements
This work has been supported by The Consumer Option for an Alterna-
tive System to Allocate Losses (COASTAL) Act Program and Water Initiative
project within the National Oceanic and Atmospheric Administration (NOAA).
The WaveWatchIII development has been supported by the US. Army Corps
of Engineers (USACE). The authors acknowledge Dr. Andrew Kennedy for
providing the in-situ data. The results presented here are preliminary and for
presenting the incremental developments of coupled application which is under
development to serve above mentioned projects. The authors also would like to
acknowledge Dr. Chris Massey for his constructive communications.
36References
Ardhuin, F., Roland, A., 2013. The development of spectral wave models:
coastal and coupled aspects, in: Proceedings of Coastal Dynamics, pp. 25–38.
Biswas K, M., Bernardet, L., Abarca, S., Ginis, I., Grell, E., Kalina, E., Kwon,
Y., Liu, B., Liu, Q., Marchok, T., Mehra, A., Newman, K., Sheinin, D.,
Sippel, J., Subramanian, S., Tallapragada, V., Thomas, B., Tong, M., Trahan,
S., Wang, W., Yablonsky, R., Zhang, X., Zhang, Z., 2018. Hurricane Weather
and Research and Forecasting (HWRF) Model: 2017 scientific documentation.
Technical Report. Development Testbed Center, UCAR.
Boer, M., 1996. Simulation of a surf zone with a barred beach. Report 1. Wave
heights and wave breaking. Technical Report. Dept. of Civil Engineering,
Delft University of Technology.
Campbell, T.J., Whitcomb, T.R., 2013. Coupling Infrastructure and Inter-
operability Layer Extension Across All Earth System Components. Techni-
cal Report. NAVAL RESEARCH LAB STENNIS DETACHMENT STENNIS
SPACE CENTER MS.
Dietrich, J., Zijlema, M., Westerink, J., Holthuijsen, L., Dawson, C., Luettich,
R.A., Jensen, R., Smith, J., Stelling, G., Stone, G., 2011. Modeling hurri-
cane waves and storm surge using integrally-coupled, scalable computations.
Coastal Engineering 58, 45–65.
Eldeberky, Y., Battjes, J.A., 1996. Spectral modeling of wave breaking: Ap-
plication to boussinesq equations. Journal of Geophysical Research: Oceans
101, 1253–1264.
Gochis, D., Yu, W., Yates, D., 2013. The wrf-hydro model technical description
and users guide, version 1.0. NCAR technical document 120.
Hill, C., DeLuca, C., Balaji, Suarez, M., Silva, A.d., 2004. The architecture of
the earth system modeling framework. Computing in Science & Engineering
6, 18–28.
37Jacob, R., Larson, J., Ong, E., 2005. M× N communication and parallel in-
terpolation in Community Climate System Model version 3 using the Model
Coupling Toolkit. International Journal of High Performance Computing Ap-
plications 19, 293–307.
Karypis, G., 2011. METIS and ParMETIS, in: Encyclopedia of parallel com-
puting. Springer, pp. 1117–1124.
Kennedy, A.B., Gravois, U., Zachry, B.C., Westerink, J.J., Hope, M.E., Dietrich,
J.C., Powell, M.D., Cox, A.T., Luettich, R.A., Dean, R.G., 2011. Origin of
the hurricane ike forerunner surge. Geophysical Research Letters 38.
Lemmen, C., Hofmeister, R., Klingbeil, K., Nasermoaddeli, M.H., Kerimoglu,
O., Burchard, H., Kösters, F., Wirtz, K.W., 2017. Modular system for shelves
and coasts (mossco v1. 0)-a flexible and multi-component framework for cou-
pled coastal ocean ecosystem modelling. arXiv preprint arXiv:1706.04224 .
Luettich Jr, R.A., Westerink, J.J., Scheffner, N.W., 1992. ADCIRC: An Ad-
vanced Three-Dimensional Circulation Model for Shelves, Coasts, and Estu-
aries. Report 1. Theory and Methodology of ADCIRC-2DDI and ADCIRC-
3DL. Technical Report. COASTAL ENGINEERING RESEARCH CENTER
VICKSBURG MS.
Moghimi, S., klingbeil, K., Graewe, U., Burchard, H., 2012. Three dimensional
wave current interaction in nearshore regions, in: JONSMOD2012 , Brest,
France.
Moghimi, S., Vinogradov, S., Myers, E.P., Funakoshi, Y., Van der Westhuysen,
A.J., Abdolali, A., Ma, Z., Liu, F., et al., 2019. Development of a Flexi-
ble Coupling Interface for ADCIRC Model for Coastal Inundation Studies.
Technical Report. NOAA National Ocean Service.
Rogers, W., Posey, P., Li, L., Allard, R., 2018. Forecasting and Hindcasting
Waves In and Near the Marginal Ice Zone: Wave Modeling and the ONR Sea
38State Field Experiment. Technical Report. NAVAL RESEARCH LAB STEN-
NIS DETACHMENT STENNIS SPACE CENTER MS STENNIS SPACE .
Roland, A., Zhang, Y.J., Wang, H.V., Meng, Y., Teng, Y.C., Maderich, V.,
Brovchenko, I., Dutour-Sikiric, M., Zanke, U., 2012. A fully coupled 3d wave-
current interaction model on unstructured grids. Journal of Geophysical Re-
search: Oceans 117.
Tallapragada, V., Kieu, C., Kwon, Y., Trahan, S., Liu, Q., Zhang, Z., Kwon,
I.H., 2014. Evaluation of storm structure from the operational hwrf during
2012 implementation. Monthly Weather Review 142, 4308–4325.
Theurich, G., DeLuca, C., Campbell, T., Liu, F., Saint, K., Vertenstein, M.,
Chen, J., Oehmke, R., Doyle, J., Whitcomb, T., et al., 2016. The earth system
prediction suite: toward a coordinated us modeling capability. Bulletin of the
American Meteorological Society 97, 1229–1247.
Tolman, H.L., 2002. Distributed-memory concepts in the wave model WAVE-
WATCH III. Parallel Computing 28, 35 – 52.
Tolman, H.L., et al., 2009. User manual and system documentation of wave-
watch iii tm version 3.14. Technical note, MMAB Contribution 276, 220.
Valcke, S., Balaji, V., Craig, A., DeLuca, C., Dunlap, R., Ford, R., Jacob, R.,
Larson, J., O’Kuinghttons, R., Riley, G., et al., 2012. Coupling technologies
for earth system modelling. Geoscientific Model Development 5, 1589.
Warner, J., Sherwood, C., Signell, R., Harris, C., Arango, H., 2008. Develop-
ment of a three-dimensional, regional, coupled wave, current, and sediment-
transport model. Computers & Geosciences 34, 1284–1306.
Westerink, J.J., Joyce, B., Grumbine, R., van der Westhuysen, A., Feyen, J.,
Pringle, W.J., Wirasaet, D., 2018. Coupled tides, storm surge and waves
under varying ice coverages along alaskas bering and chukchi coasts. Coastal
Engineering Proceedings 1, 69.
39You can also read