Strategic Program 2020-2023 - 28 February, 2020 - Veolia
←
→
Page content transcription
If your browser does not render page correctly, please read the page content below
Strategic Program
2020-2023
28 February, 2020
DISCLAIMER

 Veolia Environnement is a corporation listed on the Euronext Paris. This document contains “forward-looking statements” within the
 meaning of the provisions of the U.S. Private Securities Litigation Reform Act of 1995. Such forward-looking statements are not
 guarantees of future performance. Actual results may differ materially from the forward-looking statements as a result of a number of
 risks and uncertainties, many of which are outside our control, including but not limited to: the risk of suffering reduced profits or losses
 as a result of intense competition, the risk that changes in energy prices and taxes may reduce Veolia Environnement’s profits, the risk
 that governmental authorities could terminate or modify some of Veolia Environnement’s contracts, the risk that acquisitions may not
 provide the benefits that Veolia Environnement hopes to achieve, the risks related to customary provisions of divesture transactions, the
 risk that Veolia Environnement’s compliance with environmental laws may become more costly in the future, the risk that currency
 exchange rate fluctuations may negatively affect Veolia Environnement’s financial results and the price of its shares, the risk that Veolia
 Environnement may incur environmental liability in connection with its past, present and future operations, as well as the other risks
 described in the documents Veolia Environnement has filed with the Autorités des Marchés Financiers (French securities regulator).
 Veolia Environnement does not undertake, nor does it have, any obligation to provide updates or to revise any forward-looking
 statements. Investors and security holders may obtain from Veolia Environnement a free copy of documents it filed (www.veolia.com)
 with the Autorités des Marchés Financiers.

 This document contains "nonGAAP financial measures". These "nonGAAP financial measures" might be defined differently from similar financial measures made
 public by other groups and should not replace GAAP financial measures prepared pursuant to IFRS standards.

                                                                                                                                                               2
1.
2.
3.
4.
5.
6.
VEOLIA’S PURPOSE:      VEOLIA’S       THE 2020-2023     2020-2023:    2020-2023:   2020-2023:
A VALUE FOCUSED     ACHIEVEMENTS   STRATEGIC PROGRAM   GROWTH AND    INNOVATION    FINANCIALS
 MODEL FOR ALL        2012-2019       AND FINANCIAL     EFFICIENCY
 STAKEHOLDERS                          TRAJECTORY

                                                                                                3
VEOLIA’S PURPOSE:
A VALUE-FOCUSED MODEL
FOR ALL STAKEHOLDERS
Antoine Frérot, Chairman and CEO
VEOLIA’S PURPOSE:
THE “COMPASS” OF VEOLIA’S NEW STRATEGIC PROGRAM

            Veolia’s prosperity is founded upon its usefulness to all its stakeholders

                                                                                               Planet

                                                                                                                            Clien
                                                                     ty
                                                               Socie

                                                                                                                                 ts
                                                                                  Resourcing the world

                Maximizing Veolia’s impact for all
       its stakeholders over the 2020-2023 period                         Em                                                e   rs
                                                                               plo                                      old
                                                                                  y   ee                       r   eh
                 Veolia’s Purpose was released in April 2019                               s            S   ha

                                                                                                                                      5
VEOLIA’S ACHIEVEMENTS
2012-2019
Antoine Frérot, Chairman and CEO

2012-2019
DELIVERY

      Phase I. 2012-2015                                       Phase II. 2016-2019
  I                                                       II

      TRANSFORMATION                                           EFFICIENCY AND GROWTH

         Reducing the debt                                       A profitable growth, mainly organic,
         Geographic refocusing and new organization               completed with small acquisitions
          by geography                                            Enhanced efforts on efficiency and
         Cost savings (€800M)                                     cost savings (€1bn)
         Repositioning and modernizing our offers

                                              ALL TARGETS ACHIEVED

                                                                                                          7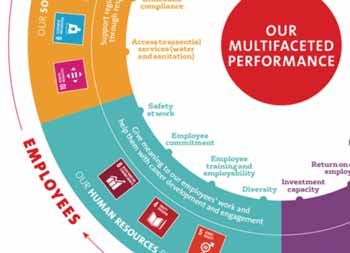
2012-2015
4 YEARS OF TRANSFORMATION
                                                            CAGR
                                                           + 5.4 %
                                   802               2.6                   3.0
                                                                2.8                           + 2.4 pts
                                             2.4                                                                 6.8%
                            582
                                                                                           5.0%       5.5%
                                                                                  4.4%
                  350

         142

                                                                                                                        14.7
        2012     2013      2014    2015      2012    2013          2014    2015   2012      2013          2014   2015
                                                                                                                                      - 45 %

         Cumulated cost savings (€M)                 EBITDA (€bn)                        ROCE after tax (%)
                                                                                                                               10.8
                                                                                                                                       8.2     7.8    8.2
                        CAGR
                                                                                                                 0.58
                       + 5.1 %                16.6   16.4                 16.3                     CAGR
                                    1.31                        16.1
                                                                                              + 31.6 %                  2011   2012   2013     2014   2015
                            1.05
       0.8       0.9                                                                                  0.31
                                                                                                                         Net Financial Debt (€bn)
                                                                                            0.2

                                                                                  0.06

       2012      2013       2014     2015     2012   2013       2014      2015    2012      2013          2014   2015

               Current EBIT (€bn)              Capital employed (€bn)              Current net income (€bn)

  Before IFRIC12 and IFRS16 CAGR 2011-2015
                                                                                                                                                             8
2016-2019
4 YEARS OF PROFITABLE GROWTH
                           CAGR
                                                                          CAGR
                        + 3.6 %                                                                                  + 1.2 pts                                                    10.7
                                       27.2                              + 4.6 %
                                                                                                                                 9.0   9.6      9.3      9.3         9.7
                                                                                        4.0                             8.8                                                   1.7
                              25.9
                                                                                 3.4    0.5 IFRS 16            8.3                                                                  IFRS 16
                     24.8                                     3.2      3.2
           23.8                                                                                       7.8
                                                                                                                                                                              9.0
                                                                                        3.5

           2016      2017     2018     2019                  2016     2017       2018   2019          2016     2017     2018   2019
                                                                                                                                       2015 2016 2017 2018 2019
                   Revenue (€bn)                                       EBITDA (€bn)                         ROCE after tax (%)           Net Financial Debt(1) (€bn)

                           CAGR                                                                                      CAGR

                           +7%                                                                                    + 9.7 %
                                                                                        17.9                                   0.76
                              1.6      1.7                                                                              0.67
                     1.5                                                                1.7 IFRS 16   0.6      0.61
            1.4                                              15.8     15.6     15.8                                                                                        1050
                                                                                                                                                               802

                                                                                        16.2                                                      500
                                                                                                                                         245

           2016      2017     2018     2019                  2016     2017       2018   2019          2016     2017     2018   2019      2016     2017         2018        2019

                  Current EBIT (€bn)                             Capital employed (€bn)               Current net income (€bn)          Cumulated cost savings (€M)

  % at constant FX CAGR 2015-2019 at constant FX Including IFRIC12 and before IFRS16
  (1) Including hybrid
                                                                                                                                                                                              9
2016-2019
DELIVERY
In € millions                                                                                                                      CAGR
Excluding IFRS 16 until 2017                                          2016           2017           2018           2019          2015-2019
                                                                   Excl IFRS 16   Excl IFRS 16   Incl IFRS 16   Incl IFRS 16   At constant forex
                                                                                                                                  excl IFRS 16
 Revenue                                                            23 838         24 818         25 911         27 189            3.6 %
 EBITDA                                                              3 158          3 217          3 843          4 022            4.6 %
 Current EBIT                                                        1 442          1 497          1 644          1 730            7.0 %
 Net current income group share                                       597            614            672            760             9.7 %
 Net CAPEX(1)                                                        -1 511         -1 648         -2 189         -2 201
 WCR variation                                                         268            115            60             209
 Free Cash Flow before discretionary growth capex                     1 145           828            846           1 230
 Free Cash Flow after discretionary growth capex                       940            619            536            868
 Dividend to shareholders                                              401            440            463            509
                                                          2015
 Net financial debt excluding hybrid and before IFRS 16   -8 170     -7 812         -7 833         -8 296        -7 497(2)
 Hybrid                                                   -1 452     -1 452         -1 452         -1 452         -1 452
 Net financial debt including hybrid and before IFRS16    -9 622     -9 264         -9 285         -9 748         -8 949
 IFRS16                                                    na          na             na           -1 816         -1 731
                                                           na          na             na
 Net financial debt including hybrid and after IFRS16                                              -11 564       -10 680(2)

 Leverage NFD/EBITDA (including hybrid before IFRS 16)     3.02       2.93           2.89           2.87           2.53
 Leverage NFD/EBITDA (including hybrid after IFRS 16)      na          na             na            3.01           2.66

   (1) Including discretionary growth CAPEX
   (2) including TNAI divestiture
                                                                                                                                                   10
2016-2019:
INCREASED VALUE CREATION
After tax ROCE vs. WACC(1) Dividend (€): + 37% in 4 years
8.8% 9.0% €1.00
8.3% €0.92
7.4% 7.8% €0.84
€0.80
15.9 15.8 15.6 15.8 16.2
€0.73
6.3%
6.1%
5.8%
5.5%
5.3%
2015 2016 2017 2018 2019 2015 2016 2017 2018 2019(2)
Capital employed (€bn) ROCE after tax WACC Euro
(1) Including IFRIC 12 restatement - Before IFRS 16
(2) Subject to approval of the AGM of April 22, 2020
112012-2019:
TOTAL SHAREHOLDER RETURN(1) OF +241% vs. +92% FOR THE CAC 40
360
340 TSR VEOLIA 240.9%
320
CAC 40 91.9%
300
280 75.9%
STOXX 600
260
240 STOXX 600 UTILITIES 57.8%
220
200
180
160
140
120
100
80
60
1
12
13
14
15
16
17
18
19
12
13
14
15
16
17
18
19
2
3
4
5
6
7
8
9
12
13
14
15
16
17
18
19
-1
-1
-1
-1
-1
-1
-1
-1
-1
c-
c-
c-
c-
c-
c-
c-
c-
p-
p-
p-
p-
p-
p-
p-
p-
n-
n-
n-
n-
n-
n-
n-
n-
c
ar
ar
ar
ar
ar
ar
ar
ar
De
De
De
De
De
De
De
De
De
Se
Se
Se
Se
Se
Se
Se
Se
Ju
Ju
Ju
Ju
Ju
Ju
Ju
Ju
M
M
M
M
M
M
M
M
Veolia Base 100 (div
(div. réinvestis)
reinvested) CAC 40 Base 100 Stoxx Europe 600 Base 100 Stoxx Europe 600 Utilities Base 100
(1) As of Feb. 20, 2020
12THE 2020-2023 STRATEGIC PROGRAM AND FINANCIAL TRAJECTORY Antoine Frérot, Chairman and CEO
OUR PLANET AND THE SOCIETY ARE FACING CRUCIAL CHALLENGES,
ENTAILING AN OBLIGATION TO ACT

                                CLIMATE

                                                     VEOLIA IS IDEALLY
                                                     POSITIONED
                                          PLASTICS   SOLUTIONS MASTERED BY
                                                     VEOLIA COVER 30% OF
                                                     NECESSARY GHG REDUCTIONS

                               POLLUTION

                                                                            14
A particular context: the environmental priority has never been higher
A high ambition: to be the reference company for the ecological
transformation
A priority: maximizing Veolia’s positive impact - environmental, societal,
financial
A consequence: clear priorities
Strong acceleration of the businesses which have the highest positive impact on the planet
20% portfolio rotation
IMPACT 2023
Preparing the future:
IN A NUTSHELL Reinvent the historical businesses
Create new solutions to address the global environmental challenges
A highly rigorous execution:
€1bn cost savings plan
Net financial debt below 3 x EBITDA over the duration of the plan
Providing the proof of commitments with a set of KPIs:
To track our impact on all our stakeholders
To base the bonus policy of the managers
15IMPACT 2023
STRATEGIC ORIENTATIONS: CLEAR CHOICES ON OUR BUSINESSES
I II III
1. Accelerate 2. Optimize & develop 3. Reduce
MAXIMUM IMPACT STILL VALUE CREATION MATURE OR COMMODITIZED
GROWING DEMAND REINVENTION AND RENEWED LESS IMPACT
INTEREST
Hazardous waste management Municipal water Mature businesses - eg: district heating
Waste recycling & recovery: plastics, Water technologies & services in the US
RDF, sludge Construction of water treatment plants
Industrial & commercial waste collection
Energy efficiency Solid waste treatment (incineration, Municipal waste collection if no direct
Industrial ecology: water for industrial landfilling) or indirect link with treatment
processes, asset sharing on industrial Facility management
District heating/ cooling networks
parks, circular economy solutions... (without coal)
New innovative solutions for the
ecological transformation
16IMPACT 2023
CAPITAL ALLOCATION
€5bn €2bn
net investments over 4 years
Industrial & financial investments
to develop new projects ~€500M
(“Accelerate” and “Optimize & develop”) /year in average
~40% in Europe (incl. France) Leverage ratio < 3x
~60% in the rest of the world €3bn
~65% for industrial clients
~35% for municipal clients Divestments
(“Reduce”)
~40% organic growth
~60% external growth Portfolio rotation: ~20% of the
Group’s Capital Employed
Assets involved already identified
€1bn already achieved (district
heating in the US)
17IMPACT 2023
A STRONG COMMITMENT TO COMBAT CLIMATE CHANGE
1. CONVERT ALL OUR EUROPEAN 2. MAXIMIZE AVOIDED EMISSIONS
COAL FIRED ASSETS BY 2030 FOR OUR CLIENTS
I II
Coal fired cogeneration plants Target: 15 Mt of CO2 saved in 2023
(3% of total revenue) Key contributors:
We will not sell these coal assets Activities to “accelerate”: waste recycling
& recovery (eg. plastics, RDF, organics,
We are converting all of them solvents...), energy efficiency in buildings,
to sustainable energy by 2030 industrial ecology (eg. cogeneration,
€400M dedicated Capex from 2020 by-product recovery)
to 2023 Activities to “optimize & develop”: waste
to energy, district energy with renewable
energies
18IMPACT 2023
CREATING SOLUTIONS FOR THE FUTURE THROUGH FOCUSED INNOVATION
“Veolia prepares for the future, protecting the environment and responding to humanity’s vital needs” (extract of Veolia’s Purpose)
Focus on 6 major global challenges for which Veolia can deliver impact through concrete innovative solutions
€300M over 4 years to develop and impose these solutions
HEALTH & NEW NEW LOOPS NEW ENERGY
POLLUTANTS OF MATERIALS SERVICES
ADAPTATION TO NEW DIGITAL
FOOD CHAIN
CLIMATE CHANGE OFFERS
19IMPACT 2023
KEY FINANCIAL TARGETS(1)
REVENUE Continued solid growth
EFFICIENCY €1bn cost savings over 4 years
EBITDA €4.7bn - €4.9bn in 2023
CURRENT NET INCOME GROUP SHARE ~€1bn in 2023
LEVERAGE RATIO < 3 x and well below 3 x in 2023
DIVIDEND €1.30 / share in 2023
(1) At constant FX (based on rates at the end of 2019), at constant IFRS & in an economic environment without major change
20A DASHBOARD TO TRACK AND REPORT
OUR MULTIFACETED PERFORMANCE
5 stakeholders
18 KPIs
All KPIs audited
21IMPACT 2023
MANAGEMENT INCENTIVES AND EMPLOYEE SHAREHOLDING
Bonus policy for the management
50% financial criteria: Revenue growth, Current net income, FCF, ROCE
30% quantitative ESG criteria
20% qualitative criteria
Annual attribution of performance shares to 500 beneficiaries
50% financial criteria: EPS growth and market outperformance (TSR)
50% quantitative ESG criteria
Employee share ownership plan
One share ownership plan per year
Target > 30% take up amongst employees
22 A particular context: the environmental priority has never been higher
A high ambition: to be the reference company for the ecological
transformation
A priority: maximizing Veolia’s positive impact - environmental, societal,
financial
A consequence: clear priorities
Strong acceleration of the businesses which have the highest positive impact on the planet
20% portfolio rotation
IMPACT 2023
Preparing the future:
IN A NUTSHELL Reinvent the historical businesses
Create new solutions to address the global environmental challenges
A highly rigorous execution:
€1bn cost savings plan
Net financial debt below 3 x EBITDA over the duration of the plan
Providing the proof of commitments with a set of KPIs:
To track our impact on all our stakeholders
To base the bonus policy of the managers
232020-2023: GROWTH AND EFFICIENCY Estelle Brachlianoff, COO
IMPACT 2023
STRATEGIC ORIENTATIONS: CLEAR CHOICES ON OUR BUSINESSES

    I                                                II                                                III

                      1. Accelerate                              2. Optimize & develop                                      3. Reduce

       MAXIMUM IMPACT                                    STILL VALUE CREATION                              MATURE OR COMMODITIZED
       GROWING DEMAND                                    REINVENTION AND RENEWED                           LESS IMPACT
                                                          INTEREST

         Hazardous waste management                       Municipal water                                   Mature businesses - eg: district heating
         Waste recycling & recovery: plastics,            Water technologies & services                      in the US
          RDF, sludge                                                                                         Construction of water treatment plants
                                                           Industrial & commercial waste collection
         Energy efficiency                                Solid waste treatment (incineration,              Municipal waste collection if no direct
         Industrial ecology: water for industrial          landfilling)                                       or indirect link with treatment
          processes, asset sharing on industrial                                                              Facility management
                                                           District heating/ cooling networks
          parks, circular economy solutions...              (without coal)
         New innovative solutions for the
          ecological transformation

                                                                                                                                                          25
ACCELERATE:
CRITERIA AND PRIORITIES
NEW HIGH-VALUE OPPORTUNITIES
Hazardous waste treatment
INVESTMENT CRITERIA
Targeting geographies with favorable regulation and strong industries
Solid waste recycling
Activities with a
highly positive Plastic recycling
impact on the Waste to RDF(1)
environment, and Sludge and organic waste recovery
strong growth and
return potential... Energy efficiency
...where Veolia can Energy efficiency contracts, using digital as a growth lever
differentiate (strong (e.g.: Hubgrade platforms)
& rare skills)... Industrial ecology
...and reach a critical Industrial water
size in the Sorting and recycling waste at the source
region/country Energy efficiency
And innovation, to prepare the future
(1) Refuse Derived Fuel
26VEOLIA’S CAPABILITIES IN HAZARDOUS WASTE:
A COMPREHENSIVE RANGE OF HIGH ADDED VALUE SOLUTIONS
WASTE PREPARATION
SOIL TREATMENT LOGISTICS TREATMENT RECYCLING LANDFILLING
Analysis Collection Shredding High temperature Regeneration/ Specialized landfills
incineration recovery:
Soil remediation Analysis Deconditioning
Solvents
Repackaging Sorting Biological or physico-
chemical treatment Acids
Regrouping & transfer
Hydrocarbons
Class 1 Landfill
Batteries
Rotating kiln
Used oils...
On site securing incinerator
& reconditioning Physical-chemical
Sorting treatment
platforms/
regrouping
Regeneration of
Soil solvents
remediation
Biological treatment
Sulfuric acid
regeneration
27VEOLIA IS THE ONLY GLOBAL PLAYER IN HAZARDOUS WASTE
~€2.5BN REVENUE IN 2019, MORE THAN +10%/YEAR SINCE 2014
2019 Revenue - CAGR 2014-2019(1)
Europe
€1.2bn +5 %
North America(2)
€0.9bn +13 %
Asia
€0.2bn +35%
Latin America
€80M +26 %
Africa
Australia &
Strong and enforced regulation Middle East
New Zealand
Partial regulation, not fully enforced €5.0M NA
Weak Regulatory framework
€0.1bn +10%
Veolia present since before 2014
(1) At constant Forex
New markets for Veolia since 2014 (2) Including Veolia Nuclear Solutions
28HAZARDOUS WASTE:
OUR AMBITION: INCREASE REVENUE TO ~€4BN IN 2023
A €25-30bn market growing at a solid pace, driven by the evolution of local regulations
(increasingly stringent and enforced) and the growth of the industrial production
~20% EBITDA margin
Double digit ROCE
Veolia’s unique positioning:
Track record and know how - risk management, waste traceability, concentration
and then treatment of the pollution, waste recovery or recycling
VEOLIA’S REVENUE IN HAZARDOUS
& LIQUID WASTE (€BN) Only global player, with unique network of assets and presence on all continents
Business models delivering high added value: merchant plant, service, or on-site
~4.0 treatment
Strong growth ambition:
2.5 Continue to develop our existing platforms (Europe, USA, China), by completing our
network of assets: building or acquiring new treatment plants, increasing
geographical density, broadening our range of offers
1.5
New facility on Evonik site in Germany
Acquisition of the treatment assets of Alcoa in the USA
7 new sites under construction in China on top of the 8 existing ones: targeting
15% market share by 2023
2014 2019 2023
Duplicate this business in countries where the regulation is favorable
Examples: Sadara (JV Aramco-Dow) in Saudi Arabia; Singapore
29HAZARDOUS WASTE
ALCOA PROJECT IN THE US
Market context in the USA
Permitted sites scarce and valuable
Veolia co-leader in hazardous waste incineration, but lacking landfill capacity
Client context
Alcoa Gum Spring (Arkansas): hazardous waste incineration and landfill, used
to treat spent pot liner, a byproduct of aluminum production
Site divestment, part of an asset rotation program
Veolia’s game-changing project
$250M to acquire existing a haz landfill and an incinerator from Alcoa
Leverage the existing permit to increase the treatment capacity and the
categories
of waste accepted in the facilities (Capex: ~$120M)
Internalize Veolia’s volumes
Veolia to remain a key service provider to Alcoa
Potential to expand services to new customers throughout North America
Revenue ~$300M per year once project completed (2022)
Strategic interest for Veolia
Increase Veolia’s treatment capacity in North America
Complete the range of offers in the US with landfilling
30HAZARDOUS WASTE
EVONIK PROJECT IN GERMANY
Market context
Few new incineration capacities in Europe for hazardous waste and existing
site fully utilized
Germany: largest hazardous waste market in Europe, with a limited presence
of Veolia so far
Client context
Evonik is one of the world leaders in specialty chemicals. In Germany, Evonik is
closing its coal-fired power plant in Marl’s industrial park, which is also used to
incinerate haz waste
Evonik owns on the same site a hazardous waste incinerator of low capacity
Veolia’s game-changing project
Acquisition of the existing incinerator and long lease of the land
Leveraging the existing permit to increase the capacity of the existing
incinerator and build a new larger incinerator
Will process hazardous waste from Evonik, the industrial park and from other
local industrial clients as well, and feed the site with thermal energy (thus
replacing coal)
Capex: €80M ; > €70M expected annual revenue
Strategic interest for Veolia
Increase Veolia’s treatment capacity in Europe
Become a major player in Germany
31WASTE RECYCLING AND RECOVERY: PLASTIC RECYCLING
THE VALUE CHAIN
MECHANICAL RECYCLING OF PLASTICS
MULTIPLE TYPES OF EXTRUSION RECYCLED
ADDITIONAL PELLETS
PLASTICS SHREDDING CLEANING/ DRYING ADDITIVES (HEATING AT
SORTING
~200C )
(PET, PP, HDPE, LDPE,...)
COLLECTION SORTING
Additional sorting and Depolymerisation Refining, cracking,
Sales of polymers
preparation (e.g.: pyrolysis) polymerisation
Preparation of RDF
(Refuse-Derived Fuel)
CHEMICAL RECYCLING OF PLASTICS
32WASTE RECYCLING AND RECOVERY: PLASTIC RECYCLING
OUR AMBITION
VEOLIA’S REVENUE IN PLASTIC A €25bn market growing at a very high pace, driven by:
RECYCLING (€BN) Evolving regulations regarding plastic usage and recycling
(Europe and Asia in particular)
~0.8 Societal pressure
Commitments made by brands, notably in the Food & Beverage and
Consumer Goods industries, to use recycled plastic for their products
and packaging by 2025-2030
Veolia’s differentiating factors:
Access to the waste feedstock
0.32
Strong know-how on waste and on the recycling process
Global footprint
0.07 Relationships with brands (partnerships signed with Danone, Unilever,
Nestlé, Reckitt Benckiser, etc.)
2014 2019 2023 Strong growth ambition, sustained by the development
of our recycling platforms in Europe and in Asia
33WASTE RECYCLING AND RECOVERY: PLASTIC RECYCLING
PET RECYCLING PLANT FOR DANONE IN INDONESIA
Design, build and operate a plant to produce food grade
recycled PET
Supply contract with Danone and other global brands.
Transformation margins secured (selling price based on
transformation costs)
Plant capacity: 25 kt/year
Avoided emissions: 28 kt CO2e/yr
Capex: ~€20M, annual revenue ~€30M
Commissioning in Q1 2020. Trial operation in February 2020.
1st rPET to Danone expected in April 2020
34WASTE RECYCLING AND RECOVERY: RDF ENERGY
SIGNIFICANT DEVELOPMENT PLANNED IN EUROPE
Current presence in RDF preparation and/or
production of energy
x Number of “RDF to energy” projects already EXAMPLE: PROJECT WITH SOLVAY IN FRANCE
identified in the development plan (some of
them under an AssetCo/OpCo scheme) “DOMBASLE ÉNERGIE”
Client context
Solvay’s soda ash plant located in Dombasle (Fr.) is using coal
to produce the steam necessary for the process
Solvay has decided to launch a project to phase out coal (energy
2 transition)
2
2 Veolia’s game-changing project
1
Replacement of the 3 coal-fired boilers with a cogeneration plant
4 fueled with RDF: 350 kt of RDF/yr to produce 180 MW steam
CO2 emissions divided by 2, and drastic reduction of the water
consumption currently used to feed the coal-fired boilers
Total investment: ~€180M
Target to start-up in 2022(1)
(1)
Investment decision pending formal approval of the support mechanisms from the French authorities, and the required permits
35DEVELOPING ENERGY SERVICES FOR BUILDINGS
TO HELP OUR CLIENTS HARNESS ENERGY EFFICIENCY AND AVOID GHG
FOCUSING ON ENERGY EXAMPLE:
PERFORMANCE CONTRACTS RECENT RETROFIT BY ENOVA (MIDDLE-EAST)
Leveraging a strong know-how in energy efficiency... First-ever retrofit project awarded (in 2019) by Tarshid, National
… and in digital solutions enabling to commit on Energy Services Company in Saudi Arabia. Goal: to cut and guarantee
guaranteed savings through: the energy use reduction of SASO’s (Saudi Standards, Quality and
Metrology Org.) government facility by more than 30%
Hubgrade: smart center to monitor, control Hubgrade to drive control and reporting needs, and help identify
and optimize resource consumption in real-time savings opportunities
IoT technologies An innovative range of Energy Conservation Measures (ECMs)
implemented, leveraging the group’s expertise:
Predictive operations and maintenance Installation of a Building Chiller Management System to optimize
the building services of the complex (11 buildings)
Replacement of ~14,500 conventional light bulbs with LEDs
IoT technologies to improve air quality and thermal comfort
Electricity savings: > 6 GWh/yr
Avoided emissions: 5 000t CO2e/yr
36INDUSTRIAL ECOLOGY: CIRCULAR ECONOMY & INDUSTRIAL PARKS
NESTE AND BOREALIS IN FINLAND
Client context
The Kilpilahti complex, near Porvoo in Finland: the largest petrochemical center in Nordic
countries
Clients’ need: modernize the installations that supply steam and other process utilities
to two energy-intensive sites: Neste’s refinery, and Borealis’ petrochemical plant KILPILAHTI
Veolia’s solution
Design, finance build, own and operate a brownfield utilities plant to supply steam, heat,
electricity, demineralized water and compressed air:
4 new steam and power generation assets with an installed capacity of
450MW thermal and 30MW electrical
Circular economy loop: the by-products of the refining process (incl. asphaltene)
represent 80% of the primary energy needed
The resulting new power plant complies with the latest environmental regulations,
including the European Commission's Industrial Emissions Directive (IED)
Total investment: ~€400M (AssetCo/OpCo model)
Operation by Veolia for 20 years from 2018 (~€350M cumulated revenue)
37OPTIMIZE & DEVELOP:
CRITERIA AND PRIORITIES
BUSINESSES INVOLVED
CRITERIA Municipal water
Strengthen and streamline our existing portfolio: governance, digital, consumer focus,
innovation
Traditional activities Seize the new opportunities which are appearing on the market: privatisations
where Veolia is the
Water technologies & services
global leader and with
Standardise technologies
growth potential
(revenue and returns): Develop recurring services to clients from our installed based of technologies, and mobile
solutions
more efficiency,
innovation,
digitalization, Industrial & Commercial waste collection; solid waste treatment
differentiation... C&I collection: a key activity to access waste resource and develop circular economy
solutions, to be transformed and streamlined
...and which can be
Landfilling & incineration: capture growth opportunities, mainly in Latam and Central &
leveraged as “hubs” to Eastern Europe
grow new businesses
District heating and cooling Networks
Convert coal-fired assets by 2030 (Europe)
Seize development opportunities
38MUNICIPAL WATER
OPERATIONAL EFFICIENCY, DIFFERENTIATION, INNOVATION
Digital Operations
At stake: Hubgrade: improved access to
information, enhanced communication
Maintain our competitive edge with clients and better control of water
systems including water quality
Renew our contracts and capture new opportunities, mostly in Europe, Japan, tracking, emergency management and
predictive maintenance
Australia, Middle-East, Latin America
Examples
Key actions: Czech Republic, decrease in non-
revenue water by 6 points in 5 years,
Continued efficiency equivalent to ~€1M/year
Pudong Shanghai, decrease in non
Maximize the profitability of each contract revenue water by 8 points in 5 years,
Develop new services, digitalize operations and customer service equivalent to €1.6M per year
Re-invent our relationship with the consumers
Growing influence of consumers in the political decisions Digital Customers
Importance of service quality perceived by the consumer: “taste” of water, scaling,
Smart payment: fast, secure and
customer experience, etc seamless payment for customers
by collecting water or heat fees
through mobile payment app
Reinforce our leadership and differentiation through innovation (WeChat, AliPay)
Governance schemes Example: China, increase in collection
fee; app now reaching ~50% of total
Solutions to the new health issues (micro pollutants, endocrine disrupting chemicals) payment methods, saved 6
and to adapt to climate change (re-use, flood prevention, crisis management) headcounts
New sludge treatment solutions
39MUNICIPAL WATER
FRENCH WATER TURNAROUND SUCCESSFUL
EFFICIENCY Digitalization of operations, of commercial prospection, and production of offers
Account management and renewing existing contracts with upsides
e.g.: + €50M additional revenue over the last 2 years on the existing portfolio
Energy efficiency in wastewater treatment plants
e.g.: 4% energy saved in 2019 on our wastewater treatment plants
(~€150M power purchased per year)
RELATIONSHIP “La relation attentionnée”: program aimed at making every moment of the customer
WITH CONSUMERS journey a positive experience, by committing to renewed promises on the
fundamentals of the water service
LEADERSHIP AND New governance schemes: Bordeaux, Nîmes, Valenton
DIFFERENTIATION Innovative business models, eg. service contracts with revenue based on KPIs
THROUGH INNOVATION Developing new offers: prevention of floodings, crisis management, treatment of hard
water, treatment of new pollutants, etc.
VERY WELL ON TRACK TO ACHIEVE MORE THAN €100M CURRENT EBIT IN 2020
WILL CONTINUE ON A SUSTAINED PROFITABILITY INCREASE
40COMMERCIAL WASTE COLLECTION, SOLID WASTE TREATMENT
EFFICIENCY, DIGITALIZATION, AND GROWTH
Digital Customers
Customer Hub: a self-service platform
C&I waste collection: a key activity to secure feedstock for customers to access their
documents electronically, get live
in our recycling or RDF* plants. reporting of their contract at any time
on any device and use live chat as a
Objectives: increase efficiency, customer focus, digitalization preferred communication channel
Example: UK, used by 50,000+ clients,
Optimize waste flows: the right ton, at the right place, and at the right price €700K savings
Pricing strategy based on the quality of materials / fuel
Optimize costs: logistics, fuel, fleet maintenance
Customer focus via digital & real time data
Develop new services: digital platforms for waste management
Digital Offers
Solid waste treatment (landfilling, incineration): Wastebox: intelligent platform that
matches producers and buyers
Seize a few growth opportunities, mainly in Latin America and Central & (Veolia BUs and third parties) in the
Eastern Europe construction waste market to deliver
service at optimised price and
Improve efficiency of our treatment facilities: biogas capture from our schedule. Invested in Pink Robin
startup
landfills, energy production from incineration units or landfills Example: piloted in Germany and
planned roll-out in other European
countries
*Refuse derived fuel
41DISTRICT HEATING & COOLING NETWORKS
CONVERT FROM COAL AND INNOVATE AROUND OUR CORE ASSETS
At stake:
Reduce GHG emissions of coal-fired assets
Growth opportunities in Central & Eastern Europe, Asia
Digital Offers
Key actions: Power Grid Forecast and Frequency
Market: predictive algorithm for the
By 2030, replace coal with gas or renewable energies in Europe energy production of our plants
(RDF, biomass): enabling to optimise electricity sale to
the grid and generate efficiency for
Ongoing investments in Braunschweig (Germany) operational teams
Example: In the UK, extra revenues
Transform involved assets in Poland and Czech Republic
generated with our waste-to-energy
plants:
Seize development opportunities €0.8M/yr
A few interesting networks: growth potential and not coal-fired
Build around our existing asset base
“Ancillary services”, electric flexibility, energy storage
Develop small heating and cooling networks
University campuses, hospitals, ecodistricts, buildings
*Refuse derived fuel
42DISTRICT HEATING & COOLING NETWORKS
CONVERT COAL IN GERMANY: CITY OF BRAUNSCHWEIG EXAMPLE
Objective
Support the city of Braunschweig in its energy transition
BRAUNSCHWEIG
Veolia’s solution
Transform the coal-fired district heating network to reduce CO2 emissions: replace 1 coal
fired cogeneration unit with cogeneration units using waste wood and gas as fuels
Renewed concession contract, from 2020 to 2040 (20 years):
€210M total investment, €30M incremental EBITDA, with full impact from 2023, on top
of the secured EBITDA of the previous contract
Starting 2022:
800 000 MWh/year: heating provided to approximately 68.000 housings
50% of heating generated from biomass cogeneration
the rest being generated by a high efficiency gas turbine cogeneration unit
and gas boilers
550 000 MWh/yr electricity, 25% of which is green electricity
86,000 t/yr of coal avoided and replaced by 180,000 t/yr of waste wood
CO2 emissions reduced by 61%: 270.000 tons of CO2 emissions eq. cancelled every year
43REDUCE:
CRITERIA AND PRIORITIES
CRITERIA MATURE BUSINESSES
Some geographies / activities in mature markets, with limited growth or return
prospects, and with better alternative shareholders than Veolia
1st example: District Heating in the US
Mature businesses,
with limited growth
OTHER BUSINESSES TO DOWNSIZE OR DIVEST
and return potential
Businesses with Construction of water treatment infrastructures
limited room for Opt for partnerships with civil engineering companies to whom we bring the technological
component of projects, and no more civil engineering risks
differentiation and
impact, and which Municipal waste collection
If not associated (directly or indirectly) with treatment or recycling
cannot seed locally
new value added Coal-fired district heating networks
activities Conversion to clean energies by 2030
Facility Management
When the scope is limited to operation or maintenance vs. performance-based contracts
44VEOLIA WATER TECHNOLOGIES:
A NEW POSITIONING
PROJECTS KEY FOCUS: TECHNOLOGIES AND SERVICES
Design (Construction) Technologies Services
Out of the VWT Supply of standard /
scope packaged equipment
VWT to position Ex: ultrapure water
itself only as a co- for laboratories - Elga
contractor or a
subcontractor with After sale services on Mobile units
- Design of waste water civil engineering equipment installed
treatment solutions companies Supply of
...focusing on selling our VWT to focus on technologies for
technologies without technologies and industrial water
being exposed to services processes
construction risks e.g.: evaporation
→Smaller projects concentration
but higher margins systems - HPD Sale of chemicals Digital Services
to treat water
Digital Offers
Aquavista: provide customers with performance and compliance
KPIs, alarm management, remote optimisation and expert advice
on asset performance of water treatment facilities
Example: Veolia Water Technologies, 25% reduction in energy use
and 30% improvement in effluent quality, estimated €15M
revenues p.a. in 2021
45VEOLIA WATER TECHNOLOGIES:
TRANSFORMATION PLAN
KEY ACTIONS VWT - REVENUE PROJECTIONS (€BN)
1. Projects: be highly selective, and eliminate construction risks
VWT in partnership (co-contractor or subcontractor) with civil engineering €1.6bn
companies
VWT only looks at projects:
o with a strong content of technologies that are present in Veolia’s ~€1.2bn
portfolio
o where country risks and contractual risks are limited and manageable
In 2023, the activity will be limited to a few desalination projects
and some small projects (without construction)
2. Develop technologies and recurring services
Technologies: innovation, standardisation
Services: after sales, digital offers, sales of chemicals or spare parts, mobile
units, which generate long-lasting recurring revenues after the sale of the
equipment
In 2023: ~ 50% of services in the total revenue mix, hence a less cyclical
business
3. Adjust VWT’s overheads & fixed costs to the revenue decrease
Reduction of the number of countries
Streamlining of structures, closing of some entities
46STRONG SELECTIVITY
ON ACTIVITIES WHERE VEOLIA HAS A LIMITED ADDED VALUE
SELECTIVITY CRITERIA
Contracts with no direct or indirect link with waste treatment and
tons destination
Municipal Contracts where investments are to be funded by Veolia
waste Contracts which combine collection and treatment (eg. PFIs in UK,
collection some municipal waste contracts in Latam, etc.)
Contracts with specific barrier to entry (eg. performance-based in
France / “redevance incitative”)
Pure facility management
Facility Performance-based contracts (Veolia’s revenue partly based on the
management performance achieved, eg. energy efficiency)
~€200 TO 400M ANNUAL REVENUE DECREASE ON THESE ACTIVITIES BY 2023
47IMPACT 2020-2023
STRATEGIC ORIENTATIONS SUMMARIZED BY BUSINESS
Municipal water and Public Private Partnerships: continue efficiency efforts to maintain our
Water competitiveness, seize new opportunities, pursue differentiation in our offers (innovation, governance,
relationships with consumers)
Exclude the construction risk in Design & Build projects and focus on sales of standard technologies &
associated services
Grow plastic recycling and RDF production, enhance operational efficiency on our facilities and roll-out
Waste best practices, optimize C&I collection notably with digitalization, and reduce our exposure to municipal
waste collection (when it has no direct or indirect link with treatment/ recycling)
Hazardous waste: accelerate our development, by growing our network of treatment facilities on existing
geographies and by opening new countries
Energy Transition from coal to clean energies on existing district heating networks, and capture the new
opportunities in Europe
Continue to grow our energy efficiency services for buildings: digital, performance contracts
Water, waste, Focus on highly differentiating services which help clients reduce their environmental footprint: water for
energy for
industrial clients industrial processes, industrial ecology, performance contracts
48IMPACT 2020-2023
TRANSLATING OUR STRATEGY INTO PROFIT
GROWTH Strict discipline to select growth projects and M&A
o Systematic review of projects through investment committees, with HQ support functions
involved
o Strict investment criteria: IRR > WACC + 4%, ROCE > WACC after 3 years, payback < 7 years
Priority to integration and synergies
o Strict and thorough integration process
o Systematic post acquisition review and action plans
Opportunistic divestitures of mature assets, to reinvest in faster growing businesses
Secure the plan
o Stop construction activities
A continued high level of efficiency gains
EFFICIENCY
€1bn of savings over 4 years
3 pillars: Operational efficiency, Purchasing, G&A, with a reinforcement and a deepening
of our actions throughout the Group with new levers (e.g. digital)
49EFFICIENCY PLAN:
AN AMBITIOUS TARGET
COST SAVINGS SINCE 2012 2020-2023
€M €250M/year
302 €1bn over 2020-2023
245 255 248
200
G&A
per year 156
55% Purchasing
103 115
38 141 Operations
60
86 89 97
30%
72
102
56 51 49 15%
35
2012-2015 2016 2017 2018 2019 2020-2023
50EFFICIENCY PLAN
OPERATIONS (1/2)
1. WORK ON UNDERPERFORMING 2. PEER REVIEW
CONTRACTS OR SITES
Action plans “up or out”: Benchmark of performance on 6 priority assets
o Profitability analysis Solid waste Drinkable water Heating production in
o Quarterly review of progress incineration distribution DHN
Availability rate Network efficiency Energy efficiency
Cumulated EBIT (illustrative) Hazardous waste Wastewater treatment Cogeneration
incineration Electricity Energy efficiency
Availability rate consumption
Crossed internal audits on major assets
Minimum Continuous improvement plan for the other
required
assets, leveraging best practices. Example:
Contract by contract margin in order of increasing profitability
Action plans may include:
o Contract renegotiation, add new services
o Cost cutting, enhancement of performance
o Industrial restructuring, site closure Production hours Non production hours, non scheduled
Production stoppage due to planned maintenance
51EFFICIENCY PLAN
OPERATIONS (2/2)
3. DIGITALIZATION
Hubgrade: supervision centers at country/ region level, regrouping
real time data on key sites and contracts
Digital operations
6 supervision centers in 2015, 56 today, ~100 by 2023 Hubgrade
Example - Italy, energy efficiency:
4 Hubgrade centers in Italy
Now covering all 6 categories of key assets in the group 450 connected sites (2.000
o Water network management, waste water treatment plant targeted in 2021)
For 7 hospitals, ~5% of energy
o High temperature incineration, solid waste incineration savings since the rolled out:
o Energy efficiency for buildings, combined heat and power €0.9M for Veolia
generation
Maintenance and asset management
Example: VWT sensors for reverse osmosis membranes
Target: increase production by 30%, and membrane lifetime to 8
years vs. 3-5 years currently
52EFFICIENCY PLAN
PURCHASING AND G&A
PURCHASING G&A
Target: min 1% of purchasing savings Target: maintain G&A constant despite revenue
(Capex and Opex on addressable cost base) in all growth and a challenging context (increase of
BUs compliance, legal, cybersecurity costs…), hence
o e.g.: collection trucks, cars
reduce the G&A/revenue ratio
Specific focus on subcontracting
Reduction in the number of suppliers Examples of levers:
Work on specifications and new categories covered o Reduce IT and real estate spending
by global contracts
o Digital tools
o e.g.: light vehicles contracts in Europe to
generate €9M savings by 2023 o e.g.: stop paper invoicing, automatisation of
o e.g.: collection trucks, new contract to deliver certain administrative tasks thanks to machine
€2M savings by 2023 learning, and collaborative tools
o e.g.: yellow plants contract under way o Specific plans in some BUs: North America,
Use digital: marketplace for “small categories” Waste France, VWT
53DIGITAL TO HELP DELIVER
EFFICIENCY AND GROWTH
Digital Employees Digital Customers Digital Operations Digital Offers
Pillars
Simplifying the life of our Enhancing customer Optimising our Enhancing existing offers
employees experience operations and creating new ones
Improving sales Monitoring KPIs Platform to match
Flexible / agile offer and demand of
efficiency Optimising asset
working our services
Providing visibility performance
Collaborative culture Services leveraging
and simplify Digital field
Embarking everybody the Hubgrade
Objectives
interactions with operations
in digital concept: performance
customers Asset Management
Central functions without O&M
Providing visibility & Maintenance
efficiency Service “just in time”/
and simplify Safety
interactions with end- responding to
consumers emergencies
Selling more Revisiting business
models
KPIs
Employee engagement Net Promoter Score Efficiency Number of innovations
included in new contracts
542020-2023: INNOVATION Olivier Brousse, EVP, Strategy & Innovation
VEOLIA’S PURPOSE:
“TO CONTRIBUTE TO HUMAN PROGRESS”

                      Climate
                      change

                                     Resource
                                     depletion
                                                  Through its activities
Rising demand                                      in water, waste, and
  for energy                                       energy, Veolia is having
                                                   a positive impact on the
                                                   planet and its inhabitants

                                    Pollution
                                                  How to contribute more?

                Population growth
                 & urbanization

                                                                                56
VEOLIA CAN HELP TO ADDRESS
6 GLOBAL CHALLENGES
HEALTH & NEW NEW LOOPS NEW ENERGY
POLLUTANTS OF MATERIALS SERVICES
ADAPTATION TO NEW DIGITAL
FOOD CHAIN
CLIMATE CHANGE OFFERS
INNOVATION WILL ENRICH & BOOST THE CURRENT PORTFOLIO,
AND CREATE NEW SOLUTIONS TO MEET ESSENTIAL NEEDS
57CREATING SOLUTIONS FOR FUTURE ESSENTIAL NEEDS
HEALTH & NEW POLLUTANTS
CHALLENGE: ENABLING PEOPLE TO LIVE IN A HEALTHY ENVIRONMENT (CLEAN AIR, WATER, SOIL)
POLLUTION, A MAJOR AND INCREASING HEALTH ISSUE... ...THAT VEOLIA IS TACKLING
Environmental pollution: 9 million premature deaths Example: Indoor Air Quality
worldwide in 2015* (6.5M due to air pollution, as much as Veolia’s goal: to guarantee a clean air in buildings
tobacco-related deaths, 1.8M to water pollution, and 0.5M (CO2, fine particles, etc.)
to soil pollution)
More than 90% of the world inhabitants breathe a polluted air Solution
Monitor continuously the indoor air quality
Filter and control the pollutants
Involve the stakeholders in improving air quality
Trial in progress in Le Raincy, France
Pilots in 2 schools (600 pupils):
28 sensors
18 filtration equipment installed
For 300 Rupees (~€4), customers at a bar in New Delhi can Predictive modelling, real-time monitoring, and
get access to 15 minutes of fresh air building awareness among teachers & pupils
*Source: The Lancet (2018)
58CREATING SOLUTIONS FOR FUTURE ESSENTIAL NEEDS
FOOD CHAIN
CHALLENGE: CONTRIBUTING TO FEEDING AN EXTRA ~1.5BN PEOPLE WITHIN 20 YEARS
WITH LESS WATER, ENERGY AND SOIL
THE GLOBAL FOOD CHALLENGE EXAMPLE OF SOLUTIONS
Population growth: 1 more “China equivalent” by 2040 From organic waste to fertilizers and
Global demand for animal proteins expected to double by proteins
2050 Using organic waste and insects to
Agriculture: 70% of current global water demand produce oil, proteins for animals and
Development of livestock farming: organic fertilizers
o Increasing GHG emissions, water and soil Projects under development in France
exploitation and in Asia
o Only 55% of calories harvested in the world feed Promising early results, e.g. for
people directly; 36% are used to feed the livestock aquaculture, which provides half of the
fish consumed worldwide
Urban farming: another way to feed cities
Urban aquaponic farms
Intensive organic micro market gardening
(permaculture)
59CREATING SOLUTIONS FOR FUTURE ESSENTIAL NEEDS
ADAPTATION TO CLIMATE CHANGE
CHALLENGE: HELPING OUR MUNICIPAL AND INDUSTRIAL CLIENTS ANTICIPATE
AND MANAGE ENVIRONMENTAL DISORDERS
THE NEW CLIMATE REALITY EXAMPLES OF SOLUTIONS
Flood control
Hurricane Sandy (2012)
Crisis management
$65bn damage in the US
Mobile solutions for water and wastewater
Water shortage in South Africa
Q1 2018: the Cape Town area
(4M inhab.) close to run out of water
Wildfires in Australia (2019-2020) Water reuse
2x Belgium surface destroyed Urban refreshment islands
Air quality, biodiversity impacted Microgrid or local energy networks powered by cogeneration to
secure the energy supply should the city network fail
602020-2023: FINANCIALS Claude Laruelle, CFO
VEOLIA BUSINESS MIX
11 GEOGRAPHIES ORGANIZED IN 4 REPORTING SEGMENTS
                                                                             CENTRAL EUROPE
GLOBAL BUSINESSES                                                               €3 296M
€4 734M                                                  NORTHERN EUROPE
                                                             €2 738M

                                               UK & IRELAND
                                                 €2 298M

                                        FRANCE
     NORTH AMERICA                   WASTE: €2 608M
        €2 168M                      WATER: €3 004M
                                      ITALY & IBERIA
                                         €1 169M
                                                                                                      ASIA
                                                                                                    €2 135M

                     LATIN AMERICA
                         €853M
2019 Revenue
€27.2bn

171 000
                                                       AFRICA/ MIDDLE EAST        AUSTRALIA & NEW ZEALAND
Employees in 11 zones                                        €1 060M                      €1 087M

                                                                                                              62
VEOLIA 2016-2019 BUSINESS MIX EVOLUTION
2016-2019: CONTINUED SOLID REVENUE GROWTH DRIVEN BY INTERNATIONAL AND INDUSTRIAL CLIENTS
BY GEOGRAPHY BY MARKET
CAGR at constant FX CAGR at constant FX
CAGR 2015-2019
CAGR 2015-2019 +3.6%
+3.6% 27.2
27.2 25.9
Revenue, €bn 24.8
25.9 23.8
23.8 24.8 4.8
4.7 -0.8%
4.6 (17%)
4.6 (18%) 13.1 +5.0%
Global businesses (18%) 12.1
(19%) 11.4 (48%)
Industrial 10.8 (47%)
7.3 (46%)
6.6 +6.8% (45%)
6.3 (27%)
5.7 (26%)
Rest of the world (26%)
(24%)
9.2 9.5
8.1 8.5 +3.2%
Europe excl. France (35%) (35%)
(34%) (34%) 13.8 14.1
13.0 13.4
(54%) (53%) (52%) +0.9%
Municipal (55%)
France 5.4 5.4 5.4 5.6
(23%) (22%) (21%) (21%) +0.6%
2016 2017 2018 2019 2016 2017 2018 2019
63VEOLIA 2014-2019 BUSINESS MIX EVOLUTION
CONTINUED INCREASE OF INTERNATIONAL SHARE OF REVENUE AND EBITDA IN 5 YEARS
2014 REVENUE €24.4bn 2019 REVENUE €27.2bn
17% 21%
20% 23%
22%
Continued increase of
35% 27%
International 35%
Revenue and EBITDA
from 2014 to 2019
2014 EBITDA €2 762M 2019 EBITDA €4 022M
France
Rest of Europe
Rest of World 10%
8% 23%
Global Business
30%
26%
29%
36%
38%
64VEOLIA 2011-2019 BUSINESS MIX EVOLUTION
TRIPLING OF HAZARDOUS WASTE SHARE OF REVENUE IN 8 YEARS
2011 REVENUE 2014 REVENUE 2019 REVENUE
€29.6bn €24.4bn €27.2bn
19% 22%
25% 30% 31% 31%
6%
3% 9%
10%
12% 29% 15%
30% 28%
Water & Waste water Technology & Construction 2019 EBITDA:
Waste Hazardous Waste €4 022M
Energy
20%
Hazardous Waste Revenue tripled
40%
from 2011 to 2019, to €2.5bn 12%
… and enjoys a 20% EBITDA margin 4%
24%
65FINANCIAL TRAJECTORY 2020-2023
CONTINUED SOLID REVENUE GROWTH
1. CONTINUED SOLID ORGANIC GROWTH
High level of contract renewal
Pursuit of good commercial momentum
Capital allocation focused on fast growing activities, mostly outside France
2. COMPLEMENTED BY SMALL AND MID SIZE ACQUISITIONS
Small to mid size targets
Continued strict financial discipline
Value creation through asset rotation
66FINANCIAL TRAJECTORY 2020-2023
CONTINUED SOLID REVENUE GROWTH
TRENDS BY CLIENT TRENDS BY GEOGRAPHY TRENDS BY BUSINESS
2019 2019 2019
REVENUE REVENUE REVENUE
€27.2bn €27.2bn €27.2bn
4.7 - 5.9 +
52% 48% ++
+ 2.5
7.3
7.7 +
9.6 + 2.8 -
48% 52%
8.3 +
5.6 =
2019 2023
France Water & Waste water Technology & Construction
Industrial & Tertiary Clients Europe excl. France Waste Hazardous Waste
Municipal Rest of World Energy
Global Business
67FINANCIAL TRAJECTORY 2020-2023
NO MAJOR CONTRACT RENEWALS BEFORE 2022
The Group’s 38 largest contracts represent €4.1 billion in revenue, or 15% of revenue
Average duration: 10 years
Contract expiration schedule (>€50M annual revenue)
699
572
497
357
300
211
165 185 167
111 113 108 107 114 111 120
74 52
2020 2021 2022 2023 2024 2025 2026 2027 2028 2029 2030 2031 2032 2033 2036 2039 2040 2041
68FINANCIAL TRAJECTORY 2020-2023
EBITDA TARGET OF €4.7-4.9BN(1) IN 2023
KEY DRIVERS EBITDA GROWTH
Continued solid revenue growth
€4.7- 4.9bn(1)
€250M of cost cutting annually
o Target retention rate: ~40% €4bn
EBITDA growth to come:
o 50% from revenue growth and asset rotation
o 50% from efficiency gains
2019 2023
(1) At constant FX (based on rates at the end of 2019) and at constant IFRS & in an economic environment without major change
69FINANCIAL TRAJECTORY 2020-2023
A REGULAR BOND REPAYMENT SCHEDULE
1400
RATING
1200 Moody’s: P-2/ Baa1 stable outlook
Standard & Poor’s: A-2 / BBB stable
1000 outlook
800
600
400
200
0
2020 2021 2022 2023 2024 2025 2026 2027 2028 2029 2030 2031 2032 2033 2034 2035 2036 2037 2038
EUR GBP USD CNY
70FINANCIAL TRAJECTORY 2020-2023
COST OF FINANCING EXPECTED TO DECREASE BY 2023
Scheduled bond redemption to contribute to decrease cost of debt in euro
o 40% of Euro bonds to be refinanced by end-2023
o 2021 & 2022 bond refinancing to generate significant savings
…partly offet by non euro cost of financing (Asia, Latin America, US…)
Overall expected cost of financing to decrease by 2023
Debt maturity: 6.9 years
94% Fixed rate
71FINANCIAL TRAJECTORY 2020-2023
TAXES : FULL BENEFIT OF TAX LOSS CARRY FORWARDS
Tax efficiency taken into consideration to structure new projects and tuck in acquisitions
Favorable resolution of the tax litigation in the US:
o Additional potential recognition of more than $2bn of tax loss carry forwards (more than
$400 million in tax) to be utilized by 2026.
French tax loss carry forwards
o Additional potential recognition of ~€400 million in tax, with no time limit of utilization
On going optimization of legal entities
CURRENT TAX RATE BELOW 25% OVER THE DURATION OF THE PLAN
72FINANCIAL TRAJECTORY 2020-2023
CONTINUED STRONG CURRENT NET INCOME GROWTH: ~€1BN(1) TARGET IN 2023
KEY DRIVERS CURRENT NET INCOME GROWTH
EBITDA growth leads to current EBIT growth ~€1bn(1)
with D&A slightly up over time
Cost of financing expected to decrease: lower €760M
euro financing cost partly offset by increased
cost and volume of non-euro denominated
debt
Tax rate < 25% thanks to French and US tax
loss carry forwards
2019 2023
(1) At constant FX (based on rates at the end of 2019) and at constant IFRS & in an economic environment without major change
73CAPITAL ALLOCATION 2020-2023
KEY TAKEAWAYS
€5bn €2bn
net investments over 4 years
Industrial & financial investments
to develop new projects ~€500M
(“Accelerate” and “Optimize & develop”) /year in average
~40% in Europe (incl. France) Leverage ratio < 3x
~60% in the rest of the world €3bn
~65% for industrial clients
~35% for municipal clients Divestments
(“Reduce”)
~40% organic growth
~60% external growth Portfolio rotation: ~20% of the
Group’s Capital Employed
Assets involved already identified
€1bn already achieved (district
heating in the US)
74CAPITAL ALLOCATION 2020-2023
CONTINUED STRICT FINANCIAL DISCIPLINE
STRICT INVESTMENT CRITERIA FINANCIAL HEADROOM
BUs must submit to the Group Investment Leverage at 2.66 end 2019 including IFRS 16 impact
Committee all projects above/ below €10M EV and
Small and mid size M&A
€20M capex
Using the extra cash flow generated
Tightening of the decision process And Asset divestiture reservoir
Leverage < 3 over the duration of the plan and well
Group’s IRR ≥ WACC + 4% below 3 in 2023
ROCE ≥ WACC (from end of 3rd year)
Leverage ratio
Pay-back < 7 years 3
Focus on strategic businesses
Alignment with ESG commitments 2
2019 2020 2021 2022 2023
75CAPITAL ALLOCATION 2020-2023
CAPEX TRAJECTORY: €2BN OF DISCRETIONARY CAPEX
Average Average
In €bn Variation
2018-2019(1) 2020-2023(1)
Maintenance Capex including IFRS 16 1.1 1.0 - 1.1 Stable
Contractual Capex 0.7 0.7 - 0.8 Stable
Coal conversion capex 0 0.1 New
Discretionary Growth Capex 0.3 0.5 - 0.6 +50% to +100%
TOTAL(1) 2.1 2.3 - 2.6
CUMULATED €2BN DISCRETIONARY GROWTH CAPEX OVER 2020-2023
50% INVESTED IN HAZARDOUS WASTE
(1) Including IFRS16
76FREE CASH FLOW GENERATION 2020-2023
CONTINUED WORKING CAPITAL OPTIMIZATION
WCR TRACK RECORD 2016-2019 KEY ACTIONS 2020-2023
Cash Flow generation monitored by Business
WCR improvement Unit / Business Line
(cash resource)
o Focus on DSO improvement
268
209
New initiative on Working capital
112
60 o New tools for cash collection (e.g. my DSO)
o Improve invoicing process
2016 2017 2018 2019
o Review Purchase to Pay process
77CONTINUED STRONG FREE CASH FLOW GENERATION
FCF GENERATION OVER 2020-2023
Discretionary capex of €270M per year >€4bn
on average from 2016 to 2019
~€500M per year from 2020 to 2023 FCF before discretionary capex
Net FCF after discretionary capex
>€2bn
FCF before discretionary capex > €4bn
cumulated over the duration of the plan
FCF after discretionary capex > €2bn
cumulated over the duration of the plan
2019 Cumulated 2020-2023
78STRONG VALUE CREATION
CONTINUED IMPROVEMENT OF ROCE BY 2023
AFTER TAX ROCE KEY DRIVERS
9.0%
8.8% Operational efficiency
8.4% 8.4% IFRS 16
7.9%
7.4%
Current EBIT growth
IFRIC 12
Focus on capital efficiency
6.8%
5.5%
Low tax rate
5.0%
2013 2014 2015 2016 2017 2018 2019 2019 post 2023
IFRS16
79DIVIDEND: €1.30 IN 2023
+80% €1.30
in 8 years
€1.00
37% growth of dividend
from 2016-2019 €0.92
€0.84
€0.80
€0.73
A sustainable and
disciplined dividend policy
2015 2016 2017 2018 2019 (1) 2023e
(1) Subject to approval of the AGM of April 22, 2020
80IMPACT 2023
KEY FINANCIAL TARGETS(1)
REVENUE Continued solid growth
EFFICIENCY €1bn cost savings over 4 years
EBITDA €4.7bn - €4.9bn in 2023
CURRENT NET INCOME GROUP SHARE ~€1bn in 2023
LEVERAGE RATIO < 3 x and well below 3 x in 2023
DIVIDEND €1.30 / share in 2023
(1) At constant FX (based on rates at the end of 2019), at constant IFRS & in an economic environment without major change
81You can also read