Plastic Pollution in the River Thames - RESULTS FROM CITIZEN SCIENCE SURVEYS: JANUARY 2015 TO DECEMBER 2019 - Thames21
←
→
Page content transcription
If your browser does not render page correctly, please read the page content below
Plastic Pollution
in the River Thames
RESULTS FROM CITIZEN SCIENCE SURVEYS:
JANUARY 2015 TO DECEMBER 2019
A.J McConville, Alice Hall, Emma Harrington, Kirsten Downer

                                                              Published June 2020   © Bill Green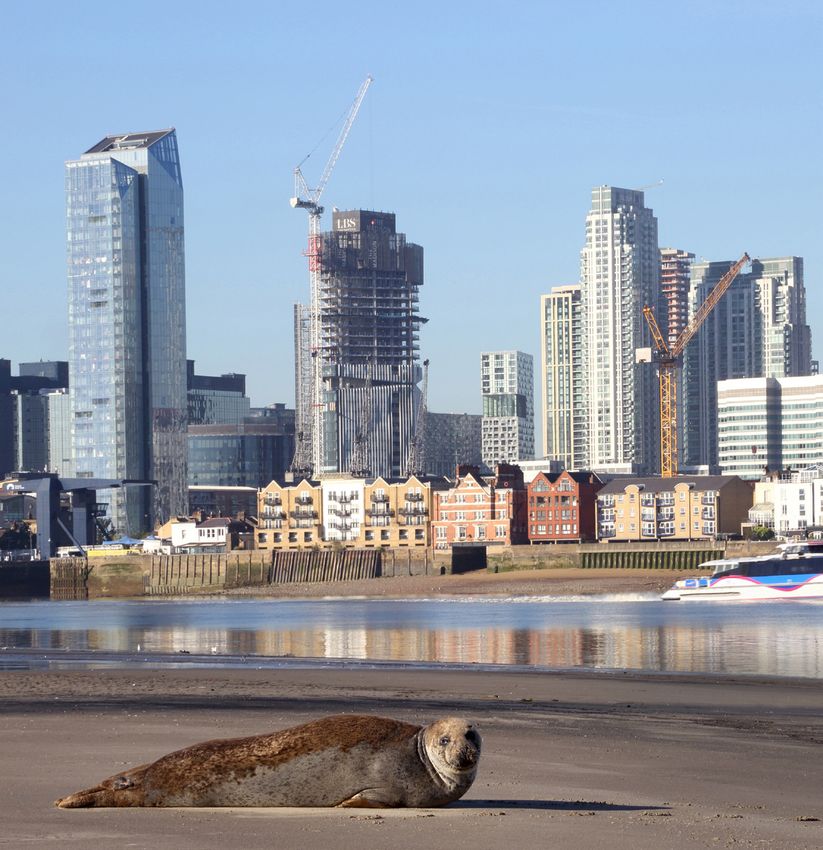
© Bill Green

CONTENTS
EXECUTIVE SUMMARY.......................................................................................................................................................................................... 3
      Key Findings.......................................................................................................................................................................................................... 3
      Recommendations............................................................................................................................................................................................. 6
BACKGROUND............................................................................................................................................................................................................ 8
      Waste items in the tidal Thames. ............................................................................................................................................................. 8
      Growth in single-use packaging and consumer items............................................................................................................... 9
SURVEY METHODOLOGIES ADOPTED TO RECORD PLASTIC ITEMS................................................................................... 11
      Transect surveys of the foreshore..........................................................................................................................................................11
      Bottle counting at key sites........................................................................................................................................................................14
      Records from waste clean-ups................................................................................................................................................................14
WHAT WE FOUND.................................................................................................................................................................................................. 15
      Wet wipe products are the most common item recorded.......................................................................................................15
      Single-use plastic items make up 83% of all items counted                                                                      ........................................................................................... 19

      Just five items represent nearly two-thirds of all lightweight identifiable plastic found. ...................................19
      Water bottles make up nearly half of all plastic drink bottles found...............................................................................20
      Precious intertidal habitats bear brunt of lightweight plastic..............................................................................................21
      Small plastic pieces are a significant but poorly understood issue on the Thames..............................................22
      Climatic factors appear to influence the quantity of items found......................................................................................22
GAPS IN KNOWLEDGE....................................................................................................................................................................................... 24
PUTTING THE DATA TO USE – WHAT’S NEXT?................................................................................................................................... 26
ACKNOWLEDGEMENTS. ................................................................................................................................................................................... 27

                                                                                                                                                                                                                                       2
Our rivers, oceans and wildlife are being overwhelmed by plastic waste, and microplastic is
    entering our food and water. Up to 12.7 million tonnes of plastic enter our oceans every year, and
    it’s estimated that 80% comes from land, likely from rivers1.

    Here in London, Thames21 and the Port of London Authority (PLA) remove at least 200 tonnes
    of waste from the Thames each year, much of it plastic. A recent survey found large amounts of
    microplastic in the Thames2. Yet there is no statutory monitoring of the impact plastic is having on
    UK rivers.

    Thames21 launched the Thames River Watch citizen science programme in 2014 to help close this
    gap. The programme trains Londoners to monitor plastic pollution and identify the most common
    plastic items, to help understand pollution sources and identify solutions. This report reviews that
    people-powered data, as well as rapid appraisal data and bathymetric foreshore surveys of the
    riverbed.

                                                                                                                                                                    © Thames21

KEY FINDINGS AND RECOMMENDATIONS
KEY FINDINGS                                                                              2. Over the same period, there has been a
                                                                                             discernible increase in plastic consumer
1. Over the past 20 years, the PLA and                                                       items and packaging in the river. Volunteer
   Thames21 annual ‘rapid appraisal’ boat                                                    effort alone cannot address the problem.
   surveys3 reveal a significant decrease in large                                           The flow dynamics of the river mean that
   immobile waste items (such as tyres, metal,                                               these items are deposited in particular areas
   bicycles) due to the huge Thames21 volunteer                                              of foreshore with two main types noticed:
   effort to clean up the river. These items return                                          sites that collect lightweight items which
   at a slow rate and are hence within the capacity                                          float on the surface of the water (such as
   of volunteer clean-up efforts.                                                            food wrappers and drink bottles) and those
                                                                                             that collect sinking items (such as wet wipe
                                                                                             products and bags filled with sediment).

1 Ocean Conservancy (2015) Land-based strategies for a plastic-free ocean. [Online]. [Accessed December 2019].
Available at: https://oceanconservancy.org/wp-content/uploads/2017/04/full-report-stemming-the.pdf
2 Bangor University and Friends of the Earth. 2019. Microplastic pollution widespread in British lakes and rivers - new study. [Press release]. [Accessed March 2019].
Available from: www.bangor.ac.uk/news/latest/microplastic-pollution-widespread-in-british-lakes-and-rivers-new-study-40043
3. Thames21 and PLA (unpublished data). Results of Rapid Appraisal Boat surveys                                                                                            3
© Thames21                                         © Michael Byrne

3. Wet wipe products, most of which contain           7. Water bottles represent almost half of all the
   plastic, are by far the most common item              drink bottles found in the Thames, making it
   recorded on the tidal Thames foreshore                the single most common type of drink bottle.
   in London. These products are physically              More people choosing tap water over bottled
   changing the shape and sediment type of               water would significantly reduce the plastic
   the foreshore. This phenomenon is found on            burden in the river.
   at least six sites inside river bends in west
   London and has only been observed in the           8. Precious intertidal habitats to the east
   past six years. Wet wipe products occur in            of London bear the brunt of lightweight
   very large densities at these sites – typically       plastic such as bottles and polystyrene. Of
   between 50 and 200/m2 on the surface of the           the total bottles recovered, 65% were found
   mounds. In Barnes, one mound has grown in             on saltmarsh and reedbed habitats outside
   height by 1.4m between September 2014 and             the city, compared to 33% from slipways and
   May 2019 and covers approximately 1,000m2             beaches in London (see Figure 1). These
   (equivalent to four tennis courts).                   reedbed habitats are key nursery grounds for
                                                         fish and already suffer from other pressures.
4. Single-use plastic items make up 83% of all
   counted items on the foreshore (excluding          9. Micro (< 0.5cm) and meso-plastics (
Figure 1. The main distribution of two important plastic items across the estuary
(April 2016 to December 2019)

Wet wipes and lightweight plastic characterise two key areas of the river

                                               The total number of bottles
                                            retrieved from Essex plus 10,950
                                                 from Erith Marches and
                                           Thamesmead. Bottles from rest of
                                                  Kent not yet included.
                                                                                        This is an underestimate as
                                                                                        litter is cleaned in summer

                                            65,236
                                                                                         by council but not counted

                                                                                                2,297
  29,486

                                                                          Concrete barges,
                                                                        Rainham. March 2017
                                                                          © Clive Webster

                                                                      Intertidal Habitats:
                                                               Precious intertidal habitats to the
                                                                east of London bear the brunt of
                                                             lightweight plastic, such as bottles.
           West London:
                                                               These key saltmarsh and reedbed
Wet wipe products are changing
                                                              habitats are already suffering from
 the shape and sediment type of
                                                             other pressures and are key nursery
   the riverbed in west London,
                                                                         grounds for fish
creating mounds inside bends of
   the river where water moves
   more slowly. This is a recent
  change, first observed in 2013

                                                                                                                  5
RECOMMENDATIONS                                                                       issue we don’t create new problems by simply
                                                                                      substituting one damaging material for another.
Much of the conversation around reducing plastic
pollution has focused on how members of the                                           We need to revolutionise the packaging system
public should change what they buy or better                                          as a whole, eliminate non-essential single-use
dispose of waste products. But the overarching                                        packaging and transition to a circular economy.
regulatory framework has the biggest impact on                                        Demand-management measures should be part of
reducing the scale of the plastic problem, from                                       the overall solution.
setting manufacturing parameters to establishing
a coherent waste management strategy.                                                 Thames21 has adopted a framework in order to
                                                                                      understand and communicate the process whereby
Efforts to reduce plastic pollution should not                                        items collect in the river and to establish where
detract from the need to first prevent waste                                          interventions are most effective (see Figure 2). In
generation, as dictated by the waste hierarchy.4                                      general, the higher up this chain an intervention
All materials have environmental consequences                                         takes place, the more effective it will be.
and it’s vital that in our efforts to tackle the plastic

Figure 2. The plastic waste pathway to the river:
Early intervention has most impact

                                                                   1. REGULATION
                                                    Government sets the legislative framework
                                                         for the life of the plastic product

                                                                2. MANUFACTURE
                                                   Manufacturers design and make the product
                                                     to contain (or be packaged by) plastic

                                                                   3. MARKETING
                                                        Product is promoted to increase sales

                                                                         4. RETAIL
                                                              Retailers sell the product.
                                                        Individuals decide to buy the product

                                                                      5. DISPOSAL
                                                     Individuals & companies discard it in such
                                                      a way that it escapes to the environment

4 Prevention, Re-use, Recycle, Other recovery, Disposal: see European Union (2010) Being Wise with Waste: the EU’s approach to waste management.
[Online]. [Accessed March 2020]. https://ec.europa.eu/environment/waste/pdf/WASTE%20BROCHURE.pdf                                                   6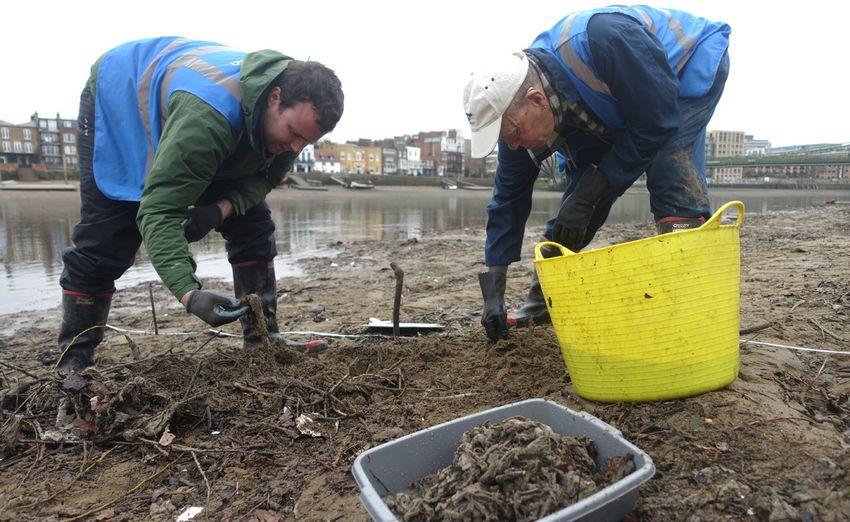
© Thames21                     © Thames21/Clearwater Photography

With these principles in mind, we propose the                        •   Innovate to reduce food wrapper packaging,
following recommendations for key stakeholders:                          which is particularly prone to breaking into
                                                                         microplastic, and make more of it recyclable.
The UK Government should:
• Establish standardised protocols for data                          Retailers (including bars/pubs) should:
   collection from litter picking events on                          • No longer sell wet wipe products and
   coasts, estuaries and rivers to provide reliable                     instead stock reusables, following the lead of
   statistics on trends over time, focusing on                          companies including Holland & Barrett and
   the quantity, composition and source of litter                       Selfridges
   items. This can build on work that is already                     • Switch away from single-use plastic cups to
   underway by the Rivers Trust, the Port of                            reusable ones following the example of Putney
   London Authority and Thames21 to standardise                         Business Improvement District
   data collection                                                   • Join the #OneLess campaign to help London
• Introduce statutory monitoring of rivers                              become single-use plastic water bottle free.
   and coasts to establish the success rate of
   measures to reduce plastic pollution                              NGOs and agencies should develop campaigns to:
• Set legally binding waste reduction targets to                     • Better communicate the link between street
   phase out non-essential waste items                                 litter, drains and our rivers to tackle the lack
• Give councils sufficient funding to collect                          of awareness amongst the public about the link
   street refuse and enforce existing laws                             between drains and local rivers
• Introduce strict standards on labelling to                         • Drive consumer behaviour towards waste
   require all single-use wet wipe products                            reduction, recycling and sustainable
   containing plastic to indicate this clearly on                      alternatives.
   the packaging; and to ensure that a ‘flushable’
   label cannot be applied to wet wipe products                      Individuals can help by:
   that contain plastic or persistent chemicals                      • Not flushing any products down the toilet,
• Introduce an ‘all-in’ Deposit Return Scheme                           even if the label claims it to be flushable:
   for bottles and cans paid for by manufacturers                       abide by the 3Ps (flush only pee, paper, poo)
• Eliminate polystyrene packaging by                                 • Downloading the Refill app to find their
   moving to recyclable plastic supported by a                          nearest refill point rather than buying water in
   comprehensive recycling system.                                      single use plastic bottles
                                                                     • Carrying cigarette butt pouches to carry butts
Manufacturers should:                                                   until they can be disposed of properly
• Improve labelling voluntarily on wet wipe                          • Joining their local campaign groups, such as
  and sanitary products to highlight that it is                         Thames21’s River Action Groups5
  damaging to flush them                                             • Joining Thames21’s Thames River Watch to
                                                                        help monitor plastic and learn how to lobby for
                                                                        change.6

5 https://www.thames21.org.uk/thames21-river-action-group/
6 https://www.thames21.org.uk/thames-river-watch/
                                                                                                                           7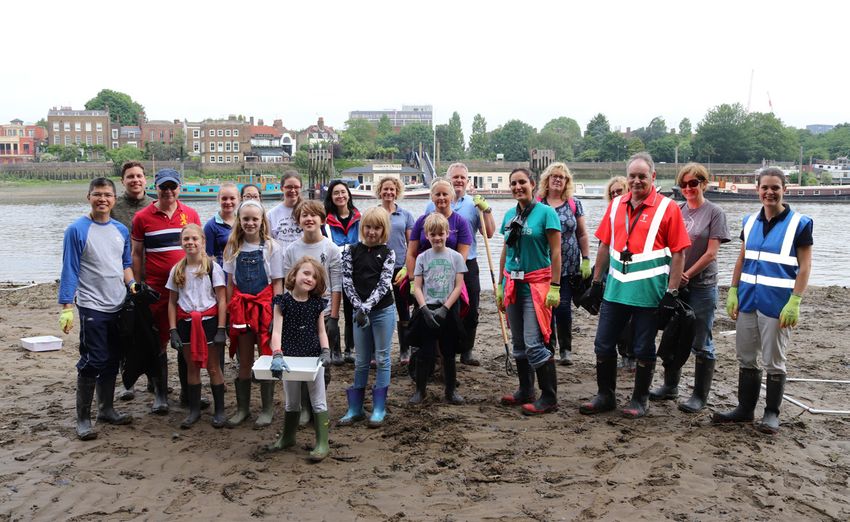
© Thames21

BACKGROUND
Over the past six decades, since the tidal Thames was declared “biologically dead” in 1957 by the Natural
History Museum, the river has undergone extraordinary change, recovering from that low point to having
125 species of fish recorded in its waters.7  Once the Tideway Tunnel is operational and intercepting the
majority of London’s sewage overflows, river water quality should improve. But public perceptions of
the river are poorly informed, and many Londoners are unaware of the biodiversity recovery underway.
Meanwhile new threats have emerged which are poorly understood, particularly that of plastic pollution.

The Thames River Watch programme is funded by Tideway, the company constructing the Thames
Tideway Tunnel and has been recognised by the Lord Mayor’s Dragon Awards and the Evening Standard’s
Business Awards for its support of local volunteers to tackle these issues.

WASTE ITEMS IN THE TIDAL THAMES                                                    In the early days, volunteers focused on removing
                                                                                   the most obvious waste items, mainly large immobile
Since historic times, the tidal Thames has been used by                            objects (such as tyres, shopping trolleys, metal work,
Londoners to dispose of waste. But to this day whilst it                           large shipping ropes, motorbikes etc). Since the
is illegal to dump litter, there is no statutory authority                         early 2000s, the PLA and Thames21 have carried out
with responsibility for removing waste items from the                              annual ‘rapid appraisal’ boat surveys to document
river or other water bodies throughout London. In 1994,                            the occurrence of these items which, along with
the Port of London Authority (PLA), Thames Water, the                              photographic evidence, reveal a significant decrease
City of London Corporation, the Environment Agency                                 in immobile waste items, due to the huge concerted
and Keep Britain Tidy came together to tackle the tidal                            volunteer effort delivered year after year. These items
Thames waste issue by supporting Londoners to take                                 return at a slow rate and now appear to be within the
part in clean-ups. This partnership developed into                                 capacity of volunteer groups to remove them.
Thames21, which became an independent charity in
2004.

7 https://www.pla.co.uk/Environment/Main-Biodiversity-Resources-in-the-Tidal-Thames-Species                                                   8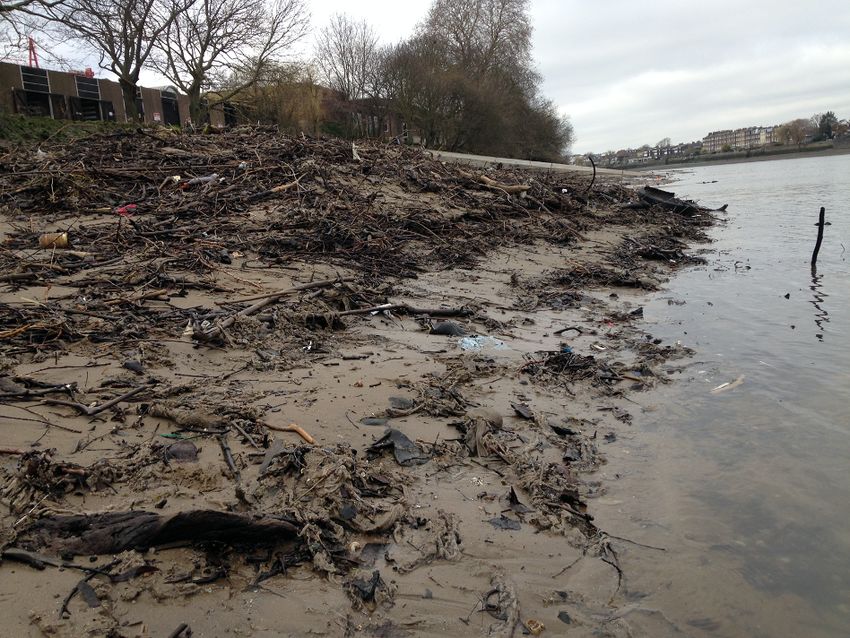
GROWTH IN SINGLE-USE PLASTIC both organic and plastic material (see Figure 3). The
PACKAGING WASTE larger plastic items can be removed by volunteers
during a clean-up, but the waste quickly returns
While many sections of foreshore are now free of with the next high tide. The strandline is laced with
waste thanks to Thames21 volunteer efforts over the micro-plastics, frequently pieces of plastic broken
past two decades, there are certain sites which have down from larger original pieces, and is often
proven impossible to keep clean on a permanent basis impossible to remove via a clean-up.
by volunteer effort alone. The waste at these sites is
overwhelmingly plastic, often single-use products or • Sinking waste hotspots: these collect heavier
packaging. We refer to these sites as “waste hotspots” mobile items (e.g. wet wipe products, plastic
and have created a map of known hotspot sites (see shopping bags filled with sediment) which come out
Figure 6). There are two types of waste hotspots, which of suspension where the water moves more slowly.
differ considerably from each other. These are: On the tidal Thames this takes place inside river
bends. From Vauxhall Bridge westwards, sinking
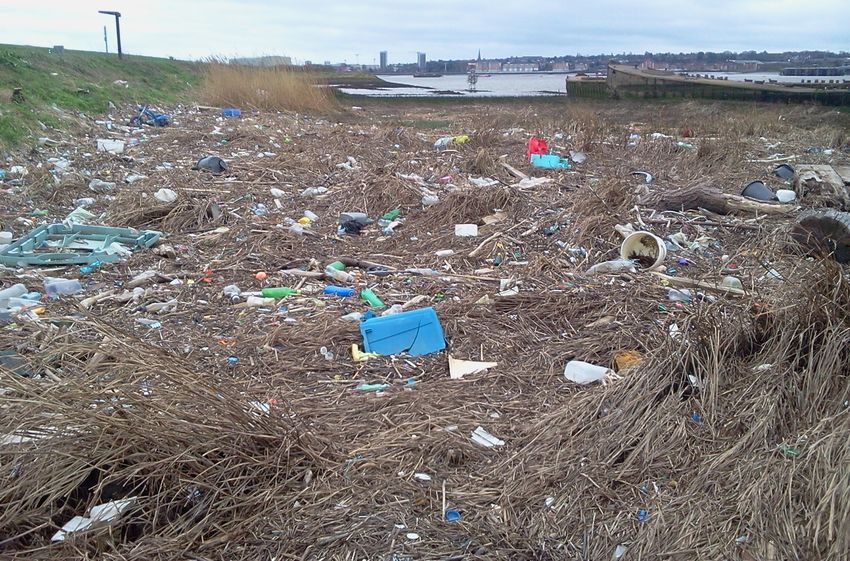
• Floating waste hotspots: these are slipways, waste hotspots mostly consist of wet wipe products
beaches or vegetated intertidal sites that collect and sanitary products (see Figure 4); east of
lightweight (floating) waste (for example plastic Vauxhall Bridge, we mostly find submerged plastic
bottles, food wrappers, polystyrene). A strandline is bags, which fill up with mud and become embedded
deposited by a receding high tide and composed of in the river bed (see Figure 5).
Figure 3. Floating waste hotspot at Queen Caroline Figure 4. Sinking wet wipe hotspot in west London,
Drawdock, Hammersmith by Hammersmith Bridge Southside
A mat of wet wipes visible at
the surface:
A typical 1m2 (to a depth of
4cm) will contain between 50
and 200 wet wipes.
© Thames21 © Thames21
Figure 5. Sinking plastic bag hotspot in east London, Newcastle Drawdock, Isle of Dogs
© C. Whitelock
9
Figure 6. Some of the key plastic hotspots on the tidal Thames

     2       5                    9                     13                                   17
         3        7                                11                15                                 19

         4                8                         12                           16                                         20
1                6                            10         14                                        18

    1. Small Profits                        11.   Cutty Sark                                 Key:
    2. Hammersmith Bridge                   12.   Newcastle Drawdock                         Floating waste on
        Southside                           13.   Point Wharf                                slipways or beaches
    3. Queen Caroline Drawdock              14.   O2 Flats
                                                                                             Floating waste on
    4. Crabtree Wharf                       15.   Galleons Point                             saltmarsh or reedbeds
    5. Fulham Football Club                 16.   Thamesmead
                                                                                             Wet wipe sinking site
    6. Old Swan Wharf                             (Redbourne Drive)
    7. Battersea Bridge                     17.   Concrete Barges
    8. Vauxhall Bridge                      18.   Erith Marshes                              Plastic bag sinking site
    9. Queenhithe                           19.   Purfleet RSPB Rainham
    10. Millwall Drawdock                   20.   Grays Beach

                                                                     ‘I volunteer for Thames River Watch and
                                                                     Thames21 because I love the Thames and its
                                                                     tributaries. They are a small piece of nature
                                                                     surrounded by an urban environment and a
                                                                     lifeline for many creatures, from tiny riverflies to
                                                                     seabirds’
                                                                     Claire Cheeseright, Greenwich hub volunteer

                                       © Steve Catchpole

                                                                                                                                 10
© Clearwater Photography
SURVEY METHODOLOGIES ADOPTED TO
RECORD PLASTIC ITEMS
Data in this report comes from three main • Every piece of an identifiable object is counted
sources: as one of those items before being removed and
disposed of
• Transect plastic waste surveys • Pieces of unidentifiable plastic < 2.5cm in size are
• Regular bottle counts excluded, as they are too numerous. An estimation
• Data from plastic clean-ups of the numbers on a logarithmic scale is recorded
(that is, in factors of 10; we chose the following
TRANSECT SURVEYS OF THE FORESHORE categories 1-9, 10-99, 100-999 and greater than
1000).
In 2015, Thames River Watch developed a waste
monitoring methodology to identify the most common Our surveys take place on the foreshore of the river
waste items on the Thames. The classification of (i.e. riverbed that is revealed when the tide recedes):
items was based on the system used by the Marine excluded from our data is waste on the riverbed not
Conservation Society, which in turn is based on the revealed at low tide, waste suspended in the water
system used by OSPAR.8 column or on the surface floating direct out to sea
without being deposited along the river. The transect
Thames River Watch surveys with transects to identify survey data applies to London, where our citizen
waste from the top of the shore to the river’s edge (see science effort has been, and not to the wider estuary
Figure 7). The steps are as follows: in Essex or Kent. The surveys cover a small amount
of area in detail and are well suited to plastic waste
• A measuring tape is laid starting at the top of the hotspot sites where the majority of waste is to be found.
shore running towards the river However some transect surveys were carried out on
• A 1m x 1m square quadrat is laid alongside the tape non-hotspot sites; these are identified as ‘general
measure and volunteers identify, count and record foreshore’ surveys.
all the waste that is found in each square
8 OSPAR is the mechanism by which 15 Governments & the EU cooperate to protect the marine environment of the North-East Atlantic. 11Figure 7. Our waste monitoring transect
Volunteers lay a measuring tape from the sea wall at the top of the foreshore down towards the river, then count all
items found in each 1m2 using a square frame.
1
2
3
4
5
Thames River Watch data are gathered by volunteers Box 1. Key items now being surveyed
who are trained in our monitoring methodologies or
directly supervised by Thames21 staff. Two separate • Drink bottles
teams of volunteers have been established at • Drink bottle tops
Hammersmith and Greenwich respectively, and surveys • Single-use plastic cups
are carried out once a month. Opportunistic surveys • Straws
have also been carried out at other sites and the data • Cotton bud sticks
from these sites is included in the results described • Takeaway containers (polystyrene)
below. • Takeaway containers (plastic)
• Cable ties
The survey has worked well to help us determine the • Tile spacer crosses (from construction sites)
key waste items in the river. This has provided us with • Cigarette butts
a clear prioritisation list to tackle plastics entering the • Wet wipe products (surveyed differently as it is a
Thames. type of sinking waste, see below)
Given that all identifiable items are counted, the time
taken to complete a single quadrat can be high: some able to do with our regular monitoring. In spring 2017
quadrats could take a group of 4 citizen scientists up we started our Big Wet Wipe Count which focuses on
to 40 minutes to complete. This limits the number of just one site in Barnes by Hammersmith Bridge, where
quadrats that can be surveyed between tides. With a huge amount of wet wipe products accumulate.
the intention to move towards detecting trends, as of During this event we used our linear transect method
January 2019, we started to focus only on ten key plastic to record the quantity of wet wipes-based products
waste items, enabling us to cover much greater areas on the foreshore. The Count is limited to those wipes
in our surveys and providing the most useful data for found within 4cm of the surface and removed by using a
identifying plastic waste solutions (see Box 1). standardised hoof pick to scrape the surface.
In addition to our regular monitoring we also carry out In 2019, we adapted the Big Wet Wipe Count method to
repeat surveying through our Big Count initiative. This work on a grid rather than a transect system to allow
event occurs twice a year, engaging a large number us to focus on the mounds where the wet wipe products
of people from the general public in a specific task accumulate with a view to tracking their change in size
that does not require prior training. This enables us to as well as the density of wet wipe products over time.
collect much more data than we would be otherwise
12Through the transect waste surveys, Thames River the annual ‘Big Count’ events. As this event invites the
Watch citizen scientists monitored 1,805m2 of Thames general public to take part, more data can be gathered
foreshore between 2015 and December 2018, with from the survey over a short period of time. Floating
an additional 717m2 surveyed between January and waste sites, on the other hand, can be accessed an
December 2019 using the new ten key waste items list. hour either side of high tide and therefore surveys
These sites are all within Greater London. occur more frequently. These are mostly carried out
by trained citizen scientists in groups independently of
In total, floating waste sites represent around 62% Thames21 staff.
of all quadrats surveyed, with sinking waste sites
representing 33% and general foreshores (i.e. not ‘Floating waste’ and ‘sinking waste’ sites are very
known to be waste hotspots) representing 5% (see different in terms of the types of waste that they collect
Figure 8). and the area that they cover, as discussed above.
Therefore, it is necessary to analyse the two data sets
Sinking sites are not as easily surveyed as the waste separately to present an overall picture of the most
mostly accumulates at the bottom of the foreshore common items on the foreshore. For the purposes of
and is only accessible at low tides, thus restricting the this report we analyse the data from the two site types
opportunities for surveys. Most of the sinking site data separately.
comes from Hammersmith Bridge Southside during
Figure 8. Number of quadrats surveyed at different types of sites
350
300
Almost twice as many quadrats have
been surveyed in floating waste hotspots
250
than sinking waste hotspot sites
(62% compared to 33%)
200
150
100
50
0
Queen Caroline Drawdock
Hammersmith Bridge Southside
Cutty Sark
Crabtree Wharf
Point Wharf
Newcastle Drawdock
Queenhithe
Old Swan Wharf
Battersea Bridge
Vauxhall Bridge
Erith Marshes
Hurlingham Wharf
Riverside Studios Foreshore
Putney Embankment
Resolution Wharf
Mortlake Anglian Boat Club
Bermondsey
O2 Flats
Mast Quay (east)
Millwall Drawdock
Floating hotspot
Sinking hotspot
General foreshore
13© Thames21 © Thames21 BOTTLE COUNTING AT KEY SITES RECORDS FROM WASTE CLEAN-UPS Since April 2016, Thames21 has partnered with the Waste clean-ups are carried out by multiple #OneLess campaign and Thames Estuary Partnership organisations across the Thames estuary. Thames21, to count the total number of bottles collected at our #OneLess, the North Thames Estuary Litter Picking clean-ups to better understand the scale of London’s Group and Thames21-supported River Action Groups plastic bottle problem. Since April 2018, bottle counts (such as the Barnes and Putney Tidy Tow Path groups) have been carried out on a fortnightly basis on a neap collaborate to collate data on the quantities of waste tide9 at five key floating plastic waste hotspot sites.10 and the number of bottles that are collected. These sites are Queen Caroline Drawdock, Crabtree Wharf, Old Swan Wharf, Queenhithe and Point Wharf. During bottle count surveys, trained citizen scientists collect the single-use plastic bottles that have accumulated at a predefined area at sites on the Thames foreshore. The collected bottles are then sorted into four categories based on their bottle type and counted: bottles of still water, bottles of flavoured or fizzy drinks, milk bottles and unknown (for any bottles where it was not possible to determine type). In addition to the regular bottle counts, in the autumn of 2016, Thames21 and #OneLess launched an annual ‘Big Bottle Count’ event. During this one-day mass bottle count event, surveys are carried out at multiple floating waste hotspot sites along the Thames. The purpose of this event is to further our understanding of the distribution of plastic bottles in the River Thames and to raise awareness of London’s single-use plastic bottle pollution problem, by encouraging volunteers across London to take part in this mass bottle count event. © Thames21 9 A neap tide refers to a tide just after the first or third quarters of the moon when there is the least difference between low and high tides. This is normally when the most bottles and lightweight items are found on the foreshore. 10 #OneLess (2019) The River Thames: Plastic bottle pollution. [Online]. [Accessed December 2019]. Available from: https://www.onelessbottle.org/wp-content/uploads/ sites/14/2019/06/ZSL00085_OneLess_MonitoringReport_FINAL.pdf 14
© Thames21

WHAT WE FOUND
WET WIPE PRODUCTS ARE THE MOST                              creates more turbulence and the process becomes self-
COMMON ITEM RECORDED                                        reinforcing. We suspect that the wipes help to bind the
                                                            sediments together and reduce the chances of erosion.
Wet wipe products, most of which contain plastic,
are by far the most common item recorded on                 Waste surveys conducted at sinking sites show that wet
the tidal Thames foreshore in London. These                 wipe products are overwhelmingly the most common
products are changing the shape and sediment                item at these locations, accounting for 94% of what is
type of the foreshore at particular sites.                  found (see Figure 9).

Since 2013, Thames21 has been aware that wet
wipe products are depositing in huge numbers in
west London, with six large sites identified between
Isleworth Eyot and Vauxhall Bridge. This phenomenon         Figure 9. Items found at Hammersmith Bridge
only occurs on the inside bends of the river, where a       Southside: March 2018
slower current creates insufficient energy to keep the      Of all the items found at the sinking site,
wet wipe products in suspension. Wet wipe products          94% were wet wipe products
enter the river via the sewage overflows during periods
of high rainfall. No wet wipe sites have been recorded in
east London despite the largest sewage overflow being
in Greenwich; this raises the question of where these
wet wipe products might be deposited.

                                                                                                          Sanitary towel
The wet wipes are depositing in mounds that are                                                           2%
changing the shape and sediment type of the foreshore.                       Wet Wipe
Mounds probably form due to wipes becoming snagged                           products                     Food wrapper
                                                                                                          1%
on an uneven surface (e.g. rocks or twigs), creating
turbulence that encourages other wipes and sediment
                                                                             94%                          All other items
to come out of suspension. As the mound grows, it                                                         3%

                                                                                                                            15
The site we have studied in most detail is Hammersmith Tunnel, have shown that the mounds are growing in
Bridge Southside, which runs from Hammersmith height. In just under five years, the largest of these
Bridge to the slipway by St Paul’s School, where there mounds grew nearly 1.4m in height; half of this
are multiple mounds created by deposited wet wipe growth (70cm) occurred in the eight months between
products. September 2018 and May 2019 (see Figure 10 and
Figure 11). This growth occurs despite frequent large
Bathymetric surveys, carried out by the PLA on behalf clean-ups at the site over the past two years.
of the company building the west section of the Tideway
Figure 10. Wet wipe products are dramatically changing the shape of the foreshore at Barnes south of
Hammersmith Bridge
(a) This cross-section of the change in the height of the riverbed shows one mound grew by 70cm in four years
(between September 2014 - September 2018)
Height Ranges
0.7
0.6
0.5
0.4
(b) The rate of deposition is 0.3
0.2
speeding up. This plan of the
0.1 Current Survey above Base Survey
same mound shows it grew in 0.0 (Accretion)
height by a further 70 cm in just -0.1
Natural Riverbed Level Changes +/-
eight months (September 2018 - -0.2
100mm range
-0.3
May 2019) -0.4 Current Survey below Base Survey
-0.5 (Scour)
© Tideway/BMB 16Figure 11. Image of the largest mound by St Paul’s Boys School (taken 21 February 2019).
The mounds look natural from a distance
but up close it becomes evident that they
are laden with wet wipe products.
© C. Whitelock
During the Big Wet Wipe Count 2019, we surveyed the
mounds on a grid system with the aim of identifying
change in size and density of mounds over time (see
Figure 12). The biggest mound was not surveyed by our
citizen scientists as it is too large to survey effectively
within the time available at low tide. Four smaller
mounds were selected and groups of volunteers
counted the wet wipe products found per square metre.
Typically, between 50 and 200 wet wipe products
per square metre were found when surveying these
mounds.
‘I like going to the same location throughout the
year to see how it changes. But it’s frustrating to
see litter every time we go after clearing it the
previous time. To stop this problem, we need to
know the sources and our regular surveys help
collate relevant information to help’
Clare Cheeseright, Greenwich hub volunteer
© Thames21
17Figure 12. The density of wet wipe products at four mounds between Hammersmith Bridge and St Paul’s School
slipway, to a depth of 4cm. Surveyed in April 2019
The surface of four mounds surveyed by Hammersmith Bridge in March 2019 revealed almost 8,000 wet wipe
products with typically between 50 and 200 wet wipe products per sq. metre.
Distance in metres from reference point (steps)
11 12 13 14 15 16 17 18 19 20 36 37 38 39 40 129 130 131 132 133 134 135 139 140 141 142 143 144 145 146
Distance in metres from the flood defence wall
1 MOUND 1 MOUND 2 MOUND 3 MOUND 4
2
3
4
5 0 4 4 11 6 36 1
6 0 22 80 18 45 70 22 1 0
7 0 66 103 86 105 33 0 0 0 3 3 9 4 1 5 1 2
8 29 60 55 53 23 1 0 4 5 2 100 28 0 3 11 29 47 15 21 11 12 6
9 19 51 18 36 35 14 2 0 1 0 0 1 0 6 0 33 36 1 4 5 46 137 90 39 5 4 0
10 4 2 1 2 32 102 101 105 70 49 0 12 6 29 0 47 111 168 50 150 19 2 2
11 5 6 3 4 23 83 82 114 9 3 59 34 5 0 13 76 210 119 16 4 9
12 78 25 105 180 73 0 15 51 137 118 1 0 0 96 102 95 61 90 26 5
13 14 86 88 41 79 52 39 25 0 19 131 100 91 7 1 0 24 36 83 68 34 26 11
14 39 83 98 64 82 11 21 21 0 13 102 59 87 34 2 1 5 58 111 137 117 18 5
15 11 40 29 38 104 2 2 1 2 5 26 25 123 91 13
16 0 0 4 4 2 1 1 0 1 1 3 8 14 18 69
17 0 0 4 0 1 2 4 1
18
Hammersmith Bridge St Pauls School slipway
Overall in 2019, 45 clean-ups were carried out at wet
wipe sites. Four of these events, in which each wet
wipe was counted individually, yielded a total of 56,000
wet wipe products.11 Nevertheless, no discernible
difference was made to the cleanliness of the foreshore
and it is clear that their presence on the foreshore
cannot be addressed effectively by volunteer effort
alone.
© Thames21
11 https://www.thames21.org.uk/2019/04/23-thousand-wet-wipes-discovered-stretch-thames-river-bank/ 18SINGLE- USE PLASTIC ITEMS MAKE UP estuary. These represent the most visible fraction of the
83% OF ALL COUNTED ITEMS, EXCEPT plastic waste in the tidal Thames.
GLASS FRAGMENTS
The top five identifiable items at these sites are food
JUST FIVE ITEMS REPRESENT NEARLY wrappers, cotton bud sticks, plastic drink bottles and
TWO-THIRDS OF ALL LIGHTWEIGHT their lids, plastic cups and takeaway containers (see
IDENTIFIABLE PLASTIC FOUND Figure 13).
The top five identifiable lightweight items recorded Almost three times as many bottle lids than bottles
make up 64% of the total lightweight plastic items. themselves were recorded in our surveys. There are
When wet wipes are included in the total, single-use a number of possible reasons for this result. Firstly,
plastic items represent 83% of all the counted items, bottle lids are often found in the river in fragments
excluding glass fragments. A concerted effort to which would increase their representation in our data
ensure these specific items are recycled and returned whereas we normally find drink bottles in one piece.12
to the circular economy could significantly reduce the Bottle lids are likely to have more routes to enter the
amount of plastic pollution. river (e.g. via storm water drains) due to their small
size. It has also been observed by our volunteers that
Lightweight items, i.e. those that float on the surface bottles with no lids tend to sink. It is therefore possible
of the water and can become stranded at the top of the that there are bottles without lids at the bottom of
shore when the high tide retreats, impact slipways, the river and are under-represented in the counts.
beaches and intertidal vegetated habitats across the However, more research is needed here to further
understand this result.
Figure 13. The top lightweight (floating) waste items found on the foreshore (2015-2018) by number of items
counted in the litter surveys*
Food wrapper** 20%
Cotton bud stick 16%
Drink bottles | bottle lids 3% 8%
Unidentified items*** 7% 4%
Cup 4% 5%
Take-away container 1% 7%
Building insulation pieces 2.2%
Straw 2.2%
Cigarette butt 2.1% Plastic
Lollipop stick 1.4% Polystyrene / Foam
* These are not the overall top items on the foreshore; items from sinking sites are considered separately
** Food wrappers: almost exclusively polypropelene packaging of chocolates and biscuits
*** Includes foam pieces but excludes plasticsWATER BOTTLES MAKE UP NEARLY HALF Overall the proportion of still water bottles recorded in
OF ALL PLASTIC DRINK BOTTLES FOUND the Thames is around 46% of all drink bottles that were
identified (see Figure 14).
Water bottles represent almost half of all the drink
bottles found in the Thames, making it the single most This ratio does not remain constant throughout the
common type of drink bottle. Given that UK tap water year. The ratio of still water to fizzy or flavoured drinks
is safe to drink and one of the most highly regulated seems to increase in the period of July to September,
drinking water systems in the world, more people likely due to hot weather. A longer time series will be
replacing bottled water with tap water would make a necessary to prove this over time, but it flags up the
significant contribution to reducing the plastic burden growing need to provide Londoners with this basic
in the river. resource through free water fountains and refill points,
especially with more heatwaves predicted due to
climate change.
Figure 14. Proportion of bottles of different drink types found in the Thames
Water bottles are the most common type of plastic bottle found: almost 50% of all bottles
Water bottles are far more common than any other type of drink bottle found
46%
Still Water
Cola
Sports Drink
Fruit Drinks
Flavoured Water
Lemonade
Other
15% 15% 15%
Sparkling Water
3% 3% 2% 1%
© Thames21 © Thames21
20PRECIOUS INTERTIDAL HABITATS A total of 97,019 bottles have been recorded and
EAST OF LONDON BEAR THE BRUNT removed between April 2016 (when bottles began to be
OF LIGHTWEIGHT PLASTIC SUCH AS counted) and December 2019. Since 2018, when bottle
BOTTLES AND POLYSTYRENE counting effort was significantly increased, an average
of 3,000 bottles have been recovered every month. Due
A total of 97,019 drink bottles were recorded and to insufficient data, we are not able to say whether the
removed between April 2016 and the end of December overall number of bottles has increased or decreased
2019. These counts do not include bottles from the over this period; this will be addressed in our next
large saltmarsh sites in Kent which are known to also report in 2021.
accumulate large numbers of bottles. Furthermore,
many more are being cleaned up by Southend Council The total numbers and averages of sites in Essex are
during the summer months, which further masks the considerably higher than equivalent counts in London
true plastic burden on the river generated by these (see Figure 15). This is partly because the areas of land
items. exposed to high tides are much larger. It is also likely
due to the fact that the vegetation traps the bottles
Plastic bottles accumulate in huge amounts on more readily and allows them to accumulate over time.
precious interidal habitats. Of the total bottles
recovered, 67% were found on saltmarsh and reedbed It should be noted that counts from estuarine areas in
habitats outside the city compared to 30% from Kent have not been included, with the exception of six
slipways and beaches in London. These habitats are key Thames21 led events at Erith Marshes between April
nursery grounds for fish and are already suffering from 2018 and July 2019 (which produced 7,512 bottles).
other pressures. However, it is known that very large areas of saltmarsh
and reedbeds are inundated with floating plastic there
as well.13
Figure 15. Waste accumulating on the saltmarsh and reedbeds at Concrete Barges, Havering. March 2017
© Clive Webster
13 Pers. comm. Belinda Lamb at Medway and Swale Estuary Partnership 21MICROPLASTICS ARE WIDESPREAD AND CLIMATIC FACTORS APPEAR TO
COMMON ON THE THAMES INFLUENCE THE QUANTITY OF ITEMS
FOUND
Micro and meso-plastics (smaller than 0.5 and 2.5cm
respectively) including polystyrene pieces (from now Storms – characterised by low pressure, high winds
on referred to as microplastic) are found in most and heavy rainfall – are associated with greater
of our 21 surveying sites. Of 21 sites surveyed, 20 quantities of lightweight items being deposited on
reported the presence of microplastics at least once. Thames saltmarsh and reedbed habitats.This suggests
This hidden plastic is difficult to remove via river clean- that items are being flushed out from the wider
ups and is likely to persist in the tidal Thames; adding catchment during storms in greater numbers than is
to the global microplastic issue. usual. More data are needed to definitively prove this.
The issue is particularly prevalent at floating waste The number of bags collected per clean-up over a
sites – 76% of the quadrats surveyed contained given area can be an important indicator of the trend of
unidentified microplastics. In comparison, just 1% waste accumulation over time. Most of the clean-ups
of sinking and general foreshore quadrats reported are opportunistic and not regular, which makes trends
microplastics. difficult to detect. However, Grays Beach in Thurrock
has been cleaned on the first weekend of each month
Nurdles (or nibs) – i.e. small plastic pellets which are since March 2017 as well as twice in 2016. Plastic drink
the raw material for the production of plastic products bottles were counted only once in 2017 but they have
– have also been found at all of the floating waste been counted consistently from January 2018. The
sites except Queenhithe. Nurdles are about the size site is a discrete 200m section of inter-tidal habitat of
of a lentil and little is known about how they enter the grasses and reeds running from Thurrock Yacht Club to
environment during industrial processes. They are more Tilbury Docks.
commonly found on coastal beaches;14 it is unclear
whether their presence in the Thames originates from Figure 16, which shows the number of bags of rubbish
land or sea based sources. and drink bottles collected from Grays Beach since
2016, suggests two phenomena. Firstly, the highest
The presence of microplastic and polystyrene pieces number of black sacks collected was from the first
is an issue in the Thames as smaller plastics are clean-up carried out at the site; a high of 134 in one
more likely to enter the food chain via ingestion by day. On only one other occasion has a clean-up at Grays
invertebrates, fish, mammals and birds. However, it is Beach exceeded 80 bags. This suggests the rubbish
unclear how much of a risk these items pose to wildlife. had been accumulating at the site and not refloating;
The majority of plastic ingested by estuarine species possibly because of the vegetation.
in the Thames and Clyde as reported by McGoran et al.
(2018) were plastic fibres, most likely originating from Secondly, the other two major spikes in sacks and
clothes.15 bottles occurred just after a storm: Storm Eleanor in
early January 2018 or Storm Lorenzo in late September
2019. This is supported by anecdotal evidence by Grays
Beachcombers who have noticed an increase in plastic
waste after both storms.16
It is unclear why spikes in plastic waste occur after
storms. Strong winds could increase the movement of
waste from land to water. Furthermore, high rainfall
means full rivers could be flushing waste out of
freshwater environments and into the estuary.
‘I like being useful, being outdoors, staying
one step ahead of the weather, working with a
diverse group of interesting people, talking to
passers-by about our work, getting compliments
from passers-by, and leaving a site looking a lot
cleaner than it was when we started’
Michael Byrne, Hammersmith Hub volunteer
14 The Great Nurdle Hunt [Online]. [Accessed December 2019]. Available from: https://www.nurdlehunt.org.uk/
15 McGoran, A.R., Cowie, P.R., Clark, P.F., McEvoy, J.P. and Morritt, D. (2018) Ingestion of plastic by fish: A comparison of Thames Estuary and Firth of Clyde populations,
Marine Pollution Bulletin, 137, pp 12-23.
16 Pers. Comm. Steve Catchpole and Clive Webster from North Thames Estuary Litter Picking Group 22Figure 16. No. of bin bags of rubbish and plastic drink bottles recovered at Grays Beach at monthly clean-ups
Waste picked up at Grays Beach reduced after initial clean-ups took place but appeared to spike again after
significant storms, suggesting they have an influence on plastic quantity
No. of sacks
No. of bottles
160 1600
140 Storm Eleanor 1400
4 Jan 2018
120 1200
100 1000
Storm Lorenzo
30 Sept 2019
80 800
60 600
40 400
No. of sacks
20 200
0 0
Feb-16
Apr-16
Jun-16
Aug-16
Oct-16
Dec-16
Feb-17
Apr-17
Jun-17
Aug-17
Oct-17
Dec-17
Feb-18
Apr-18
Jun-18
Aug-18
Oct-18
Dec-18
Feb-19
Apr-19
Jun-19
Aug-19
Oct-19
Dec-19
© Steve Catchpole
23© Thames21
GAPS IN KNOWLEDGE
The citizen science monitoring has built a good picture of the main plastic items on the foreshore of the
tidal Thames in London. However, there are many key gaps in our knowledge with respect to plastic in
the river.
It is unknown how many microplastic and polystyrene
pieces are typically found on the foreshore. We have
not counted these items in our surveys as there are
frequently too many to count in one square metre. It
is likely that these items would represent the most
common items on the foreshore if they could be
counted.
Very little data exist detailing the quantity of plastic
bags found at sinking sites in east London. Our surveys
from sinking sites come almost exclusively from
wet wipe sites in west London. Although anecdotal
accounts suggest the number of bags in east London
has declined over the past 20 years, there has been
insufficient coverage in our surveys to document this
issue.
Of the floating litter items greater than 2.5cm in size,
10% could not be identified. There are a large number
of plastic items for which no information is available
and therefore it is not possible to identify how to stop
them reaching the river. © Thames21
24It has not yet been possible to determine trends in how representative the survey is of the whole site.
the number of specific items over time. There are a An understanding of the variation across the site is
number of factors that influence the number of items needed before we can refer to trends.
that we detect in our surveys making it difficult to
detect a trend from the data. These include: Very little is understood about the sources, pathways
and fate of plastic waste in the river. With the exception
• Climatic factors: wind direction could have a of sewage-related items (such as wet wipe and sanitary
significant impact on the amount of floating plastic products and cotton bud sticks) which are almost
deposited at a given site by preventing the plastic certainly transported to the river via combined sewage
from depositing at high tide. This means that an overflows, we don’t have any means of identifying how
absence of plastic on a given survey may not in most of the plastic gets to the river. Anecdotal evidence
fact represent a reduction in the total in the river exists of fly-tipping and over-flowing bins next to the
at that time. Similarly, high rainfall could result in river but it is not known how significant these sources
the flushing of plastic items out of the tributaries are. It is also unknown the extent to which plastic is
creating a spike in items found in the tidal section of transported to the river from its freshwater inputs
the river. However, the high flow of freshwater into compared to entering directly from land to the estuary.
the estuary could also result in the plastic being
transported more quickly out to sea than usual.
• Undocumented clean-ups: with an increase in ‘I volunteer with Thames River Watch because I
was appalled at the huge amounts of litter and
interest in this subject, there are more locally
wanted to take concrete steps towards solving
organised clean-ups occurring.
the problem. I see TRW as a perfect vehicle for
this. Not only do we help practically through litter
• Variation in deposition across a site: the transect removal, we assist TRW in crucial data collection.’
surveys included in this report only include one Helen Stoddard, East Hub coordinator
transect and therefore don’t give an indication of
© Thames21
© Thames21 © Thames21
25© Thames21
PUTTING THE DATA TO USE – WHAT’S NEXT?
We collect this data for a number of reasons. First, to understand the issue better and identify ways to
stop plastic waste before it gets to the river. Second, to help keep business, government, agencies and
citizens accountable. Has enough action been taken to address the plastic crisis? The river data shows
that so far, the answer is no.
Our vision for the next stage of the project includes: make the case for protection of the tidal Thames
to local and national politicians, including the
• Supporting a thriving and funded academic Baseline prevention of plastic waste entering the river
and Evidence Group through the Thames Litter
Forum to update monitoring methodologies and • Using the data to raise awareness in the media
produce written reports on the state of the tidal about the need to tackle overall waste generation,
Thames not just single-use plastic, mindful of the fact
alternatives to plastic can also create significant
• Identifying the plastic items that cause the most environmental issues
harm to the environment and map their pathways to
the river • Using the data generated to create targeted
campaigns alongside other NGOs and partners to
• Developing active riverside community groups reduce waste production at the local and national
that are effective spokespeople for the river, level and to introduce measures to prevent plastic
knowledgeable about the issues and trained to reaching the river.
‘Data collection is the only way to speak with ‘Certain types of litter are obvious along the
knowledge about the serious damage plastic foreshore. But without hard evidence policy-
waste causes to the planet; it is the only way we makers can argue that the problem isn’t as
can clearly communicate the need for changes in extensive as is claimed. Aggregating data across
our habits and laws on production and recovery multiple sites, dates, weather conditions, tidal
to the government and the public.’ conditions builds hard evidence for changes to
Kathy Stevenson, Hammersmith hub volunteer policy and practice’
Michael Byrne, Hammersmith Hub Coordinator
26© Thames21
ACKNOWLEDGEMENTS
This report would not have been possible without the invaluable input of many volunteers, funders and
partners who have contributed hugely to the work. In particular, we would like to thank:
• Tideway, the company building the Thames • The Port of London Authority (PLA) for their
Tideway Tunnel, are the funders of the Thames generous support of Thames21, assisting with rapid
River Watch programme. Without them this appraisals, disposing of foreshore waste collected
programme would not be possible. and establishing the Thames Litter Forum. We’d
particularly like to thank Mike Russell and his
We would also like to thank Tideway staff, and colleagues and Tanya Ferry and Molly Tucker in the
staff from their main works contractors for the Environment Team.
time and commitment they have individually given
the project, in particular: John Sage, Kelly Bradley • The #OneLess campaign, as a long-term project
and Georgia Boyd from Tideway; Tom Lane (BMB); partner in our work to monitor the Thames
Charley Whitelock and Martin Griffiths (CVB) and population of single-use plastic bottles and funder
Alick Whitfield and Caroline Brennan (FLO). of the fortnightly bottle counts: in particular Kim
Ferran Holt from the Thames Estuary Partnership,
• The BAM Nuttall, Morgan Sindall, Balfour Beatty Alice Chamberlain, Rachel Shairp and Fiona
joint venture team working on the west section Llewellyn from the Zoological Society of London.
of the Thames Tideway Tunnel for providing the
bathymetric survey data of the riverbed and their • Professor David Morritt (Royal Holloway University),
support for the project. Dr Paul Clark (Natural History Museum) and
Damian Lesniewski for their work on the
Thames bottle monitoring database and ongoing
commitment to and research on the issue of plastic
pollution in the river.
27• Thames21 staff, past and present, who have • Volunteer leaders of clean-ups in Essex:
committed time and expertise to the project and Steve Catchpole and Clive Webster (Grays
data collection including Julia Makin, Abbi Kent, Beachcombers), Win O’Sullivan (Southend
Nick Beevers, Roger Baker, Joanne Bradley and Beachcare), Lauren Hollas (Benfleet RiverCare) and
Chris Coode. Barry Jones (Concrete Barges).
• Our very committed volunteers who conduct the • Our River Action Group leaders in west London:
surveys and lead the clean-ups that provides the Petra Gaensbacher and Ann Sullivan (Barnes
data on which this report is based. In particular: Tidy Towpath); Sandi Bloomfield and Paul Benton
(Putney Tidy Towpath); Ali Murrell and Riz Smith
• Volunteers of the Community hub in west London: (Riz Clean Series); and Chris Bridge and Ben
Michael Byrne; Greg Pugsley, Kathy Stevenson, Williams (C&C West London).
Clive Beautyman, Robyn Leader, Terry de March,
Ali Murrell, Morag Carmichael, Genevieve Cuming, • Our Thames ambassadors: Marg Smith, Natalia
Tana Scott, Robert Francis, Karen Hoffa, Nicole Akhmerova, Marie Benham, Silvia Collosseus, Ann
Edwards, Hilary Thomson, Maria Rabanser, Daniel Sullivan, Mae Henderson, Alessandra MacConville,
Alabede, Cheryl Ashman, Guy Evans, Chris Jones, Kathy Stevenson, Maya Lagose and Georgia Gordon.
Katia Herault, Adrian Gale and Azimah Heus. We’d
like to thank Owen Thomas for designing and • Our Event Support Team volunteers who support
making the quadrats for the surveys. our public-facing events: Jonathan Starkey, Geoff
Dent, Nic Shore, Owen Thomas, Sam Tonge, Tana
• Volunteers at the Community Hub in east London: Scott, Michael Byrne, Helen Stoddard, Chris Bridge,
Helen Stoddard, Silvia Colloseus, Clare Cheeseright, Lina Allu, Julia Grollman and Sining Yeoh.
Geoff Staines, Mark Peters, Sara Wilkinson, Sarah
Denman, Roger Williams, Edmund Sutton, Jon
Down, Al Booth, Bernard Savage, Angie Prentice,
Elena King, Linda Pearce, Melissa Goulton and Tani
Theron.
Design by www.deciacco.co.uk
28You can also read