MEAT IN A NET ZERO WORLD: A UK MEAT INDUSTRY COMMITMENT TO ACTION Optimising productivity and minimising waste from farm to fork - Wrap
←
→
Page content transcription
If your browser does not render page correctly, please read the page content below

A UK MEAT INDUSTRY COMMITMENT TO ACTION

MEAT IN A NET ZERO WORLD:
Optimising productivity and minimising waste from farm to fork

Publication Date: 30th June 2020
MEAT IN A NET ZERO WORLD

Document reference:
WRAP, 2020, Banbury, Meat in a Net Zero world, Prepared by WRAP

Written by: Karen Fisher, Special Adviser, WRAP

Front cover photography: Grass covered field.

Disclaimer: While we have taken reasonable steps to ensure this report is accurate, the named organisations do not
accept liability for any loss, damage, cost or expense incurred or arising from reliance on this report. Readers are
responsible for assessing the accuracy and conclusions of the content of this report. Quotations and case studies
have been drawn from the public domain, with permissions sought where practicable. This report does not represent
endorsement of the examples used and has not been endorsed by the organisations and individuals featured within
it. This material is subject to copyright. You can copy it free of charge and may use excerpts from it provided they are
not used in a misleading context and you must identify the source of the material and acknowledge copyright. You
must not use this report or material from it to endorse or suggest we endorse a commercial product or service.
MEAT IN A NET ZERO WORLD

Contents
1.0 Overview                                                1

2.0 A Cross-Industry Vision                                 5

3.0 Action Areas                                            7

3.1 Rearing / Primary Production                            9

3.2 Processing                                              15

3.3 Point of Sale – Retail                                  17

3.4 Point of Sale – Hospitality and Food Service            19

3.5 Waste at Home                                           21

Appendix 1: Data Sources for GHG and Food Waste Estimates   26
MEAT IN A NET ZERO WORLD
1.0 Overview
This document sets out a vision and set of actions for the UK meat industry to work from farm to
fork to improve efficiency and productivity, minimise waste, protect natural assets and reduce
global warming.
The aim is to make the UK meat industry a world-leading example of efficient and sustainable
meat production and supply, by:
As a supply chain, helping deliver productivity improvements, greenhouse gas (GHG)
emissions reductions and protection of natural assets (e.g. soil, water) during livestock (cattle,
sheep, pigs) and poultry rearing;
Sourcing soya for use in feed that is cultivated in a way that protects against conversion of
forests and valuable native vegetation;
Large meat processors, retailers, and hospitality and food service businesses continuing to
take action to reduce their own operational food waste, GHG emissions and water impacts;
and
Helping to halve the amount of meat thrown away at home.
A series of actions and commitments are defined within the document (summarised in Table 1)
that will contribute towards existing national-level targets across different timescales:
• Courtauld Commitment 2025 targets to reduce food waste and GHG emissions by 20%
between 2015 and 2025;
• UN Sustainable Development Goal 12.3 to halve per capita food waste by 2030;
• NFU’s vision of reaching net zero GHG emissions across the whole of UK agriculture by
2040; and
• The UK’s target to bring all GHG emissions to net zero by 2050.
Together the UK meat industry also has ambitions to develop a GHG emission reduction target
aligned with what climate science says is necessary to help limit warming to 1.5◦C.
The document was compiled and published by WRAP, on behalf of stakeholders across the UK
meat supply chain. The actions within will be implemented by supply chain businesses
(processors, retailers, hospitality and food service businesses), with support from industry bodies.
The term ‘we’ throughout this document refers to these supply chain businesses.
WRAP will also compile evidence to track progress and ensure accountability.
1
MEAT IN A NET ZERO WORLD

 A Collective Commitment to Action
 “There has never been a more critical time for action. We are facing a warming world, with
 more people and less land, water, energy and other resources to go around. As an industry
 we are committing to work together to ensure that we use these resources efficiently and
 minimise our impact on the environment, whilst safeguarding the health & welfare of our
 animals and the livelihoods of our producers. Never has it been more important that we
 produce food in a sustainable manner, including reducing food waste from farm to fork.
 By working collectively, we aim to make the UK meat industry a world-leading example of
 efficient and sustainable meat production and supply”

 Rachel Hackett, Group Sustainability Director – 2 Sisters Food Group
 John Durkan, Group Sustainability and Environmental Manager – ABP
 Jane King, Chief Executive - Agriculture and Horticulture Development Board
 Liz Fox, Corporate Responsibility Director – Aldi
 Chris Brown, Senior Director Sustainability and Sourcing – ASDA
 Andrew Brodie, People, Sustainability & Communications Director – Avara Foods
 Joe Cornes, Managing Director – Becketts Foods Ltd
 Anna Proffitt, Policy Technical Manager – British Meat Processors Association
 Richard Griffiths, Chief Executive – British Poultry Council
 Leah Riley Brown, Sustainability Policy Advisor – British Retail Consortium
 Edward Morgan, Group CSR & Training Manager – Castell Howell Foods
 Caroline Mason, Head of Agriculture – Co-op
 Jim Brisby, Commercial Director – Cranswick
 Gill Higgins, Group Head of CSR & Sustainability – Dawn Meats Group / Dunbia
 Tony Stanton, Managing Director – Direct Table Foods
 Nick Dunn, HS&E Manager – Dovecote Park
 Penny Tomlinson, Managing Director – Fairfax Meadow
 Malachy McAteer, Operations Director – Foyle Food Group
 Nigel Edwards, Group CSR Director – Hilton Food Group
 Gwyn Howells, CEO – Hybu Cig Cymru
 Andrew Staniland, Trading Director – Iceland Foods
 Simon Hewitt, Group Technical and Compliance Director – Karro Food Group
 Kate O'Driscoll, Group Head Of Sustainability - Kepak Group
 Amali Bunter, Senior Responsible Sourcing Manager – Lidl
 Sophie Throup, Head of Agriculture, Fisheries and Sustainable Sourcing - Wm Morrison plc
 Declan Cunningham, Head of Sustainability and Risk – Moy Park
 Steve McLean, Head of Agriculture & Fisheries – M&S
 Henry Unwin, Do The Right Thing Manager – Nando’s
 Rebecca Veale, Senior Policy Adviser – National Pig Association
 Richard Findlay, National Livestock Board Chair – NFU
 Jim Moseley, CEO – Red Tractor Assurance
 Barney Kay, Head of Agriculture – Sainsbury’s
 Andrew Stephen, Chief Executive – Sustainable Restaurant Association
 Christina Downend, Responsible Sourcing Manager - Tesco
 Andrew Cracknell, CEO – Tulip Ltd
 Alan Clarke, Chief Executive – Quality Meat Scotland
 Robert Hues, Partner & Manager, Agriculture, Aquaculture & Fisheries – Waitrose
 Iain Clunie, Programme Manager - Food & Drink, Zero Waste Scotland

                                                                                              2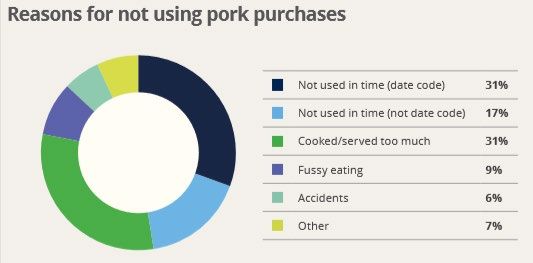
MEAT IN A NET ZERO WORLD

                           3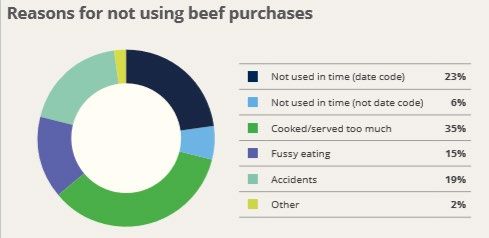
MEAT IN A NET ZERO WORLD

Table 1: Summary of actions / commitments and means of tracking progress
Target area           Actions                                                                        Tracking progress / KPIs
Halving the amount Actions for retailers and meat processors / brands:                               Full set of KPIs outlined in
of meat thrown     • Adopt known best practices for on-pack labelling and guidance across            Section 3.5 (tracked via
away at home          the key areas identified for poultry, pork, beef, lamb items (Section 3.5).    WRAP surveys).
between 2007 and • Work on new solutions and innovations in the key areas identified (e.g.
                                                                                                     WRAP will also repeat its
2030 (in line with    packaging/other innovations to extend shelf life, optimising pack sizes;
                                                                                                     household food waste
SDG 12.3)             encouraging more freezing/defrosting and use of leftovers) .
                                                                                                     survey on a periodic basis
                   • Support consumer-facing campaigns to increase awareness of ways to
                                                                                                     and generate a UK-level
                      reduce meat being wasted, such as Love Food Hate Waste.
                                                                                                     estimate, for comparison
                   • Actively engage with employees (as citizens) on wasting less food.
                                                                                                     with 2007 data.

Large meat            Actions for meat processors, hospitality and food service (HaFS) businesses,   % of sector (poultry/ pork/
processors,           retailers:                                                                     beef/ lamb processing; retail,
retailers, and        • Set an ambitious food waste reduction target (e.g. to halve food waste by    HaFS) - with targets and
hospitality and          2030).                                                                      providing evidence of action.
food service          • Adopt a GHG reduction target in line with the principles of the science-
                                                                                                     Overall reduction in meat
businesses are           based target initiative.
                                                                                                     waste, and GHG emissions
taking action to      • Robustly measure and report on progress towards reducing food waste
                                                                                                     arising in poultry/ pork/ beef/
reduce their own         and GHG emissions.
                                                                                                     lamb processing; retail, HaFS
operational food      • Where surplus is unavoidable, increase the amount sent to redistribution
waste, GHG               charities to avoid waste.                                                   Tracked via reporting to
emissions and         • Actively engage with staff on wasting less food.                             WRAP through the Food
water impacts         • Have food waste reduction plans in place with suppliers.                     Waste Reduction Roadmap,
                      • Improve the efficiency of water use in processing operations and support     and to BEIS/via Climate
                         collective action to protect water resources in key sourcing areas, e.g.    Change Agreements.
                         through the Courtauld 2025 Water Ambition.

Playing our part as Actions for meat processors, retailers, HaFS businesses:                         Metrics and means of
a supply chain to     • Assist the development and implementation of delivery plans for NFU’s        tracking progress to be
help deliver            Net Zero and the UK Cattle Sustainability Platform, including adopting a     developed, in conjunction
productivity            common approach to measuring GHG emissions.                                  with NFU, AHDB, QMS, HCC,
improvements,         • Support the development and tracking of metrics / KPIs within each           Red Tractor, UK Cattle
GHG emissions           sector (beef, sheep, pigs and poultry) and the use of common tools to        Sustainability Platform and
reductions and          measure progress.                                                            others.
protection of         • Encourage better communication between producers and retail
natural assets          customers on market requirements, to help inform production plans
during livestock      • Use the data received from FSA inspections to provide timely feedback
(cattle, sheep, pigs)   to producers to help inform their animal health plans.
and poultry           • Use producer groups, and other Knowledge Transfer mechanisms, to
rearing.                share best practice, share insights on short / medium / longer term
                        horizons and enable feedback from producers.
                      • Continue to invest in R&D and new technologies to aid improvements in
                        productivity and reduce the environmental impact of feed.
                      • Support collective action to protect water resources and other natural
                        assets in key sourcing locations.

Sourcing soya for     Actions for meat processors, retailers, HaFS businesses:                       Proportion of UK soya
use in feed that is   • Commit to the goal of the UK Roundtable on Sustainable Soya                  sourcing for feed covered by
cultivated in a way                                                                                  an action plan under the UK
                      • Publish timebound plans to source soya that is cultivated in a way that
that protects                                                                                        Roundtable on Sustainable
                        protects against conversion of forests and valuable native vegetation.
against conversion                                                                                   Soya (currently 27%) –
of forests and        • Develop / implement practical action plans, with support from Efeca and      tracked and reported by the
valuable native         others (e.g. NGO’s, technology providers, certification schemes).            UK Roundtable on
vegetation                                                                                           Sustainable Soya

                                                                                                                               4
MEAT IN A NET ZERO WORLD

2.0 A Cross-Industry Vision
There has never been a more critical time for action. We are facing a warming world, with more
people and less land, water, energy and other resources to go around. As an industry we need to
work together to ensure that we use these resources efficiently and minimise our impact on the
environment, whilst safeguarding the health & welfare of our animals and the livelihoods of our
producers.

To deliver quality food to our customers, we work as a supply chain, and everyone has a role to
play:

   •   Producers – rear animals to meet a range of production standards, health & welfare
       outcomes and other market specifications;

   •   Feed producers – produce the feed that these animals need to thrive;

   •   Processors – source animals meeting requirements and process these into a number of
       products meeting specifications on size, weight, fat cover, etc.

   •   Retailers and hospitality and food service businesses – market products attractively to
       consumers; balancing fluctuating daily/ weekly/ monthly/ annual demands and changing
       trends; and

   •   Consumers – make daily choices on what, where & how to buy, store, cook and eat food.

Every link in the chain is a steward of the resources invested to produce the products that
consumers value.

Individually each part of the chain has taken major strides to improve efficiency and reduce
environmental impacts. But action at individual points in the chain can only take us so far and
can create inefficiencies for another part of the chain. So we need to work together to achieve
more.

For example, WRAP estimates that around 380,000 tonnes / year of the meat intended for
consumption is never eaten, and the greenhouse gas (GHG) emissions associated with producing
this amount to more than 4 million tonnes CO2-equivalents. Much of this is discarded after
purchase, at home - but there are actions that can be taken at different points in the supply chain
to help reduce wastage.

                                                                                                  5
MEAT IN A NET ZERO WORLD
Our commitments
We are collectively working towards a joint vision of improved resource efficiency from farm to
fork. We aim to make the UK meat industry a world-leading example of efficient and sustainable
meat production and supply.
We will achieve this by:
Playing our part as a supply chain to help deliver productivity improvements, GHG emissions
reductions and protection of natural assets (e.g. soil, water) during livestock (cattle, sheep,
pigs) and poultry rearing;
Sourcing soya for use in feed that is cultivated in a way that protects against conversion of
forests and valuable native vegetation;
Large meat processors, retailers, and hospitality and food service businesses continuing to
take action to reduce their own operational food waste, GHG emissions and water impacts;
and
Helping to halve the amount of meat thrown away at home.
Specific actions and progress indicators at each stage are included within this document.
Together these actions will make a significant contribution to the UK food and drink sector
achieving the ambitious targets set out in the Courtauld Commitment 2025 and UN Sustainable
Development Goal 12.3 to halve per capita food waste by 2030. They will also make an important
contribution to the UK’s target to bring all GHG emissions to net zero by 2050.
Together the UK meat industry also has ambitions to develop a GHG emission reduction target
aligned with what climate science says is necessary to help limit warming to 1.5◦C.
Tracking our progress
In partnership with WRAP we will track our progress – and provide examples of the actions we are
taking to inspire others. Working with WRAP will further ensure that results are independently
verified and publicly reported.
6
MEAT IN A NET ZERO WORLD
3.0 Action Areas
Five areas in which we believe we can make a real difference to improving resource efficiency
from farm to fork have been identified.
These mirror the key steps in the supply chain – and the major points of interface between
different supply chain stages.
1. Rearing / primary production
2. Processing
3. Point of sale - retail
4. Point of sale - hospitality and food service
5. Food waste at home
Figure 1 overleaf shows the relative scale of production volumes, wastes and GHG emissions
across these different stages – and where priorities for improving resource efficiency lie.
The following Sections set out our specific actions and commitments in each area. These actions
are also summarised in Table 1.
Defining ‘food waste’
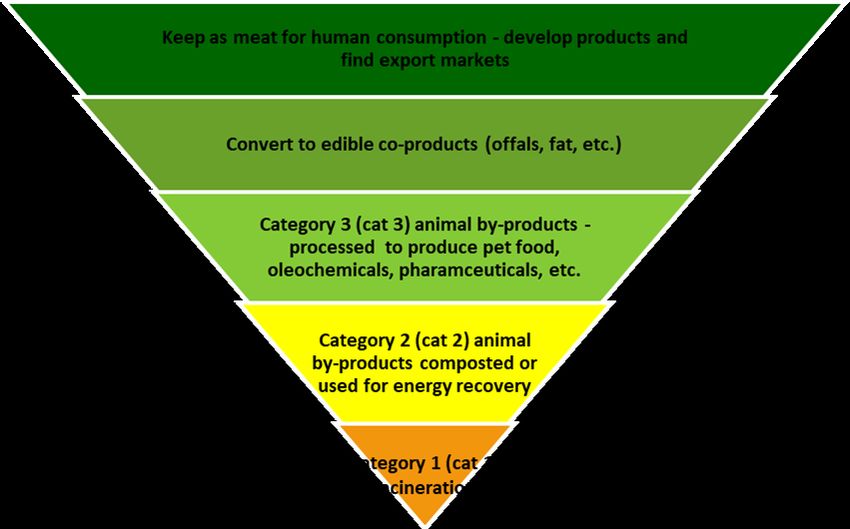
At each stage in the value chain, ‘waste / food waste’ is defined as: any meat product, or animal-
derived material sent to a waste destination (including anaerobic digestion, incineration
/controlled combustion, rendering with minimal valorisation (typically category 1 rendering), land
application, sewer/wastewater treatment). For the purpose of this ambition, we are focused on
material that, if managed differently, could have remained in the food chain. Of lower priority is
material classified as ‘inedible parts’ of food. ‘Inedible parts’ include category 1 ABPs (e.g.
specified risk material), feathers, hides, hair, etc. from processing; as well as bones, skin, etc. that
typically would not be eaten at home / out of home. In most cases this material cannot be
avoided, and so cannot typically be a target for waste reduction (although it is important to
quantify these ‘inedible parts’, take steps to get maximum value from them, and minimise the
impact of their use / disposal on the environment).
7MEAT IN A NET ZERO WORLD
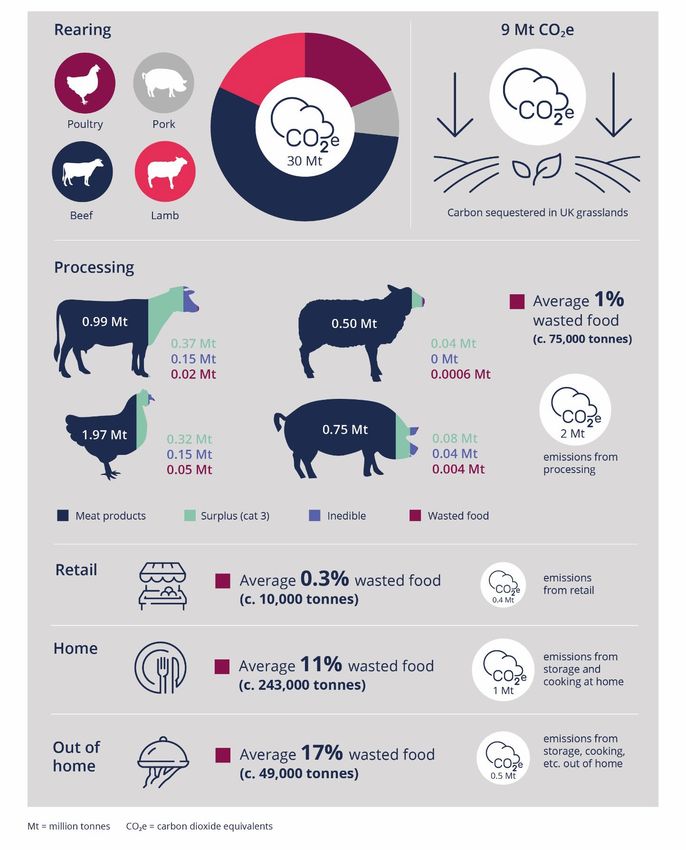
Figure 1 – Approximate scale of food waste and greenhouse gas emissions at different stages
in the meat supply chain
See Appendix 1 for data sources and assumptions.
NB - all GHG / CO2e values are estimates based on the GWP100 metric. There is ongoing discussion regarding alternative
accounting approaches for short-lived biogenic methane, as summarised in https://www.theccc.org.uk/publication/land-
use-policies-for-a-net-zero-uk/ p41-44.
8MEAT IN A NET ZERO WORLD
3.1 Rearing / Primary Production
Rearing livestock and poultry is the stage of the supply chain in which significant resources are
typically invested (e.g. water, feed, fuel, land, etc.), and where most GHG emissions occur.
However, farms are also important sinks for carbon sequestration and storage in soils and
vegetation, and are increasingly investing in renewable energy generation. Farms are therefore
well-placed to also contribute to reducing the UK’s overall GHG emissions.
Continued focus is being placed on improving both the health & welfare of animals and improving
the environmental footprint of farming systems.
ACTION AREAS
Action is being focused in the following areas:
1. Improving the productive efficiency of rearing. Focusing on ways to produce the same quantity
of food, or more, with fewer inputs. This encompasses actions such as:
• On-farm measurement of metrics linked to improved productivity – for example AHDB’s
beef and lamb farm productivity KPIs; close monitoring of feed conversion efficiency in
poultry and pig production, etc.
• A continued focus on health and welfare outcomes, responsible anti-microbial use,
improved biosecurity and disease risk mitigation.
• Ongoing genetic evaluations and research to improve productivity and reduce GHG
emissions through breeding.
• Supply chain communications and feedback to rear animals that best match consumer
demands for cuts, size, eating characteristics, etc.
• Research into feed additives and feeding regimes to increase conversion efficiency, or
reduce direct emissions from ruminant livestock (e.g. Rothamsted’s sheep ‘farm lab’).
• Actions to reduce N2O emissions through grassland management / manure spreading.
2. Reducing the environmental impact of producing feed. As well as improving the productive
efficiency of feed use (i.e. as above), this encompasses actions to:
• Avoid deforestation linked to soya use in feed. Soya is a valuable protein source that can
improve productive efficiency, particularly in pig and poultry rearing. However, some
cultivation methods are linked to tropical deforestation and conversion of native
vegetation, which is a major source of global GHG emissions. This has prompted action
through the UK Roundtable on Sustainable Soya (see below), and R&D into alternative
feed formulations and/or breeding approaches that utilise less soya.
• Use more circular feed sources – e.g. optimising grass in livestock systems; or use of
surplus from food production that are safe to eat by animals, with no effect on biosecurity
9MEAT IN A NET ZERO WORLD
or productive efficiency. This could include linking arable or horticultural and livestock
farmers to reduce waste on farm.
• Explore the potential for scale-up of novel feed ingredients - that could deliver
improvements in land-use and GHG emissions. Such ingredients may include single cell
proteins, algae, insects and amino acids. This is the focus of the Forum for the Future’s
Feed Compass programme – which has developed criteria to assess and compare the
sustainability of different feedstocks. An Insect Biomass Task & Finish Group represents
key stakeholders who are working together to deliver insect production at scale in the UK.
3. Farmland carbon storage, protecting natural resources and renewable energy generation.
Recognising the positive contribution that farmland can make to reducing GHG emissions,
protecting water resources and other natural capital benefits such as flood protection, this
encompasses actions to:
• Increase the sequestration and storage of carbon on farmland – for example through
improved grassland management, enhancing soil health and organic matter testing;
enhancing and increasing hedgerows; woodland / shelter belt management and planting;
and peatland / wetland restoration to reduce losses.
• Manage natural assets on farmland - for example through interventions to reduce soil
erosion and increase woodland planting, buffer strips, ponds or wetland features. These
actions all contribute to improving water quality, habitat provision, carbon sequestration
or flood mitigation.
• Generate renewable energy on-farm – for example through anaerobic digestion of animal
manures; on-farm solar panels and wind turbines.
DELIVERING CHANGE AT SCALE
A series of sector-wide initiatives are set to have a transformative effect on reducing the
environmental impact of livestock and poultry rearing.
We recognise, however, that they will only deliver if we, as a supply chain, all get behind them. We
also recognise the need for clear and consistent messages to our suppliers.
• Net Zero: Farming’s 2040 vision. The NFU has a game-changing vision to reach net zero
GHG emissions for agricultural production by 2040. This will be delivered by boosting
productivity, increasing farmland carbon storage and coupling bioenergy to carbon
capture and storage. This is a hugely important ambition and will require partnership
working across the supply chain, as well as government, academics and other
stakeholders. Delivery plans and metrics to track progress are being developed 1.
1
NB – ‘net zero’ will be delivered across the whole industry combined, not individual enterprises, such as a livestock enterprise.
However, each sector will have a role to play, particularly in delivering productivity improvements and reducing direct emissions, which
together are estimated to contribute c.25% of the GHG savings needed (https://www.nfuonline.com/nfu-
online/business/regulation/achieving-net-zero-farmings-2040-goal/).
10MEAT IN A NET ZERO WORLD
• European Roundtable for Beef Sustainability / UK Cattle Sustainability Platform. The UK
Cattle Sustainability Platform is a group of businesses committed to delivering the eight
core outcomes agreed within the European Roundtable for Beef Sustainability. Spanning
the core sustainability pillars of environmental impacts, animal medicines, animal health &
welfare and farm managements, these outcomes include a specific action to reduce GHG
emissions intensity by 15% by 2025. Delivery plans and metrics to track progress are
being developed and agreed within the group.
• UK Roundtable on Sustainable Soya. The UK Roundtable on Sustainable Soya brings
together food & drink business, feed companies and industry bodies to work together to
achieve a shared goal of a secure, resilient, sustainable supply of soya to the UK.
Signatories have a commitment to publish timebound plans to source soya that is
cultivated in a way that protects against conversion of forests and valuable native
vegetation. Businesses are now developing practical action plans, with support from Efeca
(facilitator of the Roundtable and wider UK Sustainable Soya Initiative) and a wider network
of partners including NGO’s, technology providers, certification schemes and others. 27%
of UK soya sourcing is now covered by a deforestation and conversion free soya standard
– aiming for 100% deforestation and conversion free sourcing.
• Courtauld 2025 Water Ambition. The Courtauld 2025 Water Ambition brings together
food & drink businesses, water companies and on-the-ground advisory bodies to improve
supplier resilience linked to water availability, water quality, flooding and soil protection.
Led by The Rivers Trust, WWF and others, it includes a programme of collective action
projects in key sourcing locations (e.g. South West England for cattle; East Anglia for pigs;
Welsh borders for poultry) – each of which has identified a set of locally-specifically
objectives and KPIs to improve water quality, soil retention, etc.
OUR COLLECTIVE COMMITMENT TO ACTION
Recognising the important role that we, as a supply chain, can play; our commitment is to support
the delivery and outcome of these important initiatives.
Specifically, we will:
Assist the development and implementation of delivery plans for Net Zero and the UK
Cattle Sustainability Platform, including adopting a common approach to estimating/
reporting on GHG emissions.
Support the development and tracking of metrics / KPIs within each sector (beef, sheep,
pigs and poultry) and the use of common tools to measure progress.
Use the data we receive from FSA inspections to provide timely feedback to producers to
help inform their animal health plans, using the common terminologies agreed across
industry.
Encourage better communication between producers and retail customers on market
requirements, to help inform production plans.
11MEAT IN A NET ZERO WORLD
Use our producer groups, and other Knowledge Transfer mechanisms, to share best
practice, share insights on short / medium / longer term horizons and enable feedback
from producers.
Deliver our commitments to source soya for use in feed that is cultivated in a way that
protects against conversion of forests and valuable native vegetation.
Continue to invest in R&D and new technologies based on the latest science and evidence,
to aid improvements in productivity and reduce the environmental impact of feed.
Support knowledge exchange at all levels to make sure producers are best equipped to
make the correct decisions for their business and to reduce global warming.
Support collective action to protect water resources and other natural assets in key
sourcing locations, e.g. through the Courtauld 2025 Water Ambition.
We will report on the actions we have taken.
EXAMPLES OF ACTION IN PROGRESS
Producer Case Studies
NFU case studies
NFU have collated a series of case studies that demonstrate how the actions outlined are already being
applied in practice on farms across the UK: British Livestock and Climate Change.
Kepak producer case study: elite sheep genetics that are improving efficiency and
reducing GHG emissions
Kepak St Merryn producer Geordie Parker keeps 650 ewes in the hills at Slaidburn, near Clitheroe in
Lancashire. He was one of the first producers to join an innovative scheme developed by St Merryn in 2016
which provides exclusive access to Kepak Focus Prime rams. Bred in the UK for St Merryn, these rams are
selected for growth, muscling, lambing ease and lamb survival to provide Kepak suppliers with a sire that
leaves more lambs on the ground, growing quickly on a forage based system to meet Kepak specifications.
Geordie now has a gang of 5 Kepak Focus Prime rams – half of the number of rams he was needing to
cover the same ewes before. The lambs are finishing well off grass, meeting the St Merryn weights and
grades 2-3 weeks earlier than his other terminal sired lambs and with lambs reaching the target
specification in just 11 weeks. Getting the lambs away earlier frees up more grass for his breeding sheep
so that he needs to use less concentrates in the run up to tupping. With lambs spending fewer days on
farm, making more use of his grass and needing less concentrates plus a team of rams that earn their keep,
this new approach is good for his on farm efficiency and reduces methane emissions.
12MEAT IN A NET ZERO WORLD
Using data and research to improve performance
Research activities
Significant R&D efforts are being invested to identify effective interventions across each of the action areas
above. Notable research groups include: ADAS; AFBINI; Harper Adams; IBERS; Rothamsted North Wyke;
SRUC; University of Nottingham.
AHDB, Hybu Cig Cymru and Quality Meat Scotland all have extensive research programmes.
AHDB Farmbench
AHDB Farmbench enables producers to benchmark themselves against others with comparable systems,
against a range of productivity measures. An easy to use online benchmarking tool, Farmbench helps to
identify where strengths and weaknesses lie within a farm business. At present, it is available for beef, lamb
enterprises (as well as dairy, combinable crop, potato and sugar beet).
Electronic Medicine Book (eMB Pigs)
E-medicine Book (EMB Pigs) can act as a medicine book for producers but importantly collates the antibiotic
usage data for pig producers. All Red Tractor producers (over 90% pigs in the UK) submit their data on a
quarterly basis. They can use the system to assess their use but also to benchmark their use against other
producers. This information is used by the producer but also by the vet at the quarterly veterinary visit –
and is actioned in the veterinary health plan which is put together by the vet annually.
Supply chain and collaboration examples
Cross-sector partnerships to maximise beef from dairy herds
Beef sourced from the dairy herd is generally significantly less GHG-intensive because its footprint is shared
with dairy co-products 2. In the UK, there has been a fundamental shift in the volume of beef sourced from
UK dairy herds, with dairy-bred beef now representing over 55% of all UK beef – a 10% increase in the last
decade 3. This has been achieved by leading dairy and beef producers working in partnership, and through
cross-sector initiatives, to maximise the potential of male calves. AHDB’s manual provides information for
dairy farmers wanting to grow and finish their own calves and beef producers purchasing dairy-bred calves.
2
https://www.theccc.org.uk/publication/land-use-policies-for-a-net-zero-uk/; Poore, J. & Nemecek, T. (2018) Reducing food’s
environmental impacts through producers and consumers. Science, 360 (6392), 987-992.
3
Arla UK 360 programme
13MEAT IN A NET ZERO WORLD
Improving eating quality
All supply chains are striving to produce the quality demanded by their customers. Specifications, based on
the blueprints originally produced by the Meat and Livestock Commission, are widely used.
Two projects in Wales - the Beef Eating Quality and Lamb Eating Quality projects – are testing an enhanced
carcase quality grading system based on eating quality. This system will enable predictions of beef/lamb
carcase eating quality and guide the introduction of new carcase data feedback, benchmarking and
decision-support systems to the Welsh Beef and Lamb supply chains. This is aimed primarily at producers,
but will help address a challenge later in the supply chain: customer returns linked to eating quality.
Tackling water stress through collective action
Processors and retailers are working together to reduce water stress in three pilot areas across the UK:
Tamar in South West England; Wye & Usk on the Welsh borders; and CamEO/Broadlands in East Anglia.
Each are important rearing areas cattle, poultry and pigs respectively – and are internationally important
river ecosystems, as well as providing critical functions for communities and the local economy. The health
of the rivers within each area is threatened by diffuse pollution, in particular linked to soil degradation,
nutrient losses from yards or fields, and historic loss of protective wetland and woodland habitats.
Projects are seeking locally-important outcomes, for example to reduce phosphate and nitrogen run-off,
reduce soil loss, improve soil structure, provide protective habitat, improve overall water quality
classification, etc.
Examples of actions include:
• Streamlining messaging to suppliers and providing access to targeted farm advice, networking, etc.
• Mapping areas of high priority/shared interest to focus effort on interventions with greatest benefit.
• Targeted interventions, such as:
o Strategic tree-planting for flood alleviation / provision of protective habitat;
o Installation of silt traps – to capture run-off, improve water quality and reduce flood risk;
• Signposting farmers to other potential schemes and funding support
14MEAT IN A NET ZERO WORLD 3.2 Processing From the point of receipt at an abattoir, through cutting, processing and packing into final product, very little goes to waste. Currently, processors report that up to c.1-2% (sometimes less) of throughput ends up as ‘ wasted food’ (excluding the inedible parts never intended for human consumption) 4. Based on volumes processed in the UK5, this equates to around 75,000 tonnes per annum. The majority of this food waste is used for renewable energy generation / via anaerobic digestion, or is spread on land as fertiliser. Whilst waste levels are very low, resources like energy, fuel and water are used in processing and efforts are focused on reducing the amount - and impacts of - energy and water consumed. ACTIONS AREAS The industry has made significant gains to maximise the yield of products that can be sold for consumption, or other purposes – along the following hierarchy. A ‘best case’ carcase balance for different species is shown in Table 2. Table 2: Example benchmark for dead weight KPIs KPI Beef 1 Sheep 1 Pork 2 Poultry 2 % saleable product / throughput 71% 90% 85% 79% % Cat 1 or 2 / throughput 10%
MEAT IN A NET ZERO WORLD
From both a financial and environmental perspective, the aim is to maximise the proportion of
saleable product and decrease the amount of material downgraded as either category 1or 2 by-
products, as less value can be extracted from these materials and disposal costs are higher.
However, there can be instances in which the most efficient balance of products is not achieved.
Reasons why this can occur are:
• Limited access to available markets (e.g. for co-products) or services (e.g. cat 3 collections);
• Waste contracts – e.g. minimum volumes for viable cat 1 collections;
• Human error - mis-classifications, floor waste, etc.;
• Machine waste – e.g. non-saleable trim, residues from product changeovers;
• Waste from product trials; and
• Wash downs – and lack of visibility of ‘food waste’ losses to sewer.
Leading meat processing businesses have committed to adopt actions within the WRAP and IGD
Food Waste Reduction Roadmap, which calls on businesses to set an ambitious food waste
reduction target, report on progress and take action to reduce food waste.
As earlier noted, as well as intake of animals, the processing sector uses other resources – e.g.
water and energy / fuel. Leading businesses have been focusing effort on improving energy
efficiency, switching to renewables, reducing water consumption and improving water quality.
OUR COMMITMENT TO ACTION
We are aiming for more than 75% of the UK’s meat processing capacity to be taking action to:
Reduce food waste in processing operations by 50% by 2030, in line with the best practice
outlined in the Food Waste Reduction Roadmap.
Reduce GHG emissions from processing operations. Best practice is to set a science-
based target, in line with the criteria set by the Science Based Targets Initiative.
Improve the efficiency of water use in processing operations and actively support wider
water stewardship in key sourcing areas, through the Courtauld 2025 Water Ambition.
PROGRESS TO DATE
14 of the largest meat processors have committed to the Food Waste Reduction Roadmap
and to reduce food waste in processing operations by 50% by 2030 6. Between 2017 and
2018 they collectively reported c.10,000 tonnes of food waste reduction, including more than
1,000 tonnes (c. 5 million meal portions) redistributed to local communities. Case studies of
the action taken are available here.
GHG emissions from meat processing decreased by c.10% between 2015 and 2018 7.
Many major meat processors were also reported to be taking action to help protect water
resources in key sourcing areas, through the Courtauld 2025 Water Ambition.
6
Food Waste Reduction Roadmap Progress Report 2019
7
Based on time-series energy consumption data from the Office for National Statistics
16MEAT IN A NET ZERO WORLD
3.3 Point of Sale – Retail
Around 10,000 tonnes of meat were estimated to have been discarded at retail outlets in 2015 8.
This represented 0.3% of reported meat purchases 9.
Whilst only a small proportion of meat items are discarded at this stage, meat is a high-value
category and has been the focus for continuous improvement and innovation.
ACTION AREAS
There has been significant investment to reduce waste in-store, notably through:
Packaging innovations – such as skin packs and modified atmosphere packaging to extend
shelf life, prevent browning, etc. These innovations help reduce waste at home; and one
retailer has also quantified how new packaging to extend shelf life on steaks has reduced
waste in-store by 8% 10. The benefit of this reduction in waste; as well as extending the life
for consumers at home far outweighs the resources used in additional packaging 11.
Continuous improvements in forecasting and stock control systems.
Developing systems and processes to divert more food surplus to redistribution
organisations and to animal feed, instead of general waste management.
The way that products are packaged and sold can also help reduce wastage at home. This has
been a further area of focus, for example by:
• Helping citizens to buy the right amount (e.g. by providing smaller packs for individuals; or
providing individual portions on counters, or as individual quick frozen items);
• Giving consumers as long as possible to use items (shelf life and open life);
• Making it clear when products can be frozen – and making it easier to defrost, or cook them
from frozen;
• Giving advice on serving sizes / cooking the right amount; and
• Providing tips and advice on what to do with leftovers.
The most important areas for action to help reduce the waste of meat products are outlined in
Section 3.5.
In the distribution and storage of meat products, the retail sector also uses other resources – e.g.
water and energy / fuel. Whilst total use of these is relatively small in comparison with other
8
Latest dataset available: Quantification of food surplus, waste and related materials in the supply chain, WRAP 2016. Adjusted to
meat vs fish based on relative purchase data from Defra’s Family Foods Survey.
9
Defra’s Family Foods Survey
10
Food Waste Reduction Roadmap Progress Report 2019
11
e.g. as reported in http://www.wrap.org.uk/sites/files/wrap/packaging_design_to_reduce.pdf; and BPF%20brochure%20WEB2.pdf
17MEAT IN A NET ZERO WORLD
stages in the supply chain, leading businesses have been focusing effort on improving energy
efficiency, switching to renewables, reducing water consumption, etc.
OUR COMMITMENT TO ACTION
All UK retailers have already committed to reduce food waste in their own operations by 50% by
2030, in line with the best practice outlined in the Food Waste Reduction Roadmap.
As part of this, our commitment is to:
Continue to invest in innovations to reduce waste occurring at point of sale.
Where waste is unavoidable, increase the amount sent to redistribution organisations.
Adopt known best practice to help consumers get the most from their meat purchases
and throw less meat away (measured via the KPIs in Section 3.5).
We also commit to:
Reduce GHG emissions from retail operations (e.g. by adopting a GHG reduction target in
line with the principles of the Science Based Targets Initiative).
Improve the efficiency of water use in retail operations and actively support wider water
stewardship in key sourcing areas, through the Courtauld 2025 Water Ambition.
PROGRESS TO DATE
Six retailers have now published time-series data on food waste from their operations, and
five have reported absolute reductions ranging from 15% to 27% compared to their baselines
(which range from 2013 to 2017/18) – across all food types (not just meat). Overall retail food
waste in 2018 showed a 4.6% reduction compared to the 2007 SDG12.3 baseline, but a 6%
increase between 2015 and 2018 12. Individual retailer food waste is subject to fluctuations
over time.
GHG emissions from retail (across all grocery products) operations decreased by 34%
between 2015 and 2018 13.
Many major retailers were reported to be taking action to help protect water resources in key
sourcing areas, through the Courtauld 2025 Water Ambition.
WRAP’s most recent survey of products on-shelf 14 found improvements in adoption of best
practices to help reduce food waste at home across a number of areas. For example, wide
availability of small packs for many meat items, some increases in average available shelf life;
and more products carrying a snowflake logo to indicate they can be frozen (see Section 3.5).
12
https://wrap.org.uk/sites/files/wrap/Progress_against_Courtauld_2025_targets_and_UN_SDG_123.pdf
13
https://wrap.org.uk/sites/files/wrap/Progress_against_Courtauld_2025_targets_and_UN_SDG_123.pdf
14
http://www.wrap.org.uk/content/retail-survey-2019
18MEAT IN A NET ZERO WORLD
3.4 Point of Sale – Hospitality and Food Service
Around 50,000 tonnes of meat were estimated to have been discarded at hospitality and food
service (HaFS) outlets / sites in 2012 15. Further research is being undertaken to update this
estimate.
Being predominantly comprised of multiple small outlets and sites, a key challenge for this sector
is to be able to accurately measure the amount of food wasted in kitchens and by customers,
understand why it occurs, and target reduction efforts to best effect.
ACTION AREAS
Food waste occurs in hospitality and food service operations for three main reasons:
Spoilage – food that is not used in time (e.g. goes out of date)
Preparation - food that is thrown away during preparation (e.g. offcuts)
Plate – food that is left on customers’ plates
WRAP is undertaking further work to understand the relative scale of waste across these for meat
products – including the principle causes and potential solutions. Some known challenges are:
• The ‘10 day rule’ - which sets a maximum shelf life on vacuum packed meat products which
cannot be guaranteed to be kept below 3oC with customers. This limits the extent to which
shelf life can be extended. It is significant challenge in both retail and hospitality and food
service supply chains; but particularly affects the latter, as vacuum-packed supply is common
in the industry. The British Meat Processors Association (BMPA) has undertaken research to
demonstrate that food safety is not compromised up to 14-21 days for beef and lamb vacuum
pack/tray skin packs and 15 days for pork vacuum packs; and is in discussion with the Food
Standards Agency (FSA) and others.
• Regulations related to labelling meat for freezing / longer storage.
• Customer returns - e.g. as result of eating quality. Whilst all supply chains are strive to
produce the quality demanded by their customers (and specifications based on blueprints
originally produced by the Meat and Livestock Commission are widely used), the Beef Eating
Quality and Lamb Eating Quality projects in Wales are testing an enhanced carcase grading
system based on eating quality – which helps tackle this challenge earlier on in the supply
chain.
In the preparation and storage of meat, and other, products, the hospitality and food service
sector also uses other resources – e.g. water and energy / fuel. Whilst total use of these is
relatively small in comparison with other stages in the supply chain, leading businesses have been
15
Overview of Waste in the UK Hospitality and Food Service Sector, WRAP 2013. Latest dataset available. ‘Avoidable’ meat waste only
(not including bones, skin). Adjusted to meat vs fish based on relative purchase data from Defra’s Family Foods Survey.
19MEAT IN A NET ZERO WORLD
focusing efforts on improving energy efficiency, switching to renewables, reducing water
consumption, etc.
OUR COMMITMENT TO ACTION
The hospitality and food service sector has already set itself some challenging targets to reduce
food waste, within a Hospitality and Food Service Action Plan. This action plan has targets (by
2030) for all large hospitality and food service businesses to:
Set an ambitious food waste reduction target (e.g. to halve food waste by 2030).
Robustly measure food waste and report on their progress towards reducing food waste.
Actively engage with their staff and consumers on food waste reduction.
Have food waste reduction plans in place with suppliers.
As part of this, we commit to working with WRAP, the Sustainable Restaurant Association (SRA),
and others, to understand the principal reasons why meat items are wasted in hospitality and
food service operations; and support the development of a playbook of interventions to help
reduce meat waste.
We also commit to:
Reduce GHG emissions from hospitality and food service operations (e.g. by adopting a
GHG reduction target in line with the principles of the Science Based Targets Initiative).
Improve the efficiency of water use in hospitality and food service operations and actively
support wider water stewardship in key sourcing areas, through the Courtauld 2025 Water
Ambition.
PROGRESS TO DATE
24 hospitality and food service businesses (c. 20% of the sector by turnover) have committed
to the Food Waste Reduction Roadmap. Around 50% of these businesses have measured and
reported their food waste, and – as a result – have achieved significant reductions (in some
cases up to 50% reduction (across all food types). Case studies of the action taken are
available here.
WRAP's Guardians of Grub campaign was launched in May 2019, to empower professionals
from across the sector to reduce the amount of food thrown away. Resources are designed
around the practical task of food waste measurement. September 2019 saw the first
Guardians of Grub ‘Stand Up For Food’ month of action, with partners (influencers and
operators) encouraging the sector to measure the food they waste in order to reduce it.
GHG emissions from hospitality and food service operations decreased by 8% between 2015
and 2018 16.
16
https://wrap.org.uk/sites/files/wrap/Progress_against_Courtauld_2025_targets_and_UN_SDG_123.pdf
20MEAT IN A NET ZERO WORLD
3.5 Waste at Home
WRAP’s evidence suggests that – once purchased and at home – more than 200,000 tonnes of
meat that could have been eaten (>10% of purchases) are discarded every year (latest dataset:
2012).
This is an enormous waste of the precious resources that have been invested in their production.
The reasons why food is a thrown away at home are many and complex. Available evidence from
householder diaries and compositional analysis is shown Figure 2. Notable, in particular, is the
80,000 tonnes/year that is thrown away because it is ‘not used in time’ (e.g. the ‘Use By’ date, or
the ‘once opened use within…’ date had expired).
Figure 2: Scale and reasons for meat waste at home
• 280,000 tonnes (34% purchases) of
poultry are thrown away each year
• 110,000 tonnes (13% purchases) of it is
wasted food – not, skin, bones, etc.
• Majority is chicken carcass meat (i.e.
meat left on whole birds)
• 146,000 tonnes of pork products are
thrown away each year
• This includes sausages (34,000t), sliced
ham (22,000t), bacon (21,000t) and
carcase meat (21,000t)
• 99,000 tonnes (12% of purchases) of it is
wasted food that could have been eaten
• 20% was thrown away unopened, or in
nearly full packs
• 56,000 tonnes of beef products are
thrown away each year
• 34,000 tonnes (8% purchases) of it is
wasted food – not, skin, bones, etc.
• 17% was packaged when thrown away
• Most was thrown away in larger
instances (>400g)
Source: https://www.wrap.org.uk/content/household-food-drink-waste-%E2%80%93-product-focus
21MEAT IN A NET ZERO WORLD
ACTION AREAS
The way products are packaged, labelled and priced can make a significant difference on waste
levels at home. There is also a huge role for more education / awareness-raising on the actions
householders can take to reduce waste (e.g. when it’s safe to freeze/defrost, use of leftovers).
Based on WRAP’s available evidence, 5 priority actions to reduce meat waste at home are:
1. Maximising the shelf life available to consumers (i.e. the amount of time remaining on the ‘Use
By’ date). Retailers constantly need to strike a balance between on-shelf availability, providing
shelf life for consumers and reducing in-store waste. But investigating ways to ensure
consumers have more time to eat what they buy is a known priority. WRAP’s most recent
survey of products on-shelf found that average available shelf life for a number of high volume
meat items had increased slightly between 2011 and 2019 (e.g. chicken breasts, sliced ham),
or was already high (e.g. bacon) 17. There are limits on the extent to which shelf life can be
feasibly extended, but it remains a focus for innovation and continuous improvement.
2. Extending, clarifying or removing ‘open life’ statements on-pack. For example ‘Once opened use
within x days’. These statements are only advised when needed for food safety in addition to
the date label (i.e. where an opened pack could become harmful before the date code
expires). WRAP’s most recent survey of products on-shelf found that some bacon and
sausage packs carry no open life statement, for example. If these statements are needed for
quality purposes, rather than safety purposes, then the term ‘best within’ is advised. WRAP is
undertaking further work to understand how consumers interact with open life statements,
but in a recent survey, 55% of respondents reported that they ‘regularly’ or ‘quite often’ refer
to these open life statements 18. On this basis, removing, or extending open life statements is
estimated to have the potential to reduce meat waste at home by an additional 10,000
tonnes/year 17.
3. Helping customers choose the right pack size for their needs. WRAP’s evidence suggests that
having a wider range of pack-sizes / formats at the right price could help prevent more than
20,000 tonnes/year of meat products going to waste17. This is because single person
households (and homes in which householders eat as individuals) waste 40% more per capita
than other households, with a primary reason cited as not being able to buy packs that are
the right size for their needs. These households are growing in number and will continue to
do so in the next 20 years, which presents a significant risk to escalating food waste. WRAP’s
most recent survey of products on-shelf found that small packs of many meat items were
found in the majority of stores sampled, and at a reasonable price point17. Individual portions
of many meat items are also available through deli/meat counters in some retailers, and as
easily-portioned frozen products (e.g. individually frozen chicken breasts). However, further
action is needed in some areas to make smaller packs of key items i) more widely available at
the right price point; and ii) attractive to consumers. The latter is important because of
consumer concerns over additional packaging for smaller items – which do not reflect the
17
WRAP Retail Survey 2019: http://www.wrap.org.uk/content/retail-survey-2019
18
WRAP citizen food waste tracker survey, May 2019. Unpublished.
22MEAT IN A NET ZERO WORLD
reality of the unnecessary packaging (and cost) when items are purchased and then thrown
away.
4. Helping to encourage more people to freeze (and then use) meat products instead of
throwing them away. WRAP estimates that increasing freezing (and use) of key meat items
could reduce waste from items not used in time by c.15,000 tonnes/year17. With fast-paced,
time-poor lifestyles and lower levels of food skills, the time taken to defrost items, and
consumer nervousness around how to safely defrost is a significant challenge. There is a
need for solutions to make it easier for consumers to use their frozen items – with the easiest
option being to cook from frozen. Cook from frozen instructions were not found on any of
the meat items sampled in WRAP’s most recent on-shelf survey17. For some meat items,
cooking from frozen may not be possible (for food safety reasons). However, this is an area in
which further action and innovation is needed. There is also a need for the basics on-pack: a
snowflake logo, and clear information on safely freezing and defrosting. On-pack information
also needs to be coupled with wider consumer awareness-raising.
5. Encouraging more creative use of leftovers. This applies in particular to whole joints / whole
birds, or other items which are not individually portioned. For example, nearly 50,000 tonnes
of poultry that could have been eaten are reported to be thrown away a year, with the reason
given as ‘cooked or served too much’ (Figure 2). The majority of this is meat on carcases.
Changing consumer behaviour in this regard is very challenging, but there is an important role
for more recipes and tips - either on pack where space allows, or through other media. On-
pack information also needs to be coupled with wider consumer awareness-raising by, for
example, supporting Love Food Hate Waste campaigns. As another example, NFU’s autumn
turkey campaign provides information on using leftovers, through social media, leaflets, etc.
Awareness Raising
WRAP’s Love Food Hate Waste (LFHW) campaigns provide practical tools and
advice to make it as easy as possible to reduce food waste at home.
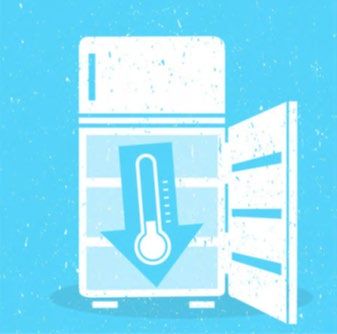
For example, keeping food at the right temperature is one simple way to make
it last as long as possible – but many people don’t know how to set their fridge
temperature. WRAP’s LFWH Chill the Fridge Out awareness campaign
encourages householders to check and set their fridge temperature. It includes
a web-based tool (Chill the Fridge Out)) that draws upon information from
over 20 of the biggest fridge manufacturers, enables users to select their
make of fridge/ type of fridge dial, and provides instructions on how to set it
to below 5oC.
A recent survey reported that, of people who has seen Chill the Fridge Out
materials, 33% had changed the temperature of their fridge in the last
month (twice as likely as someone who hadn’t).
There is a role for everyone in helping increase awareness – by widely
sharing and promoting Love Food Hate Waste resources to customers and
employees though the range of channels available to them.
23MEAT IN A NET ZERO WORLD
OUR COMMITMENT TO ACTION
Recognising the role that we can play in helping to reduce food waste at home, our commitment
is to:
Adopt known best practices for on-pack labelling and guidance across the 5 priority areas
identified above.
Work on new solutions and innovations.
Support consumer-facing campaigns, such as Love Food Hate Waste, to increase
awareness and understanding of ways to reduce waste.
Our overarching ambition is to halve the amount of wasted meat products thrown away at home,
which would mean > 100,000 tonnes / year less waste and c. 2 million tonnes avoided GHG
emissions.
Progress will be demonstrated via the KPIs set out in Table 3 – evidenced through WRAP’s annual
Retail Survey and consumer surveys. WRAP will also repeat its household food waste survey on a
periodic basis and generate a UK-level estimate, for comparison with 2007 and 2012 data.
24MEAT IN A NET ZERO WORLD
Table 3: KPIs for actions to reduce meat waste at home
KPI Best practice ambition by 2025 Relevant products and current position (WRAP Retail
Survey 2019)
Average days shelf life found + 1 day increase from 2019 Chicken breasts – 5.2 days (9% ≤2 days)
in store baseline Whole chicken - 4.7 days (13% ≤2 days)
Beef mince – 4.1 days (19% ≤2 days)
% products with ≤2 days life >95% items with more than 2 days Beef burgers - 4.1 days (5% ≤2 days)
life Bacon – 21 days (2% ≤2 days)
Sausages – 6.6 days (8% ≤2 days)
Ham – 12.8 (2% ≤2 days)
Presence of open life Where not required for food Bacon – 4% of products with no statement
statements safety – 100% with no statement, Sausages – 10% with no statement
or ‘…best within x days’)
Range of days open life given Variation in open life statements Chicken breasts – 1 day or use immediately
minimised Beef mince – 1 day or use immediately
Beef burgers -1 day or use immediately
Bacon – 2 or 3 days where present
Sausages – 1 day or 2 days where present
Ham – all 2 days
Availability of small packs and 100% availability – either packed Chicken breasts – small pack found in 78% of
price differential between or on counters. Not more than stores (35% more expensive per kg)
small and larger packs* 35% more expensive per kg Bacon – small pack found in 63% of stores (17%
more expensive per kg)
Sausages – small pack in 76% of stores (34% more
expensive per kg)
Ham – small pack found at 1 retailer only (45%
more expensive per kg)
% products marked as 100% of applicable product All fresh/processed meat items (except ham/other
suitable for freezing / with marked as suitable for freezing deli-meats) - 56%
snowflake logo and with a snowflake logo
% products saying “Freeze on 0% of products saying Freeze on All fresh/processed meat items (except ham/other
Day of Purchase” Day of Purchase. Best practice is deli-meats) - 30%
to use “Freeze as soon as possible,
but always by the date mark
shown”
% products with cook from Increase in adoption (100% is All fresh/processed meat items (except ham/other
frozen instructions unlikely as some will not be deli-meats) – 0%
feasible for food safety)
% householders reporting >75% reporting regular freezing / Chicken (all items) – 75% regularly freeze
they freeze (and use Other meat items – tbd (not yet sampled – reported
subsequently use) key meat in one study as 10% for sausages/bacon; 50% for
items other meat items))
% products with leftover 100% products carrying recipes or Whole chicken – 7% (one retailer)
recipes / tips tips – where space allows All other meat items – 0%
% householders reporting >75% reporting regular freezing / No current baseline information
they regularly use leftovers use
NB – KPIs cover the most important action areas for fresh / chilled products (not frozen products). Provision of deli/meat
counters and frozen products are also important ways to help reduce waste at home, but evidence suggest that a proportion
of shoppers will always default to pre-packed fresh products, rather than frozen/loose.
* Defined as items that could be consumed by 1 person within the open life. For chicken this included 2-packs and split packs;
for bacon this included 4- and 6-packs (including split pack formats); for sausages this included 6-packs; and for ham this
included 70g packs. Research has found < 35% to be the level of price difference that presents less of a barrier to purchase.
25You can also read