RED MEAT SUB-SECTOR SKILLS PLAN - 2018-2019 Prepared on behalf of the Sector by AgriSETA
←
→
Page content transcription
If your browser does not render page correctly, please read the page content below
RED MEAT SUB-SECTOR SKILLS PLAN
          2018-2019
 Prepared on behalf of the Sector by AgriSETA

                   April 2018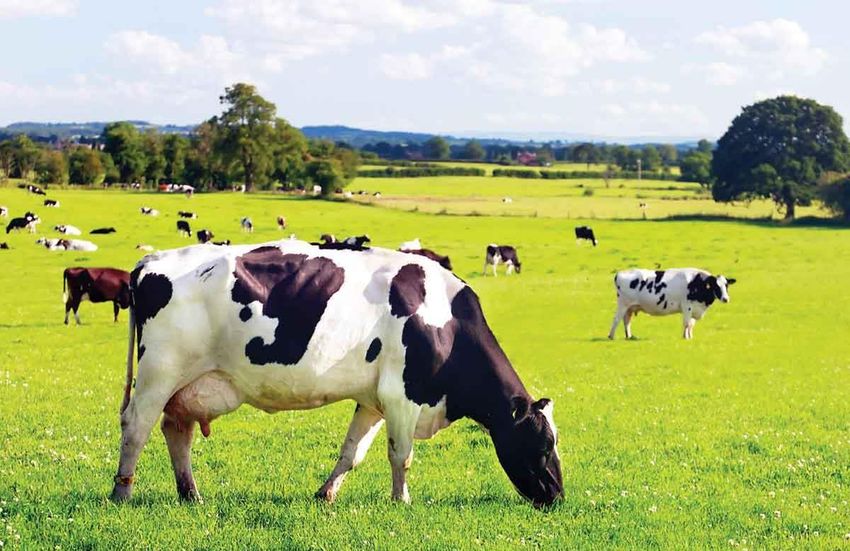
ABBREVIATIONS AND ACRONYMS

  ABBREVIATION/ACRONYM                                 DESCRIPTION
AFASA                    African Farmers Association of South Africa
AGOA                     African Growth and Opportunity Act
AGRISETA                 Agricultural Sector Education and Training Authority
APAP                     Agricultural Policy Action Plan
ATR                      Annual Training Report
BMI                      Business Monitor International
CoS                      Centres of Specialization
DAFF                     Department of Agriculture, Fisheries and Forestry
DHET                     Department of Higher Education and Training
DRDLR                    Department of Rural Development and Land Reform
DTI                      Department of Trade and Industry
FETMIS                   Further Education and Training Management Information System
GDP                      Gross Domestic Product
HEMIS                    Higher Education Management Information System
HSRC                     Human Sciences Research Council
HTFV                     Hard To Fill Vacancies
IGDP                     Integrated Growth Development Plan
IDP                      Integrated Development Plan
IPAP                     Industrial Policy Action Plan
IRR                      Institute of Race relations
KZN                      KwaZulu-Natal
NAFU                     National African Farmers Union
NAMC                     National Agricultural Marketing Council
NDP                      National Development Plan
NERPO                    National Emergent Red Meat Producers Organization
NGP                      New Growth Path

                                                                                        i
NEETS      Not in Employment, Education or Training
NSDS III   National Skills Development Strategy III
NSFAS      National Students Financial Aid Scheme
QLFS       Quarterly Labour Force Survey
QCTO       Quality Council for Trade and Occupations
RMSA       Red Meat Association of South Africa
RPL        Recognition of Prior Learning
SARMA      South African Red Meat Association
SACAU      Southern African Confederation of African Unions
SADC       Southern African Development Community
SAIVCET    South African Institute for Vocational Continuing Education and
           Training
SAQA       South African Qualifications Authority
SARS       South African Revenue Service
SDA        Skills Development Act
SIC        Standard Integrated Project
SIP        Standard Industrial Classification
SSP        Sector Skills Plan
SIZA       Sustainability Initiative of South Africa
STATSSA    Statistics South Africa
TVET       Technical Vocational Education and Training
WCTA       Western Cape Trout Association
WSP        Workplace Skills Plan
WTO        World Trade Organization

                                                                             ii
TABLE OF CONTENTS
ABBREVIATIONS AND ACRONYMS ..................................................................................................................................................... i
TABLE OF CONTENTS ........................................................................................................................................................................ ii
LIST OF TABLES AND FIGURES .......................................................................................................................................................... iv
EXECUTIVE SUMMARY ...................................................................................................................................................................... v
1. DOCUMENT REVIEW ……………………………………………………………………………………………………………………………………………………………….vi

2. SCARCE AND PIVOTAL LIST FORMULATION ……………………………………………………………………………………………………………………………vii

3. SUMMARY OF KEY FINDINGS ………………………………………………………………………………………………………………………………………………..vii

CHAPTER 1: SECTOR PROFILE............................................................................................................................................................ 1
    1.1           INTRODUCTION ............................................................................................................................................................. 1
    1.2           SCOPE OF COVERAGE .................................................................................................................................................... 2
    1.3           KEY ROLE PLAYERS ......................................................................................................................................................... 4
    1.4           ECONOMIC PERFORMANCE........................................................................................................................................... 6
    1.5           EMPLOYER PROFILE ..................................................................................................................................................... 10
    1.6           LABOUR MARKET PROFILE........................................................................................................................................... 11
    1.7           CONCLUSION ............................................................................................................................................................... 15
CHAPTER 2: KEY SKILLS ISSUES ........................................................................................................................................................ 16
    2.1           INTRODUCTION ........................................................................................................................................................... 16
    2.2           CHANGE DRIVERS ........................................................................................................................................................ 16
    2.3           ALIGNMENT WITH NATIONAL STRATEGIES AND PLANS .............................................................................................. 17
    2.4           IMPLICATIONS FOR SKILLS PLANNING ......................................................................................................................... 18
    2.5           CONCLUSION ............................................................................................................................................................... 18
CHAPTER 3: OCCUPATIONAL SHORTAGES AND SKILLS GAPS .......................................................................................................... 19
    3.1           INTRODUCTION ........................................................................................................................................................... 19
    3.2           OCCUPATONAL SHORTAGES AND SKILLS GAPS ........................................................................................................... 20
    3.3           EXTENT AND NATURE OF SUPPLY ................................................................................................................................ 23
    3.4           PIVOTAL LIST................................................................................................................................................................ 25
    3.5           CONCLUSION ............................................................................................................................................................... 28
CHAPTER 4: SECTOR PARTNERSHIPS ............................................................................................................................................... 29
    4.1           INTRODUCTION ........................................................................................................................................................... 29
    4.2           EXISTING PARTNERSHIPS ............................................................................................................................................. 30
    4.3           EMERGING PARTNERSHIPS .......................................................................................................................................... 31
    4.4           CONCLUSIONS ............................................................................................................................................................. 32
CHAPTER 5: SKILLS PRIORITY ACTIONS ........................................................................................................................................... 33
    5.1           INTRODUCTION ........................................................................................................................................................... 33
    5.2           KEY FINDINGS .............................................................................................................................................................. 34
    5.3           CONCLUSION AND RECOMMENDED ACTIONS ............................................................................................................ 35
BIBLIOGRAPHY ................................................................................................................................................................................ 36

                                                                                                                                                                                              iii
LIST OF TABLES AND FIGURES

FIGURES

FIGURE 1: DISTRIBUTION OF AGRICULTURAL ENTITIES BY SUBSECTOR ....................................................... 3
FIGURE 2: RED MEAT VALUE CHAIN ............................................................................................................. 3
FIGURE 3: SKILLS DEVELOPMENT LEVIES ...................................................................................................... 4
FIGURE 4: GROSS FARMING SECTOR INCOME .............................................................................................. 8
FIGURE 5: PROVINCIAL DISTRIBUTION OF RED MEAT EMPLOYERS REGISTERED WITH AGRISETA ............ 11
FIGURE 6: PROVINCIAL BREAKDOWN – RED MEAT EMPLOYEES ................................................................ 12
FIGURE 7: GENDER BREAKDOWN ............................................................................................................... 13
FIGURE 8: EMPLOYEES BY RACE .................................................................................................................. 13
FIGURE 9: EMPLOYMENT BREAKDOWN WITHIN THE RED MEAT SUBSECTOR .......................................... 14
FIGURE 10: UNIVERSITIES THROUGHPUT FOR AGRICULTURAL STUDENTS GRADUATING IN 2013-2014 .. 23
FIGURE 11: NUMBER OF POST-SCHOOL GRADUATES IN AGRICULTURAL SECTOR .................................... 24

TABLES

TABLE 1: RESEARCH PROCESS AND METHODS ............................................................................................ vi
TABLE 2: ACTIVITIES WITHIN THE RED MEAT SUBSECTOR BY SIC CODE ...................................................... 2
TABLE 3: KEY AGRICULTURAL ROLE-PLAYERS ............................................................................................... 4
TABLE 4: LIVESTOCK STATISTICS 2016 .......................................................................................................... 7
TABLE 5: MEAT AND EDIBLE OFFAL IMPORTED AND EXPORTED, 2012-2016 .............................................. 8
TABLE 6: LIVE ANIMALS IMPORTED AND EXPORTED, 2012-2016 ................................................................ 9
TABLE 7: DAIRY PRODUCTS IMPORTED AND EXPORTED, 2012-2016 ........................................................... 9
TABLE 8: DISTRIBUTION ON EMPLOYEES BY PROVINVE IN AGRICULTURE, 2016/2017 ............................. 11
TABLE 9: SMALL EMERGING FARMERS AND CO-OPERATIVES HTFVS......................................................... 20
TABLE 10: COMMERCIAL FARMERS HTFVs ................................................................................................. 20
TABLE 11: TOP HTFVs (STAKEHOLDER ENGAGEMENT)............................................................................... 21
TABLE 12: TOP EMERGING SUBSECTOR SKILLS AND FUTURE OCCUPATIONAL SHORTAGES ..................... 21
TABLE 13: SCARCE SKILLS AND SKILLS GAPS LIST ........................................................................................ 22
TABLE 14: EMPLOYEE TRAINED BY OCCUPATIONAL CATEGORY AND GENDER.......................................... 24
TABLE 15: THE AGRISETA 2018/19 PIVOTAL LIST ....................................................................................... 25
TABLE 16: AGRISETA PARTNERSHIPS .......................................................................................................... 30

                                                                                                                                              iv
EXECUTIVE SUMMARY

The South African Red meat sub-sector is considered dualistic in nature; meaning that there is a clear
distinction between commercial and smallholder sectors (informal/communal) sector. The informal sector
is further divided into two sub-sectors, which includes, small scale subsistence producers and emerging
producers (Cloete, 2013). Something unique to the African continent is that typically small scale
subsistence producers tend to keep livestock for either as some form of social standing or as an
investment.

In 2016 South Africa produced approximately 20% of the total meat produced on the continent of Africa,
and accounted for 1% of global meat production. In addition, the livestock industry contributes 34% of
the total domestic agricultural production and provided 36% of the population’s protein needs in 2016
(RMD SA, 2016). While there is a lack of statistics that covers the scope of the South African Red Meat
subsector, the tables below outline the import and export statistics on Meat and Edible Meat Offal, Live
Animals (excluding Poultry), and Dairy Products between 2012 and 2016.

Owing to the International Animal Health Organization declaring South Africa free of foot and mouth,
there has been an overall increase in the Red Meat sub-sector export market since 2014. The declaration
has allowed South Africa access to a number of export markets to countries such as Vietnam, the United
Arab Emirates and Jordan from the second quarter of 2014 onwards (BFAP, 2016).

Similar to other agricultural sub-sectors the recent draught has affected areas involved in cattle, sheep
and goat farming significantly. Approximately 590 000km2 has been negatively affected, which has
resulted in pockets of livestock mortality in provinces such as the Eastern Cape, while poor livestock
conditions were also recorded in the Free State (DAFF, 2016).

In additional factor limiting the sub-sector is the lack of appropriate infrastructure, poor access to usable
technical market information and well-functioning marketing and credit systems for commercializing the
emerging Red Meat sub-sector. Commercializing the emerging Red Meat sector would address these
constraints and ensure that farmers produce efficiently (RMD SA, 2016).

With that said, the Red Meat sub-sector is one of the best growing components of the agricultural
economy. Overall, the sector contributes approximately 40% of global value of agricultural output and
supports the livelihoods and food security of almost a billion people globally (SAIIA, 2014). In addition to
this, growing income levels and continued urbanization in South Africa has increased meat consumption
over the past decade. Changing lifestyles and the diets of the emerging middle class have changed to
incorporate animal proteins. Therefore, the industry is well placed grow, and in the process contribute to
the wider economic development of South Africa, both in production and provision of employment in
more rural population of the country (RMD SA, 2016).

                                                                                                           v
TABLE 1: RESEARCH PROCESS AND METHODS
OBJECTIVES DATA TIMEFRAME RESEARCH
RESEARCH RESEARCH NATURE OF
OF THE SAMPLE SIZE COLLECTION OF THE OUTPUTS
TOPICS METHODS THE STUDY
STUDY TOOLS STUDY
Labour Provide an Qualitative Analysis of 200 Desktop September – Chapter 1:
Market overview of and most recent registered research November Sector Profile
Profile and the subsector quantitative information Red Meat (secondary) 2017
Economic and economic method on the sector industry
Contribution contribution stakeholders 2016/17
WSP/ATR
data
(primary)
2016/17
Huge file data
(primary)
Occupational Establish Qualitative Non- 200 Key informant September – Chapter 2:
shortages & occupational method probability registered interviews November Key Skills
emerging shortages & sampling Red Meat (primary) & 2017 Issues
skills needs emerging method was industry desktop data
skills needs of employed to stakeholders analysis Chapter 4:
the Red Meat identify (secondary) Sector
subsector stakeholders Partnerships
from whom
specific Chapter 5:
information Skills Priority
was required Actions
Skills issues & Identify key Quantitative Gathering 20% were The September – Chapter 2:
demands occupational method empirical small and quantitative November Key Skills
shortages, evidence emerging survey 2017 Issues
demands & using primary farmers and gathered data
supply with data sources, 80% were on the Chapter 3:
regard to as well as commercial unskilled, Occupational
unskilled, undertaking farmers skilled and Shortages
skilled, theoretical, generic and Skills
generic Red desktop occupational Gaps
Meat research shortages &
subsector using skills gaps
occupations secondary
and emerging data sources
skills needs in
the
agricultural
sector
1. DOCUMENT REVIEW
A document review was conducted to establish the economic performance and trends of the Red
Meat subsector, geographic concentration and employers. Government policy and strategy
documents, as well as the key statistical and industry publications were reviewed and these are
viincluded in the bibliography. A thematic analysis was conducted to synthesize the key economic,
policy and training issues affecting the Red Meat subsector, and to identify key skills issues.
2. SCARCE AND PIVOTAL LIST FORMULATION
The scarce skills, skills gaps and pivotal skills lists were arrived at through both secondary data analysis
and the numbers made available in previous Sector Skills Plans, large and small workplace skills plans
(WSPs), large and small annual training reports, (ATRs), and primary data analysis obtained at the
two-day AgriSETA stakeholder conference (30-31 August 2017), interviews and data collection.
3. SUMMARY OF KEY FINDINGS
Overall the Red Meat subsector supply chain has become increasingly vertically integrated. The
integration is mainly fuelled by the feedlot industry, where most of the large feedlots own their own
abattoirs, or at least have some business interest in certain abattoirs. The South African Red Meat sub-
sector is considered dualistic in nature; meaning that there is a clear distinction between commercial and
smallholder (informal/communal) sectors. The informal sector is further divided into two sub-sectors,
which include, small-scale subsistence producers and emerging producers (Cloete, 2013). There is a total
of 8990 Red Meat subsector entities registered with the South African Revenue Services (SARS),
contributing 42% of total entities in the agricultural sector.
The AgriSETA members’ data base includes some 21 429 employers, 8990 (42%) of which are from the
Red Meat subsector. The data shows that the vast majority of registered Red Meat entities (92%) are small
(1-49 employees, followed by 6% medium (50-149) and 2% large entities (more than 149 employees).
viiCHAPTER 1: SECTOR PROFILE
1.1 INTRODUCTION
Chapter 1 of this report provides an overview of the agricultural sector, paying particular attention to the
Red Meat subsector in South Africa. The first section of this chapter looks at the scope of the Red Meat
subsector’s coverage. Followed by the second section, which outlines AgriSETA stakeholders and key role-
players in the sector. The third section looks at the economic performance of the overall agricultural
sector, zooming into the contribution of the Red Meat industry to the South African economy. The fourth
section explores the employer profile, based on the AgriSETA WSP/ATR data submitted for 2016. Finally,
the last section provides a labour market profile where the number and demographics of people
employed in the sector is explored. Essentially, chapter one of this document is intended to set the scene
for the skills issues delved into in the subsequent chapters.
11.2 SCOPE OF COVERAGE
The scope of AgriSETA covers the agricultural sector, from input services to the farm, activities on the farm
and first level processing activities from the farm. The Red Meat subsector is classified into twelve (12)
agricultural and economic focuses, namely: production and animal products; farming of cattle, sheep,
goats, horses, asses, mules, and hinnies; dairy farming; game farming; growing of crops combined with
farming animals; agricultural and animal husbandry services; other animal farming; slaughtering, dressing
and packing of livestock; production, sale and marketing of agricultural by products; slaughtering, dressing
and packing of livestock, including small game for meat and processing of ostrich products; wholesale
trade in agricultural raw materials and livestock; transport of livestock as supporting activity; and
agricultural livestock research. The table below outlines the various agricultural and economic focus areas
in the Red Meat subsector, including the Standard Industrial Classification (SIC) codes and descriptions:
TABLE 2: ACTIVITIES WITHIN THE RED MEAT SUBSECTOR BY SIC CODE
SUBSECTOR SIC CODE SIC DESCRIPTION
11141 Production and animal products (not elsewhere classified)
Farming of cattle, sheep, goats, horses, asses, mules, and hinnies;
11210
Dairy farming.
11222 Game farming
Growing of crops combined with farming of animals (Mixed
11300
farming)
Agricultural and animal husbandry services, except veterinary
11400
activities
RED MEAT
11402 Other animal farming (not elsewhere classified)
Slaughtering, dressing and packing of livestock, including poultry and small
30111
game for meat.
Production, sale & marketing of Agricultural by products (e.g.
30115
bones, hides)
Slaughtering, dressing and packing of livestock, including small
30117 game for meat and
processing of ostrich products
Source: AgriSETA, 2016
Overall, the agricultural sector comprises of 11 subsector committees, which represent their industry
interest to AgriSETA. These include: 1) Aquaculture; 2) Horticulture; 3) Red Meats and Cereals; 4) Fibre; 5)
Red Meat; 6) Poultry; 7) Milling, Pet food, and Animal feed; 8) Pest control; 9) Seed; 10) Sugar; 11)
Tobacco. The Red Meat subsector constitutes 45% of the overall distribution of entities represented by
AgriSETA. The graph below outlines the relative size of membership number by subsectors, as captured
in the AgriSETA member database of 2016.
2FIGURE 1: DISTRIBUTION OF AGRICULTURAL ENTITIES BY SUBSECTOR
Red meat (45%)
Horticulture (24%)
Grains and Cereals
(10%)
Fibre (9%)
Aquaculture (5%)
Poultry (2%)
Milling, Petfood,
Animal Feed (2%)
Pest control (1%)
Seed (1%)
Source: AgriSETA member database, 2016
The figure below depicts the Red Meat value chain. The main components of the value chain include
primary producers, feedlots, abattoirs, wholesalers and retailers. The Red Meat supply chain has become
increasingly vertically integrated. The integration is mainly fuelled by the feedlot industry, where most of
the large feedlots own their own abattoirs, or at least have some business interest in certain abattoirs. In
addition to this, some feedlots have integrated further down the value chain and sell directly to consumers
through their own retail outlets (FPM Report, 2004).
FIGURE 2: RED MEAT VALUE CHAIN
Source: FPM Report, 2004
31.2.1 Revenue from Skills Development Levies
In 2016/17, there was a total of 8990 Red Meat subsector entities registered with the South African
Revenue Services (SARS), contributing 42% of total entities in the agricultural sector. Of these 8990 entities
the figure below illustrates that 29% of them contribute to the skills development levy. A total of R87
million SDL was generated from the Red Meat subsector, accounting for 20% of total agricultural revenue
from SDL.
FIGURE 3: SKILLS DEVELOPMENT LEVIES
7000
6000
5000
NUMBER
4000
3000
2000
1000
0
Levy-paying Non-levy paying
Number 2601 6389
Percentage 29% 71%
Source: AgriSETA members’ database, 2016
1.3 KEY ROLE PLAYERS
There are a number of public and private key role-players in the agricultural sector which contribute
towards its functioning, including: national government departments, sector representatives and industry
bodies. For the sake of brevity, the table below groups these role-players according to their strategic
contribution to the sector. Please note that while as comprehensive as possible, this list is not exhaustive.
TABLE 3: KEY AGRICULTURAL ROLE-PLAYERS
Department or Relevance to agricultural skills
Strategic contribution
organisation development
Quality of education of entrants to labour
Department of Basic market,
Education career awareness programmes to expose
agriculture as a possible career choice
Responsible for TVETs, HETs, agricultural
Skills Development and Department of Higher colleges and skills development. Sets the
Research Education and Training national skills development agenda through
regulation of SETAs.
Provision of updated statistics on agricultural
Statistics SA
sector economics & labour force.
Scientific research on agricultural production
Agricultural Research Council
issues.
4Department or Relevance to agricultural skills
Strategic contribution
organisation development
Department of Trade and
Industrial strategy, international trade
Industry & Provincial
agreements, agricultural sector strategy and
Departments of Economic
policy implementation desk.
Development
Sector regulatory framework, strategy and
Strategy and
leadership, provision of extension services,
Policy Department of Agriculture
Broad Economic Empowerment funding of
Forestry and Fisheries
development interventions including provision
of bursaries for scarce skills.
Financial planning, incentives, accountability
National Treasury & SARS
of Land Bank, skills levies.
Labour legislation, wage determinations,
Department of Labour
employment equity
Department of Economic
Sector economic strategies
Development
Identification of inter-departmental overlaps
Planning National Planning Commission
and gaps
Policy and guidelines on environment
Department of Environmental
protection and natural resource management,
Affairs
partner in environmental education
Department of Transport Planning for transport needs in rural areas
Department of Rural
Partnering with AgriSETA in mobilising funds
Development and Land
for capacity building of claimants.
Rural Development and Reform
Land Reform Department of Cooperative Linking agricultural and rural development to
Governance and Traditional IDPs and LED, infrastructure and services to
Affairs & Municipalities agricultural enterprises
Department of Water Affairs Water Boards manage local irrigation schemes
Department of Energy Strategy to supply electricity to rural areas
Services Collaboration with agricultural community to
South African Police Service address issues of farm security, including
attacks, stock and property theft
Land and Agricultural
Financial services to commercial farming
Development Bank of South
sector, agribusiness, and emerging farmers.
Africa
Credit and assistance
Micro-Agricultural Financial
Production loans
Institutions of South Africa
to smallholder operators
(MAFISA)
Agricultural Union serving some 32 000 large
Agri South Africa (AgriSA)
and small commercial farmers.
National African Farmers’ Represents black farmers to level the
Union and Sector
Union of South Africa (NAFU) field in all agricultural matters.
representatives
The African Farmers’ Represents commercial African farmers to
Association of South Africa bring black commercial farmers into
(AFASA) mainstream agribusiness.
5Department or Relevance to agricultural skills
Strategic contribution
organisation development
Transvaal Agricultural Union A national agricultural
South Africa (TAU SA) union serving commercial farmers.
Food and Allied Workers Organize all workers engaged in Food Industry
Union (FAWU) in South Africa.
Fosters a favorable agribusiness
Agricultural Business Chamber
environment.
Conglomerate organization providing
Agribusiness
commodity strategic support and services to
Red Meat SA
South African Red Meat producers to support
sustainability.
Source: 2015 GCIS Handbook, Agriculture and AgriSETA SSP 2011-2016
1.4 ECONOMIC PERFORMANCE
1.4.1 Overview
The South African Red Meat subsector is considered dualistic in nature; meaning that there is a clear
distinction between commercial and smallholder sectors (informal/communal) sector. The informal sector
is further divided into two subsectors, which includes, small scale subsistence producers and emerging
producers (Cloete, 2013). Something unique to the African continent is that typically small scale
subsistence producers tend to keep livestock for either as some form of social standing or as an
investment.
Nonetheless, approximately 59 million hectares of South Africa has been reported as suitable for
extensive livestock farming. On account of this, the Integrated Sustainable Rural Development Strategy
(IRSDS, 2004) has identified livestock farming as the agricultural enterprise with the most likely chance of
improving household food security and addressing poverty alleviation in the small-scale communal
farming areas of South Africa (RMRD SA, 2016).
The table below outlines the livestock statistics across all nine provinces in South Africa. DAFF reported a
total of 43 259 million cattle, sheep, pigs and goats across the country. Overall, the province with the
highest proportion of livestock was the Eastern Cape (28%), followed by the Northern Cape and Free State
respectively accounting for 16% of total livestock in the country. An in-depth look at the data shows that,
the Eastern Cape accounts for 25% of cattle livestock, followed by KwaZulu-Natal (19%). Likewise, the
Eastern Cape accounts for 29% of sheep and the Northern Cape (35%); Limpopo makes up 24% of pig
livestock, followed by North West (21%); and the Eastern Cape has the highest proportion of goats (38%),
followed by Limpopo (18%).
6TABLE 4: LIVESTOCK STATISTICS 2016
CATTLE
WESTERN NORTHERN FREE EASTERN KWAZULU- NORTH
MPUMALANGA LIMPOPO GAUTENG RSA
CAPE CAPE STATE CAPE NATAL WEST
% 4% 4% 17% 25%100 19% 10% 7% 2% 12% 100%
NUMBER 528,074 501,407 2,220,133 3,221,505 2,517,724 1,313,321 979,596 246,135 1,618,238 13,146,133
SHEEP
WESTERN NORTHERN FREE EASTERN KWAZULU- NORTH
MPUMALANGA LIMPOPO GAUTENG RSA
CAPE CAPE STATE CAPE NATAL WEST
% 12% 25% 20% 29% 3% 7% 1% 0% 3% 100%
NUMBER 2,709,305 5,716,352 4,536,177 6,815,132 720,664 1,675,296 226,681 89,783 618,950 23,108,340
PIGS
WESTERN NORTHERN FREE EASTERN KWAZULU- NORTH
MPUMALANGA LIMPOPO GAUTENG RSA
CAPE CAPE STATE CAPE NATAL WEST
% 11% 2% 8% 6% 10% 8% 24% 10% 21% 100%
NUMBER 164,384 23,873 119,063 88,743 150,368 117,908 356,122 154,099 315,792 1,490,352
GOATS
WESTERN NORTHERN FREE EASTERN KWAZULU- NORTH
MPUMALANGA LIMPOPO GAUTENG RSA
CAPE CAPE STATE CAPE NATAL WEST
% 4% 9% 4% 38% 13% 1% 18% 1% 12% 100%
NUMBER 209,936 489,044 229,741 2,121,771 705,169 65,771 983,864 29,826 679,811 5,514,933
Source: DAFF, 2017
Overall, Agriculture contributes 2. 4% to South Africa’s gross domestic product (GDP) and 4.4% of total
employment (IRR, 2016). Notwithstanding the relatively small share of the total GDP, primary agriculture
is an important sector in the South African economy; the value of primary agricultural production in South
Africa was R263 billion in 2016, while its contribution to the GDP was estimated at 72 billion in 2015 (DAFF,
2016). In addition, the sector plays an important role in job creation, especially in the more rural parts of
the country.
One of the key factors underlying consumer trends has been the growth of disposable income in South
Africa. This is reflected in the increase of Red Meat product consumption over the last couple of years.
The gross farming income from all agricultural products increased by 12.7% in 2016 from R230 million in
2015 to R260 million. This is on account of the increase in gross income from horticulture products by
21%, field crops by 11% and animal products by 9% (from R113 705 million to R123 559 million). Prices of
animal products increased by 6% due to the increase in prices of pastoral products by 25%, slaughtered
stock by 9% and milk by 8%. The graph below outlines the gross value contribution of agricultural
production from 2012 to 2016. Overall, animal products contributed 47% to the total gross value of
agricultural production in 2016. The gross income from animal products was 9% higher in 2016 and
amounted to R123 559 million compared to R113 705 million in the previous year (DAFF, 2016).
7FIGURE 4: GROSS FARMING SECTOR INCOME
Source: Economic Review of the South African Agriculture, DAFF, 2016
In 2016 South Africa produced approximately 20% of the total meat produced on the continent of Africa,
and accounted for 1% of global meat production. In addition, the livestock industry contributes 34% of
the total domestic agricultural production and provided 36% of the population’s protein needs in 2016
(RMD SA, 2016). While there is a lack of statistics that covers the scope of the South African Red Meat
subsector, the tables below outline the import and export statistics on Meat and Edible Meat Offal, Live
Animals (excluding Poultry), and Dairy Products between 2012 and 2016.
TABLE 5: MEAT AND EDIBLE OFFAL IMPORTED AND EXPORTED, 2012-2016
MEAT AND EDIBLE MEAT OFFAL IMPORTED BY SOUTH AFRICA
IMPORTED IMPORTED IMPORTED IMPORTED IMPORTED
EXPORTERS
VALUE IN 2012 VALUE IN 2013 VALUE IN 2014 VALUE IN 2015 VALUE IN 2016
WORLD R6 090 848 R6 134 429 R6 102 101 R5 699 945 R7 781 336
MEAT AND EDIBLE MEAT OFFAL EXPORTED BY SOUTH AFRICA
EXPORTED EXPORTED EXPORTED EXPORTED EXPORTED
IMPORTERS
VALUE IN 2012 VALUE IN 2013 VALUE IN 2014 VALUE IN 2015 VALUE IN 2016
WORLD R1 488 179 R1 763 330 R2 759 383 R3 209 127 R4 116 848
Source: Trade Map, 2017
The table above illustrates the Meat and Edible Meat Offal imported and exported by South Africa in the
last five years. The data shows that imports increased by R2 081 million in 2016, from R5 699 million in
2015 to R7 781 million in 2016. While exports have increased significantly from 2012 (R1 488 million) to
R4 116 million in 2016, with an aggregate increase of R2 628 million.
8TABLE 6: LIVE ANIMALS IMPORTED AND EXPORTED, 2012-2016
LIVE ANIMALS EXPORTED BY SOUTH AFRICA
IMPORTED IMPORTED IMPORTED IMPORTED IMPORTED
EXPORTERS
VALUE IN 2012 VALUE IN 2013 VALUE IN 2014 VALUE IN 2015 VALUE IN 2016
WORLD R862 419 R1 124 402 R822 298 R1 284 120 R1 372 586
LIVE ANIMALS IMPORTED BY SOUTH AFRICA
EXPORTED EXPORTED EXPORTED EXPORTED EXPORTED
IMPORTERS
VALUE IN 2012 VALUE IN 2013 VALUE IN 2014 VALUE IN 2015 VALUE IN 2016
WORLD R346 556 R377 076 R510 720 R712 055 R807 597
Source: Trade Map, 2017
Similarly, the table above outlines the import and export value of Live Animals (excluding poultry) market
in South Africa. The data shows that there has been not been much of an increase in numbers between
2015 and 2016. However exports have increased by R461 041 from 2012 to 2016. Meanwhile, the table
below outlines the import and export value of Dairy products. Data shows that there has been a slight
increase in both imports and exports of Dairy products from 2016 to 2016, with imports accounted for R1
572 million in 2016 and exports R2 627 million in the same year.
TABLE 7: DAIRY PRODUCTS IMPORTED AND EXPORTED, 2012-2016
DAIRY PRODUCTS IMPORTED BY SOUTH AFRICA
IMPORTED IMPORTED IMPORTED IMPORTED IMPORTED
EXPORTERS
VALUE IN 2012 VALUE IN 2013 VALUE IN 2014 VALUE IN 2015 VALUE IN 2016
WORLD R1 213 384 R896 603 R1 271 762 R1 279 491 R1 572 548
DAIRY PRODUCTS EXPORTED BY SOUTH AFRICA
EXPORTED EXPORTED EXPORTED EXPORTED EXPORTED
IMPORTERS
VALUE IN 2012 VALUE IN 2013 VALUE IN 2014 VALUE IN 2015 VALUE IN 2016
WORLD R1 903 272 R2 367 610 R2 720 213 R2 366 770 R2 627 824
Source: Trade Map, 2017
Owing to the International Animal Health Organization declaring South Africa free of foot and mouth,
there has been an overall increase in the Red Meat subsector export market since 2014. The declaration
has allowed South Africa access to a number of export markets to countries such as Vietnam, the United
Arab Emirates and Jordan from the second quarter of 2014 onwards (BFAP, 2016).
91.4.2 Economic Outlook of the Sub-sector
Similar to other agricultural subsectors the recent draught has affected areas involved in cattle, sheep and
goat farming significantly. Approximately 590 000km2 has been negatively affected, which has resulted
in pockets of livestock mortality in provinces such as the Eastern Cape, while poor livestock conditions
were also recorded in the Free State (DAFF, 2016).
An additional factor limiting the subsector is the lack of appropriate infrastructure, poor access to usable
technical market information and well-functioning marketing and credit systems for commercializing the
emerging Red Meat subsector. Commercializing the emerging Red Meat subsector would address these
constraints and ensure that farmers produce efficiently (RMD SA, 2016).
With that said, the Red Meat subsector is one of the best growing components of the agricultural
economy. Overall, the subsector contributes approximately 40% of global value of agricultural output and
supports the livelihoods and food security of almost a billion people globally (SAIIA, 2014). In addition to
this, growing income levels and continued urbanization in South Africa has increased meat consumption
over the past decade. Changing lifestyles and the diets of the emerging middle class have changed to
incorporate animal proteins. Therefore, the industry is well placed grow, and in the process contribute to
the wider economic development of South Africa, both in production and provision of employment in
more rural population of the country (RMD SA, 2016).
1.5 EMPLOYER PROFILE
The AgriSETA members’ database includes some 21 429 employers, 8990 (42%) of which are from the Red
Meat subsector. The data shows that the vast majority of registered Red Meat entities (92%) are small (1-
49 employees), followed by 6% medium (50-149 employees) and 2% large entities (more than 149
employees).
The provincial distribution of Red Meat employers registered with AgriSETA is reflected in the pie chart
below, with provincial distribution by employer size in figure 5.
10FIGURE 5: PROVINCIAL DISTRIBUTION OF RED MEAT EMPLOYERS REGISTERED WITH AGRISETA
Eastern Cape
10%
Western Cape
22% Eastern Cape
Free State
Free State
11% Gauteng
KwaZulu-Natal
Limpopo
Northern Cape
10% Gauteng Mpumalanga
11% North West
North West Northern Cape
5%
KwaZulu-Natal Western Cape
13%
Mpumalanga
15% Limpopo
3%
Source: AgriSETA members’ database, 2016
The figure above shows that the majority of Red Meat employers registered with AgriSETA are in the
Western Cape (22%), followed by Mpumalanga (15%) and KwaZulu-Natal (13%). The provinces with the
least number of registered employers in the Red Meat subsector include: Limpopo (3%) and North West
(5%). It is important to note that the AgriSETA database does not represent all farming enterprises in the
country, and thus must be treated with a fair degree of caution when applying it to a national context. For
instance, Limpopo is a known farming province, but is underrepresented in AgriSETA numbers.
Nevertheless, there is significant number of stakeholders expressing an interest in skills development in
the agricultural sector.
1.6 LABOUR MARKET PROFILE
1.6.1 Provincial distribution of employees
The South African Agricultural sector is one of the biggest employers in the country. In the first quarter of
2017, STATSSA reported that a total of 875 000 people were employed in the sector, with the Western
Cape (25%) accounting for the majority of employees in the sector, followed by Limpopo and Kwazulu-
Natal, respectively accounting for 16% of employees.
TABLE 8: DISTRIBUTION ON EMPLOYEES BY PROVINVE IN AGRICULTURE, 2016/2017
PROVINCE 2015/2016 2016/2017
Western Cape 228 000 26% 215 000 25%
Eastern Cape 95 000 11% 87 000 10%
Northern Cape 40 000 5% 47 000 5%
11PROVINCE 2015/2016 2016/2017
Free State 72 000 8% 70 000 8%
KwaZulu-Natal 131 000 15% 141 000 16%
North West 54 000 6% 50 000 6%
Gauteng 37 000 4% 36 000 4%
Mpumalanga 95 000 11% 89 000 10%
Limpopo 118 000 14% 140 000 16%
TOTAL 870 000 100% 875 000 100%
Source: Statistics South Africa, 2017. Quarterly Labour Force Survey. 1 st Quarter 2017
The figure below outlines the Red Meat employment distribution by provincial breakdown. Contrary to
the livestock statistics mentioned earlier which saw the concentration of livestock in the Eastern Cape
(28%), data from the AgriSETA WSP submissions (2016) shows that the provinces with the highest
proportion of both permanent and seasonal/temporary employees in the Red Meat subsector is Gauteng
and Kwazulu-Natal, with each accounting for 19% of total employees in the subsector; while the Eastern
Cape only accounts for 6% of employees. The vast difference in numbers is possibly a result of the fact
that not all employers submit WSPs to AgriSETA; only a total of 174 Large and Medium employers
submitted WSPs in 2016.
FIGURE 6: PROVINCIAL BREAKDOWN – RED MEAT EMPLOYEES
8 000
7 000
6 000
5 000
NUMBER
4 000
3 000
2 000
1 000
0
KwaZulu- Northern
Eastern Cape Freestate Gauteng Limpopo Mpumalanga North West Western Cape
Natal Cape
PERCENTAGE 6% 9% 19% 19% 7% 8% 9% 5% 17%
NUMBER 2335 3175 7083 7088 2513 2903 3293 1904 6189
Source: AgriSETA WSP Submissions, 2016
121.6.2 Gender
The graph below gives a breakdown of the Red Meat subsector by gender as reported in the WSP
submissions (2016). Data shows that the highest proportion of employees are male, accounting for
approximately 70% of total employment, while females make up the other 30%.
FIGURE 7: GENDER BREAKDOWN
Female
33%
Female
Male
Male
67%
Source: AgriSETA WSP Submissions, 2016
1.6.3 Race
The WSP (2016) shows that the majority of employees in the subsector are African (76%), followed by
Coloured employees (14%), and White employees (10%). Indian/Asian employees only represent less than
1% of people employed in the subsector.
FIGURE 8: EMPLOYEES BY RACE
White
10%
Indian/Asian
0%
Coloured
14% African
Coloured
Indian/Asian
White
African
76%
Source: AgriSETA WSP Submissions, 2016
131.6.4 Age
There is a relatively equal number of employees between the age group “less than 35” people between
the ages 35 to 55. People employed in the Red Meat sub-sector by employers submitting WSP are
considered youth (less than 35 years old) which accounts for 46% of employees; while age group 35 to 55
accounts for 44% of employees. Employees over the age of 55 only account for 10%.
1.6.5 Occupational categories
The last section of chapter one looks at the existing skills levels in the Red Meat subsector as reported in
the WSPs submitted for 2016. Skills vary from highly skilled managerial and professional occupations to
relatively low level skilled elementary occupations. The figure below illustrates that the majority of people
employed in the subsector occupy Elementary positions (30%), followed by Managers, who account for
24% of employees in the subsector. The lowest number of employees occupy Services and Sales positions
(2%), and Technicians and Clerical Support Workers each make up 4% employees in the respective
occupational categories in the subsector.
FIGURE 9: EMPLOYMENT BREAKDOWN WITHIN THE RED MEAT SUBSECTOR
Elementary Occupations
Plant and Machine Operators
Skilled Agricultural and related Trade workers
Service and Sales Workers
Clerical Support Workers
Technicians and Associate Professionals
Professionals
Managers
0 2 000 4 000 6 000 8 000 10 000 12 000
Skilled
Technicians and Plant and
Clerical Support Service and Sales Agricultural and Elementary
Managers Professionals Associate Machine
Workers Workers related Trade Occupations
Professionals Operators
workers
Number 8649 1540 2979 3768 727 3743 4045 11142
Percentgage 24% 4% 8% 10% 2% 10% 11% 30%
Source: AgriSETA WSP Submissions, 2016
141.7 CONCLUSION
Having a firm sense of the Red Meat subsector contribution to the economy in terms of production and
employment, we can now more readily identify key skills issues that speak to this economic reality. The
subsequent chapters identify key skills issues as framed by government legislation, policies and
frameworks; and further identifies key macro socio-economic and environmental factors that function as
key change drivers in addressing skills development in the agricultural sector
15CHAPTER 2: KEY SKILLS ISSUES
2.1 INTRODUCTION
Having outlined the Red Meat subsector profile in chapter one, this chapter is concerned with two specific
areas that shape the key skills issues in the subsector. Firstly, the alignment of sector skills planning to national
strategies, and plans will be analyzed to provide a snapshot of the key policy and planning documents that
shape skills planning in the Red Meat subsector. Secondly, the bulk of this chapter will be concerned with
identifying factors that are driving change in the sector, which are influencing the need for a particular skills
sets or rendering them irrelevant in an ever changing world.
2.2 CHANGE DRIVERS
This section of the report identifies the key themes and issues driving change and influencing skills demand
and supply in the Red Meat subsector. These change drivers were identified through thematic synthesis and
triangulated through internal and external stakeholder engagement, desktop research and relevant policy
documents.
2.2.1 Climate Change and Draught
The 2015/2016 drought, a result of the worldwide El Niño effect, already only 46% of South Africans are food
secure (HSRC, 2014), and the drought could have further deleterious effects on food security. The drought,
along with other challenging environmental factors, could act as a disincentive from pursuing an agricultural
career. National food security depends on a “capital-intensive agricultural sector based on economies of scale”
(Kane-Berman, 2016), and thus smaller producers are even more at risk during the drought – a difficult
economic and environmental climate in which to take risks. Subsistence and smaller commercial farms should
be offered support, but equally commercial farms need to attract those with sustainable farming skills to
ensure food security for South Africans generally.
162.2.2 The Youth Bulge and Skills Development
Youth, people aged 15 – 35, comprise 36% of the South African population, and 70% of the unemployed
(StatsSA, 2016). This presents a huge challenge for skills development generally, and specifically for the
agricultural sector, with a waning interest in agriculture and rapid urbanisation. The South African
Confederation of Agricultural Unions (SACAU) has called on stakeholders to recognise agriculture as a “high
skilled business with great opportunities for the youth” (AgriSA, 2016). But when youth are largely unskilled or
undereducated, there needs to be major up-skilling across the board before they can take advantage of
available employment opportunities. Demographically, there is a generalised mismatch between the demand
for skilled labour, and the supply of unskilled labour.
2.2.3 Brexit & EU trade agreements
While the effects of Brexit on South African agribusiness are yet to become clear, what is clear is that South
Africa would have to renegotiate its trade agreements with the UK. Senior agricultural economist in Agricultural
Business Chamber, Mr Wandile Sihlobo, commented that, “market access benefits that existed through the
agreement would no longer apply” (Mchunu, 2016). Agricultural subsidies are one of the key issues related to
Brexit. The UK is a critic of current European subsidies which have historically had an impact on African farmers’
export capacity (Sow & Sy, 2016). The outcome of renegotiated trade agreements will have to be monitored.
2.3 ALIGNMENT WITH NATIONAL STRATEGIES AND PLANS
The following section draws attention to the national strategy and planning documents that frame AgriSETA’s
mandate for skills development. The legislative and policy frameworks speak to AgriSETA’s constitutional
mandate as a public institution governed by the Public Finance Management Act to develop skills programmes
in accordance with the Skills Development Act, (1998), the Skills Development Levies Act (1999), and the
National Qualifications Framework Act (2008).
There are two seminal strategic documents that underpin AgriSETA’s mandate for skills planning, namely: the
White Paper on Post School Education & Training (2013) and the National Skills Development Strategy III (NSDS
III) (2011 – 2016). Both of these documents highlight the SETAs roles in developing clear, sector-specific
linkages between education and the workplace through an analysis of the demand and supply of skills in their
sector. These documents call for credible institutional mechanisms for skills planning, programmes that are
occupationally oriented, and responsive higher and further education and training institutions. Furthermore,
attention should be given to the needs of local, community enterprises, co-operatives and the like, with a focus
on developing their skills capacities to meet the needs of their particular environments, thereby closing the
gap between the rural and urban South African economies.
The NSDS III is informed and guided by the following overarching government plans: The National Skills Accord
as one of the first outcomes of the New Growth Path, the Industrial Policy Action Plan, 2013/14 – 2015/16
(IPAP), the Comprehensive Rural Development Programme, the Human Resources Development Strategy for
South Africa 2030, the National Development Plan 2030 (NDP), and the Integrated Sustainable Rural
Development Strategy (ISRDS). Collectively, these government plans and programmes recognize the need for
correcting structural imbalances in the economy through “decent employment through inclusive growth”, “a
skilled and capable workforce to support an inclusive growth path”, “vibrant equitable and sustainable rural
17communities contributing towards food security for all”, to “protect and enhance our environmental assets
and natural resources”, with the support of “an efficient, effective and development-oriented public service”
(NDP). All these priorities speak to the need for relevant and targeted skills provision that promotes economic
sustainability in the agricultural sector, as well as meeting the needs of all South African communities, both
rural and urban, in terms of food provision and sustainable livelihoods.
2.4 IMPLICATIONS FOR SKILLS PLANNING
In this chapter we have seen that the legislative and policy frameworks established by government, coupled
with the contextual change drivers and industry specific perspectives on skills development point to the
following 4 skills implications that need to be addressed in the Red Meat Subsector Skills Plan.
1. Improved quality of agricultural extension services qualifications.
2. Partnerships with Higher Education Institutions (HEIs) for research and development into the subsector.
3. The need for occupationally oriented skills training that offers in-the-field experience and mentorship.
4. Environmental concerns related to food security and ecological sustainability.
2.5 CONCLUSION
In this chapter we have seen that the legislative and policy frameworks established by government, coupled
with the contextual change drivers and industry specific perspectives on skills development point to 4 skills
implications that need to be addressed in the Red Meat subsector Skills Plan. Chapter 3 will elaborate on the
specific demand and supply of skills in the agricultural sector to identify gaps and mismatches in skills provision,
providing evidence that the skills issues identified in this chapter articulate with what is happening on the
ground.
18CHAPTER 3: OCCUPATIONAL SHORTAGES AND SKILLS GAPS
3.1 INTRODUCTION
Chapter 3 reflects the research completed on skills demand and supply in the Red Meat subsector. The
outcome is the result of an analysis of previous Sector Skills Plans, 2014/15 and 2015/16 WSP data, as well as
engagement with AgriSETA stakeholders. Engagements included interviews, surveys and limited focus groups
with external partners, stakeholders and AgriSETA member companies, as well as consultation with internal
stakeholders, conducted between 2015 and 2017. Effort was taken to ensure cross sectoral inputs were
obtained by reaching out to large levy payers, industry bodies, government departments as well as emerging
small scale entrants in the sector.
193.2 OCCUPATONAL SHORTAGES AND SKILLS GAPS
3.2.1 Hard-To-Fill Vacancies (HTFVs)
The analysis conducted has identified the hard-to-fill vacancies (HTFVs) and skills issues as they pertain to the
Red Meat subsector. The skills issues, gaps, as well as the emerging skills needs as identified through the survey
and WSP submissions analyses are outlined in the tables below. Firstly, the needs of small-emerging farmers
and co-operatives are addressed, followed by the needs of commercial farmers.
TABLE 9: SMALL EMERGING FARMERS AND CO-OPERATIVES HTFVS
Subsector Skills and/or Qualifications Gaps OFO Code
“Blokman”/Butcher 2017-681103
Red meat Meat Inspector 2017-325703
Livestock Mixed Crop and Livestock skills 2017-841601
TABLE 10: COMMERCIAL FARMERS HTFVs
Subsector Skills and/or Qualifications Gaps OFO Code
National Certificate: Animal Production 2017-613101
National Certificate: Farming 2017-613101
Red meat National Certificate: Mixed Farming Systems 2017-613101
National Diploma: Animal Production 2017-613101
Dairy specific training 2017-325703
National Certificate: Abattoir Slaughtering Processes 2017-134915
National Certificate: Abattoir Supervision 2017-134915
National Certificate: Agri Sales and Services 2017-122101
National Certificate: General Abattoir Processes 2017-134915
National Certificate: Perishable Produce Export Technology 2017-325703
National Diploma: Agri Sales and Service Management 2017-122101
20The following table outlines the top HTFVs as identified by external stakeholders in the Red Meat subsector.
TABLE 11: TOP HTFVs (STAKEHOLDER ENGAGEMENT)
Hard-to-fill Vacancies (HTFVs) REASON
Abattoir managers/supervisors Manage safety & health issues, control over staff, meat inspection
Disease controllers/inspectors Training – management of serious outbreak of sector related
diseases (Avian flu, brucellosis)
Animal welfare officials Skills on local & international legislation & welfare at abattoirs
The following table presents the top emerging skills and future demand needs in the Red Meat subsector drawn
from the results of the external stakeholders’ survey (2016).
TABLE 12: TOP EMERGING SUBSECTOR SKILLS AND FUTURE OCCUPATIONAL SHORTAGES
Subsector Top Emerging Skills and Future Demand Needs
Veterinarians
Auctioneers
RED MEAT
Marketing
Business management
A series of key-informant interviews were conducted with top levy payers and top industry players. The findings
emerging from these interviews corroborate the skills needs outlined above. Overall, similar to other
agricultural subsectors, stakeholders across occupations in the Red Meat subsector expressed having
challenges with recruiting and retaining skilled staff in rural areas. Furthermore, they highlighted the need for
technical and specialized skills that were being lost when experienced professionals exited the workforce.
There are eleven occupations that are HTFVs identified for both small emerging farmers and cooperatives, and
commercial farmers:
1. “Blokman”
2. Meat Inspector
3. Livestock Mixed Crop and Livestock skills
4. National Certificate: Animal Production
5. National Certificate: Farming
6. National Certificate: Mixed Farming Systems
7. National Diploma: Animal Production
8. Dairy specific training
9. National Certificate: Abattoir Slaughtering Processes
10. National Certificate: Abattoir Supervision
11. National Certificate: Agri Sales and Services
12. National Certificate: Farming
13. National Certificate: General Abattoir Processes
14. National Certificate: Perishable Produce Export Technology
15. National Diploma: Agri Sales and Service Management
21You can also read