WODONGA ACTIVITY CENTRE - HIERARCHY STRATEGY July 2019 - Wodonga Council
←
→
Page content transcription
If your browser does not render page correctly, please read the page content below

WODONGA
ACTIVITY CENTRE
  HIERARCHY STRATEGY

             July 2019
CONTENTS
    FIGURES LIST.................................................................................................................................................................................................2
    TABLES LIST...................................................................................................................................................................................................3
    ACRONYMS.....................................................................................................................................................................................................4

EXECUTIVE SUMMARY....................................................................................................................................... 5
1 INTRODUCTION.............................................................................................................................................. 9
    1.1 ENGAGEMENT........................................................................................................................................................................................9
    1.2 SCOPE AND PURPOSE.........................................................................................................................................................................9
    1.3 PREVIOUS STUDIES AND KEY REFERENCE DOCUMENTS.......................................................................................................9

2 STRATEGIC AND POLICY CONTEXT.............................................................................................................. 10
    2.1 INTRODUCTION................................................................................................................................................................................. 10
    2.2 POLICY.................................................................................................................................................................................................. 10
    2.3 STRATEGY CONTEXT........................................................................................................................................................................ 12
    2.4 KEY FINDINGS.................................................................................................................................................................................... 15

3 RETAIL CONTEXT.......................................................................................................................................... 16
    3.1 INTRODUCTION................................................................................................................................................................................. 16
    3.2 TRENDS INFLUENCING THE RETAIL INDUSTRY...................................................................................................................... 16

4 DEMOGRAPHIC AND ECONOMIC PROFILE.................................................................................................... 20
    4.1 INTRODUCTION................................................................................................................................................................................. 20
    4.2 RESIDENT PROFILE........................................................................................................................................................................... 20
    4.3 ECONOMIC PROFILE......................................................................................................................................................................... 30
    4.4 KEY FINDINGS AND IMPLICATIONS............................................................................................................................................ 37

5 WODONGA ACTIVITY CENTRE NETWORK.................................................................................................... 38
    5.1 INTRODUCTION................................................................................................................................................................................. 38
    5.2 EXISTING ACTIVITY CENTRES..................................................................................................................................................... 38
    5.3 FUTURE ACTIVITY CENTRES......................................................................................................................................................... 41
    5.4 KEY FINDINGS.................................................................................................................................................................................... 43

6 DEMAND FOR RETAIL FLOORSPACE.............................................................................................................. 44
    6.1 INTRODUCTION................................................................................................................................................................................ 44
    6.2 RETAIL CATCHMENTS...................................................................................................................................................................... 44
    6.3 EXPENDITURE.................................................................................................................................................................................... 47
    6.4 POPULATION & EXPENDITURE GROWTH.................................................................................................................................. 48
    6.5 FUTURE SUPPORTABLE RETAIL FLOORSPACE......................................................................................................................... 50

7 ACTIVITY CENTRE RETAIL HIERARCHY........................................................................................................ 60
    7.1 INTRODUCTION................................................................................................................................................................................. 60
    7.2 IMPLEMENTATION............................................................................................................................................................................ 62

APPENDICES
    APPENDIX A CONSULTATION SUMMARY.......................................................................................................................................... 63
    APPENDIX B DEFINITION OF SUB REGIONS..................................................................................................................................... 64
    APPENDIX C RETAIL FLOORSPACE DEMAND ASSUMPTIONS..................................................................................................... 65

                                                                                                                                                                                                                 1
FIGURES
FIGURE 1    EXISTING AND PROPOSED ACTIVITY CENTRES IN WODONGA............................................................................13
FIGURE 2    LENEVA-BARANDUDA FUTURE URBAN STRUCTURE................................................................................................14
FIGURE 3    HISTORICAL & PROJECTED POPULATION GROWTH – CITY OF WODONGA – 2011 TO 2036.......................21
FIGURE 4    PROJECTED POPULATION GROWTH – WODONGA SMALL AREAS – 2016 TO 2036........................................23
FIGURE 5    HOUSEHOLD COMPOSITION – CITY OF WODONGA – 2006 TO 2016..................................................................26
FIGURE 6    WEEKLY INDIVIDUAL INCOME – CITY OF WODONGA – 2006, 2011....................................................................28
FIGURE 7    WEEKLY INDIVIDUAL INCOME – CITY OF WODONGA - 2016.................................................................................29
FIGURE 8    WODONGA CBA RETAIL CATCHMENT AREA.................................................................................................................44
FIGURE 9    EXISTING AND PROPOSED ACTIVITY CENTRE CATCHMENTS – NEIGHBOURHOOD ROLE...........................46
FIGURE 10   POPULATION & DWELLING GROWTH – SOUTH/SOUTH EAST SUB REGION – 2016 TO 2036....................54

 2                                                                                                          WODONGA ACTIVITY CENTRE

TABLES
TABLE 1        WODONGA PLANNING SCHEME: CURRENT ACTIVITY CENTRE HIERARCHY...................................................11

TABLE 2        SNAPSHOT OF CITY OF WODONGA RESIDENT PROFILE..........................................................................................20

TABLE 3        HISTORICAL AND PROJECTED POPULATION GROWTH – WODONGA LGA – 2011 T0 2036.........................22

TABLE 4        AGE STRUCTURE – CITY OF WODONGA – 2006 TO 2016........................................................................................24

TABLE 5        FORECAST AGE GROUPS – CITY OF WODONGA – 2016 TO 2046..........................................................................24

TABLE 6        FORECAST HOUSEHOLD COMPOSITION – CITY OF WODONGA – 2016 TO 2036............................................27

TABLE 7        EDUCATION ATTAINMENT – CITY OF WODONGA – 2006, 2011, 2016...............................................................27

TABLE 8        SNAPSHOT OF CITY OF WODONGA’S ECONOMIC PROFILE.....................................................................................30

TABLE 9        INDUSTRY ECONOMIC OUTPUT, WAGES & SALARIES, VALUE-ADD – CITY OF WODONGA - 2017............31

TABLE 10       EMPLOYMENT BY INDUSTRY – WORKERS IN WODONGA – 2006 TO 2016.......................................................33

TABLE 11       ECONOMIC OUTPUT – WODONGA AND ALBURY - 2016..........................................................................................34

TABLE 12       EMPLOYMENT (WORKERS IN LGA) – WODONGA AND ALBURY - 2016...............................................................35

TABLE 13       EXISTING RETAIL CENTRES – CITY OF WODONGA....................................................................................................39

TABLE 14       PROPOSED FUTURE RETAIL CENTRES – CITY OF WODONGA.................................................................................42

TABLE 15       POPULATION OF REGIONAL CATCHMENT - 2016......................................................................................................45

TABLE 16       POPULATION OF SUB-REGIONAL CATCHMENTS - 2016..........................................................................................46

TABLE 17       RETAIL EXPENDITURE – REGIONAL CATCHMENT - 2016........................................................................................47

TABLE 18       PROJECTED POPULATION GROWTH – REGIONAL CATCHMENT.............................................................................48

TABLE 19       LOCATION AND DISTRIBUTION OF POPULATION GROWTH –2016 TO 2036....................................................49

TABLE 20       PROJECTED RETAIL EXPENDITURE PER CAPITA – WODONGA – 2016 TO 2036..............................................49

TABLE 21       CORE RETAIL MARKET SHARE – WODONGA CBA.......................................................................................................50

TABLE 22       PROJECTED GROWTH – WODONGA CBA CATCHMENT..............................................................................................51

TABLE 23       ADDITIONAL SUPPORTABLE CORE RETAIL FLOORSPACE - CBA............................................................................51

TABLE 24       CORE RETAIL MARKET SHARE – WHITE BOX RISE.....................................................................................................52

TABLE 25       PROJECTED GROWTH – SOUTH/SOUTH EAST CATCHMENT..................................................................................52

TABLE 26       ADDITIONAL SUPPORTABLE CORE RETAIL FLOORSPACE – SOUTH/SOUTH EAST..........................................53

TABLE 27       CORE RETAIL MARKET SHARE – BIRALLEE VILLAGE.................................................................................................56

TABLE 28       PROJECTED GROWTH – WEST WODONGA CATCHMENT...........................................................................................56

TABLE 29       ADDITIONAL SUPPORTABLE CORE RETAIL FLOORSPACE – WEST WODONGA..................................................57

TABLE 30       BULKY GOODS RETAIL MARKET SHARE – WODONGA..............................................................................................58

TABLE 31       PROJECTED GROWTH – WODONGA BULKY GOODS CATCHMENT.........................................................................58

TABLE 32       ADDITIONAL SUPPORTABLE BULKY GOODS RETAIL - WODONGA.......................................................................59

TABLE 33        PROPOSED ACTIVITY CENTRE RETAIL HIERARCHY..................................................................................................61

H I E R A R C H Y S T R AT E G Y                                                                                                                             3

ACRONYMS
AAGR – Average Annual Growth Rate

ABS – Australian Bureau of Statistics

ACHS – Activity Centre Hierarchy Strategy

ANZSIC – Australian and New Zealand Standard Industrial Classification

CBA – Central Business Area

CBD – Central Business District

C1Z – Commercial 1 Zone

C2Z – Commercial 2 Zone

GDA – Gross Developable Area

GLA – Gross Lettable Area

GRP – Gross Regional Product

LGA – Local Government Area

MSS – Municipal Strategic Statement

MUZ – Mixed Use Zone

NAC – Neighbourhood Activity Centre

NDA – Net Developable Area

NSW – New South Wales

PSP – Precinct Structure Plan

SEIFA – Social Economic Index for Areas

VPA – Victorian Planning Authority

GLOSSARY OF TERMS
Full Line Supermarket – A supermarket that is 3,000 sqm or more, typically, a national brand supermarket such as
Coles or Woolworths and includes a full range of food and grocery items (e.g. delicatessen and bakery).

Propulsive industry – Drivers of the economy in terms of regional exports, employment, value-added and local
expenditure on goods and services (backward linkages).

Speciality Store - A non-major retail shop in a centre that specialises in a narrow range of merchandise with an
emphasis on product knowledge and customer service. Shops usually range up to 400 sqm.

 4                                                                          WODONGA ACTIVITY CENTRE
EXECUTIVE SUMMARY
ENGAGEMENT
The Wodonga City Council (the city) engaged Urban Enterprise to undertake an Activity Centre Hierarchy Strategy
(ACHS) for the municipality.

The Wodonga ACHS seeks to:
• Integrate and articulate a tiered activity centre hierarchy with retail floorspace allocation and staged supply
   timeframe;
• Establish the Central Business Area (CBA) as a regional hub for employment and commercial activities;
• Meet the needs of both its regional and local catchments; and
• Meet the existing and future retail needs of Wodonga and surrounding areas in a staged manner having regard
   to the overall hierarchy.
The ACHS also aims to confirm the Wodonga Growth Strategy proposal for retail floorspace allocation and associated
supply timeframe for implementation into the Wodonga Planning Scheme.

POLICY AND STRATEGIC CONTEXT
State planning policy identifies Wodonga as one of 10 major regional centres in Victoria planned to accommodate
and attract significant growth and investment. A major urban growth area at Leneva and Baranduda has been
planned through a PSP process and a Growth Strategy has recently been prepared for the municipality. Both of these
documents have been formally adopted by the council.

Existing local policy strongly supports retaining and further promoting the primacy of the Central Business Area
to encourage a mix of retail, commercial, entertainment, hospitality and community uses, whilst also servicing
medium to long term residential growth in Wodonga’s growth areas. This theme is carried through all strategic
documents recently prepared in relation to the activity centre hierarchy.

The combination of these factors is expected to result in strong population growth over the next planning period,
leading to ongoing demand for retail floorspace and supporting business, hospitality and entertainment areas.

The council’s activity centres policy is in transition, with both the Growth Strategy and Leneva and Baranduda PSP
recently completed exhibition and proposing changes or additions to the activity centre hierarchy. It is, therefore,
important that an updated activity centre hierarchy is established to facilitate the development of new floorspace
to meet demand in the areas planned to experience growth over time, and provide clear direction on the optimal
timing, scale and location of new activity centres to ensure the economic sustainability and accessibility of the
existing network and hierarchy is not compromised.

RETAIL CONTEXT
The retail industry is changing, with less expenditure being directed towards department stores despite continued
growth in overall retail spending. Strong competition in the supermarket industry has already manifested in a
number of new developments in Wodonga, including new Coles and Woolworths supermarkets in the CBA and a new
Aldi store in White Box Rise. Online retailing and food delivery services have experienced growth across Australia
but anecdotally have low market shares in Wodonga.

The close proximity of Albury creates a unique retail environment. Albury is a larger centre meeting higher order retail
needs through provision of more national retailers than Wodonga. Albury’s Retail Development Strategy proposes
to focus on redevelopment of key areas in the CBD, attracting bulky goods retailers and niche independent retailers
with a focus on placemaking and ‘laneway culture’ in the CBD. Albury also seeks to target international retailers,
high quality food and beverage, and contemporary clothing and apparel retailers.

It will be important for Wodonga’s retail offer to complement that of Albury and to meet the needs of the predominant
local demographic weighted towards younger families. Recent and proposed retail developments in Wodonga are

H I E R A R C H Y S T R AT E G Y                                                                                     5

expected to reduce the amount of expenditure that escapes to Albury; an outcome observed by those consulted to
already be occurring.

The Strategy highlights the need to respond to the broader challenges to the retail industry; in particular, the need
for activity centres to accommodate a range of commercial, hospitality, entertainment and community uses to
improve visitor experiences and maintain a diversity of complementary uses in centres. Measures to address vacant
shopfronts in the CBA should also be considered.

DEMOGRAPHIC AND ECONOMIC PROFILE
Significant population and dwelling growth will be the key driver for retail demand in the city. The population is
forecast to reach an estimated 57,600 by 2036, representing an average annual growth rate of 1.8 per cent per
annum. The majority of population growth is expected to occur in the south eastern area of the Wodonga urban
area in Killara, Bandiana, White Box Rise, Baranduda and Leneva. It will be critical to service these areas with the
appropriate provision of convenience retail, such as groceries, retail services and food and beverage.

Wodonga’s resident base consists largely of families, accounting for 71 per cent of all households. Families are
projected to remain the most common household type in the city over the next twenty years. The ongoing growth in
young and middle-aged families is likely to drive demand for household retail items, such as homewares, furniture,
electronics and gardening, as well as children’s clothing, apparel, sporting goods and toys.

The proportion of older age cohorts, such as elderly (over 85 years), seniors (70 to 84 years) and empty nesters and
retirees (60 to 69 years) is also forecast to increase significantly, creating a greater importance on access and
convenience in the retail industry, and demand for health services and products in certain parts of the municipality.

Changes to the distribution of wealth is a key factor when determining the most suitable types of retail. Approximately
half of the existing residents in Wodonga are middle income earners; however, there has been an increase in the
proportion of high income earning individuals in the past decade, highlighting a higher level of disposable income
for a proportion of residents.

The Retail Trade, and Accommodation and Food Services sectors have both experienced employment growth in
Wodonga in the past 10 years. The two sectors support over 3000 workers in Wodonga, with the number of workers
in the Accommodation and Food Services sector increasing by 50 per cent in the past decade. This a reflection of a
strong and developing hospitality, event and tourism product offer.

Despite strong population growth in recent years in Wodonga, employment growth in white collar industries and
retail trade has not been material. A greater concentration of white collar employment exists in Albury, indicating
an opportunity for Wodonga to attract more service businesses to meet the growing local business and resident
needs.

DEMAND FOR RETAIL FLOORSPACE
The Wodonga CBA and bulky goods retailers service a regional catchment which extends beyond the city’s
boundaries to include the Local Government Areas (LGA) of Albury, Indigo and Towong. The CBA also services a
significant number of tourists visiting Albury-Wodonga and captures passing trade. The current population of the
catchment is estimated at 113,500.

Sub-regional retail catchment areas have been defined based on resident access and proximity to existing activity
centres, having regard to major transport routes and barriers to movement (such as rivers and train lines). There are
currently three activity centres in the municipality which perform a neighbourhood role (one in each sub-region),
and are as follows:
• The Central Area of Wodonga – currently serviced by the CBA for neighbourhood shopping needs;
• South/South East Wodonga – currently serviced by White Box Rise; and,
• West Wodonga – currently serviced by Birallee Village.
The Neighbourhood Centres of White Box Rise and Birallee Village predominantly serve a local residential catchment,
but also capture expenditure from nearby rural areas and towns for supermarket and other retail needs not serviced
in these areas (such as White Box Rise for rural areas to the south of the city, such as Yackandandah).

 6                                                                               WODONGA ACTIVITY CENTRE

The projected increase in resident population combined with real growth in retail expenditure will create additional
demand for retail floorspace across the municipality.

FUTURE SUPPORTABLE RETAIL FLOORSPACE
The amount of additional retail floorspace supportable by the projected residential and dwelling growth will depend
on a variety of factors, including the level of expenditure that escapes to other areas such as Albury, the proportion
of floorspace that is to be retained in the CBA compared with other activity centres, and the locations in which
residential and dwelling growth will occur over time.

Table S1 shows the findings of retail modelling undertaken for this Strategy.

TABLE S1

                                                                       2021       2026         2031            2036

                                Additional supportable floorspace
                                                                     4000       4000        4000         5000
                                (sqm) – five year period
  CBA
                                Cumulative additional floorspace
                                                                     4000       8000        12,000       17,000
                                supportable (sqm) at end of period
                                Additional supportable floorspace
                                                                     2500       2500        2500         2500
  SOUTH/SOUTH                   (sqm) – five year period
  EAST WODONGA                  Cumulative additional floorspace
                                                                     2500       5000        7500         10,000
                                supportable (sqm) at end of period
                                Additional supportable floorspace
                                                                     500        500         500          500
                                (sqm) – five year period
  WEST WODONGA
                                Cumulative additional floorspace
                                                                     500        1000        1500         2000
                                supportable (sqm) at end of period

                                Additional supportable floorspace
                                                                     3500       3500        4000         5000
                                (sqm) – five year period
  BULKY GOODS
                                Cumulative additional floorspace
                                                                     3500       7000        11,000       16,000
                                supportable (sqm) at end of period

Source: Urban Enterprise 2018

H I E R A R C H Y S T R AT E G Y                                                                                   7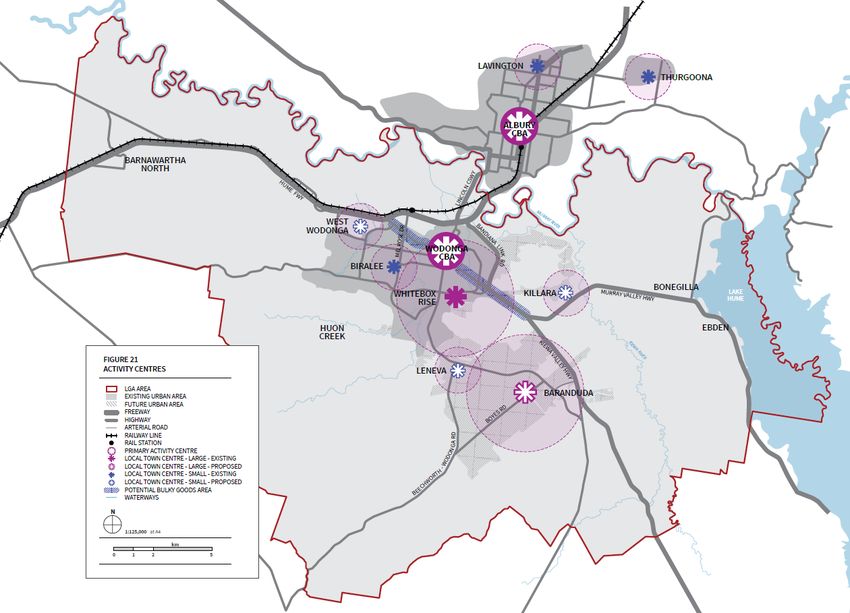
RECOMMENDED ACTIVITY CENTRE HIERARCHY
Table S2 shows the recommended retail activity centre hierarchy and indicative staging of centre growth and
development. Further details are included in the full report which follows.

TABLE S2

                                              INDICATIVE
  HIERARCHY                ACTIVITY           FLOORSPACE   RETAIL
                                                                            INDICATIVE TIMING
  ROLE                     CENTRE             – CORE       ANCHORS
                                              RETAIL
  Core Retail

                                                           Discount
                           Wodonga
                                                           Department
  Major Regional           CBA (Primary                                     Ongoing growth with existing
                                              Unlimited    Stores
  Centre                   Activity                                         zoned land
                           Centre)
                                                           Supermarkets

  Large                                                    Two              Incremental growth in existing
  Neighbourhood            White Box Rise     8000 sqm     supermarkets,    zoned land with no new
  Centre                                                   mini-majors      anchors
                                                                            Initial development once 2000
                                                           Two              lots developed at eastern
                           Baranduda
                                              12,000 sqm   supermarkets,    end of PSP area in addition to
                           (future)
                                                           mini-majors      existing dwellings. Incremental
                                                                            expansion thereafter
  Neighbourhood                                            One full-line
                           Birallee Village   6000 sqm                      Established – no change in role
  Centre                                                   supermarket
                                                                            At full, long term development
                                                           One full-line    of surrounding growth area (or
                           Killara (future)   4000 sqm
                                                           supermarket      earlier subject to local needs
                                                                            assessment)
                                                                            Indicatively, 2000 lots
                                                           One full-line    developed in the western
                           Leneva (future)    5000 sqm
                                                           supermarket      portion of the PSP area. Subject
                                                                            to a local needs assessment

                           Enterprise Park                 One small        Medium term, subject to a local
                                              2000 sqm
                           (future)                        supermarket      demand assessment
  Local Centre
                           Baranduda                       One small        Short term, subject to local
                                              1500 sqm
                           Village                         supermarket      demand assessment

  Bulky Goods
  Retail

  Primary Bulky                                                             Incremental growth within
                           Anzac Parade
  Goods Centre                                                              existing zoned land

  Secondary                CBA North                                        Established – no change in role
  Bulky Goods
  Centre                   Melbourne
                                                                            Established – no change in role
                           Road

Source: Urban Enterprise 2018

 8                                                                         WODONGA ACTIVITY CENTRE
1 INTRODUCTION
1.1 ENGAGEMENT
The Wodonga City Council (the council) engaged Urban Enterprise to undertake an Activity Centre Hierarchy
Strategy (ACHS) for the municipality.
1.2 SCOPE AND PURPOSE
The Wodonga ACHS seeks to:
• Integrate and articulate a tiered activity centre hierarchy with retail floorspace allocation and staged supply
timeframe;
• Establish the Central Business Area (CBA) as a regional hub for employment and commercial activities;
• Meet the needs of both its regional and local catchments; and
• Meet the existing and future retail needs of Wodonga and surrounding areas in a staged manner having regard
to the overall hierarchy.
The ACHS also aims to confirm the Wodonga Growth Strategy proposal for retail floorspace allocation and associated
supply timeframe for implementation into the Wodonga Planning Scheme.
1.3 PREVIOUS STUDIES AND KEY REFERENCE
DOCUMENTS
Recommendations in this report are informed and underpinned by the following existing information:
• Local Planning Policy Framework, Wodonga Planning Scheme (2018);
• Wodonga Activity Centre Strategy Review, Urban Enterprise (2012);
• Wodonga Growth Strategy – Retail Input, Urban Enterprise (2015);
• Wodonga Growth Strategy, Mesh Planning (2016);
• Wodonga CBA Revitalisation Plan 2014 – 2024, City of Wodonga (2014);
• Leneva-Baranduda Precinct Structure Plan (PSP), Victorian Planning Authority (2018);
• Wodonga CBA Base Information Analysis and Gap Analysis, PPS (2012);
• Land Development Trends: An Analysis of Land Supply and Consumption, City of Wodonga (2015 – 2016); and,
• Albury Retail Development Strategy, Essential Economics (2016).
H I E R A R C H Y S T R AT E G Y 92 STRATEGIC AND POLICY CONTEXT
2.1 INTRODUCTION
This section provides an overview of the policy and strategy relevant to development and growth in retail and
activity centres in the city of Wodonga.
2.2 POLICY
2.2.1 STATE PLANNING POLICY FRAMEWORK
The State Planning Policy Framework (SPPF) provides the following policy guidance relevant to this project:
• The objective of Clause 11.01-1 (Settlement Networks) of the State Planning Policy Framework (SPPF) is, “to
promote the sustainable growth and development of Victoria and deliver choice and opportunity for all Victorians
through a network of settlements”;
• The strategy for the objective in Clause 11.01-1 identifies Wodonga as one of the ten major regional centres in
Victoria, with a significant focus on investment and growth; and,
• The objective of Clause 11.03-2 (Activity Centres) of the SPPF encourages the concentration of major retail,
residential, commercial, administrative, entertainment and cultural developments into activity centres, which
provide a variety of land uses and are highly accessible to the community.
The Wodonga ACHS should seek to respond to and support the state government activity centres policy, and respond
to the significant growth that Wodonga is planned to accommodate.
2.2.2 LOCAL PLANNING POLICY FRAMEWORK
The Local Planning Policy Framework (LPPF) provides the following policy guidance relevant to this project:
• Clause 21.01 of the Municipal Strategic Statement (MSS) notes that, “Albury-Wodonga functions as a single
economic zone, with employment, investment and services accessed across both locations. Albury-Wodonga is
Australia’s 18th largest city, and services a regional catchment of some 180,000 people”;
• The vision statement included in Clause 21.01 is that, “In 2033, Wodonga will be an accessible, connected,
sustainable city with a vibrant economy which fosters a sense of belonging and welcomes residents and visitors”;
• The strategic planning vision is as follows: “Wodonga is a city in transition. Following the divestment of 19
hectares of former railway land in the city centre, the central business area is undergoing major urban renewal
and will be a key driver of change for the city. Approximately 1070 hectares of land in the Leneva-Baranduda
Growth corridor is being planned to accommodate the long term growth of the city”;
• Clause 21.03 (Settlement) includes the following points regarding Activity Centres:
• “There are large areas of vacant, commercially zoned land in the Central Business Area.”
• “There is escape expenditure from the Central Business Area.”
• “The number and location of existing and proposed activity centres.”
• “There are commercial activities occurring out of activity centres, in residential zones which are
resulting in amenity impacts.”;
• The objective of Clause 21.03-1 (Activity Centres) is, “to reinforce the role of Wodonga’s Central Business Area as
the city’s Principal Activity Centre for retail, civic, commerce and entertainment”. The objective is to be achieved
through the following strategies:
• “Encourage commercial development in Neighbourhood Activity Centres and Bulky Goods Retail
Centres that complements the role of the Wodonga Central Business Area as the city’s Principal
Activity Centre.”
10 WODONGA ACTIVITY CENTRE• “Facilitate bulky goods retailing in locations specified as Bulky Goods Retail Centres in the Activity
Centre Hierarchy.”
• “Support a small supermarket on land in the Mixed Use Zone within the Baranduda township to service
the convenience needs of this community.”;
• Clause 21.13 (Local Areas) includes the following vision for the Wodonga CBA: “A Central Business Area that is
welcoming, people-friendly, thriving, inclusive, healthy and sustainable, and is the cultural and community heart
of the city”;
• Clause 21.13 (Local Areas) includes the following vision for The Central Business Area Heart:
• “…maximise the likelihood of successful development and deliver an integrated, diverse and
pedestrian-friendly CBA, the core area will be connected by key anchor spaces and the three streets
of High, Hovell and Elgin.
• “The Heart will concentrate retail activity and include business, commercial, community and
leisure activities as well as new residential living in CBA West and Junction Place. The CBA’s major
redevelopment opportunities are located within the Heart.”; and,
• Clause 21.13 (Local Areas) identifies that the Leneva Valley and Baranduda Growth corridor will accommodate the
medium to long term growth of the city and will eventually link with the urban areas of Wodonga and Baranduda.
The Leneva Valley and Baranduda Growth corridor will contain:
• Three future activity centres at North Leneva, Leneva and Baranduda; and,
• A number of smaller activity centres.
The current Activity Centre Hierarchy identified in clause 21.03-1 of the Planning Scheme is summarised in Table 1.
This hierarchy will be reviewed and updated to reflect this ACHS.
Table 1 WODONGA PLANNING SCHEME: CURRENT ACTIVITY CENTRE HIERARCHY
LOCATION & RETAIL
DESIGNATION ROLE
FLOORSPACE ALLOCATION
Primary centre for higher order retail,
offices and services employment, social, Wodonga Central Business Area
cultural and residential activities.
Primary Activity Centre
Unrestricted retail floorspace into
Serves the entire city of Wodonga and the future
surrounding regional catchment
White Box Rise
Services the everyday and local service Baranduda Town Centre
Large Local Town Centre needs of residents of a neighbourhood or
series of neighbourhoods. Birallee
Maximum 12,000 sqm
Killara
Services the everyday and local service
Enterprise Park
needs of residents of a neighbourhood
Small Local Town Centre
or series of neighbourhoods, at a smaller
Leneva
scale than a large Local Town Centre.
3500 to 6500 sqm
H I E R A R C H Y S T R AT E G Y 11Bonegilla
Baranduda Village
Local shops group (McFarland
Road, De Kerilleau Drive, Morrison
Meets the convenience retail needs of a
Convenience Centre Street, Barton Street, Jarrah
local catchment or passing trade
Street, Mayfair Drive, Waratah
Way and Gayview Drive)
Stand-alone shops.
500 to 1500 sqm
Anzac Parade
Sites defined as appropriate for the sale
Bulky Goods
of bulky goods (restricted retail), generally High Street North
(restricted retail)
along higher order roads
Melbourne Road
Source: Clause 21.03-1, Wodonga Planning Scheme.
2.3 STRATEGY CONTEXT
This section summarises the recent strategies which relate to urban growth and activity centres in the city of
Wodonga. Existing strategies inform key components of the Wodonga ACHS.
2.3.1 WODONGA GROWTH STRATEGY
The Wodonga Growth Strategy was prepared by Mesh Planning in 2016.
The strategic directions provided in the Wodonga Growth Strategy were implemented into the Wodonga Planning
Scheme by Amendment C125. A Planning Panel concluded that, “the proposed retail floorspace allocations proposed
for Table 1 of Clause 21.03-1 are justified and appropriate if they are presented as broad level guiding figures”,
(p.14) and recommended adoption of the Amendment subject to some minor changes.
The Strategy guides medium to long term growth in the city, including key land use directions in relation to urban
growth, activity centres, open space, environment, sustainable neighbourhoods, economic development, transport,
housing and social and community infrastructure and funding contributions for infrastructure.
The Amendment updated the MSS with the strategic directions identified in the council’s adopted Wodonga Growth
Strategy, implementing identified further strategic work and ensuring currency of the planning scheme.
The Growth Strategy identifies the need for an Activity Centre Hierarchy Strategy. Specifically, the Growth Strategy
states to, “prepare a Retail Strategy that includes a capacity analysis of the CBA and local activity centres and
confirms floorspace allocations for each centre”.
12 WODONGA ACTIVITY CENTREThe Growth Strategy provides a set of objectives to guide the future development and growth of activity centres in
Wodonga. The key objectives, strategies and actions relevant to activity centres in Wodonga are as follows:
• Objective 13: “To establish a coherent and tiered retail hierarchy that recognises and reinforces the primacy
of the central business area (CBA) in order to meet the needs of both its regional and local catchments and to
provide for Wodonga’s existing and future communities.”
• Strategy 13.2: “Reinforce the activity centre hierarchy when planning for new growth area and
assessing applications to expand existing centres.”
• Strategy 13.3: “Protect the primacy of the CBA by limiting the scale and staging of activity centres
in the Leneva-Baranduda PSP in accordance with projected demand for additional retail floor space.”
• Strategy 13.4: “Discourage commercial/retail development outside of existing activity centres.”
• Strategy 13.7: “Support consolidation of White Box Rise as a Large Local Town Centre via incorporation
of provision for an additional restricted line supermarket.”
• Strategy 13.8: “Support provision for a new Major Town Centre in Baranduda, to be delivered in stages.”
The Growth Strategy includes an Activity Centre Hierarchy, and provides an overview of the role of each centre, as well
as floorspace allocations (Table 1). The location of existing and proposed activity centres in provided in Figure 1.
Figure 1 EXISTING AND PROPOSED ACTIVITY CENTRES IN WODONGA
Source: Wodonga Growth Strategy, Mesh Planning 2016.
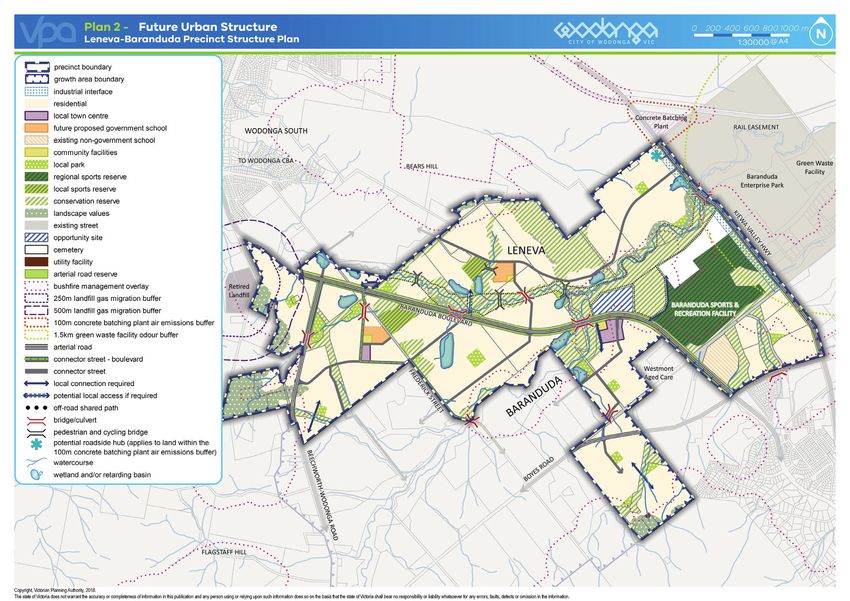
H I E R A R C H Y S T R AT E G Y 132.3.2 LENEVA AND BARANDUDA PRECINCT STRUCTURE PLAN The Leneva and Baranduda Precinct Structure Plan (PSP) was prepared by the Victorian Planning Authority (VPA) and the Wodonga City Council. Amendment C121 introduced the PSP into the planning scheme and was adopted by the council in September 2018. The PSP applies to approximately half of the Leneva and Baranduda growth corridor, and is within the Urban Growth Zone within the Leneva Valley. The balance of the land is expected to be subject to further strategic planning in the medium to long term. The PSP area is estimated to accommodate approximately 6153 dwellings and 15,700 residents at full development. The PSP proposes two activity centres in Baranduda and Leneva: • The Baranduda Activity Centre is proposed to include 12,000 sqm of retail floorspace; and, • The Leneva Neighbourhood Centre is proposed to include 5500 sqm of retail floorspace. The proposed Future Urban Structure is shown in Figure 2, which identifies the location of the proposed future activity centres in the city. The proposed future retail provision in the PSP area is discussed further in Section 5.3. Figure 2 LENEVA-BARANDUDA FUTURE URBAN STRUCTURE Source: Leneva & Baranduda Precinct Structure Plan (PSP) Background Report, Victorian Planning Authority (VPA) 2018. 14 WODONGA ACTIVITY CENTRE
2.3.3        WODONGA CBA REVITALISATION PLAN 2014 - 2034
The Wodonga CBA Revitalisation Plan was prepared in 2014 by the council and aims to strengthen Wodonga’s CBA
as a highly attractive and functional centre for existing and new businesses, property investors, residents and
visitors. The Plan is included as a Reference Document in the Wodonga Planning Scheme.

Key findings relevant to the ACHS include the following:
• There is scope for Wodonga to expand its retail offering. The current proposed developments, in particular Mann
   Central, are estimated to have the potential to capture 75 per cent of the current retail leakage to Albury;
• There is a need to ensure that Wodonga’s retail develops a distinct or niche quality offering that is service-
   oriented and promotes new retail opportunities. Retail that simply replicates other centres or has poor amenity
   or character will not create sufficient incentive for Wodonga’s broader catchment to visit the Wodonga CBA over
   other centres; and,
• The ‘Heart’ of the CBA encompasses Junction Place, Mann Central and CBA West, as well as future new
   development opportunities that are located around the Heart. The three precincts will host intensive retail,
   cultural, recreational, commercial, learning and other activities, all with a people-friendly focus. The Plan sets
   out the following land use vision for the three main streets in the CBA:
            • Boulevard precinct (Elgin Boulevard) - Retail, cafe precinct: Two-storey recessed balconies framing
               active retail and cafés along full length of the street
            • Village precinct (High Street) - Retail, services and cafe precinct: Small-scale retail, arcades and
               activation
            • Woodland Grove precinct (Hovell Street) - The civic and cultural precinct: Green shady grove
               connecting cultural precinct to the Village precinct, family-friendly play spaces. Temporary closure for
               major events

2.4          KEY FINDINGS
State planning policy identifies Wodonga as one of 10 major regional centres in Victoria planned to accommodate
and attract significant growth and investment. A major urban growth area at Leneva and Baranduda has been
planned through a PSP process, and a Growth Strategy has been prepared and adopted.

Existing local policy strongly supports retaining and further promoting the primacy of the Central Business Area
to encourage a mix of retail, commercial, entertainment, hospitality and community uses, whilst also servicing
medium to long term residential growth in the city’s growth areas. This theme is carried through all strategic
documents recently prepared in relation to the activity centre hierarchy.

The combination of these factors is expected to result in strong population growth over the next planning period,
leading to ongoing demand for retail floorspace and supporting business, hospitality and entertainment areas.

The city’s activity centres policy, however, is in transition, with both the Growth Strategy and Leneva and
Baranduda PSP recently completed and adopted by the council, and proposing changes or additions to the activity
centre hierarchy. It is, therefore, important that an updated activity centre hierarchy is established to facilitate
the development of new floorspace to meet demand in the areas planned to experience growth over time, and
provide clear direction on the optimal timing, scale and location of new activity centres to ensure the economic
sustainability and accessibility of the existing network and hierarchy is not compromised.

H I E R A R C H Y S T R AT E G Y                                                                                    15
3 RETAIL CONTEXT 3.1 INTRODUCTION This section provides an overview of macroeconomic and digital trends influencing the retail industry in Australia. This section also provides an overview of the retail context of Albury-Wodonga, an overview of Albury’s retail environment, and the subsequent impact on Wodonga as a regional centre. Consultation has been undertaken with the council, Wodonga Plaza and Business Wodonga. Consultation with key stakeholder informs the key issues and opportunities for the retail industry. A consultation summary is provided in Appendix A. 3.2 TRENDS INFLUENCING THE RETAIL INDUSTRY Consumer spending and retail turnover in Australia has experienced growth in a number of retail sub-sectors over the past year. Supermarkets, associated liquor stores, hospitality, and discount department stores dealing with electronics and household items, including furniture and discount clothing, have all experienced strong growth.1 More specifically, household goods (+3.9 per cent), cafés and restaurants (+3.6 per cent), supermarkets (+3.3 per cent) and food (+3.3 per cent) experienced the strongest trade growth.2 Department stores, however, experienced a decrease (-1.1 per cent) in retail turnover. This is partly attributed to changes in consumer spending resulting from a range of emerging and trending economic phenomena, such as household and personal debt, digital retailing, and low wages growth. This has resulted in a reduction of spending on discretionary items, such as clothing and apparel.1 More specifically, the performance of department stores, such as Myer and David Jones, are being challenged through to the disruption caused by online retailing and the emergence of international retailers, as well as weaker consumer sentiment. In 2017 (FY), Myer experienced an 80 per cent reduction in profit and David Jones experienced a 25 per cent reduction in profit. Victoria has experienced the most significant growth in retail turnover in the past 12 months, with a total of 4.4 per cent growth, which is above the total for Australia at 3.1 per cent. The growth in Victoria’s retail turnover is due to significant population growth, with GDP and employment growth also the strongest in the country. There are also a number of factors influencing individual retailers and particular types of retail. The supermarket sector has undergone a period of change in recent years. Aldi supermarkets are developing a greater presence throughout Australia and, as a result, are increasing competition and claiming a proportion of market share from Coles and Woolworths. In response, Coles and Woolworths are increasing investment through the redevelopment of outdated supermarkets across the country, which includes the provision of a high proportion of floorspace, generally in the order of 4000 sqm. The retail offer at petrol stations and service centres is also becoming more diversified. Service centres are providing more than fuel, and are offering more convenience retail including groceries, and food and beverages. This is particularly the case for larger service stations located on key transport routes. 1 Key Australian Retail Sales Transactions, Savills Research, 2017 2 Technology in Retail: From Centre State to Supporting Player. Beyond Four Walls, Retails Trends 2017, Deloitte 2017 16 WODONGA ACTIVITY CENTRE
IMPACT OF DIGITAL RETAILING
Digital retailing is becoming more prevalent, with a 12.4 per cent growth in online spending in the year ending
March 2017 in Australia. It is expected that growth will continue to disrupt traditional forms of retailing.3

Despite the growth in online sales, 90 per cent of retail transactions remain in-store, indicating that in-store
retailing remains the preferred option for most shoppers.

The growth in online retailing is evident with a retail survey showing that 46 per cent of people buy products online
at least a few times a year (in 2015), up from 40 per cent the previous year. With the growing prevalence of online
retail activity, retailers are increasing their omnichannel retail strategy, enabling people to interact either in-store
or online, on a multitude of devices.3

The world’s largest online retailer, Amazon, has recently launched in Australia, establishing a major distribution
centre in Dandenong South. In the USA, Amazon accounts for more than 40 per cent of market share of online sales,
suggesting it may also have a significant influence on the retail landscape in Australia.4

Some retailers and retail centres are responding to online competition by seeking to improve the shopping
‘experience’, something that can’t be replicated online. This includes a greater focus on hospitality, entertainment
and meeting places co-located with retailers.

Consultation with retailers in Wodonga found that online sales are not considered to have a major impact on the
local industry.

3.3           COMPETITION WITH ALBURY
The unique nature and location of Albury-Wodonga creates both a competing and complementary retail environment
between the two regional centres. Albury is the major regional service centre for the broader region, which includes
southern New South Wales and north-eastern Victoria.

The Albury CBD is a higher-order retail centre for a broader catchment area, while smaller activity centres in
Lavington and Thurgoona provide a supporting retail offer. It is estimated that the Albury CBD currently includes
approximately 114,000 sqm of retail floorspace, including 88,000 sqm of non-food retail and retail services
floorspace.

Albury’s CBD accommodates significantly more retail floorspace than Wodonga’s CBA. Many major retailers are
present in both Wodonga and Albury, including Target, Bunnings and Kmart. Albury, however, has a number of
national brand retailers not present in Wodonga, such as Myer, Dan Murphy’s, the Good Guys and JB Hi-Fi.

The key transport connections for residents and visitors travelling between Albury and Wodonga for retail purposes
are the Lincoln Causeway and the Hume Freeway. These links provide direct access to both Central Business Areas
and Districts, dispersing residents into the heart of each centre. The Albury CBD is also easily accessible from
southern areas of Wodonga and Indigo Shire due to the road networks that link to Albury, enabling residents and
visitors to bypass Wodonga if required.

3   Retail trends 2017: What is Digital’s Impact on the Retail Sector? PWC, 2017
4   Retail Ecommerce Sales Share, Emarker 2017

H I E R A R C H Y S T R AT E G Y                                                                                     17
The Albury Retail Development Strategy provides recommendations to guide the future prosperity of the retail
sector.5 The key objectives for the Strategy are as follows:
    1. Retain the role of the Albury CBD as the highest-order retail destination in the region;
    2. Increase the ability of the retail sector to attract sales and visitation from residents and visitors living outside
       Albury;
    3. Ensure that Albury has a hierarchy of retail centres that operate in a complementary manner;
    4. Use the retail sector as a catalyst for investment and economic development; and,
    5. Develop and promote a retail sector that reflects positively on Albury and enhances the Albury ‘brand’.
A summary of key actions that support the delivery of the five objectives are as follows:
• Consolidate Lavington’s role as the ‘second centre’ for Albury which serves a strong sub-regional role north of the
     Murray River;
• Support growth in appropriate homemaker and large-format retailing in East Albury;
• Continue to support the operation of smaller centres in Albury, including the small neighbourhood centres at East
     Albury and Springdale Heights, as well as the proposed centre at Hamilton Valley, by ensuring new neighbourhood
     development is only permitted within these existing centres;
• Meet with representatives of the owners of West End Plaza, Myer Centrepoint, City Walk and Lavington Square
     to inform them of the council’s in-principle support for redevelopment of retail and other activities at these site;
• Support the development of retailing in laneways in the Albury CBD, and the development of ‘laneway culture’ as
     part of the council’s wider placemaking activities;
• Target small niche and independent traders (including food and beverage) for laneway locations outside the
     traditional core commercial areas of the CBD; and,
• Attract new retailers to stay ‘cutting edge’, including:
          • New international retailers in Australia seeking a regional store;
          • Quality food and beverage (including fine dining);
          • A contemporary mix of fashion stores, including labels aimed at those aged 18 to 25 years; and,
          • Pop up shops, food vans and other opportunities to temporarily activate underutilised spaces.
The total requirement for additional retail floorspace in Albury is forecast to be between 22,800 sqm and 39,400 sqm
by 2035. This is based on forecast growth of the trade area population, as well as real growth in retail expenditure
per capita.

Thurgoona is the major growth area in Albury and at full development (30-plus years) is expected to accommodate
approximately 50,000 residents. Thurgoona is proposed to accommodate a new ‘District Centre’, serving a
subregional retail role, and two new neighbourhood centres. The Albury Retail Development Strategy identifies the
population threshold for a District Centre is 40,000 people. The District Centre will include a discount department
store, two full-line supermarkets, speciality stores and office floorspace.

The majority of Albury’s floorspace growth will be located in residential areas to the north including Lavington and
Thurgoona, predominantly to service the resident population. The amount of additional floorspace that is likely to
be delivered in the Albury CBD is not known, however the lack of vacant / underutilised sites may limit the extent
of floorspace growth potential. It is likely that the major changes to the existing CBD retail offer will come through
redevelopment of older retailers and centres as opposed to major floorspace increases.

Albury’s CBD is also relatively distant from the City’s growth areas located to the north and north east. Wodonga’s
CBA and the Anzac Parade Bulky Goods Precinct are more easily accessible from the Leneva-Baranduda PSP area; a
potential advantage which could support ongoing floorspace growth in the Wodonga CBA.

5   Albury Retail Development Strategy, Essential Economics Pty Ltd / Michael Baker Consulting 2015

18                                                                                    WODONGA ACTIVITY CENTRE
3.4 KEY FINDINGS The retail industry is changing, with less expenditure being directed towards department stores despite continued growth in overall retail spending. Strong competition in the supermarket industry has already manifested in a number of new developments in Wodonga, including new Coles and Woolworths supermarkets in the CBA and a new Aldi store in White Box Rise. Online retailing and food delivery services have experienced growth across Australia, but anecdotally have low market shares in Wodonga. The close proximity of Albury creates a unique retail environment. Albury is a larger centre meeting higher order retail needs through provision of more national retailers than Wodonga. Albury’s Retail Development Strategy proposes to focus on redevelopment of key areas in the CBD, attracting bulky goods retailers and niche independent retailers with a focus on placemaking and ‘laneway culture’ in the CBD. Albury also seeks to target international retailers, high quality food and beverage, and contemporary clothing and apparel retailers. It will be important for Wodonga’s retail offer to complement that of Albury and to meet the needs of the predominant demographic of younger families. Recent and new retail developments in Wodonga are expected to reduce the amount of expenditure which escapes to Albury, an outcome which was observed by those consulted to already be occurring. The Strategy should acknowledge the broader challenges to the retail industry; in particular the need for activity centres to accommodate a range of commercial, hospitality, entertainment and community uses to improve visitor experiences, and maintain a diversity of complementary uses in centres. Measures to address vacant shopfronts in the CBA should also be considered. H I E R A R C H Y S T R AT E G Y 19
4             DEMOGRAPHIC AND ECONOMIC PROFILE

4.1           INTRODUCTION
This section provides a profile of the city’s resident and working population, highlighting the key changes that
have occurred over the past decade, as well as the projected changes into the future. The forecast changes to the
resident and working population will have implications on the demand for the level of retail, as well as the type and
location of retail provided in Wodonga.

An overview of the city’s economy is also provided, highlighting the key drivers of Wodonga’s economy in terms of
economic output, export value, employment, and wages and salaries.

Information in this section is sourced from the following:
• Census of Population and Housing, Australian Bureau of Statistics (ABS) 2006, 2011, 2016;
• City of Wodonga Forecast Id, Id Consulting 2017; and,
• Wodonga Economic Profile, Remplan Economy 2017.

4.2           RESIDENT PROFILE
Table 2 provides a snapshot of Wodonga’s resident profile, including current and forecast population, median age,
household composition, dwellings and total persons employed. The city’s resident profile is benchmarked against
Albury and Regional Victoria.

Wodonga’s population is forecast to increase significantly over the next 20 years. The population is projected to
increase by a total of 46 per cent, which is higher when compared to Albury (+32 per cent) and Regional Victoria
(+16 per cent).

Table 2 shows the key differences in the demographic profile of Wodonga and Albury. Wodonga has a younger
population, with a median age of 34. Wodonga also has a higher proportion of family households, accounting for 71
per cent, compared with Albury (65 per cent). This is further highlighted by the average household size, which is 2.5
persons in Wodonga, compared to Albury (2.3 persons).

Table 2 SNAPSHOT OF CITY OF WODONGA RESIDENT PROFILE

                                       WODONGA                           ALBURY                   REGIONAL VICTORIA*
  Population                           39,352                            51,076                   1,453,933
  Forecast Population
                                       57,636                            67,427                   1,691,161
  (2036)*
  Median Age                           34                                39                       42
                                       71% Families / 26%                65% Families / 31%       73% Families / 23%
  Household Composition
                                       Lone Person / 3% Group            Lone Person / 4% Group   Lone Person / 4% Group
  Dwellings                            16,490                            23,369                   688,869
  Ave Household Size                   2.5                               2.3                      2.4
  Workers                              17,531                            24,591                   618,586
  Unemployment Rate                    6.0%                              6.8%                     6.0%

Source: Census of Population and Housing, Australian Bureau of Statistics (ABS) 2016
* Source: Profile and Forecast id 2017

20                                                                                       WODONGA ACTIVITY CENTRE
You can also read