Reflections in Fukushima: The Fukushima Daiichi Accident Seven Years On - Radiation investigations in the exclusion zone of Namie and open areas ...
←
→
Page content transcription
If your browser does not render page correctly, please read the page content below
Reflections
 in Fukushima :
 The Fukushima Daiichi Accident
 Seven Years On

             Radiation investigations in the exclusion zone of Namie
                                  and open areas of Namie and Iitate

March 2018                                                   Greenpeace Japan
                                                    1 | Reflections in Fukushima
Contents
           1. Executive summary                                                                    04
           2. Introduction                                                                         07
           3. Radiation survey methodology                                                         08
           4. Namie exclusion zone survey results                                                  10
           5. Lifted evacuation areas - Namie and Iitate                                           19
           6. Radiation hot spots                                                                  29
           7. Human rights and Japanese government policy                                          31
           8. Projections on long term dose rates and government
              plans for revising decontamination radiation target                                  33
           9. Conclusion and recommendations                                                       35

           Endnote                                                                                 39

           Appendix                                                                                4

           Radiation survey team: Coordinator: Jan Vande Putte, Greenpeace Belgium; and Radiation
           Protection Advisors: Mai Suzuki, Greenpeace Japan, Heinz Smital, Greenpeace Germany,
           and Laurence Bergot, Greenpeace France

           Survey data compilation by Jan Vande Putte and Mai Suzuki

           Report and analysis written by Shaun Burnie, Greenpeace Germany, and Kazue Suzuki,
           Greenpeace Japan

           Editing by Chisato Jono and Seri Ishikawa of Greenpeace Japan, and Andrew Wood

           Photographs: © Christian Åslund / Greenpeace

           A very special thanks to all house owners in Namie and Iitate, and in particular Fukushima
           evacuees, Ms. Kanno and Mr. Anzai who were so very generous with their time and much
           appreciated and necessary guidance during our survey work.
Greenpeace Japan
Reflections in Fukushima | 2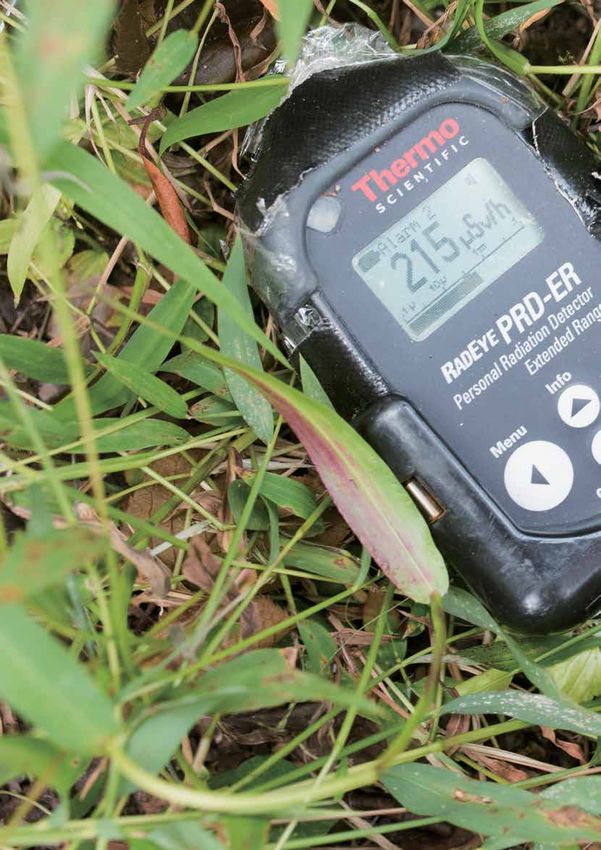
Cover photo : Ms. Mizue Kanno walking through the streets of Tsushima, in
    the exclusion zone of Namie, Fukushima prefecture, September 2017.
       This page : Heinz Smital, Greenpeace Germany radiation specialist
        in Namie exclusion zone, Fukushima prefecture,  SeptemberJapan
                                                     Greenpeace    2017.
                                           3 | Reflections
                                                  © Åslundin/ Greenpeace
                                                              Fukushima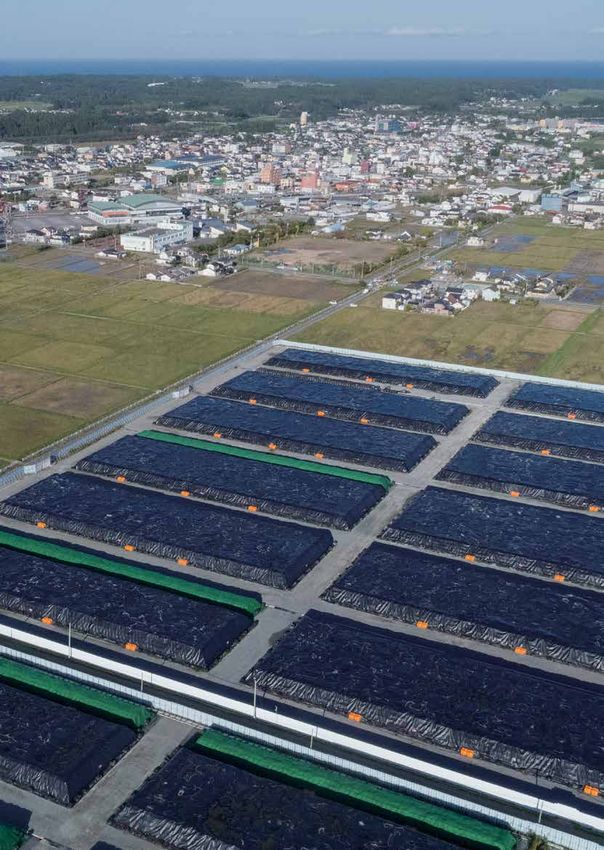
1. Executive summary

      Seven years after the start of the Fukushima Daiichi     Namie and Iitate where citizens will be exposed to
      nuclear disaster and one year after the Japanese         rates equal to this and higher, choosing instead to
      government lifted evacuation orders in areas of          ignore the science to justify its Fukushima policies.
      Namie and Iitate, radiation levels remain too high
      for the safe return of thousands of Japanese citizen     In a clear admission of the failure of its
      evacuees. That is the conclusion of Greenpeace’s         decontamination program, the Japanese government
      latest extensive radiation survey in Namie and Iitate,   has recently begun a process to revise the current
      Fukushima prefecture. As a result of being invited       long term decontamination target of 0.23 µSv/h.
      by local citizens, Greenpeace was able to continue       In January 2018, during discussions on dose
      its survey work in Iitate, while also extending it to    estimates for returning evacuees, the chair of the
      select homes in the highly contaminated exclusion        Nuclear Regulation Authority (NRA) stated that
      (difficult to return) zone of Namie.                     the current target “could hinder evacuees’ return
                                                               home.”2 It has been insinuated that the new target
                                                               would be in the 1.0 µSv/h range. The review of the
      Radiation risks, long term dose estimates
                                                               target is to be conducted under the auspices of the
      and revision of targets
                                                               Radiation Council of NRA.
      In the areas of Iitate and Namie where evacuation
      orders were lifted in March 2017, contamination will     Given the extent of contamination and the failure
      remain well above international maximum safety           and limited nature of the decontamination program,
      recommendations for public radiation exposure of         radiation levels in Namie and Iitate are many
      1 milisievert per year (1mSv) for many decades.          decades and longer from reaching the current target.
      Greenpeace includes projections on dose rates to
      mid-21st century, which show that they will still
      be well in excess of the current government long         Namie exclusion zone
      term target levels of 0.23 micro-Sieverts per hour       The results of Greenpeace’s extensive survey
      (µSv/h ). It is this target level that the government    around houses, farmland and forest in the Namie
      uses for its calculation to reach an estimated           exclusion zone reveal radiation levels that far exceed
      annual exposure level of 1mSv/y. The government          the government’s long term decontamination
      calculation is based on citizens spending an             target of 0.23 µSv/h. Average dose rates around
      average of 8 hours per day outside and taking            homes between 25 km and 30 km northwest of
      account of shielding from radiation while inside a       the Fukushima Daiichi nuclear plant ranged from
      wooden house. Unless otherwise stated in the text,       1.3 – 3.4 µSv/h, with even higher levels in nearby
      the Greenpeace calculation of annual human dose          forests and farmland. The home of Ms. Kanno in
      rates are based on radiation measurements taken          Namie, despite being subjected to an extensive
      at 1 meter, and what an adult’s exposure would           decontamination program, had radiation levels
      be over one full year (total of 8,760 hours) at that     with a weighted average of 1.3 μSv/h and with a
      specific location.                                       maximum level of 5.8 µSv/h. In 60% of the nearby
                                                               forested area current radiation levels would lead to
      In the case of radiation levels in the highly            an exposure dose of 17 mSv/y.
      contaminated exclusion zone of Namie the situation
      is even more severe. It will be at least many            Radiation levels in the community of Obori
      decades more, and beyond the end of this century,        in Namie, which is 20km west-north-west of
      before they start to even approach government            the Fukushima Daiichi plant, were particularly
      targets.                                                 concerning. This included measurements of 11.6
                                                               μSv/h, which would lead to an annual exposure of
      The Japanese government is well-aware of                 101 mSv.
      scientific evidence of cancer and other health risks
      from low-dose radiation exposure, including in the       Greenpeace also surveyed along Route 114,
      range of 1-5 mSv/y. It has even part funded such         which runs east-west between the Murohara
      research.1 Yet the government has opened areas of        and Tsushima districts of Namie and which the

Greenpeace Japan
Reflections in Fukushima | 04
government opened to through public traffic in                        Lifted evacuation areas - Namie and Iitate
September 2017. While our survey results were
                                                                      In 2018, there clearly remains a radiological
consistent with official data, less than 50 meters
                                                                      emergency within the areas of Namie and Iitate
from the public highway we measured hot spots
                                                                      which were opened by the government in March
of 11 µSv/h (at one meter above ground level) and
                                                                      2017. To clarify the use of the word emergency: if
137 µSv/h (at 0.1 meter). To put these figures into
                                                                      these radiation levels were measured in a nuclear
context, at this one location radiation readings were
                                                                      facility, immediate action would be required
287 times higher at 1 meter than background levels
                                                                      by the authorities to mitigate serious adverse
of 0.04 µSv/h in the prefecture before the March
                                                                      consequences for human health and safety,
2011 Fukushima Daiichi nuclear accident. At 0.1
                                                                      property and the environment.5 The Japanese
meter they were over 3,400 times higher.
                                                                      government through its policies is doing exactly
                                                                      the opposite.
Official plans, approved by the Abe government
in December 2017, are to begin decontamination
                                                                      Greenpeace has been surveying Iitate since late
in the exclusion zone of Namie, with the aim of
                                                                      March 2011, when it was the first to call for its
lifting evacuation orders in 2023 for small islands
                                                                      evacuation. The results of our survey work in 2017
or hubs.3 From May 2018, potentially thousands
                                                                      illustrate a highly complex radiological situation,
of decontamination workers working in the highly
                                                                      and one very far from normal. This is illustrated
contaminated exclusion zone of Namie will be
                                                                      by the survey of Mr. Anzai’s home in Iitate where
subjected to unjustifiable radiation risks for a
                                                                      there has been no significant decline in radiation
program that only decontaminates a small fraction
                                                                      levels since 2016, and even an increase, which
of the overall area, and where 70-80% of the
                                                                      raises the issue of possible re-contamination
area is contaminated mountainous forest that
                                                                      through migration of radionuclides from the nearby
cannot be decontaminated;4 and where the actual
                                                                      highly contaminated forested mountain slopes.
effectiveness of decontamination is questionable.
                                                                      The inevitability of recontamination from the heavily
These plans for Namie, as well as the other areas
                                                                      contaminated forested mountains which represent
in the exclusion zones, from a radio-protection
                                                                      70% of Iitate, as well as an equal amount of Namie,
perspective cannot be justified and there are no
                                                                      is further evidence that the government’s limited
prospects over the coming decades that it will be
                                                                      decontamination program for thousands of homes
safe for people to return.

 Radiation survey results overview                                    Air dose at 1m height

                                                                          Max       Average     Number of   Above         Above
                                  Place name                            (µSv/h)     (µSv/h)      points   0.23 µSv/h      1 µSv/h
                                  (Weighted average of all zones)
                                                                                                   2017
                                  Kanno's House                           5.8          1.3         5,105       100%        67%
                                  House Y                                  3.7         1.6         4,368       100%        95%
             Namie
                                  House Z                                  8.2         3.3         3,051       100%       100%
     (Area 3 - Exclusion zone)
                                  Obori                                   11.6         4.3         2,640       100%       100%
                                  Tsushima                                 2.6         1.2         2,834       100%       100%
             Namie                Route 114                                6.5         1.3         3,134        90%        46%
   (Former Area 2 - Open area)    City centre and surroundings             2.1         0.3         6,844        59%        2%
                                  Anzai's House                             2          0.8         4,903       100%        22%
                                  House A                                  0.6         0.2         2,151        73%        0%
              Iitate              House B                                  2.2         0.8         4,010       100%        36%
   (Former Area 2 - Open area)    House C                                  1.5         0.4         3,204        83%        8%
                                  House E                                  1.9         0.7         4,000       100%        16%
                                  House F                                  1.8         0.7         2,494        99%        38%

  ● “Long-term target” = 1 mSv/y(0.23 μSv/h)
     (Japanese Government policy and international limit for public exposure in a non-accidental situation)
  ● Before the accident : background = 0.04 μSv/h

                                                                                                                        Greenpeace Japan
                                                                                                              05 | Reflections in Fukushima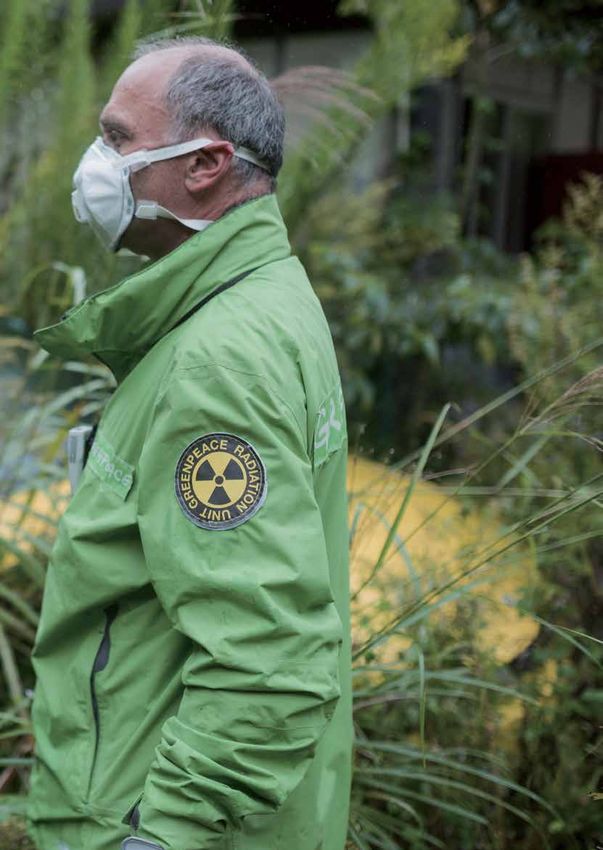
has been, and will continue to be, ineffective in        The results of our investigations add further to the
      reducing the risks to citizens of Namie and Iitate, if   urgency for the Abe government to halt its current
      they were to return to their homes.                      program of lifting evacuation orders, to comply
                                                               with its domestic and international human rights
      Risking such exposures for the citizens of Namie         obligations and to initiate a comprehensive and
      and Iitate, including vulnerable populations of          publicly accountable review of current policy.
      women and children, is unjustifiable. Potential
      exposures for children are of particular concern,
                                                               Recommendations to the Japanese
      as they are both more vulnerable to the impacts
                                                               government
      of ionizing radiation exposure and are at much
      greater risk of coming into contact with ground level     • Adopt and immediately apply the
      radiation through play.6 Further, should residents          recommendations of member states on
      return, the complex radiation situation in Namie            Fukushima submitted at the United Nations
      and Iitate would require very different day to day          Human Rights Council, including reducing the
      behavior to minimize exposure, compared with pre-           acceptable additional annual exposure level in
      March 2011.                                                 Fukushima-impacted areas to a maximum of
                                                                  1 mSv/year;

      Failed return policy and human rights                     • Suspend its current return policy which ignores
                                                                  Fukushima citizens and which ignores science
      While the Japanese government continues to ignore           based analysis and ensure survivors are fully
      the radiological reality in Namie and Iitate, their         compensated for their losses – including
      citizens clearly do not. As of December 2017, out           continuation of compensation payments and
      of the 27,000 people that lived in these districts in       housing support for those who choose to
      March 2011, only 3.5% had returned.7 Clearly, the           remain evacuated, and compensation for those
      government’s policy of seeking to effectively force         returning for their loss of community, in order
      Fukushima citizens to return to these areas is not          that individuals may freely exercise their right to
      working. This low return rate is despite the decision       choose where to live;
      to terminate housing support for self evacuees in
      March 2017 (as well as their removal from official        • Immediately clarify its long term decontamination
      records, ‘disappearing’ as many as 29,000) 8 and            target of 0.23 μSv/h, equal to its 1mSv/y
      plans to terminate housing support for thousands of         exposure estimate, including setting a target
      Iitate and Namie citizens in 2019.                          date, and halt any plans to raise the permitted
                                                                  target level;
      Due to the efforts of civil society and United            • Abandon plans to lift evacuation orders in
      Nations (UN) member states, the Japanese                    the Namie districts of Tsushima, Murohara,
      government’s decision to disregard public safety            Suenomori and Obori, and in the interests of
      and violate the human rights of tens of thousands           worker protection, halt plans for the start of
      of its citizens is now more urgently on the agenda          decontamination efforts in these areas in 2018;
      of the UN Human Rights Council in Geneva.9                • Establish a fully transparent process to reflect
      The recommendations made by member states,                  and consider residents’ opinions on evacuation
      including Germany, at the Universal Periodic                policy, including opening a council of citizens
      Review of Japan (third cycle) in November 2017,10           including all evacuees;
      if applied in Iitate and Namie and other areas that
      are the most contaminated, would immediately halt         • Provide full financial support to evacuees, and
      the current program of the Japanese government.             take measures to reduce radiation exposure
      Greenpeace and the International Association of             based on science and the precautionary
      Democratic Lawyers, in a recent submissions to              principle to protect public health and allow
      the UNHRC, have called on the government to                 citizens to decide whether to return or relocate
      fully adopt the recommendations.11 The Japanese             free from duress and financial coercion.
      government will announce on 16 March 2018 its
      decision on whether to accept or reject these
      recommendations.

Greenpeace Japan
Reflections in Fukushima | 06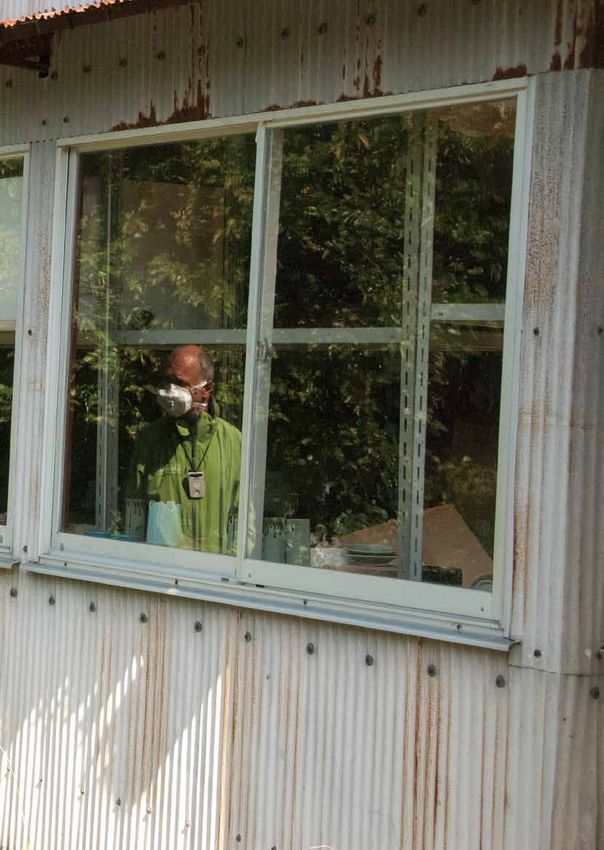
2. Introduction

Seven years after the start of the Fukushima Daiichi   continues to move forward with its plans to open up
nuclear accident, Greenpeace has completed its         small islands in these highly contaminated areas by
latest investigation of radiation levels in areas of   2023.12 The survey work focused on houses and the
Fukushima prefecture. Conducted in September           surrounding farmland and forests as well as roads.
and October 2017, the survey focused on the            Greenpeace also surveyed Route 114, a major
districts of Namie and Iitate, the combined            artery which runs east-west through the highly
population of which was 27,943 at the start of the     contaminated area of Namie, which was opened
nuclear accident. In March 2017, the government        to through public traffic in September 2017. House
lifted evacuation orders for an area of Namie and      surveys were conducted in the exclusion zone
Iitate. In addition, we have surveyed radiation        of Namie and the area of Iitate where evacuation
levels in the remaining exclusion zone in Namie,       orders were lifted in March 2017. Greenpeace was
which remains closed to habitation. This area          only able to conduct the house surveys in both
makes up 80% of the land area of Namie.                Iitate and in the highly contaminated exclusion
                                                       area of Namie as a result of invitations from citizen
Understanding the radiological situation in these      evacuees.
areas is important as the Japanese government

                                                               Area1: Evacuation order cancellation
                                                                      preparation area
                                                               Area2: Restricted residence area

                                                               Area3: Difficult-to-return area

                                                               Areas where evacuation orders have been lifted

                                                          Map1: Evacuation area status as of 1 March 2018

                                                                                                    Greenpeace Japan
                                                                                          07 | Reflections in Fukushima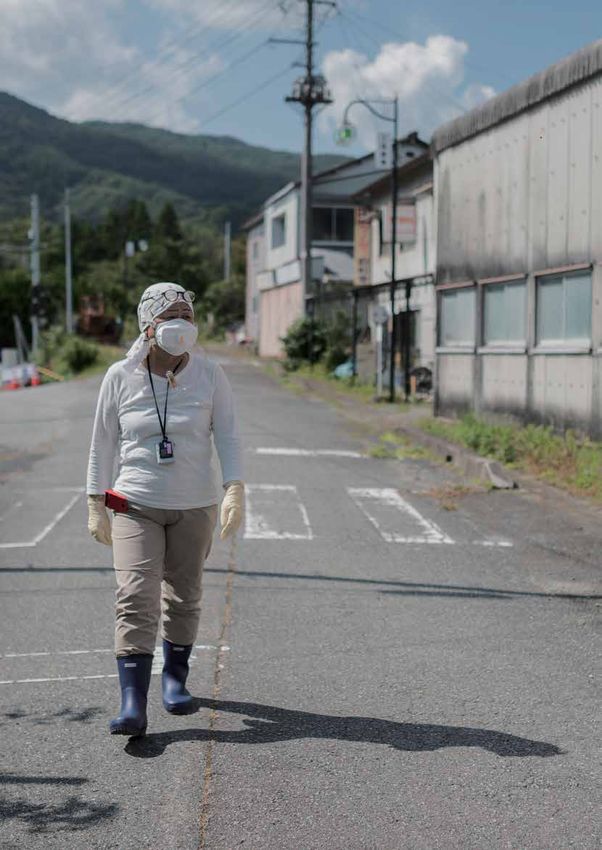
3. Radiation survey methodology

Radiation specialists Laurence Bergot of Greenpeace France and Mai Suzuki
of Greenpeace Japan, survey at elementary school, Namie, Fukushima
 Greenpeace
prefecture, in Japan
                area where evacuation order is lifted, September 2017.
 Reflections
© Greenpeace  in Fukushima | 8
The Greenpeace team used two different methods         2. “Hot spots”:
for survey work at each house in Namie and Iitate.
Radio-cesiums (Cs-137 and Cs-134) contribute           In addition, radiation hot spots which are areas
to almost all (98%) of the long-term cumulative        with concentrated radioactivity and other points
exposure. During the Fukushima nuclear disaster,       of interest around the houses were identified and
equal amounts of Cs-137 and of Cs-134 were             measured as follows:
released.
                                                        • Ambient dose rate at 10 / 50 / 100 cm using
1. “Scanning”:                                            a NaI scintillator (Radeye PRD- ER) and GPS
    Systematic measurements:                              position from handheld Garmin Montana 650
                                                          were used;
 • Ambient dose rate at 1m with a high-efficient        • These points were collected for each of the
   and calibrated NaI scintillator (Georadis              defined Zones.
   RT30: 2000 cps / μSv.h-1 (Cs-137) with 1
   measurement each second.
 • High-precision GPS (GNSS Trimble R1) with           3. “Car Scanning”:
   external antenna and 5,000 points.
 • Statistics are collected for each of these Zones
   (average, minimum and maximum for each
   Zone). The average of all the Zones of one
   house and land area is calculated as a weighted
   average, with the same weight for each Zone.
   This also allows a comparison between different
   years (as the number of measurement points for
   each year is not identical).

                                                                                                 Greenpeace Japan
                                                                                       09 | Reflections in Fukushima
4. Namie exclusion zone survey results

Tsushima, inside the highly contaminated exclusion zone,
  Greenpeace
Namie,         Japanprefecture, September 2017.
        Fukushima
  Reflections in Fukushima | 10
© Åslund / Greenpeace
In 2018, due to high levels of radiation, 80% of zone for the first time since March 2011 to
Namie town (officially classified as “difficult to conduct a large scale survey after invitations from
return to” exclusion zone), which lies to the west homeowners. The area around Tsushima and Obori,
and northwest of the Fukushima Daiichi plant, as well as along the main roads in the zone, were
remains closed to habitation seven years after surveyed between 20 and 29 September 2017.
the Fukushima Daiichi nuclear accident. It is Below we provide a summary of the results of tens
mostly mountainous forest with small farm based of thousands of measurements. We include the
communities. Due to the restricted access to the name of Ms. Kanno, however, other homeowners’
area there have only been small scale independent names are not included due to their wish to remain
investigations into the radiation levels in recent anonymous.
years. Greenpeace returned to the Namie exclusion
Ms. Kanno’s house
The ancestral home of Ms. Kanno is located in Shimo-
Tsushima in the district of Namie, 30 km west-northwest
of the Fukushima Daiichi nuclear plant. It was subjected
to significant radiation exposure as a result of the
March 2011 nuclear accident. The government selected
the house for demonstrating its decontamination
techniques and it was subjected to considerable effort
© Åslund / Greenpeace
during December 2011 and February 2012. Greenpeace
conducted its radiation survey in the immediate area
around the house, as well as on the family’s farmland
and forest. The results demonstrate the complex
nature of radionuclide contamination in the most highly
contaminated areas of Fukushima prefecture.
Intervals Number of points % of points mSv/y (Japan govt.)(*) mSv/y if 8,760h/y (*)
>= 5 µSv/h 2 0% >= 26 mSv/y >= 43 mSv/y
< 5 and >= 3.8 µSv/h 3 0% >= 20 mSv/y >= 33 mSv/y
< 3.8 and >= 2 µSv/h 1,092 21% >= 10 mSv/y >= 17 mSv/y
< 2 and >= 1.5 µSv/h 1,194 23% >= 8 mSv/y >= 13 mSv/y
< 1.5 and >= 1 µSv/h 1,133 22% >= 5 mSv/y >= 8 mSv/y
< 1 and >= 0.5 µSv/h 1,618 32% >= 3 mSv/y >= 4 mSv/y
< 0.5 and >= 0.23 µSv/h 63 1% >= 1 mSv/y >= 2 mSv/y
< 0.23 µSv/h 0 0% < 1 mSv/y < 2 mSv/y
Total number of points 5,105 100%
Table 1: Radiation in all Zones at Ms. Kanno’s house (walking on- and off-road)
(*) Average dose rate of 0.04 μSv/h before March 2011 subtracted
Overall, for all 9 Zones measured at Ms. Kanno’s home the weighted average from September 2017 is 1.3
micro-Sieverts per hour (μSv/h) with a maximum level of 5.8 µSv/h (See Table 1). Annual dose rates for
21% of the area could lead to a dose of 10 milli-sieverts per year (mSv/y) based on Japanese government
methodology and 17 mSv/y based on permanent exposure over one full year.13 The International
Commission on Radiological Protection (ICRP) recommendations for the public sets the maximum
recommended dose at 1 mSv a year.14
Greenpeace Japan
11 | Reflections in Fukushima2017
Zone name Max Average Number of Above Above
(µSv/h) (µSv/h) points 0.23 µSv/h 1 µSv/h
Zone 1 Around house 1.3 0.7 238 100% 9%
Zone 2 Around warehouse and path 2.1 1.1 550 100% 58%
Zone 3 Garden and farmland 1.8 0.8 383 100% 13%
Zone 4 Farmland 1.2 0.9 447 100% 24%
Zone 5 Forest behind house 2.8 1.9 902 100% 95%
Zone 6 Rice field, North 2.4 1.9 761 100% 100%
Zone 7 Rice field, South 1.9 1.5 403 100% 95%
Zone 8 Road 1.6 0.7 470 100% 14%
Zone 9 Path to rice field North 5.8 1.7 951 100% 91%
ALL Weighted average of all zones 5.8 1.3 5,105 100% 67%
Table 2: Radiation measurement data from Kanno’s house, Namie
In Zone 1, which is the immediate vicinity of the house – within 5 - 10 meters – and where the government
had conducted decontamination, radiation levels were on average 0.7 µSv/h, while Zone 9, the path along
the main
c h a rroad
t 1 and entrance to the house had an average of 1.7 µSv/h and a maximum level of 5.8 µSv/h.
The whole path has an average of 1.7 µSv/h, even though contaminated topsoil around the house had
been removed to a significant depth, according to Ms. Kanno. 100% of the measuring points exceeded
the government’s current long term radiation target level of 0.23 µSv/h.
> = 5µSv/h
< 5 and > = 3.8µSv/h
< 3.8 and > = 2µSv/h
< 2 and > = 1.5µSv/h
< 1.5 and > = 1µSv/h
21% < 1 and > = 0.5µSv/h
< 0.5 and > = 0.23µSv/h
< 0.23 µSv/h
32% Maximum = 5.8 µSv/h
Minimum = 0.4 µSv/h
Average = 1.4 µSv/h
23% 22%
67% of points above 1 µSv/h
100% of points above 0.23 µSv/h
Chart 1: Proportion of dose rate in all Zones from Ms. Kanno’s house
(5,105 points, at 1 meter height, surveyed on 20 September, 2017)
The house itself is surrounded on three sides by forest which has grown extensively since 2011.
The survey results in Zone 5, accessible forest area around the house, reveal the limited impact of
decontamination. The average measured 1.9 µSv/h with peak levels of 2.8 µSv/h. 60% of the forested
area would lead to an exposure of 17 mSv over one year.
In Zone 6, a field belonging to Ms. Kanno’s family, and which was used for growing rice, average radiation
levels were 1.9 µSv/h with a maximum level of 2.4 µSv/h.
Additional data from the house survey is contained in Appendix.
Greenpeace Japan
Reflections in Fukushima | 12House Y
Illustrating the variation in radiation levels within Area 3
of Namie are the results of the Greenpeace survey work
at House Y and farm around 27 km northwest of the
Fukushima Daiichi plant. The weighted average for all
Zones was 1.6 µSv/h with a maximum level of 3.7 µSv/h.
In contrast to the Kanno residence, the area around the
home has not been decontaminated. In Zone 3, the area
© Åslund / Greenpeace
immediately around the house the average radiation
readings were 1.8 µSv/h, with a maximum level of 3.7
µSv/h. Radiation levels in 70% of the area around the
house would lead to a dose of 13 mSv/y. On farmland
in Zone 4 the average levels were 1.5 µSv/h with a
maximum level of 2.1 µSv/h.
2017
Zone name Max Average Number of Above Above
(µSv/h) (µSv/h) points 0.23 µSv/h 1 µSv/h
Zone 1 Path up to house 2.8 1.5 808 100% 97%
Zone 2 Front of house 2 1.2 395 100% 75%
Zone 3 Around house 3.7 1.8 446 100% 93%
Zone 4 Farmland 2.1 1.5 761 100% 95%
Zone 5 Field, Warehouse South 2 1.6 407 100% 100%
chart 2
Zone 6 Forest 3.3 2 1,551 100% 99%
ALL Weighted average of all zones 3.7 1.6 4,368 100% 95%
Table3: Radiation measurement data from House Y, Namie
> = 5µSv/h
5% < 5 and > = 3.8µSv/h
< 3.8 and > = 2µSv/h
< 2 and > = 1.5µSv/h
< 1.5 and > = 1µSv/h
< 1 and > = 0.5µSv/h
< 0.5 and > = 0.23µSv/h
26% < 0.23µSv/h
29% Maximum = 3.7µSv/h
Minimum = 0.7µSv/h
Average = 1.7µSv/h
40%
95% of points above 1 µSv/h
100% of points above 0.23 µSv/h
Chart 2: Proportion of dose rate in all Zones from House Y
(4,368 points, at 1 meter height, surveyed on 23 September, 2017)
Greenpeace Japan
13 | Reflections in FukushimaHouse Z
25 km northwest of the Fukushima Daiichi plant,
the survey of House Z revealed very high levels of
contamination. The average levels in Zone 2, in front of
the house were 3.8 µSv/h with a maximum level of 7.6
µSv/h. Annual dose rates in 35% of this area would be
in excess of 33 mSv/y, with 9% in excess of 43 mSv/y.
In Zone 5, around a warehouse, the average readings
were 3.4 µSv/h with a maximum level of 8.2 µSv/h. In
Zone 6, along Route 114, an average of 2.7 µSv/h and
a maximum level of 7.3 µSv/h were measured. It should
be noted that this is a higher maximum reading than the
road scanning conducted both by the Government and
by Greenpeace due to the fact that this is based on a
© Greenpeace
walking scan. In Zone 7, which was the family orchard,
an average of 3.4 µSv/h and a maximum level of 5.2
µSv/h were measured. The weighted average for the area
at this property was 3.3 µSv/h.
2017
Zone name Max Average Number of Above Above
(µSv/h) (µSv/h) points 0.23 µSv/h 1 µSv/h
Zone 1 Path 4.3 3.2 180 100% 100%
Zone 2 In front of house 7.6 3.8 407 100% 100%
Zone 3 Around house 5.1 3.3 261 100% 100%
Zone 4 Greenhouse-garden 4.9 3.3 794 100% 100%
Zone 5 Front warehouse 8.2 3.4 195 100% 100%
Zone 6 Main road 7.3 2.7 875 100% 100%
chart 3
Zone 7 Orchard 5.2 3.4 339 100% 100%
ALL Weighted average of all zones 8.2 3.3 3,051 100% 100%
Table4: Radiation measurement data from House Z, Namie
3% 3%
> = 5µSv/h
< 5 and > = 3.8µSv/h
< 3.8 and > = 2µSv/h
13% < 2 and > = 1.5µSv/h
< 1.5 and > = 1µSv/h
< 1 and > = 0.5µSv/h
< 0.5 and > = 0.23µSv/h
< 0.23 µSv/h
Maximum = 8.2 µSv/h
Minimum = 1.2 µSv/h
Average = 3.2 µSv/h
80%
100% of points above 1 µSv/h
100% of points above 0.23 µSv/h
Chart 3: Proportion of dose rate in all Zones from House Z
(3,051 points, at 1 meter height, surveyed on 22 September, 2017)
Greenpeace Japan
Reflections in Fukushima | 14Tsushima
In the small community of Tsushima, 30km from the Fukushima Daiichi plant, Greenpeace surveyed the
road cthrough
h art 4 Tsushima with weighted average radiation readings of 1.2 µSv/h and a maximum level of 2.6
µSv/h. Tsushima, along with other areas in Namie, specifically Murohara, Suenomori and Obori, have been
targeted by the government as ‘reconstruction hubs’ with the aim of lifting the evacuation order for an
area of 660 hectares in total by 2023.15
2%
> = 5µSv/h
< 5 and > = 3.8µSv/h
< 3.8 and > = 2µSv/h
< 2 and > = 1.5µSv/h
16% < 1.5 and > = 1µSv/h
< 1 and > = 0.5µSv/h
< 0.5 and > = 0.23µSv/h
25% < 0.23 µSv/h
Maximum = 2.6 µSv/h
Minimum = 0.5 µSv/h
Average = 1.2 µSv/h
57% 75% of points above 1 µSv/h
100% of points above 0.23 µSv/h
Chart 4: Proportion of dose rate in Tsushima (by walking)
(2,834 points, at 1 meter height, surveyed on 25 September, 2017)
Obori
The community of Obori, around 20 km west-northwest of the Fukushima Daiichi nuclear plant, is targeted
as a reconstruction hub by the Japanese government with a target date for lifting evacuation orders in a
small area in March 2023.16 Yet, in all of the survey work conducted by Greenpeace in September 2017,
it was this area that showed the most extensive and consistently high radiation levels. In the community
of Obori, weighted average radiation levels were 4.3 µSv/h with a maximum level of 11.6 µSv/h, at this
highest level annual exposure would be 101mSv. In 34% of the area measured in Obori the average annual
radiation dose was 43 mSv.
Intervals Number of points % of points mSv/y (Japan govt.)(*) mSv/y if 8,760h/y (*)
>= 5 µSv/h 897 34% >= 26 mSv/y >= 43 mSv/y
< 5 and >= 3.8 µSv/h 550 21% >= 20 mSv/y >= 33 mSv/y
< 3.8 and >= 2 µSv/h 1,049 40% >= 10 mSv/y >= 17 mSv/y
< 2 and >= 1.5 µSv/h 141 5% >= 8 mSv/y >= 13 mSv/y
< 1.5 and >= 1 µSv/h 3 0% >= 5 mSv/y >= 8 mSv/y
< 1 and >= 0.5 µSv/h 0 0% >= 3 mSv/y >= 4 mSv/y
< 0.5 and >= 0.23 µSv/h 0 0% >= 1 mSv/y >= 2 mSv/y
< 0.23 µSv/h 0 0% < 1 mSv/y < 2 mSv/y
Total number of points 2,640 100%
Table 5: Radiation measurement data in Obori (walking on- and off-road)
(*) Average dose rate of 0.04 μSv/h before March 2011 subtracted
Greenpeace Japan
15 | Reflections in Fukushimachart 5
> = 5µSv/h
5% < 5 and > = 3.8µSv/h
< 3.8 and > = 2µSv/h
< 2 and > = 1.5µSv/h
< 1.5 and > = 1µSv/h
< 1 and > = 0.5µSv/h
< 0.5 and > = 0.23µSv/h
< 0.23 µSv/h
34% Maximum = 11.6µSv/h
Minimum = 1.4µSv/h
Average = 4.3µSv/h
40%
21% 100% of points above 1 µSv/h
100% of points above 0.23 µSv/h
Chart 5 : Proportions of dose rate from Obori
(2,640 points, at 1 meter height, surveyed on 26 September, 2017)
Route 114
A 27 km stretch of Route 114, which runs east-west between Murohara and Tsushima districts in
Namie, both designated as “difficult to return to” exclusion zones, was reopened to general traffic on
20 September 2017.17 It was the first time since 2011 that restrictions had been lifted in this highly
contaminated area. Between June and November 2014 decontamination operations were conducted
along the route, and thereafter local residents with permits were allowed to use the road between 6am and
8pm.18 The route is also being used to move nuclear waste to interim storage sites at Futaba and Okuma.19
The government’s decision to reopen Route 114 came after requests from the Namie town council.20
The justification for reopening the route to general public access is that by so doing, the movement of
people and goods between Futaba district, which includes Namie and the northern part of the prefecture,
including Fukushima city, will help accelerate reconstruction of the area.
The government’s radiation survey, conducted in August 2017 measured an average accumulated dosage
of exposure for a motorist traveling in a car at 40 kilometers per hour between Tsushima and Murohara at
1.01 µSv, “a level posing no health problems” according to the government. In the survey, mid-air radiation
along the road was also measured. The maximum reading was 5.53 µSv/h.21
Route 114
Namie Town
Reconstruction hubs
Murohara district
Suenomori district
Tsushima district
Obori district
Map 2: Map of Namie and location of construction hubs - Tsushima, Murohara, Suenomori, and Obori
districts - and Route 114 (This map is created based on the material of the Construction Agency)
Greenpeace Japan
Reflections in Fukushima | 16Intervals Number of points % of points mSv/y (Japan govt.)(*) mSv/y if 8,760h/y (*)
>= 5 µSv/h 15 0% >= 26 mSv/y >= 43 mSv/y
< 5 and >= 3.8 µSv/h 50 2% >= 20 mSv/y >= 33 mSv/y
< 3.8 and >= 2 µSv/h 405 13% >= 10 mSv/y >= 17 mSv/y
< 2 and >= 1.5 µSv/h 385 12% >= 8 mSv/y >= 13 mSv/y
< 1.5 and >= 1 µSv/h 605 19% >= 5 mSv/y >= 8 mSv/y
< 1 and >= 0.5 µSv/h 938 30% >= 3 mSv/y >= 4 mSv/y
< 0.5 and >= 0.23 µSv/h 439 14% >= 1 mSv/y >= 2 mSv/y
< 0.23 µSv/h 306 10% < 1 mSv/y < 2 mSv/y
Total number of points 3,143 100%
Table 6: Greenpeace Route 114 road scanning (from outside vehicle at 1m height) survey results
(*) Average dose rate of 0.04 μSv/h before March 2011 subtracted
Greenpeace conducted road scanning along Route 114
to Tsushima in September 2017. The results are generally
consistent with the measurements conducted by the
government. However, the weighted average levels are
higher at 1.3 µSv/h, with a maximum level of 6.5 µSv/h.
The reopening of Route 114 in September 2017 by the
government is in part intended to change individual and
broader societal perception of the risks of radiation in
Fukushima. As such, it is consistent with their overall
strategy to attempt to normalize the public view of the
most contaminated areas of Fukushima. It also directly
affects public behavior.
Greenpeace witnessed two citizens working at a
building at a house along Route 114. Through no fault of
© Greenpeace
their own they were unaware that there were significant
radiation levels. They had no personal dosimeters or
protective clothing. Radiation levels at the location
included, in front of the house, a weighted average of
3.8 µSv/h with a maximum level of 7.6 µSv/h.
Hot spots at the front of the building, less than 10 meters from where a Fukushima citizen was working,
were 11 µSv/h at 1 meter height and 137 µSv/h at 0.1 meter. At ground level itself the readings were
in excess of 200 µSv/h. In the first instance the principal risks are for citizens who would return to
such areas to live over an extended period, rather than those visiting for a few hours. However, there
is no safe threshold for radiation for which there is not a potential risk to health. In a Zone only meters
from Route 114 the radiation levels are such that if they were to be observed in a nuclear facility or
laboratory, they would require strict control and emergency management, and public access would be
prohibited.
Greenpeace Japan
17 | Reflections in FukushimaConclusion
80% of Namie remains designated by the Japanese government as a ”difficult to return to” exclusion
zone. The Greenpeace survey results demonstrate that for good reason this area remains prohibited
from habitation. However, it is clear that the government is determined to continue with its failed policy
of decontamination and the lifting of evacuation restrictions. Indeed, in the autumn of 2017, plans were
announced for opening small areas or hubs in the “difficult to return to” exclusion zones in Namie –
specifically Tsushima, Murohara, Suenomori, and Obori districts.22 In December 2017, they were approved
by both the Reconstruction Ministry and the Abe government.23 The plans cover 661 hectares, equivalent
to 3% of the “difficult to return to” exclusion area of Namie. Work will commence in May 2018 with the goal
of lifting the evacuation order for the these areas in March 2023.
The Greenpeace survey results show that given the current radiation dose rates, with slow decay times and
an ineffective decontamination program, there is no possibility that these areas will be safe for habitation
within the coming decades and longer.
© Åslund / Greenpeace
Aerial view of Obori, in Futaba district, inside the highly contaminated exclusion zone in Namie,
Fukushima prefecture, September 2017.
Greenpeace Japan
Reflections in Fukushima | 185. Lifted evacuation areas
- Namie and Iitate
Aerial view of large nuclear waste storage area with
Namie town in background, 10 km north of the
Fukushima Daiichi nuclear plant, September 2017. Greenpeace Japan
© Åslund / Greenpeace 19 | Reflections in FukushimaOn 31 March 2017 the Japanese government lifted its survey to the central area of Namie town where
the evacuation orders for Area 2 in Iitate and Namie the majority of the population formerly lived. As
Town. The population of these districts north and with the results of our surveys in Iitate conducted in
north-west of the Fukushima Daiichi nuclear plant 2015 and 2016, we found that radiation levels in the
was 6,509 and 21,434 in March 2011.24 Greenpeace area of Namie where the evacuation order has been
had conducted radiation surveys in Namie and Iitate lifted are significantly higher than the government’s
in 2011. In September 2017, Greenpeace extended current long term target level of 0.23 µSv/h.
Namie Town
© Åslund / Greenpeace
Namie Town is 10 km north-northwest of the Fukushima
Daiichi nuclear plant, and has clearly had extensive
decontamination conducted from 2014 and completed
in March 2017. However, this has failed to reduce
radiation levels to the government’s current long term
target of 0.23 µSv/h. The Greenpeace road scanning
in Namie in the formerly restricted Area (See Map 3)
showed weighted average radiation levels at 0.3 µSv/h,
with a maximum of 2.1 µSv/h, and with 59% of all
measurement points higher than the government target
of 0.23 µSv/h. In 19% of the area surveyed in Namie
town, radiation levels would give an annual radiation
dose of 4 mSv. Moving to the north and south of the
major built up areas of Namie town, radiation levels
were considerably higher than in the central district.
Along the Takase river average levels were 1.4 µSv/h with a maximum of 2.7 µSv/h. In 42% of the area
surveyed radiation levels would give an annual radiation dose of 13 mSv, and in 97% of the area the
annual exposure would be 4 mSv.
Map data: Google
Map 3 : Road scanning route in Namie in the formerly restricted Area
(from outside vehicle at 1m height)
Greenpeace Japan
Reflections in Fukushima | 202017
Zone name Max Average Number of Above Above
(µSv/h) (µSv/h) points 0.23 µSv/h 1 µSv/h
Zone 1 North west 2.1 0.4 2,088 89% 2%
Zone 2 South west 1.8 0.4 3,336 56% 3%
Zone 3 South west 1.9 0.2 721 38% 1%
Zone 4 Centre of Namie 0.5 0.1 699 5% 0%
ALL Weighted average of all zones 2.1 0.3 6,844 59% 2%
Table 7: Greenpeace road scanning (from outside vehicle at 1m height) survey results for Namie
Area 2 (Zone 1 and 2 – surveyed on 25 September, Zone 3 and 4 – surveyed on 29 September)
In a small forested chart
area opposite
2 the child care facility and school in Namie, the average radiation level
was 2 µSv/h with a maximum of 3.1 µSv/h (see Map 4). In 89% of the area the annual dose would be 13
mSv or more. Hotspots in the forest reached up to 5 µSv/h.
> = 5µSv/h
5% < 5 and > = 3.8µSv/h
< 3.8 and > = 2µSv/h
< 2 and > = 1.5µSv/h
< 1.5 and > = 1µSv/h
< 1 and > = 0.5µSv/h
< 0.5 and > = 0.23µSv/h
26% < 0.23µSv/h
29% Maximum = 3.7µSv/h
Minimum = 0.7µSv/h
Average = 1.7µSv/h
40%
95% of points above 1 µSv/h
100% of points above 0.23 µSv/h
Map data: Google
Map 4: Radiation scanning (by walking) route opposite childcare facility and school in Namie
Conclusion
The conclusion of our survey work in the newly opened area of Namie is that despite major decontamination
efforts, the radiation levels were consistently higher than the government long term target of 0.23 µSv/h;
with examples of elevated levels along roads and next to forests that clearly are not safe from a radiation
exposure perspective. Amongst other reasons, the radiation risks that persist in Namie are reflected in the
returning population statistics where, as of December 2017, only 440 former residents as of March 2011
(equal to 2.2% of the population) had returned to Namie.25
Greenpeace Japan
21 | Reflections in FukushimaNamie town, Fukushima prefecture, 10 km north of
Greenpeace
the FukushimaJapan
Daiichi nuclear plant, September 2017.
Reflections in Fukushima | 22
© Åslund / GreenpeaceGreenpeace Japan 23 | Reflections in Fukushima
Iitate, Mr. Anzai’s house
         In October 2017, Greenpeace surveyed seven houses in Iitate as well as conducting road scanning across
         the district. We include the name of Mr. Toru Anzai; however, other homeowners’ names are not included
         due to their wish to remain anonymous.

         Mr. Anzai’s house is located in the south east of Iitate, 35 km from the Fukushima Daiichi nuclear power
         plant. Mr. Anzai evacuated from his home on 24 June 2011.

                                                           Inside house
                                                                                                               < 1.5 and > = 1μSv/h
                                          Forest behind house                                                  < 1 and > = 0.5μSv/h
                                                                   Under the roof of house                     < 0.5 and > = 0.23μSv/h
                                           Field up and
                                           left of house                               Path right of the house

                                                                          11                   Front and sides of house
                                                            5                                        Field with former greenhouse

                                                    4            12 3                                           Field
                                                                   2
                                                                    1
                                                                                  7
                                                                                           6
                                                                                                            Rice field
                                                                                                            other side of road
           Diagram 1: Schematic of                                         9                               8
           Mr. Anzai’s house in Iitate,
           showing the designated                                                                   10 Road on both sides
           Zones for the Greenpeace
           radiation survey team.                            Road to house

                                                                           Field at road

         Mr. Anzai’s house, and the surrounding area, was decontaminated by the authorities during the period
         2014 - 2015. This involved scraping away a layer of more than 5 cm of topsoil, which was then removed
         from the site and stored as radioactive waste. In some cases, the surface was covered over with
         uncontaminated soil. The survey results from Mr. Anzai’s house in 2015 - 2017 are shown in Table 8.

         Diagram 1 shows the location and boundaries of the 11 survey Zones around Mr. Anzai’s house. A total
         of 4,688 measurement points were taken in October 2017. When conducting the survey in October 2015
         decontamination work was still in progress, which led us to conclude in 2016 that the measured decrease
         was a combined effect of further decontamination, decay and erosion.

         In 100% of all measurements taken in October 2017 the levels exceeded the government target of 0.23
         μSv/h, with 22% in excess of 1 μSv/h. For all the Zones outside Mr. Anzai’s house, the weighted average
         from October 2017 was 0.8 μSv/h, which compares with 0.7 μSv/h in November 2016, and 69% of the
         2015 weighted average of 1.1 μSv/h. In 2015, decontamination was still ongoing and the levels recorded in
         2016, when decontamination was completed, have remained almost stable when compared with 2017. A
         maximum of 2 μSv/h was measured in Zone 9.

         In 2016, the most significant decrease in radiation compared to 2015 on Mr. Anzai’s land was
         measured in Zone 8, a rice field, which had been decontaminated (5 cm of topsoil removed) and
         subsequently covered with a layer of uncontaminated soil. The new soil layer shields quite effectively
         the residual radiation underneath. A significant decrease of radiation from an average of 1.4 μSv/h

Greenpeace Japan
Reflections in Fukushima | 24
in October 2015 to 0.3 μSv/h in November 2016 was
measured. In the September 2017 survey, the average
levels in Zone 8 had increased to 0.5 μSv/h, with a
maximum of 1.2 μSv/h. This variation since 2016 may
be due to erosion of the topsoil, possible migration of
contaminated soil, or some other unknown factor. The
fact that this has been identified confirms the complex
nature of the radio-ecology in the most contaminated
areas of Fukushima prefecture. Greenpeace’s planned
survey in 2018 should help to clarify these issues.
The decontamination effectiveness was much less
effective in Zone 5. As can be seen in Diagram 1, the
farmhouse is located in front of a steep sided forest. This
is similar to many houses in Iitate, which are also located © Åslund / Greenpeace
in close proximity to hillside forests. It is not possible to
decontaminate these forests.
As is standard practice throughout the contaminated regions, an area up to 20 meters from Mr. Anzai’s
house into the forest has been ‘decontaminated’. In Zone 5, including a non-decontaminated area,
we measured a decrease from an average of 1.4 μSv/h in 2015 to 1.0 μSv/h in 2016, and 0.9 μSv/h in
September 2017. This is possibly due to radioactive decay, erosion or some other unknown factor. The
maximum measurement was 1.6 μSv/h, compared with 1.5 μSv/h in 2016. The radiation levels on the steep
slope close to the house are quite important as they have a direct impact on the radiation levels inside the
house. Also, we expect that radioactivity from the non-decontaminated forest might re-contaminate the
already decontaminated area below and closer to the house.
Average % of
Max (µSv/h) Average (µSv/h) Number of points Above 0.23 µSv/h Above 1 µSv/h
Zone name previous year
2017 2016 2015 2017 2016 2015 2017 2016 2015 2017 2016 2015 2017 2016 2015 2017 2016 2015
Zone 1 Road to house 0.9 0.8 1.4 0.6 0.6 1.1 105% 58% n/a 255 264 481 100% 100% 100% 0% 0% 78%
Zone 2 Front and sides of house 0.8 0.7 1.3 0.4 0.3 0.6 116% 60% n/a 372 301 234 98% 87% 100% 0% 0% 4%
Zone 3 Under the roof of house 0.6 0.7 1.2 0.4 0.4 0.7 101% 57% n/a 186 169 573 98% 98% 100% 0% 0% 11%
Zone 4 Field up and left of house 1.4 1.5 2.3 1.1 1.1 1.9 99% 61% n/a 365 283 524 100% 100% 100% 88% 88% 100%
Zone 5 Forest behind house 1.6 1.5 2.2 0.9 1 1.4 90% 75% n/a 644 358 814 100% 100% 100% 48% 53% 71%
Zone 6 Field 1.1 1.1 2 0.8 0.8 1.2 105% 69% n/a 370 327 1126 100% 100% 100% 8% 2% 73%
Zone 7 Field with former greenhouses 1.4 1.6 n/a 0.8 0.8 n/a 105% n/a n/a 607 578 n/a 100% 100% n/a 16% 18% n/a
Zone 8 Rice field other side of road 1.2 0.6 1.7 0.5 0.3 1.4 145% 23% n/a 510 239 332 100% 98% 100% 3% 0% 100%
Zone 9 Field at road 2 1.5 n/a 0.9 1 n/a 96% n/a n/a 183 103 n/a 100% 100% n/a 22% 30% n/a
Zone 10 Road on both sides 1.4 1 2.6 0.7 0.6 1.3 115% 48% n/a 857 194 592 100% 100% 100% 4% 1% 95%
Zone 11 Path right of the house 1.6 1.5 n/a 1.1 1 n/a 111% n/a n/a 339 245 n/a 100% 100% n/a 65% 50% n/a
Zone 12 Inside house 0.7 n/a 0.9 0.3 n/a 0.5 n/a n/a n/a 215 n/a 817 100% n/a 100% 0% n/a 0%
ALL Weighted average of all zones 2 1.6 2.6 0.8 0.7 1.1 101% 68% n/a 4,903 3,061 5,493 100% 98% 100% 22% 23% 58%
Table 8 : Radiation measurement data from Mr. Anzai’s house, Iitate - 2015-2017
Table 8 underlines the complex nature of the radiological condition of the most contaminated areas
of Fukushima prefecture. In 8 of the 11 Zones for which we have complete data at Mr. Anzai’s home,
radiation levels have not declined during the period from 2016-2017, but have remained the same, or
even slightly increased. Explanations for these results include re-contamination through migration of
radionuclides from the nearby contaminated forested mountain slopes, and possibly some variation in the
precise survey area. The inevitability of re-contamination from the forested mountains, which represent
70% of Iitate, as well as an equal amount of Namie, is further evidence that the government’s limited
decontamination program for thousands of homes has been, and will continue to be, ineffective in reducing
the risks to citizens of Fukushima if they were to return to their homes.
Additional data from the house survey is contained in Appendix.
Greenpeace Japan
25 | Reflections in FukushimaHouse A
Greenpeace conducted surveys of this central Iitate house and property in October 2015 and November
2016. Prior to the Greenpeace survey in October 2015 all areas measured, including the house itself, had
already been designated as decontaminated. Radiation levels outside the house (including a public road
to a shrine) were 14% lower in 2016 compared to 2015 (weighted averages) and 25% lower in 2017. The
weighted average was 0.2 μSv/h in October 2017, compared with 0.3 μSv/h and 0.4 μSv/h in 2016 and
2015 respectively.
As Table 9 shows, the highest contamination is still found around the covered car park (Zone 3), where
radiation had accumulated on the ground under the perimeter of the roof as a result of rain runoff. The
maximum dose rate at a height of 1m decreased from 1.3 to 0.7 μSv/h between 2015 and 2016. By
October 2017 there was a further reduction to 0.5 μSv/h. It should be noted that after the first government
decontamination at the house, there has been at least one “hot spot” decontamination effort during the
period 2015 to 2017. Equally the reduction could be as a result of dispersal through weathering, including
heavy rain. Along the road from the house to the shrine (Zone 6), there was a reduction in the average
radiation levels from 0.4 to 0.3 μSv/h.
As the house is located in a central area of the village, the risk for re-contamination from non-decontaminated
areas (principally forested mountains) is low. As we stated in the Greenpeace report “No Return to Normal”
published in February 2017,26 there has been an expected reduction in radiation levels, while 73% of all
measurements still exceed the government’s current long term target of 0.23 μSv/h in October 2017.
Average % of
Max (µSv/h) Average (µSv/h) Number of points Above 0.23 µSv/h Above 1 µSv/h
Zone name previous year
2017 2016 2015 2017 2016 2015 2017 2016 2015 2017 2016 2015 2017 2016 2015 2017 2016 2015
Zone 1 Under roof of house 0.3 0.4 0.5 0.2 0.2 0.2 90% 86% n/a 113 272 104 12% 26% 52% 0% 0% 0%
Zone 2 Front of house and car park 0.3 0.5 0.4 0.2 0.2 0.2 80% 96% n/a 148 280 77 22% 41% 45% 0% 0% 0%
Zone 3 Under roof car park 0.5 0.7 1.3 0.3 0.3 0.4 89% 75% n/a 98 132 48 37% 54% 71% 0% 0% 6%
Zone 4 Small field 0.4 0.6 0.6 0.3 0.4 0.4 72% 96% n/a 233 245 143 98% 100% 100% 0% 0% 0%
Zone 5 Big field 0.3 0.6 0.5 0.2 0.3 0.3 71% 91% n/a 193 321 151 42% 90% 97% 0% 0% 0%
Zone 6 Road to shrine 0.6 1.1 1.5 0.3 0.4 0.6 84% 70% n/a 1,366 1,440 466 87% 93% 100% 0% 0% 7%
Zone 7 Inside house n/a 0.2 0.2 n/a 0.1 0.1 n/a 94% n/a n/a 382 105 n/a 0% 0% n/a 0% 0%
ALL Weighted average of all zones 0.6 1.1 1.5 0.2 0.3 0.4 80% 86% n/a 2,151 3,072 1,094 73% 79% 89% 0% 0% 4%
Table9: Radiation measurement data from House A, Iitate
House B
For this house in the southern part of Iitate, the 2016 and 2017 measurements were made in more detail
and more extensively than in 2015, which explains the larger number of Zones. The weighted overall
average in October 2017 was 0.8 μSv/h which remains the same as in 2016, with a maximum of 2.2 μSv/h.
Average % of
Max (µSv/h) Average (µSv/h) Number of points Above 0.23 µSv/h Above 1 µSv/h
Zone name previous year
2017 2016 2015 2017 2016 2015 2017 2016 2015 2017 2016 2015 2017 2016 2015 2017 2016 2015
Zone 1 Road 2.2 0.8 2.7 0.6 0.5 1.3 123% 39% n/a 545 199 254 100% 100% 100% 2% 0% 78%
Zone 2 Path to house 0.8 0.6 n/a 0.5 0.5 n/a 113% n/a n/a 91 68 n/a 100% 100% n/a 0% 0% n/a
Zone 3 Front and side house 0.8 1 n/a 0.4 0.6 n/a 77% n/a n/a 168 96 n/a 100% 100% n/a 0% 1% n/a
Zone 4 Under the roof 1.6 1.6 2.2 0.8 0.7 1.1 102% 67% n/a 203 215 240 100% 100% 100% 33% 26% 56%
Zone 5 Back side of house 1.6 1 2.3 1 0.8 1.5 128% 53% n/a 139 68 415 100% 100% 100% 52% 1% 90%
Zone 6 Field left of house 1.1 2.2 n/a 0.9 1.1 n/a 77% n/a n/a 143 433 n/a 100% 100% n/a 13% 76% n/a
Zone 7 Field greenhouse 1.2 1.2 2 0.7 0.8 1.1 99% 68% n/a 198 279 404 100% 100% 100% 8% 5% 77%
Zone 8 Field with trees 1 1.6 n/a 0.8 1.2 n/a 67% n/a n/a 174 183 n/a 100% 100% n/a 0% 81% n/a
Zone 9 Rice field 1.4 n/a n/a 0.7 n/a n/a n/a n/a n/a 403 n/a n/a 100% n/a n/a 7% n/a n/a
Zone 10 Field 1.2 1.5 1.8 0.9 0.8 1.5 120% 54% n/a 252 804 560 100% 100% 100% 43% 29% 100%
Zone 11 Field 0.6 n/a n/a 0.5 n/a n/a n/a n/a n/a 172 n/a n/a 100% n/a n/a 0% n/a n/a
Zone 12 Forest left from house 1.9 1.3 n/a 1.2 0.7 n/a 178% n/a n/a 521 155 n/a 100% 99% n/a 78% 29% n/a
Zone 13 Path in forest 1.7 n/a n/a 0.8 n/a n/a n/a n/a n/a 218 n/a n/a 100% n/a n/a 22% n/a n/a
Zone 14 Forest behind house 1.9 n/a 2.7 1.3 n/a 2 n/a n/a n/a 783 n/a 404 100% n/a 100% 85% n/a 100%
ALL Weighted average of all zones 2.2 2.2 2.7 0.8 0.8 1.4 104% 55% n/a 4,010 2,500 2,277 100% 100% 100% 36% 32% 80%
Table10: Radiation measurement data from House B, Iitate
Greenpeace Japan
Reflections in Fukushima | 26House C
This house is located in the northern (and generally less contaminated) part of Iitate. There were no
measurements made in 2015. The decontamination for a designated area had been finalized before
our measurements in November 2016. The weighted overall average in October 2017 was 0.4 μSv/h
compared with 0.5 μSv/h in 2016, and a maximum of 1.5 μSv/h. Table 11 shows the fields that had been
decontaminated and covered with a layer of non-contaminated soil. The forest is an area (Zone 11) above
the house and was mostly not decontaminated. As in 2016, we measured an average of 0.7 μSv/h in this
area. For Zone 9, which is a small field close to the road, we suspect that some further decontamination
had taken place between the measurements in 2016 and 2017.
Average % of
Max (µSv/h) Average (µSv/h) Number of points Above 0.23 µSv/h Above 1 µSv/h
Zone name previous year
2017 2016 2017 2016 2017 2016 2017 2016 2017 2016 2017 2016
Zone 1 Road 0.3 0.6 0.2 0.3 79% n/a 177 309 69% 88% 0% 0%
Zone 2 Under roof 0.3 0.4 0.2 0.2 92% n/a 157 181 38% 49% 0% 0%
Zone 3 Around house 0.4 0.8 0.3 0.3 77% n/a 142 543 55% 73% 0% 0%
Zone 4 Field left 0.4 0.8 0.3 0.4 67% n/a 126 232 98% 100% 0% 0%
Zone 5 Field back 0.5 0.7 0.3 0.5 60% n/a 159 478 87% 100% 0% 0%
Zone 6 Field right 0.6 0.6 0.4 0.4 91% n/a 154 169 100% 100% 0% 0%
Zone 7 Around office and path 0.6 0.7 0.3 0.4 90% n/a 348 533 92% 92% 0% 0%
Zone 8 Factory field 0.7 1.1 0.3 0.4 65% n/a 569 1,242 53% 78% 0% 0%
Zone 9 Field near factory 0.6 1.1 0.4 0.8 48% n/a 159 189 100% 100% 0% 6%
Zone 10 Forest path left house 1.4 1.6 0.8 0.9 94% n/a 352 1,329 100% 100% 11% 33%
Zone 11 Forest around house 1.5 1.1 0.7 0.7 109% n/a 861 911 100% 99% 26% 3%
ALL Weighted average of all zones 1.5 1.6 0.4 0.5 78% n/a 3,204 6,116 83% 90% 8% 8%
Table11: Radiation measurement data from House C, Iitate
House D
In 2016, we also monitored House D which was not decontaminated and which was dismantled between
our monitoring in 2016 and October 2017. We thus did not monitor this house again.
House E
This house is located in the southern part of Iitate. Decontamination had been finalized before the
measurements in November 2016. The weighted overall average for all Zones has declined from 1.1 μSv/h
in 2016 to 0.7 μSv/h in October 2017. The higher contamination, as in 2016, was very close to the house
(Zone 4), with the maximum level at 1.7 μSv/h and an average of 0.8 μSv/h; as well as in Zone 13 in the
forest behind the house with an average of 1.1 μSv/h and a maximum of 1.9 μSv/h. As with other houses,
100% of measurements in the area were in excess of the long term government target of 0.23 μSv/h.
Average % of
Max (µSv/h) Average (µSv/h) Number of points Above 0.23 µSv/h Above 1 µSv/h
Zone name previous year
2017 2016 2017 2016 2017 2016 2017 2016 2017 2016 2017 2016
Zone 1 Path to house 0.9 1.1 0.6 0.6 95% n/a 333 297 100% 100% 0% 1%
Zone 2 Solar field 1.1 1.4 0.5 0.6 75% n/a 450 500 100% 100% 1% 4%
Zone 3 Front of house 1.5 0.7 0.5 0.5 103% n/a 213 106 100% 100% 2% 0%
Zone 4 Side and behind house 1.7 3 0.8 1.4 57% n/a 258 447 1% 100% 23% 65%
Zone 5 Rice paddy 0.8 n/a 0.4 n/a n/a n/a 216 n/a 93% n/a 0% n/a
Zone 6 Path left of house 1.6 2.3 0.8 1.2 66% n/a 181 191 100% 100% 11% 62%
Zone 7 Greenhouse close to house 1.9 2.7 0.9 1.2 80% n/a 369 390 100% 100% 37% 66%
Zone 8 Far greenhouse 0.8 2 0.6 1.2 46% n/a 299 370 100% 100% 0% 91%
Zone 9 Farmland 0.9 n/a 0.5 n/a n/a n/a 217 n/a 100% n/a 0% n/a
Zone 10 Under the roof of house 0.9 n/a 0.5 n/a n/a n/a 108 n/a 100% n/a 0% n/a
Zone 11 Field 1.6 3 0.8 1.4 58% n/a 364 848 100% 100% 33% 70%
Zone 12 Field 1 n/a 0.5 n/a n/a n/a 296 n/a 99% n/a 0% n/a
Zone 13 Forest behind house 1.9 n/a 1.1 n/a n/a n/a 349 n/a 100% n/a 59% n/a
Zone 14 Path right of house to grave 1.8 n/a 0.8 n/a n/a n/a 347 n/a 100% n/a 24% n/a
ALL Weighted average of all zones 1.9 3 0.7 1.1 67% n/a 4,000 3,149 100% 100% 16% 52%
Table12: Radiation measurement data from House E, Iitate
Greenpeace Japan
27 | Reflections in FukushimaHouse F
This house is also located in the southern, more contaminated, part of Iitate. The situation is very
similar to the house of Mr. Anzai, with example a decrease of 15% in the steep forest (Zone 1) and an
increase of 13% in the field below that forest (Zone 2). Radiation levels in 2017 remained on average
stable compared to 2016. Almost all points (99%) remain above the long-term government target of
0.23 µSv/h and 38% are above 1 µSv/h, an increase from 32% in 2016. The weighted overall average
for all Zones has declined from 0.8 μSv/h in 2016 to 0.7 μSv/h in October 2017. In 2016, the Zone 1
mushroom forest had an average of 1.6 μSv/h with a maximum of 2 μSv/h, while in 2017 it was 1.4
μSv/h with a maximum of 1.8 μSv/h. In Zone 2, a decontaminated field, the average was 0.7 μSv/h (the
same as in 2016), with maximum levels increasing from 1.6 to 1.7 μSv/h.
Average % of
Max (µSv/h) Average (µSv/h) Number of points Above 0.23 µSv/h Above 1 µSv/h
Zone name previous year
2017 2016 2017 2016 2017 2016 2017 2016 2017 2016 2017 2016
Zone 1 Forest mushrooms 1.8 2 1.4 1.6 85% n/a 759 536 100% 100% 97% 100%
Zone 2 Field decontaminated 1.7 1.6 0.7 0.7 113% n/a 465 407 100% 100% 28% 11%
Zone 3 Greenhouse 1.3 1.6 0.8 0.9 87% n/a 409 177 100% 100% 6% 2%
Zone 4 Back of house n/a 1.4 n/a 0.9 n/a n/a n/a 165 n/a 100% n/a 42%
Zone 5 Front of house 0.9 1.1 0.4 0.6 71% n/a 210 303 97% 100% 0% 3%
Zone 6 Under roof 0.7 0.7 0.4 0.5 89% n/a 89 133 79% 98% 0% 0%
Zone 7 Pond and greenhouse 1.2 1.2 0.9 0.8 110% n/a 167 221 100% 100% 27% 14%
Zone 8 Field decontaminated 1.1 0.9 0.5 0.5 109% n/a 395 409 100% 100% 1% 0%
ALL Weighted average of all zones 1.8 2 0.7 0.8 93% n/a 2,494 2,351 99% 100% 38% 32%
Table13: Radiation measurement data from House F, Iitate
Conclusion
As of 1 December 2017, the population of Iitate was
505 citizens (7.9% of the 2011 population).27 One factor
in this low return rate is undoubtedly the high radiation
levels in the district. The Greenpeace survey results
provide conclusive evidence that citizens of Iitate are
right to be concerned about the safety implications if
they were to choose to return.
© Åslund/ Greenpeace
Greenpeace Japan
Reflections in Fukushima | 28You can also read