Projected plastic waste loss scenarios between 2000 and 2030 into the largest freshwater lake system in Southeast Asia - Nature
←
→
Page content transcription
If your browser does not render page correctly, please read the page content below
www.nature.com/scientificreports
OPEN Projected plastic waste loss
scenarios between 2000 and 2030
into the largest freshwater‑lake
system in Southeast Asia
Alexander Matthew David Finnegan1* & Christos Gouramanis1,2
Freshwater plastic pollution is critically understudied in Southeast Asia (SEA). Recent modelling
studies indicate that SEA rivers contribute vast quantities of plastic to the world’s oceans, however,
these fail to capture the complexity of individual systems. We determine the volume of mismanaged
plastic waste (MPW) entering Tonle Sap Basin (TSB)—the largest freshwater lake–river system in SEA,
between 2000 and 2030. Using economic, population and waste data at provincial and national levels,
coupled with high resolution population and flood datasets, we estimate that ca. 221,700 tons of
plastic entered between 2000 and 2020, and 282,300 ± 8700 tons will enter between 2021 and 2030.
We demonstrate that policy interventions can reduce MPW up to 76% between 2021 and 2030. The
most-stringent scenario would prevent 99% of annual MPW losses by 2030, despite substantially
higher waste volumes and population. If successfully implemented, Cambodia will prevent significant
losses in natural capital, material value and degradation in TSB worth at least US$4.8 billion, with
additional benefits for the Mekong River and South China Sea.
Plastic pollution has emerged in recent decades as one of the greatest contemporary threats to global ecosystems,
representing a major challenge for water quality, aquatic life and overall human wellbeing in the twenty-first
century1. The ever-increasing global demand (and disposal) of plastics has led to profound changes to the natural
world, as plastic has progressively leaked from the Anthroposphere2,3. Plastic has since evolved into one of the
most-recent, novel, and widely-recognised pollutant in the e nvironment4. Such is the comprehensive infiltration
of plastic into the environment, across an entire spectrum of forms and size, plastic pollution is now irreversible
and planetary-scale in nature5. Consequently, plastic has already met two of the three conditions of a planetary
boundary threat1,6,7. It is unclear if or when plastic may exceed the final threshold of global systemic change to
the planet1,8,9.
Plastic pollution in many aquatic systems remains critically understudied and most research has focused on
the marine e nvironment10. Freshwater is one of the most important natural resources available on Earth and
the security of good-quality freshwater resources is an increasing global c oncern11,12. Plastic pollution is com-
pounding the mounting contemporary issues of climate-change, eutrophication, invasive species, and existing,
legacy damage, caused by nutrient loading, acidification and shoreline modification12. Specifically, the freshwater
systems of Southeast Asia (SEA) are highly vulnerable, whilst the adaptive capacity of the population is compara-
tively low13. While studies of riverine plastic pollution in SEA have g rown14–17, there are no dedicated systematic
studies of plastic pollution in major SEA rivers, such as the Mekong River (MR)10.
Recent global modelling studies of riverine plastic pollution transported to the world’s oceans have demon-
strated that SEA rivers contribute some of the highest quantities of plastic from continental interiors18,19. How-
ever, whilst these studies have been successful in producing large datasets, and identifying rivers or regions for
further examination, the uniform approach used for global aquatic systems have failed to capture the complexities
of individual systems. This would imply that a higher degree of accuracy in the global estimates of plastic losses
could be achieved if key sites were examined in detail. To address this disparity between global-scale modelling,
and local spatial- and temporal-scale complexity in assessing plastic pollution, we develop and apply a rigorous
modelling framework to investigate the past, present and future volume of mismanaged plastic waste (MPW) that
has entered Tonle Sap Basin (TSB: comprising Tonle Sap Lake (TSL) and Tonle Sap River (TSR)) in Cambodia.
1
Geography Department, National University of Singapore, 1 Arts Link, #03‑01 Block AS2, Singapore 117570,
Singapore. 2Research School of Earth Sciences, The Australian National University, Building 142, Mills Road, Acton,
ACT 2601, Australia. *email: alexander.finnegan@u.nus.edu
Scientific Reports | (2021) 11:3897 | https://doi.org/10.1038/s41598-021-83064-9 1
Vol.:(0123456789)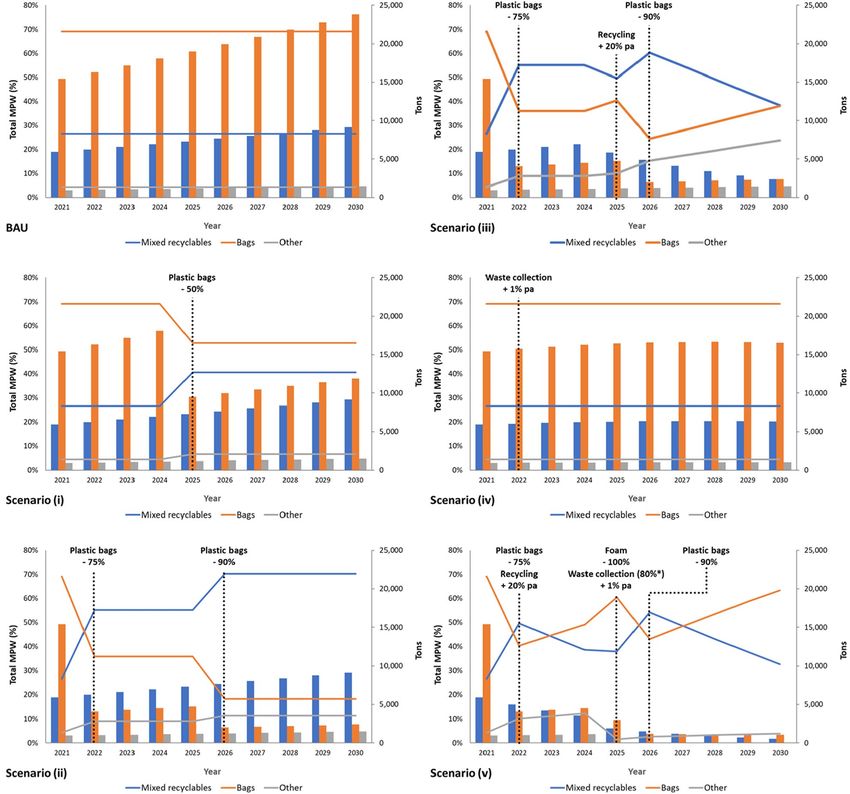
www.nature.com/scientificreports/
Figure 1. Map of study area and provinces around TSB. Red outline delineates the annual flood extent used
in this study. Blue shaded area shows the extent of the perennial lake when floodwaters recede. Inset shows the
location of the MR and TSB within S EA60. Map created in Google Earth Pro. Coordinates: 13°32′N 103° 8′E to
11°38′N 105°54′E. Eye alt: 305 feet. Landsat Copernicus. (2020).
We target TSB as it is the largest freshwater lake–river system in SEA and of global significance due to the unique
flood-pulse annual cycle, cultural and historical h eritage20, and TSB’s connection with the MR, South China Sea
and world’s oceans. In addition, TSB is a key site to directly investigate the impacts of MPW from a large popula-
tion and a rapidly growing, lower-middle income country. Finally, we examine how targeted policy interventions
could reduce MPW inputs into TSB and the growing global threat of MPW.
Tonle Sap Basin
TSB, situated within the 800,000 k m2 MR Basin in SEA (Fig. 1)21, has a distinctive wet and dry season, causing
water levels and hydrological inputs to the lake to fluctuate on an annual basis22. Every year, the southwest mon-
soon creates a flood-pulse upstream in the MR Basin. The pulse of water is subsequently propagated through the
main stem of the MR towards TSL via the TSR at the confluence of rivers in Phnom Penh. The rapid increase in
water level in the MR causes the TSR to reverse its flow towards TSL23.
TSB is the world’s fifth largest inland fishery and provides 50 to 80% of Cambodia’s animal protein24. Com-
munities near and on the lake rely on the lake water for household purposes including drinking, cooking and
cleaning with little to no treatment beforehand25. This poses a substantial risk for microplastic and associated
contaminants to enter the local population. Plastic has many pathways into TSB, via the seasonal and dynamic
hydrological changes, expansion of surface area from flooding, tributaries, wind and direct disposal into TSB.
As the hydrological discharges leaving TSL via the TSR are significantly higher than those entering T SL22, this
may suggest that TSB is a source of plastic for the MR.
Results
Mismanaged Plastic Waste losses projection from 2000 to 2030. We estimate that ca. 221,700 tons
of plastic entered TSB between 2000 and 2020. In 2000 we estimate that 1,750 tons y ear−1 entered TSB, which
rapidly increased between 19 and 41% per year until 2006 (Fig. 2). By 2010, we estimate that 9,411 tons year−1
entered TSB. The annual increase to 2020 is slower but still amounts to 21,062 tons year−1 entering TSB, repre-
senting a 124% increase from 2010. By 2030, under a Business As Usual (BAU) Scenario, we estimate that 34,392
tons year−1 will enter TSB equating to an additional ca. 282,300 ± 8700 tons between 2021 and 2030 (Fig. 2).
The estimated Annual Average Mismanaged Plastic Waste Generation Rate (MPWGRAvg ) increased from
1.8 kg (2000) to 8.2 kg (2010) and 15.7 kg (2020), and will increase to 22.6 kg (2030). Growth was pronounced
in the 2000s, following the high annual growth rates in population and waste generation at the start of the dec-
ade (Fig. 3). In the 2020s, although the growth rate is expected to be much lower, in absolute terms, the weight
Scientific Reports | (2021) 11:3897 | https://doi.org/10.1038/s41598-021-83064-9 2
Vol:.(1234567890)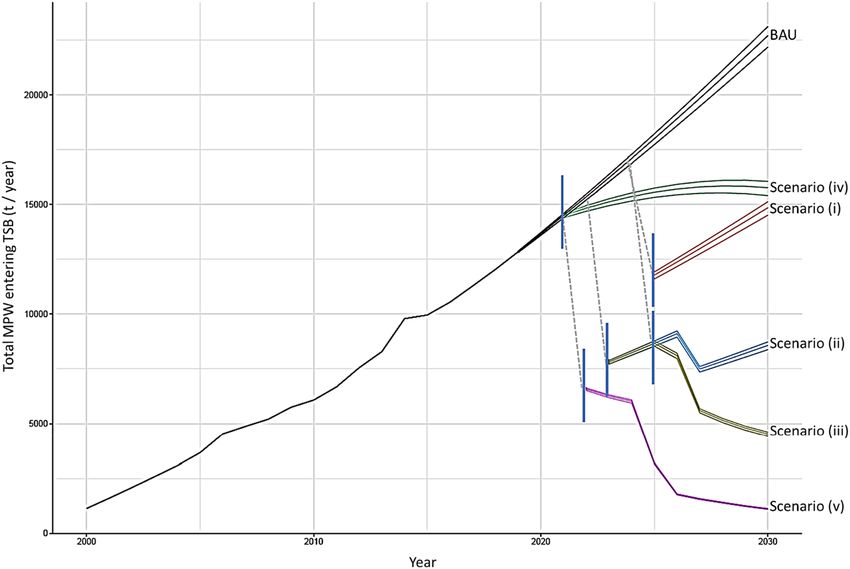
www.nature.com/scientificreports/
Figure 2. Five Scenarios (i to v) from 2021 to 2030, in addition to the Business as Usual (BAU) Scenario from
2000 to 2030. Error lines are shown as 95% prediction intervals.
increase will be similar to the 2000s and 2010s. At the provincial scale the change in Annual MPWGRProv is
profound with Siem Reap (highest initial value) growing from 3.88 kg (2000) to 48.7 kg (2030) and Pursat (lowest
initial value) growing from 0.06 kg (2000) to 0.75 kg (2030).
Policy intervention and impact on plastic inputs. Scenario (i) and its reduction of plastic bags by
50% results in a decrease of ca. 8,200 tons of plastic from entering TSB in 2025. By 2030, however, the growing
population results in MPW increasing under this scenario. In this scenario, an additional 218,200 ± 6500 tons of
plastic will enter TSB between 2021 and 2030. A total of ca. 64,000 tons of plastic is prevented from entering TSB
under this scenario, compared to BAU (Fig. 2).
Scenario (ii) causes a large, immediate drop in plastic in 2022 of ca. 11,000 tons, with a second drop of ca.
2300 tons in 2026 from the previous year. After 2026 MPW again rises due to the growing population. Between
Scenario (ii) and BAU, there is a reduction of ca. 21,000 tons of plastic entering TSB annually by 2030. In this
scenario, an additional 131,100 ± 4200 tons of plastic will enter TSB between 2021 and 2030. A total of ca. 151,000
tons of plastic is prevented from entering TSB under this scenario, compared to BAU (Fig. 2).
Scenario (iii) results in MPW continuing to decrease after 2025, due to the continual improvements in
recycling. These improvements see MPW from mixed recyclables reduce from ca. 6900 tons per year (2024) to
ca. 2400 tons per year (2030), representing a total decrease of 66%. Between 2021 and 2030, implementation of
Scenario (iii) will result in 105,400 ± 3500 tons entering TSB, which is ca. 177,000 tons less than BAU (Fig. 2).
Scenario (iv) results in a lower rate of MPW increase compared to the BAU Scenario from 2022, peaking at ca.
24,000 tons per year in 2028 before a slow decline until 2030. In this scenario, an additional 235,400 ± 7100 tons
of plastic will enter TSB between 2021 and 2030. A total of ca. 47,000 tons of plastic is prevented from entering
TSB under this scenario, compared to BAU (Fig. 2).
Scenario (v) causes a large initial annual drop by ca. 12,200 tons of plastic in 2022. The improved annual
recycling ensures that MPW peaks in 2021 (ca. 12,300 tons) and decreases to 2030 (ca. 1200 tons). From 2025,
foam plastic is eliminated from the waste stream and 80% collection coverage is implemented for all provinces
(50% for Floating communities). In 2025 the combined policy improvements cause the second largest annual
decline by (ca. 4300 tons). The last major decline occurs in 2026, with the plastic bag reduction of 90% initiating
an annual drop of ca. 2200 tons. By 2030, the total annual MPW input into TSB is ca. 1700 tons, equating to
4.9% of the BAU Scenario. Between 2021 and 2030 approximately 66,800 ± 1700 tons is added to TSB, which is
ca. 215,000 tons less than the BAU Scenario (Fig. 2).
Discussion
The annual MPW losses into TSB from 2000 to 2018 follows the trend in Cambodian economic growth and
development as the nation emerged from civil war, inclusion into the WTO and associated influx of foreign
investment and goods to the present. Between 2000 and 2003, we predict the annual MPW input into TSB to
increase 128% from 1750 to almost 4000 tons year−1. In 2004, Cambodia joined the WTO, which was a primary
catalyst for growth, with gross domestic product (GDP) per capita increasing annually by ca. 16% between 2004
and 2008. Besides a minor contraction in 2009 coinciding with the global financial crisis, the GDP per capita
Scientific Reports | (2021) 11:3897 | https://doi.org/10.1038/s41598-021-83064-9 3
Vol.:(0123456789)www.nature.com/scientificreports/
Figure 3. (top) Total waste disposed of in tons per year in Phnom Penh, between 2004 and 2 01528. Data has
been projected forwards and backwards between 2000 and 2030 (black line), with prediction and confidence
interval at 95%. (bottom) Total Cambodian population from 2000 to 2 01854. Total population is projected
forward from 2019 to 2030, using the years 2013 to 2018 (dashed line).
Scientific Reports | (2021) 11:3897 | https://doi.org/10.1038/s41598-021-83064-9 4
Vol:.(1234567890)www.nature.com/scientificreports/
Plastic type Composition of total plastic waste assumed in this study (%) Policy improvement
PET bottle 8.3 Increased recycling
HDPE 18.2 Increased recycling
Film plastic 0.4 -
Plastic bag 69.1 Plastic bag reduction
Foam plastic 3.9 Ban on foam plastic
Total 99.9
Table 1. Commercial solid waste generation in Phnom Penh31, used in this study to understand how policy
changes may impact total plastic losses into TSB.
has since increased by 6 to 12% annually26. The waste generation rates in this study are strongly correlated with
GDP and population growth, which mirror global trends27.
Throughout the 2010s, the predicted MPW increases continuously except for 2015 (Fig. 3). In 2015, a sig-
nificant slowing in total MPW growth was calculated based on an irregularity in the waste data from Phnom
Penh, which increased by 16.2% between 2013 and 2014, and 0.1% between 2014 and 2 01528. The cause of this
irregularity is unclear but may be related to Phnom Penh’s municipal solid waste management being transferred
to local government authorities in 2015, which faced initial d ifficulties28. The BAU Scenario predicts that waste
continues to grow throughout the 2020s but gradually declines from a 6% annual increase in 2020 to 4% annual
increase by 2030 (BAU, Fig. 2).
From 2021 to 2030, five scenarios are presented to explore how targeted polices could reduce MPW inputs
into TSB (Fig. 2). This decade is crucial as by 2029, the amount of MPW entering TSB since 2021, will have
exceeded the total input between 2000 and 2020. Decades under a BAU Scenario, would rapidly exacerbate the
situation and pose a grim outlook for the future, with potentially more plastics in TSB than fish (by weight) as is
predicted for the world’s oceans. For the world’s oceans, this crossover point is expected at ca. 205029. Although
a direct comparison cannot be made as TSB is an open-system and the total mass of fish has not been estimated,
TSB produces approximately 500,000 tons of fish a nnually24. Whilst the total fish catch has remained stable over
the past decade, this appears to be the ecological threshold for harvest levels, due to continuous evidence of
fishery degradation and possible collapse for some species30. Under a BAU Scenario a cumulative 500,000 tons
of plastic will have been lost into TSB by 2030.
In the scenarios presented, the biggest single decreases of MPW are observed with plastic bag reductions as
plastic bags represent the largest plastic type (Table 1), based on commercial waste data from Phnom P enh31.
However, due to ongoing population growth, plastic usage will inevitably increase. Scenarios (i) and (ii), which
primarily target MPW from plastic bags, cuts cumulative MPW inputs into TSB by 23% and 54%, respectively
(Fig. 4). The latter is significantly more aggressive and leads to major reductions in MPW, but ultimately, the
population trajectory will subsequently increase MPW and highlights the need for more comprehensive measures
targeting other plastics. Major reforms in Cambodia would be required to encourage the population to reduce
plastic bag usage by 90% compared to current levels. Presently, Cambodia has a plastic bag charge, implemented
in April 2018. The Royal Cambodian Government issued Sub-Decree 168 declaring the required thickness of
plastic bags used in the country, and a fee of 400 Riel (US$0.10) for consumers, to be applied to each plastic bag
used in all supermarkets and commercial centres. However, consumers are generally unaware of the country’s
existing regulation on plastic bags, and there is a low rate of compliance from vendors or e nforcement32. In
addition, plastic bags in Cambodia have an array of applications beyond their initial usage in retail situations,
including rain covers, storage-space, plant pots, waste bags and electrical insulation33. Therefore, a significant
shift in consumer mindset would be required.
Scenario (iii) builds upon Scenario (ii) but adds annual incremental recycling improvements that specifically
target bottles and HDPE, thus reducing these potential sources of MPW (Table 1). These 20% annual improve-
ments make a noticeable difference to plastic waste (Fig. 4). Following the plastic bag policy implementation in
2022, bags immediately reduce their relative abundance from 69 to 36% of the total, whilst mixed recyclables
increase from 27 to 55%. This remains stable until 2025 and the recycling improvement implementation (Fig. 4).
Such incremental changes in recycling rates seen in this scenario allow policies, infrastructure, and consumer
behaviour to adapt and improve over time, bringing compounding improvements in future years. Whilst the
policies to reduce plastic bags are effective at reducing the most abundant plastics, this source of plastic increases
towards 2030 as the population grows. This highlights the issue of increasing population and the associated
resource demands which are required. Scenario (iii) cuts cumulative MPW inputs into TSB by 63%.
Scenario (iv) results in the second highest MPW input into TSB (after BAU), with just a 17% reduction
between 2021 and 2030 (Fig. 4). Scenario (iv) appears to be one of the least successful scenarios, however, the
cumulative improvements to TWC would result in some of the fastest and most pronounced changes in the
2030s, if improvements were sustained. Under the BAU Scenario, the TWC averages 69%, which is akin to
the average estimated collection rate in East Asia and Pacific (71%). By 2030, the average collection rate under
Scenario (iv) sits at 78%, which would exceed the average estimate for urban areas in East Asia and Pacific27.
This scenario shows that increasing collection coverage is a crucial tool in reducing MPW in TSB. However, in
the short term, increasing collection coverage cannot bring about dramatic changes, unless more ambitious and
immediate annual targets are met. One advantage to this strategy is that the only requirement is a compliance
to waste collection services and does not require major changes to consumer habits.
Scientific Reports | (2021) 11:3897 | https://doi.org/10.1038/s41598-021-83064-9 5
Vol.:(0123456789)www.nature.com/scientificreports/
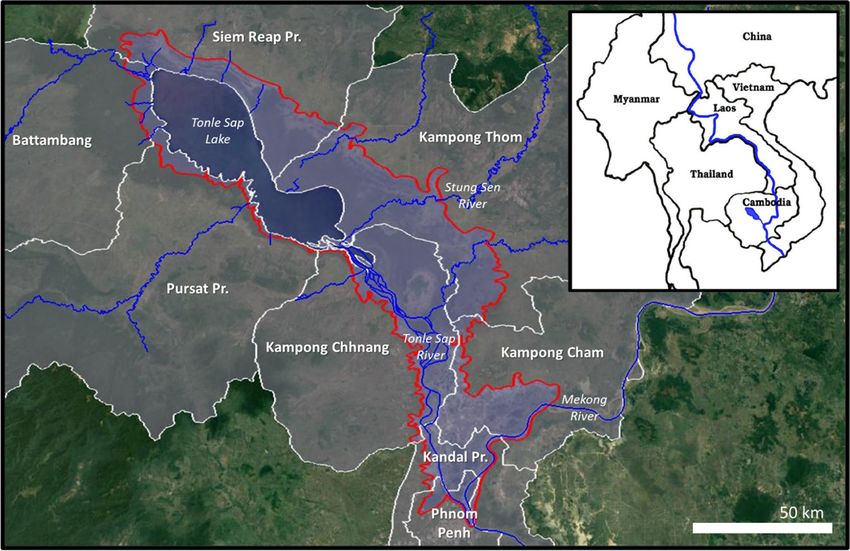
Figure 4. Analysis of Scenarios (i) to (v) and the impact that policy improvements have on individual
components of the estimated MPW, which are: mixed recyclables (PET bottle, HDPE), bags and others (foam,
film). Total annual change in MPW (tons) shown by bars and relative change (%) shown by lines. Note Scenario
(v) *waste collection is 80% for all provinces in 2025, except for the floating communities with 50%.
Scenario (v) presents the most stringent policy implementation that targets all major sources of MPW through
immediate reductions and incremental improvements to recycling, whilst setting a universal standard for waste
collection coverage that is incrementally improved. Scenario (v) would be the most challenging to implement,
navigating the benefits that plastic provide in public hygiene, productivity, and economics, whilst not further
endangering the health of TSB and the surrounding environment. However, Scenario (v) would cause a remark-
able improvement to annual MPW losses into TSB. By 2030, the amount of MPW would have a downwards
trajectory, with the annual input reaching parity to the annual input in 2000 (Fig. 2). Scenario (v) cuts cumulative
MPW inputs into TSB by 76%. It is unlikely that loss of plastic waste could ever be fully eliminated based on
the steps outlined in these scenarios. Although, if losses could be reduced to around 5% each year, this would
be a remarkable result and would reach parity with Europe and the U S29. Based on a BAU Scenario, the total
amount of plastic waste generated within the study area, assuming plastic represents 15.5% of total waste, would
be approximately 243,000 tons in 2030. This would mean that both Scenario (iii) and (v) would be well within
this 5% threshold. By 2030, Scenario (v) would prevent more than 99% of the plastic waste generated annually
from entering TSB. Nevertheless, over 65,000 tons of MPW would still enter TSB between 2021 and 2030 under
Scenario (v). This amount cannot be avoided unless policy changes were implemented more rapidly or to higher
standard of regulation.
Scientific Reports | (2021) 11:3897 | https://doi.org/10.1038/s41598-021-83064-9 6
Vol:.(1234567890)www.nature.com/scientificreports/
As MPW is typically not determined in most waste studies, we compare the WGR changes in TSB with those
from other regions. World Bank per capita waste generation rate estimates for East Asia and the Pacific region
published in 201234, ranged from 0.4 to 4.3 kg capita−1 day−1, which are considerably higher than our estimated
value between 0.5 and 0.6 kg capita−1 day−1 for TSB in 2012. Subsequent World Bank estimates published in
201827, decrease their Cambodian estimated WGR values to 0.2 kg c apita−1 day−1 in 2016, increasing to 0.25 kg
capita−1 day−1 in 2030. Conversely, recent United Nations Environment Programme (UNEP) estimates suggest an
average between 1.1 – 1.2 kg c apita−1 day−1 for East Asia and Pacific from the mid-2020s35. In our study, we pre-
dict values of 0.77 kg capita−1 day−1 (2016), increasing to 0.94 kg capita−1 day−1 (2020) and 1.36 kg capita−1 day−1
(2030). Our estimates are comparable to the UNEP35 analyses but differ substantially from the World Bank’s
estimates27,34. This disparity indicates the fragmented, inconsistent, and contradictory waste estimates in the
public domain over the past decades, making such a comparison between studies problematic.
Our approach is analogous to the framework developed by Jambeck et al.36 (J15 hereon), but several impor-
tant differences exist. In both studies, proportional increases in MPW have been calculated across relevant
timeframes. J15 used population projections for 2015, 2020 and 2025, and calculated annual growth in plastic
percentage of the waste stream, whilst keeping the waste generation rates per capita and inadequately managed
waste percentages constant. Plastic was calculated through a conservative linear increase of 0.19% per year
(SE = 0.06%). We adopted a different approach to calculate MPW focusing on a variable waste generation rate
per capita by province, with constant values for plastic percentage and TWC. The fixed values for plastic per-
centage (between Low, Middle, and High) is more appropriate for TSB, given the vastly different spatial scales
of the two studies and how the plastic percentage in the waste stream varies significantly geographically from
reported figures in Cambodia37. We use a higher plastic percentage in the waste stream compared to J15. When
comparing the MPW generated, J15 calculate a value of 21.3 kg capita−1 year−1 for the coastal zone of Cambodia
in 2010, whereas we use a value of 8.2 kg c apita−1 year−1.
We use a tiered approach in determining conversion rates, emphasizing the decreasing likelihood of plastic
entering the aquatic system as distance increases from the annual flood extent, instead of providing a fixed
high, medium, and low rate for the entire study area. A criticism of both studies is that the quantitative spatial/
distance relationship for conversion rates has not yet been universally established. We have taken a more con-
servative approach by extending the sphere of influence an additional 5 km from the flood boundary compared
to the 50 km used by J15. The boundary delineating the flooded area in our study does not typically exceed the
permanent lake by > 20 km. Using J15′s conversion rates would yield between 5800 (15%) and 15,500 (40%)
tons of plastic in TSB in 2018 (within 5 km of the flood boundary). To obtain the value of 18,655 tons per year
in 2018 (middle-value) in our study, this would equal a conversion rate of 48%, meaning half of MPW produced
annually enters TSB.
Two recent global-scale catchment-to-ocean models both used MPW as a key component to estimate macro-
to micro- plastic fluxes in rivers18,19. Schmidt et al.19 (S17 hereon) estimate that the MR transports between 6300
and 37,000 tons of plastic to the ocean annually, of which, only 3300 tons are macroplastics. Similarly, S17 esti-
mate that ca. 1,931,000 tons of MPW are generated annually in the MR catchment, meaning that less than 0.2%
of the total MPW produced in the MR catchment enters the global oceans. Lebreton et al.18 (L17 hereon) estimate
that the MR transports 22,800 tons of plastic annually, of which between 3900 and 7500 tons are estimated to
be macroplastics. Our 2018 estimate of 18,655 tons (middle-value) entering only TSB suggests that both S17′s
and L17′s estimates are too low. Due to the substantial amounts of MPW being generated in the Lower Mekong
catchment, large flood system and lack of any anthropogenic or natural barriers to the South China Sea (SCS),
the estimates from L17 and S17 should be treated with scepticism. However, neither study intended to scrutinise
and detail individual watersheds.
The current loss of plastic into TSB poses several local and regional challenges. Firstly, the economic problem
that plastic presents to Cambodia. To clean-up a large and complex system such as TSB would be non-viable,
requiring immense resources which Cambodia would struggle to complete without international financial and
technical assistance12. Under this assumption, the ca. 221,700 tons of plastic which has already entered TSB will
remain, or, will be gradually removed through the annual flooding and emptying of the lake. In the coming years,
however, a lucrative opportunity could be cultivated by preventing plastic from entering TSB. Using the prices
of recycled plastic in the EU as a benchmark, which fluctuated between 230 and 370 €/ton from 2004 to 2 01838,
would mean Cambodia was currently losing €4,300,000 to €6,900,000 per year into TSB. Under a BAU Scenario
of 282,300 ± 8700 tons of plastic lost between 2021 and 2030, this would equate to €65,000,000 to €104,000,000
worth of plastic. Nevertheless, plastic pollution is not just a loss of material value. Recently, the true cost of
marine plastic was placed at between US$3,300 and US$33,000 per ton of plastic every year, with quantifiable
costs to fisheries, aquaculture, recreation, heritage and health of e cosystems39. While this cost was placed on
marine plastic, many similar interactions will still be occurring in a large freshwater system like TSB, including
entanglements, ingestion, and transport of pollutants, affecting all trophic levels. Excluding the loss in material
value, the cumulative costs in natural capital between 2021 and 2030 would be US$4.8 billion using the lower-
end estimate. Owing to the transboundary nature of TSB and the MR, the financial liability of plastics entering
Vietnam, and ultimately the SCS, may need to be considered in the future.
Unsurprisingly, plastic is not the single pressure that TSB is currently facing. Like many other large lake
systems around the world, TSL is under severe threat from several compounding factors12,13,40. Aside from
climate change and the challenges of dam building on the MR, issues such as population growth, increasing
land-use intensity, and the general mismanagement of terrestrial and aquatic resources need to be addressed
immediately20,41. Recent deforestation rates in the unique flooded-forest ecosystem around TSL are thought to be
some of the highest, g lobally42,43. A burgeoning population has increased pollution from various sources includ-
ing household sewage and agricultural run-off, which includes sediment, pesticides, and f ertilisers20,44. Years of
overfishing has led to a decline in slower-growing, higher-trophic species, whilst smaller-bodied, faster-growing,
Scientific Reports | (2021) 11:3897 | https://doi.org/10.1038/s41598-021-83064-9 7
Vol.:(0123456789)www.nature.com/scientificreports/
low-trophic fish have increased30,42. Plastic pollution is a relatively novel pollutant to TSB, yet it is aiding the
degradation of this aquatic system with other recent and longer-term stressors. In singular terms each threat
may be managed accordingly, although together, they show disturbing evidence of collective harm, acceleration
of pollution and a legacy of ecological and economic costs for future g enerations12.
Methods
Data sources. As TSB undergoes profound spatial and temporal changes during the flood-pulse cycle we
digitised a conservative boundary using a 30 × 30 m pixel resolution, estimated flood extent raster dataset, which
covered the period from April 2013 to December 2015 in the Lower Mekong Basin45. The maximum extent of the
lake during this period (i.e. 2013 to 2015) reached an estimated 14,795 k m2 during the flood of 2013, however,
this was a relatively exceptional year as the average estimated flood extent was 12,001 km2 between 2000 and
201446,47. The total flood extent used in this study, following a conservative approach when digitising the April
2013 to December 2015 estimated flood extent, was 10,392 km2—i.e. 13% smaller than the estimated average
between 2000 and 2014 (Fig. 1). This was due to omitting major TSL tributaries such as the Stung Sen in the
boundary, which expand significantly during the wet season48.
We have assumed that the boundary delineating the flooded area is representative for the time period exam-
ined between 2000 and 2030, although the maximum lake extent naturally fluctuates interannually. Between 2000
and 2014, the estimated maximum flood extent oscillated between 8492 km2 in 2003 and 16,508 km2 in 2011. The
flood extent used in this study would be the 11th largest (out of 15) between 2000 and 2 01546. The flooded area
intersects 8 provinces (Battambang, Kampong Cham, Kampong Chhnang, Kandal Province, Kampong Thom,
Phnom Penh, Pursat Province and Siem Reap Province; Fig. 1). To create the flood boundary, we include all
overland-flow north of the MR as this mass of water is typically included in water balance assessments of TSL22.
The provincial waste production data, which includes the waste generation rate per capita (0.03 to
1.38 kg day−1), and the amount of waste collected (%) for 2015 at the provincial level, comes from a recent
government report49. The average waste generation rate was independently validated by Creaser et al.50 who
estimated that Cambodian rural areas produced 0.4 to 1 kg day−1 per capita. Data for Kampong Cham and the
Floating communities was not available, therefore data from Phenom Penh and Pursat Province substituted,
respectively. For the Floating communities we used a Total Waste Collection (TWC; %) percentage of 0. We
assume that collected waste is not mismanaged and does not enter TSB.
We examine a range of values for the percentage of plastic in the waste stream, a high-value of 19.32% based
on the commercial waste generation in Phnom Penh51, a middle-value of 15.5% based on municipal solid waste
management data in Phnom P enh28, and a low value of 10% from a Cambodia-wide estimate of municipal solid
waste management34. We assume that the middle-value to be the likely average for TSB, based on the predomi-
nantly urban/semi-urban population.
We obtained an estimate of Cambodia’s population and population density from Facebook Connectivity Lab
(FCL) and Center for International Earth Science Information Network Columbia University (CIESIN)52. The
dataset estimates human population distribution at a resolution of 1 arc-second (approximately 30 m), providing
highly accurate estimates of population and density in 2018. Provincial boundaries were obtained from United
Nations Office for the Coordination of Humanitarian Affairs Regional Office Asia and P acific53. The provincial
boundaries exclude the lake, where many floating communities exist. We added 7236 people living in floating
communities based on the FCL and CIESIN d ata52. Using ArcGIS Pro, the population data in GeoTIFF format
was firstly converted to points, then clipped to the outline of the flooded area. Subsequently, the population of
the flooded area was clipped to provincial level, to establish the total population for each province in the flooded
area. Additional buffer zones of 1, 2, 3 and 5 km were created around the total extent of the flooded area, and the
total population for these zones was established. The Summary Statistics function in ArcGIS was used to extract
the population of each province and within each buffer zone.
Numerical model creation. Using the definition by J15, MPW is defined as plastic material that is either
littered or inadequately disposed. In this study we assume no littering as there is a blurred line between littering
and disposing of domestic solid waste in Cambodia. Instead, we base the amount of MPW on the TWC percent-
age at provincial level (Table 2). We have estimated the amount of MPW that is produced on a per-capita basis
in each province and multiplied this by the amount of people living both within the province and in the annual
flood extent (Table 2).
The annual Mismanaged Plastic Waste Generation rate for each province (Annual MPWGRProv) in kg capita−1
is calculated using:
Annual MPWGRProv = ((WGR ∗ 365) ∗ P) ∗ (1 − TWC), (1)
where WGR is the Waste Generation Rate per capita in the province, P is Plastic (%) in waste stream (constant
values between middle, high, and low) and TWC is the Total Waste Collected in each province.
From Eq. (1), we then calculate the total annual Mismanaged Plastic Waste (Annual MPWTot ) in kg produced
in each province:
Annual MPWTot = PopProv ∗ Annual MPWGRProv , (2)
where PopProv is the provincial population within the annual flood extent.
The average annual Mismanaged Plastic Waste Generation Rate (Annual MPWGRAvg ) in kg c apita−1 for the
total flooded area in all provinces, is calculated using the following equation:
Scientific Reports | (2021) 11:3897 | https://doi.org/10.1038/s41598-021-83064-9 8
Vol:.(1234567890)www.nature.com/scientificreports/
Plastic (%)
Middle (15.5) High (19.32) Low (10)
WGR
Flooded capita−1 day−1 MPWGRProv MPWGRProv MPWGRProv
Province Population (kg) TWC (%) (kg) MPWTot (tons) (kg) MPWTot (tons) (kg) MPWTot (tons)
Battambang 4311 0.63 86 5.07 22 6.32 27 3.27 14
Kampong Cham 130,085 1 83 9.43 1227 11.76 1529 6.08 792
Kampong
124,730 0.4 62 8.66 1080 10.79 1346 5.58 697
Chhnang
Kandal Province 146,340 0.83 54 21.54 3152 26.85 3929 13.90 2034
Kampong Phom 35,495 1 52 27.27 968 33.99 1206 17.59 624
Phnom Penh 161,931 1 83 9.43 1527 11.76 1904 6.08 985
Pursat Province 5356 0.03 72 0.47 3 0.59 3 0.30 2
Siem Reap
48,170 1.38 61 30.78 1483 38.36 1848 19.86 956
Province
Floating com-
7236 0.03 0 1.70 12 2.12 15 1.10 8
munities
Total 663,656 9473 11,807 6112
Table 2. Annual mismanaged plastic waste generation rate (AnnualMPWGR Prov ) per capita and total
mismanaged plastic waste AnnualMPWTot in 2018 within the flood boundary.
Conversion Rate Buffer Population Middle (15.5%) High (19.32%) Low (10%)
100 0 km buffer 663,656 9473 11,807 6112
60 1 km buffer 435,941 3734 4654 2409
40 2 km buffer 383,365 2189 2728 1412
25 3 km buffer 425,264 1518 1892 979
15 5 km buffer 813,655 1742 2171 1124
Total 2,721,880 18,655 23,252 12,035
Table 3. Total estimated plastic input into Tonle Sap Basin in 2018.
Total Annual MPWTot
Annual MPWGRAvg = (3)
Total Flooded Population
In this study we have used conversion rates to estimate the amount of MPW which successfully enters TSB at
the maximum flood extent (Fig. 1). A tiered approach is taken, with the sphere of influence extending an addi-
tional 5 km outwards from the annual flood extent boundary. Using buffers of 1, 2, 3 and 5 km, the total unique
population was calculated for each individual buffer (Table 3). Adapting Eq. (2), the total MPW was determined
for each buffer, using the total population of the buffer and the Annual MPWGRAvg . The total MPW for each
buffer was then multiplied with the conversion rate for that buffer. Here, we have assumed that the likelihood of
MPW being captured by floodwaters decreases in distance away from the lake. Beyond 5 km, we have assumed
that MPW will not be captured. We assumed that MPW within the flooded area would achieve a 100% conver-
sion rate. The conversion rates for 1 (60%), 2 (40%), 3 (25%) and 5 (15%) km from the lake were based on the
figures used in J15. Unlike J15, we extend the sphere of influence 5 km from the shoreline around TSB and have
a tiered conversion rate that more accurately depicts the local physiography and demography.
Population and (plastic) waste projections. To provide a cumulative estimate of mismanaged plastic
waste entering TSB and how policy interventions could subsequently reduce these estimates, a 30-year numeri-
cal model was created for the area within the annual flood extent. From 2018, the population and MPW were
projected forwards to 2030 and backwards to 2000. Anecdotally, plastic products have probably been in Cambo-
dia since ca. 1994 CE following the end to hostilities with the Khmer Rouge32. However, the starting year of 2000
was chosen as Cambodia joined the Association of Southeast Asian Nations (ASEAN) in 1999, which marked
the major transition of the country opening its borders to foreign goods and investment. We assume that this is
the start of when plastic goods became widespread in the country, and particularly after 2004, when Cambodia
joined the World Trade Organization (WTO).
We determined provincial and buffer zone populations to 2030 using national population growth trends
between 2000 to 201854 and assumed a linear, annual increase to 2030 (Fig. 3). Figures for both the total popula-
tion and the percentage population growth rate in Cambodia, were obtained from World Bank estimates. The
calculated projected annual population percentage growth rate decreases from 1.46 in 2019 to 1.10 in 2030
(R2 = 0.98).
Scientific Reports | (2021) 11:3897 | https://doi.org/10.1038/s41598-021-83064-9 9
Vol.:(0123456789)www.nature.com/scientificreports/
Long-term, accurate and publicly available waste data in Cambodia is sparse, except for several major cities.
Here, data were obtained for the total annual municipal solid waste collected in Phnom Penh and disposed of at
a municipal dump site, between 2004 and 2015 in tons year−128. The data, which showed sustained annual growth
in total waste, were assumed to be representative of the population living across all provinces in the annual flood
extent. The actual and calculated annual percentage waste increase were used to project forwards and backwards
the WGR (Eq. 1). The total waste collected and disposed of in Phnom Penh in 2004 CE was 228,000 tons y ear−1,
rising to 618,000 tons y ear−1 in 2015, representing an increase of 171%, or, approximately 14% per y ear28. Spoann
et al.28 estimated that ca. 20% of the total waste generated in Phenom Penh was not collected, which is similar
to the figure of 83% TWC used in this study for Phnom Penh (Table 2). Total waste in Phnom Penh was linearly
projected forwards from 2016 to 2030 and backwards from 2003 to 2000 ( R2 = 0.97; Fig. 3). With the projected
total annual amount of municipal solid waste collected in Phnom Penh, we then calculated the percentage annual
growth rate for each year.
The plastic waste for each province and year were projected forwards and backwards from 2018, calculating
the Annual MPWGRProv with P and TWC constant from 2000 to 2030 (Eq. 1), the Annual MPWTot (Eq. 2) and
the Annual MPWGRAvg across the annual flood extent (Eq. 3). The Annual MPWGRAvg for all provinces was
multiplied by the total population in each buffer zone (0, 1, 2, 3 and 5 km) for each year, and the respective con-
version rates (100%, 60%, 40%, 25% and 15%) for each buffer zone was then applied. The summed totals equate
to the total MPW estimated to enter TSB for each year from 2000 to 2030.
Targeted policy scenarios. The scenarios presented in this study explore what impact policies would have
on projected MPW, from 2021 to 2030. Two broad approaches were explored, the first was a reduction in cer-
tain plastic types becoming waste. The second was improvement in collection coverage across the annual flood
extent. For the former approach, data from commercial solid waste generation in Phnom Penh31, which detailed
the weight of plastic generated by type, was applied to the total MPW values projected for each year (from 2021
to 2030), province and buffer zone (Table 1). From this, policy improvements were proposed which included
plastic bag reductions, a ban on foam plastic and increased recycling rates (which was applied to PET Bottle and
HDPE plastic types only, i.e. mixed recyclables). For the second approach, incremental annual improvements to
TWC (%) was applied to each province.
Purposely, we do not propose how these scenarios could be implemented but assume a positive outcome
of policies to reduce certain plastic types in the waste stream or improve waste collection. Successful policies
typically use market-based instruments (MBIs) to reach a desired outcome. MBIs may include taxes, charges,
fees, fines, and penalties, under the premise that either the polluter and/or user pays, and provides a full cost
for recovery of the item55. The scenarios have been developed to be representative of model case-studies in
reducing plastic waste around the world. Such successes include; reductions of plastic bag usage between 50 and
90% within a y ear56–58, plastic bottle recycling rates which have achieved rates of > 90%29,59 and a pilot study in
Cambodia, extending waste coverage to a rural community which achieved a swift compliance rate of > 90%37.
The scenarios we model are:
(i) Plastic bag reduction of 50% from 2025*
(ii) Plastic bag reduction of 75% between 2022*/90% from 2026*
(iii) Plastic bag reduction of 75% between 2022 to 2025*/90% from 2026*/Recycling increase (20% pa from
2025)
(iv) From 2022 a + 1% annual increase in waste collection to 2030
(v) Plastic bag reduction of 75% from 2022*/90% from 2026*/Recycling increase (20% pa from 2022)/Foam
plastic eliminated from 2025/From 2025 at least 80% collection coverage (+ 1% annual improvement there-
after) and 50% coverage in floating communities
*reduction calculated from pre-intervention period.
Received: 7 September 2020; Accepted: 27 January 2021
References
1. Jahnke, A. et al. Reducing uncertainty and confronting ignorance about the possible impacts of weathering plastic in the marine
environment. Environ. Sci. Technol. Lett. 4, 85–90 (2017).
2. Geyer, R., Jambeck, J. R. & Law, K. L. Production, use, and fate of all plastics ever made. Sci. Adv. 3, 19–24 (2017).
3. Zalasiewicz, J. et al. The geological cycle of plastics and their use as a stratigraphic indicator of the Anthropocene. Anthropocene
13, 4–17 (2016).
4. Thompson, R. C., Swan, S. H., Moore, C. J. & Vom Saal, F. S. Our plastic age. Philos. Trans. R. Soc. B Biol. Sci. 364, 1973–1976
(2009).
5. Nash, K. L. et al. Planetary boundaries for a blue planet. Nat. Ecol. Evol. https://doi.org/10.1038/s41559-017-0319-z (2017).
6. Villarrubia-Gómez, P., Cornell, S. E. & Fabres, J. Marine plastic pollution as a planetary boundary threat: The drifting piece in the
sustainability puzzle. Mar. Policy 96, 213–220 (2018).
7. Rockström, J. et al. A safe operating space for humanity. Nature https://doi.org/10.1038/461472a (2009).
8. Gallowaya, T. S. & Lewisa, C. N. Marine microplastics spell big problems for future generations. Proc. Natl. Acad. Sci. U.S.A. https
://doi.org/10.1073/pnas.1600715113 (2016).
9. Lau, W. W. Y. et al. Evaluating scenarios toward zero plastic pollution. Science 21, eaba475 (2020).
10. Blettler, M. C. M., Abrial, E., Khan, F. R., Sivri, N. & Espinola, L. A. Freshwater plastic pollution: Recognizing research biases and
identifying knowledge gaps. Water Res. 143, 416–424 (2018).
Scientific Reports | (2021) 11:3897 | https://doi.org/10.1038/s41598-021-83064-9 10
Vol:.(1234567890)www.nature.com/scientificreports/
11. Van Vliet, M. T. H., Florke, M. & Wada, Y. Quality matters for water scarcity. Nat. Geosci. https://doi.org/10.1038/NGEO3047
(2017).
12. Jenny, J.-P. et al. Scientists’ Warning to Humanity: rapid degradation of the world’s large lakes. J. Great Lakes Res. https://doi.
org/10.1016/j.jglr.2020.05.006 (2020).
13. Varis, O., Taka, M. & Kummu, M. The Planet’s Stressed River Basins: Too Much Pressure or Too Little Adaptive Capacity? Earth’s
Futur. 7, 1118–1135 (2019).
14. Cordova, M. R. & Nurhati, I. S. Major sources and monthly variations in the release of land-derived marine debris from the Greater
Jakarta area Indonesia. Sci. Rep. 9, 1–8 (2019).
15. Lahens, L. et al. Macroplastic and microplastic contamination assessment of a tropical river (Saigon River, Vietnam) transversed
by a developing megacity. Environ. Pollut. 236, 661–671 (2018).
16. van Emmerik, T., Strady, E., Kieu-Le, T. C., Nguyen, L. & Gratiot, N. Seasonality of riverine macroplastic transport. Sci. Rep. 9,
1–9 (2019).
17. Kasamesiri, P. & Thaimuangpho, W. Microplastics ingestion by freshwater fish in the Chi River Thailand. Int. J. GEOMATE 18,
114–119 (2020).
18. Lebreton, L. C. M. et al. River plastic emissions to the world’s oceans. Nat. Commun. 8, 1–10 (2017).
19. Schmidt, C., Krauth, T. & Wagner, S. Export of Plastic Debris by Rivers into the Sea. Environ. Sci. Technol. 51, 12246–12253 (2017).
20. Campbell, I. C., Say, S. & Beardall, J. Tonle Sap Lake, the Heart of the Lower Mekong. The Mekong 251–272 (2009) https://doi.
org/10.1016/B978-0-12-374026-7.00010-3.
21. Carling, P. A. Geomorphology and Sedimentology of the Lower Mekong River. The Mekong (Elsevier Inc., Amsterdam, 2009). https
://doi.org/10.1016/B978-0-12-374026-7.00005-X.
22. Kummu, M. et al. Water balance analysis for the Tonle Sap Lake-floodplain system. Hydrol. Process. 28, 1722–1733 (2014).
23. Siev, S., Paringit, E. C., Yoshimura, C. & Hul, S. Seasonal changes in the inundation area and water volume of the Tonle Sap River
and its floodplain. Hydrology 3, 33 (2016).
24. Ishikawa, S., Hori, M. & Kurokura, H. A strategy for fisheries resources management in Southeast Asia: a case study of an Inland
fishery around Tonle Sap Lake in Cambodia. Aqua-BioScience Monogr. 10, 23–40 (2017).
25. Rab, M. A., Navy, H., Ahmed, M., KeAng, S. & Viner, K. Socioeconomics and values of resources in Great Lake-Tonle Sap and
Mekong-Bassac area: results from a sample survey in Kampong Chhnang, Siem Reap and Kandal Provinces, Cambodia. WorldFish
Cent. Discuss. Ser. iv + 98 pp. (2006).
26. The World Bank. GDP per capita (current US$) - Cambodia. https://data.worldbank.org/indicator/NY.GDP.PCAP.CD?locat
ions=KH (2020).
27. Kaza, S., Yao, L., Bhada-Tata, P. & Van Woerden, F. What a Waste 2.0: A Global Snapshot of Solid Waste Management to 2050. (2018).
28. Spoann, V., Fujiwara, T., Seng, B. & Lay, C. Municipal solid waste management: Constraints and opportunities to improve capacity
of local government authorities of Phnom Penh Capital. Waste Manag. Res. 36, 985–992 (2018).
29. World Economic Forum. Ellen MacArthur Foundation & McKinsey & Company Rethinking the Future of Plastics (World Economic
Forum, The New Plastics Economy, 2016).
30. Ngor, P. B. et al. Evidence of indiscriminate fishing effects in one of the world’s largest inland fisheries. Sci. Rep. 8, 1–12 (2018).
31. Yim, M., Takeshi, F. & Sour, S. Current status of commercial solid waste generation, composition and management in Phnom Penh
city Cambodia. Environ. Waste Manag. 4, 31–38 (2014).
32. UNDP Cambodia. Combating Plastic Bag use in Cambodia. 1–13 http://anyflip.com/hralr/mfuf/basic (2019).
33. QUICKSAND. Cambodia’s Plastic Bag Ecosystem and Usage. http://quicksand.co.in/media/publications/Excess-Baggage_Resea
rch-Summar y.pdf (2015).
34. Hoornweg, D. & Bhada-Tata, P. What a Waste : A Global Review of Solid Waste Management. Urban development series; knowledge
papers no. 15. (2012).
35. United Nations Environment Programme. Asia Waste Management Outlook. (2017).
36. Jambeck, J. R. et al. Plastic waste inputs from land into the ocean. Science 347, 768–771 (2015).
37. Sethy, S., Sothun, C. & Wildblood, R. Municipal Solid Waste Management in Cambodia. in Municipal Solid Waste Management
in Asia and the Pacific Islands, 77–94 (2014). https://doi.org/10.1007/978-981-4451-73-4_5.
38. Eurostat. Recycling – secondary material price indicator. https://ec.europa.eu/eurostat/statistics-explained/index.php?title=Recyc
ling_–_secondary_material_price_indicator#Price_and_trade_volumes (2018).
39. Beaumont, N. J. et al. Global ecological, social and economic impacts of marine plastic. Mar. Pollut. Bull. 142, 189–195 (2019).
40. Munia, H. A. et al. Future transboundary water stress and its drivers under climate change: a global study. Earth’s Futur. https://
doi.org/10.1029/2019EF001321 (2020).
41. Campbell, I. C., Poole, C., Giesen, W. & Valbo-Jorgensen, J. Species diversity and ecology of Tonle Sap Great Lake Cambodia.
Aquat. Sci. 68, 355–373 (2006).
42. Arias, M. E., Holtgrieve, G. W., Ngor, P. B., Dang, T. D. & Piman, T. Maintaining perspective of ongoing environmental change in
the Mekong floodplains. Curr. Opin. Environ. Sustain. 37, 1–7 (2019).
43. Hansen, M. C. et al. High-Resolution Global Maps of 21st-Century Forest Cover Change. Science. 342, 850–853 (2013).
44. Ty, S. et al. Spatio-Temporal Variability of Water Quality in a Large Shallow lake In Southeast Asia: Tonle Sap Lake, Cambodia. in
17th World Lake Conference 2–4 (2018).
45. SERVIR Mekong. Estimated Dry and Wet Season Surface Water Distribution. https://servir.adpc.net/geospatial-datasets/estim
ated-dry-and-wet-season-surface-water-distribution (2016).
46. Ji, X., Li, Y., Luo, X. & He, D. Changes in the lake area of Tonle Sap: Possible linkage to runoff alterations in the Lancang River?
Remote Sens. 10, 866 (2018).
47. Kim, S., Sohn, H. G., Kim, M. K. & Lee, H. Analysis of the relationship among flood severity, precipitation, and deforestation in
the Tonle Sap Lake Area, Cambodia Using Multi-Sensor approach. KSCE J. Civ. Eng. 23, 1330–1340 (2019).
48. Le, H. A. et al. An implicit wetting–drying algorithm for the discontinuous Galerkin method: application to the Tonle Sap Mekong
River Basin. Environ. Fluid Mech. https://doi.org/10.1007/s10652-019-09732-7 (2020).
49. Cambodian Ministry of Environment. Report on Environmental State, Third publication in Khmer. (2019).
50. Creaser, E., Smith, J. & Thomson, A. Perspectives of solid waste management in rural Cambodia. J. Humanit. Eng. https://doi.
org/10.36479/jhe.v6i2.125 (2019).
51. Mongtoeun, Y., Fujiwara, T. & Sethy, S. A study of commercial solid waste generation and composition in Phnom Penh City
Cambodia. J. Nat. Sci. Res. 4, 49–54 (2014).
52. Facebook Connectivity Lab (FCL) & Center for International Earth Science Information Network Columbia University (CIESIN).
Cambodia: High Resolution Population Density Maps + Demographic Estimates. Population KHM 2018–10–01. https://data.
humdata.org/dataset/cambodia-high-resolution-population-density-maps-demographic-estimates (2018).
53. United Nations Office for the Coordination of Humanitarian Affairs Regional Office Asia and Pacific. Cambodia administrative
level 0–3 boundaries. Cambodia administrative level 1 (province/khaet and capital/reach thani) boundary polygon shapefile. https
://data.humdata.org/dataset/cambodia-admin-level-0-international-boundaries (2014).
54. The World Bank. Population, total - Cambodia. https://data.worldbank.org/indicator/SP.POP.TOTL?locations=KH (2020).
55. Ten Brink, P. et al. Guidelines on the Use of Market-based Instruments to Address the Problem of Marine Litter. Institute for European
Environmental Policy (IEEP) (2009).
Scientific Reports | (2021) 11:3897 | https://doi.org/10.1038/s41598-021-83064-9 11
Vol.:(0123456789)www.nature.com/scientificreports/
56. He, H. Effects of environmental policy on consumption: lessons from the Chinese plastic bag regulation. Environ. Dev. Econ. 17,
407–431 (2012).
57. Department for Environment Food & Rural Affairs. Single-use plastic carrier bags charge: data in England for 2018 to 2019. https
://www.gov.uk/government/publications/carrier-bag-charge-summar y-of-data-in-england/single-use-plastic-carrier-bags-charg
e-data-in-england-for-2018-to-2019 (2019).
58. Xanthos, D. & Walker, T. R. International policies to reduce plastic marine pollution from single-use plastics (plastic bags and
microbeads): a review. Mar. Pollut. Bull. 118, 17–26 (2017).
59. VERDICT. How plastic bottle deposit schemes work around the world. https: //www.verdic t.co.uk/how-have-plasti c-deposi t-schem
es-worked-around-the-world/ (2018).
60. Grundy-Warr, C. et al. Raw attitudes, wetland cultures, life-cycles: Socio-cultural dynamics relating to Opisthorchis viverrini in
the Mekong Basin. Parasitol. Int. https://doi.org/10.1016/j.parint.2011.06.015 (2012).
Acknowledgements
The authors are grateful for the support from staff and students at Paññāsāstra University of Cambodia (PUC),
particularly Dr Danet Hak and Ms. Lakanna Kounkunn who have helped organise fieldtrips for the wider project
on plastic pollution in Cambodia and have assisted with translating official documents from Khmer to English.
We would also like to thank Dr Bandith Seng, who first sent across the waste data of provinces surrounding Tonle
Sap Lake and River, translated from a Cambodian Ministry of Environment report. We thank three reviewers
for their constructive feedback on earlier versions of this manuscript.
Author contributions
A.F. wrote the main manuscript and C.G. provided statistical expertise which contributed to Figures 2 and 3.
Both A.F. and C.G. reviewed the manuscript prior to submission.
Funding
This work was supported by NUS Research Scholarship awarded to A.F. and a Singapore Ministry of Education
Academic Research Fund Tier 1 grant (R-109-000-248-115) awarded to C.G.
Competing interests
The authors declare no competing interests.
Additional information
Correspondence and requests for materials should be addressed to A.M.D.F.
Reprints and permissions information is available at www.nature.com/reprints.
Publisher’s note Springer Nature remains neutral with regard to jurisdictional claims in published maps and
institutional affiliations.
Open Access This article is licensed under a Creative Commons Attribution 4.0 International
License, which permits use, sharing, adaptation, distribution and reproduction in any medium or
format, as long as you give appropriate credit to the original author(s) and the source, provide a link to the
Creative Commons licence, and indicate if changes were made. The images or other third party material in this
article are included in the article’s Creative Commons licence, unless indicated otherwise in a credit line to the
material. If material is not included in the article’s Creative Commons licence and your intended use is not
permitted by statutory regulation or exceeds the permitted use, you will need to obtain permission directly from
the copyright holder. To view a copy of this licence, visit http://creativecommons.org/licenses/by/4.0/.
© The Author(s) 2021
Scientific Reports | (2021) 11:3897 | https://doi.org/10.1038/s41598-021-83064-9 12
Vol:.(1234567890)You can also read