Global simulations of marine plastic transport show plastic trapping in coastal zones - IOPscience
←
→
Page content transcription
If your browser does not render page correctly, please read the page content below
LETTER • OPEN ACCESS

Global simulations of marine plastic transport show plastic trapping in
coastal zones
To cite this article: Victor Onink et al 2021 Environ. Res. Lett. 16 064053

View the article online for updates and enhancements.

                                This content was downloaded from IP address 46.4.80.155 on 11/07/2021 at 16:43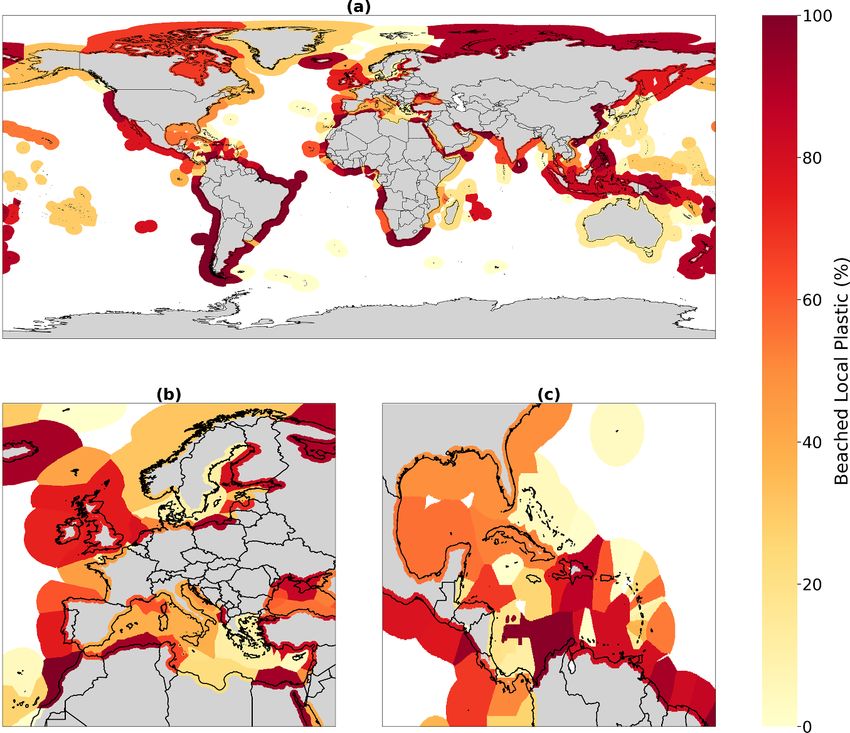
Environ. Res. Lett. 16 (2021) 064053 https://doi.org/10.1088/1748-9326/abecbd
LETTER
Global simulations of marine plastic transport show plastic
OPEN ACCESS
trapping in coastal zones
RECEIVED
6 November 2020 Victor Onink1,2,3,∗, Cleo E Jongedijk4, Matthew J Hoffman5, Erik van Sebille3
REVISED
1 March 2021
and Charlotte Laufkötter1,2
1
ACCEPTED FOR PUBLICATION
Climate and Environmental Physics, Physics Institute, University of Bern, Bern, Switzerland
2
8 March 2021 Oeschger Centre for Climate Change Research, University of Bern, Bern, Switzerland
3
Institute for Marine and Atmospheric Research, Utrecht University, Utrecht, The Netherlands
PUBLISHED 4
2 June 2021 Department of Civil and Environmental Engineering, Imperial College London, London, United Kingdom
5
School of Mathematical Sciences, Rochester Institute of Technology, Rochester, NY, United States of America
∗
Author to whom any correspondence should be addressed.
Original Content from
this work may be used E-mail: victor.onink@climate.unibe.ch
under the terms of the
Creative Commons Keywords: ocean modeling, marine plastic pollution, Lagrangian modeling, global ocean plastic transport, beached marine plastic
Attribution 4.0 licence.
Supplementary material for this article is available online
Any further distribution
of this work must
maintain attribution to
the author(s) and the title
of the work, journal Abstract
citation and DOI.
Global coastlines potentially contain significant amounts of plastic debris, with harmful
implications for marine and coastal ecosystems, fisheries and tourism. However, the global
amount, distribution and origin of plastic debris on beaches and in coastal waters is currently
unknown. Here we analyze beaching and resuspension scenarios using a Lagrangian particle
transport model. Throughout the first 5 years after entering the ocean, the model indicates that at
least 77% of positively buoyant marine plastic debris (PBMPD) released from land-based sources is
either beached or floating in coastal waters, assuming no further plastic removal from beaches or
the ocean surface. The highest concentrations of beached PBMPD are found in Southeast Asia,
caused by high plastic inputs from land and limited offshore transport, although the absolute
concentrations are generally overestimates compared to field measurements. The modeled
distribution on a global scale is only weakly influenced by local variations in resuspension rates due
to coastal geomorphology. Furthermore, there are striking differences regarding the origin of the
beached plastic debris. In some exclusive economic zones (EEZ), such as the Indonesian
Archipelago, plastic originates almost entirely from within the EEZ while in other EEZs,
particularly remote islands, almost all beached plastic debris arrives from remote sources. Our
results highlight coastlines and coastal waters as important reservoirs of marine plastic debris and
limited transport of PBMPD between the coastal zone and the open ocean.
1. Introduction and 2015 were made of neutrally or negatively buoy-
ant polymers [11, 12], yet a significant amount of
Marine plastic debris is found in almost all mar- PBMPD is still unaccounted for. A large fraction of
ine habitats, specifically on coastlines worldwide [1]. this missing PBMPD is potentially distributed on
Coastal ecosystems can be particularly sensitive to coastlines [12–14], with local concentrations varying
plastic pollution [2], and plastic debris on beaches between 0 and 647 kg km−1 [15, 16]. However, given
can reduce the economic value of a beach by up to the scarcity of measurements relative to the length
97% [3]. Furthermore, while an estimated 1.15–12.7 of coastlines, limited insight into local temporal and
million tons of plastic enter the ocean per year [4–6], spatial fluctuations in beached PBMPD concentra-
the amount of positively buoyant marine plastic tions and the lack of a standardized sampling meth-
debris (PBMPD) found floating at the ocean surface odology, it is currently not possible to estimate the
is estimated to be significantly lower [7–10]. Some total amount of beached plastic debris from field
of the plastic entering the ocean likely immediately measurements alone, or to describe the global pattern
sinks, as 34.5% of all plastics produced between 1950 of beached plastic [1].
© 2021 The Author(s). Published by IOP Publishing LtdEnviron. Res. Lett. 16 (2021) 064053 V Onink et al
Using a simple box model, Lebreton et al [12] sug- PBMPD floating at the surface can be exposed to
gest that 66.8% of PBMPD released into the ocean winds, with the strength of this effect depending on
since 1950 is stored on coastlines, however assum- the size of the object that is exposed to winds above
ing a very high beaching probability and a resuspen- the ocean surface [30]. However, for the open ocean,
sion probability below the observed range [17]. More the best model performance for modeling PBMPD is
complex global Lagrangian simulations of PBMPD without including a separate windage term [10]. Fur-
have either not included beaching at all [18, 19] or use thermore, windage and Stokes drift are shown to be
simple best guess implementations without consider- similar on a global scale [18]. Given that we include
ing resuspension [20–22]. Most of these studies have Stokes drift, we therefore do not consider an addi-
focused on plastic debris in the open ocean [9, 18], tional term for windage.
and do not report how global estimates of the amount
and distribution of beached plastic vary with different 2.2. Lagrangian transport
beaching and resuspension parametrizations. We use Parcels [31, 32] to model plastic as virtual
Here we present a series of idealized beaching particles which are advected using surface ocean flow
experiments, using a Lagrangian particle tracking field data. A change in the position ⃗x of a particle is
model with beaching and resuspension parameteriz- calculated according to:
ations. We estimate upper and lower bounds for the
fraction of positively buoyant terrestrial plastic debris ˆ t+∆t
in coastal waters, on beaches and in the open ocean ⃗x(t + ∆t) = ⃗x(t) + ⃗v(⃗x(τ ), τ )dτ
t
within the first years of release into the marine envir- √
onment. Additionally, we describe the global relative 2 dt Kh
+R , (1)
distribution of beached plastic debris, and we analyze r
the relative amount of plastic with local versus remote
origin. where ⃗v(⃗x(t), t) is the surface flow velocity at the
particle location⃗x(t) at time t, R ∈ [−1, 1] is a random
process representing subgrid motion with a mean
2. Methods of zero and variance r = 1/3, dt is the integration
timestep, and K h is the horizontal diffusion coeffi-
2.1. Ocean surface current data cient. The seed value of the random number gener-
For the 2005–2015 global surface currents, we use ator does not influence the amount of beached plastic
the HYCOM + NCODA Global 1/12◦ surface cur- (supplementary figure 3). Equation (1) is integrated
rent reanalysis [23] and the surface Stokes drift estim- with a 4th order Runge–Kutta scheme with an integ-
ates from the WaveWatch III hindcast dataset [24, ration timestep of dt = 10 min, and particle positions
25]. The HYCOM + NCODA Global 1/12◦ reana- are saved every 24 h. We take K h = 10 m2 s−1 [29, 33]
lysis [23] has a temporal resolution of 3 h and a to parameterize sub-grid processes.
equatorial spatial resolution of 1/12◦ (≈9.3 km). The
HYCOM + NCODA Global 1/12◦ reanalysis does not 2.3. Plastic emissions into the ocean
incorporate Stokes drift, which has been shown to We use a terrestrial plastic input estimate based on the
play an important role in shoreward surface transport low end estimates of [4], where 15% of mismanaged
[18]. Therefore, we add surface Stokes drift estim- plastic from the population living within 50 km of
ates from the WaveWatch III hindcast dataset [24, 25], the coast enters the ocean. To obtain high-resolution
which has a temporal resolution of 3 h and a spa- estimates we multiply the country-specific misman-
tial resolution of 1/2◦ . Comparison of Stokes drift aged waste estimates with population densities [34]
estimates from the WaveWatch III dataset with in situ for 2010. This results in estimates of total misman-
measurements from drifters have shown high correl- aged plastic for all cells on the HYCOM grid (supple-
ations [26, 27], where root mean square errors have mentary figure 2). Polypropylene, polyethylene and
been on orders of centimeters per second [26]. Unless polystyrene constitute 54% of primary plastic pro-
otherwise mentioned, simulations discussed in this duction in 2010 [11], and we assume that this frac-
paper have been done with surface currents obtained tion is indicative of how much mismanaged plastic
by the sum of the HYCOM currents and Stokes is initially buoyant. We acknowledge that this 54%
drift, as has been done in earlier modeling studies is a rough estimate, as it assumes that mismanaged
[10, 28, 29]. Not including Stokes drift reduces the plastic inputs have the same composition as global
amount of PBMPD that beaches by 6%–7% (supple- plastic production, whereas it has also been repor-
mentary figure 3 (available online at stacks.iop.org/ ted that heavier polymers can float with sufficient
ERL/16/064053/mmedia)) and reduces the trapping trapped air bubbles [35] and light polymers have been
of PBMPD near the coast (supplementary figure 4). found submerged [36]. This leads to a total buoy-
Stokes drift is thus an important component of the ant plastic input of 2.16 × 10⁶ tons in 2010 (71.70%
ocean circulation to consider in global PBMPD trans- Asia, 4.39% North America, 3.94% South America,
port and beaching modeling. 2.16% Europe, 17.36% Africa and 0.45% Oceania).
2Environ. Res. Lett. 16 (2021) 064053 V Onink et al
The release of the virtual particles is scaled accord- where d is the distance of particle to the nearest
ing to the estimate of buoyant plastic entering the coastal cell, D is a predefined distance to the shore
ocean, where each particle represents up to 5.4 tons within which beaching can occur, dt is the integra-
of buoyant plastic. To save computational resources tion timestep and λB is the characteristic timescale
we neglect sources smaller than 0.06 tons per year per of plastic beaching. Beaching is therefore only pos-
grid cell, which represent 0.007% of the total input. In sible within a beaching zone set by D. To account for
each run particles are released every 31 d during the the fact that global-scale ocean current datasets are
first year of the simulation starting in 2010 (628,236 inaccurate in ocean cells adjacent to land (referred
particles in total) and advected for 5 years. Starting to henceforth as coastal cells), we set D such that all
the simulation in 2005 barely affects the amount of coastal cells are fully contained within the beaching
beached plastic (supplementary figure 3). We refer to zone, resulting in a beaching zone of 10 km.
this input scenario as the Jambeck input. The probability of beaching is set by the beach-
To test the model sensitivity to the plastic input, ing timescale λB , where λB is the number of days
we calculate one simulation using a low end estim- that a particle must spend within the beaching zone
ate of plastic waste entering the ocean from rivers [5]. such that there is a 63.2% chance that the particle has
Again assuming 54% of plastic entering the ocean is beached. There is no experimental study to base the
initially buoyant, we have an input of 6.21 × 10⁵ tons value of λB on, nor how it might vary for different
for 2010 (87.04% Asia, 0.78% North America, 4.58% types of plastic debris, so we selected a range of pos-
South America, 0.13% Europe, 7.45% Africa, 0.02% sibilities to investigate the sensitivity. For the sensitiv-
Oceania). Due to the smaller total input, no sources ity analysis we take λB ∈ [1, 2, 5, 10, 26, 35, 100] days.
were neglected. We refer to this input scenario as the Given the mean current speed in the coastal cells in
Lebreton input. the HYCOM dataset, λB = 1 day is the time a particle
Particles are released in the shore-adjacent ocean would require to travel 10 km in a straight line, rep-
cell nearest to the total mismanaged plastic cell in resenting a lower bound for the beaching probabil-
question. Since it is unlikely that real plastic always ity. In the Mediterranean, analysis of GPS trajector-
enters the ocean at exactly the same location, at ies of drifter buoys suggests λB = 76 days [43], and
the first time step particles are distributed randomly an inverse modeling study suggests λB = 26 d for
throughout the shore-adjacent ocean cell prior to the plastic debris [43]. We consider λB = 100 d to repres-
start of advection by the ocean currents. ent scenarios in which particles have very low beach-
ing probabilities. A wooden drifter experiment in the
2.4. Beaching parametrizations North Sea found 46.88% of drifters beached within
2.4.1. Stochastic beaching and resuspension 91 d, traveling geodesic distances between 452 and
Many processes are hypothesized to influence the 559 km [44]. Given that the drifters crossed the North
amount of beached plastic on coastlines, such wind Sea in this time and therefore spent time outside of
direction and speed, coast angle, aspect and mor- the coastal zone, this suggests that λB is less than
phology, local runoff, the proximity to urban cen- 100 d. However, we acknowledge that the values for
ters and the degree of human usage of the beach λB remain a major source of uncertainty. Further-
[1, 36–42]. Many of these factors have some limited more, unless specifically mentioned we parameter-
predictive power in statistical models that attempt to ize beaching (and also resuspension) rates as global
explain patterns of beached plastic [38, 39]. However, constants.
it is unclear from these studies whether these factors Particle resuspension is also implemented
influence beaching, resuspension or both. They can stochastically, where the resuspension probability
also partially cancel each other out as they might work pR of a beached particle is defined as:
in opposite directions and in general it is unclear how
these factors should be parameterized. We therefore pR = 1 − exp(−dt/λR ), (3)
decided to implement the simplest model possible,
where we assume that on a global average, the main where dt is the time step and λR is the characteristic
drivers of plastic beaching are the surface currents and timescale of plastic resuspension. Hinata et al [17]
the location of plastic input. has experimentally studied the resuspension times-
To account for the uncertainty of the ocean cur- cale of plastic objects with different sizes and found
rent data in land-adjacent ocean cells, we parametrize λR = 69–273 d. For our sensitivity analysis we take
beaching as a stochastic process in the coastal zone, λR ∈ [69, 171, 273] d. When a particle beaches, we
within which we consider the currents unreliable. For save its last floating position, and when a particle
any given time step, we calculate the beaching prob- resuspends it continues its trajectory from this pos-
ability pB as: ition.
{ 2.4.2. Coast-dependent resuspension
if d ⩽ D, pB = 1 − exp(−dt/λB )
pb = (2) There have been a number of studies that have
if d > D, pB = 0, tried to explain the pattern of beached plastic using
3Environ. Res. Lett. 16 (2021) 064053 V Onink et al
statistical models that among others factors take instead reported as the amount of plastic per length of
geomorphology into account [38, 39]. However, it model coastline (kg km−1 ), which is commonly used
is unclear whether plastic beaching, resuspension or for reporting field measurements (see table 1). How-
both are affected by geomorphology, and the influ- ever, due to the coarse resolution of the HYCOM grid,
ence of geomorphology likely differs for different the length of the model coastline is an approximation
types of plastic debris [45]. We are not aware of of the true coastline length for a given cell.
any studies investigating how geomorphology affects
beaching probabilities. However, the dependence of
resuspension probabilities on beach types have been 3. Results
studied with regard to the resuspension of oil [46].
Oil resuspension rates for sandy and rocky shores 3.1. Global beached plastic budget
were found to be 24 and 18 h, respectively, and while A systematic test of the effect of different beaching
these timescales are much shorter than the resuspen- and resuspension probabilities on the global plastic
sion timescales for plastic [17], we use the ratio of the budget is shown in figure 1. In all scenarios, the
timescales of different coast types as a starting point model reaches an equilibrium between the beach-
for a sensitivity analysis. ing and resuspension fluxes after the initial release
For coastal geomorphology, we use data from within less than two years. At the end of our 5 years
Luijendijk et al [47] to determine the relative amount of simulations, between 31% and 95% of PBMPD is
of sandy coastline s of each model cell of the HYCOM beached depending on parameter values. High beach-
grid, where s = 0 indicates a completely not-sandy ing probabilities combined with small resuspension
coastline while s = 1 indicates a completely sandy probabilities lead to a large amount of plastic stored
coastline (supplementary figure 1). Note that ‘not on beaches and vice versa. With the Jambeck input,
sandy’ covers multiple shore geomorphologies, such and assuming 54% of the input is buoyant, this cor-
as rocky shores, cliffs and shorelines covered by veget- responds to 0.72–2.06 × 10⁶ tons of beached PBMPD
ation such as mangrove forests. The resuspension originating from plastic debris released in 2010
timescale is determined by: alone.
{
Rather than being a function of the absolute val-
3:4 Dependence −
→ λR = 69 × (0.75 + 0.25 × s) ues of λB and λR , our model shows that the aver-
λR =
1:4 Dependence −
→ λR = 69 × (0.25 + 0.75 × s), age beached fraction is dependent on the ratio λB /λR
(4) (figure 2(a)). At very low ratios, i.e. high beach-
ing but low resuspension probabilities, up to 99%
where with 3:4 Dependence we use the resuspension of PBMPD is beached in the 5th year of the sim-
timescale coastline dependence for oil [46], whereas ulations. As the ratio increases, the beached frac-
with 1:4 Dependence there a stronger dependence on tion decreases to 31%. However, at least 77% of the
the coastline type to check the sensitivity. In both PBMPD remains within 10 km of the model coast-
cases we use λRT,s = 1 = 69 d. line in all scenarios (figure 2(a)) and only a small
There is currently little knowledge about how fraction escapes to the open ocean. Multiple studies
resuspension timescales vary with the coastline type report decreasing concentrations of floating PBMPD
and the classification of coastlines as sandy and not- with increasing distance from shore, which is com-
sandy is overly simplistic, as coastlines such as rocky monly attributed to PBMPD being removed from
beaches, cliffs and mangroves are now considered the ocean surface over time [35, 48–50]. However,
equivalent. However, to our knowledge there have not such trends could also be partially due to PBMPD
been any studies that consider how plastic resuspen- remaining trapped near-shore by the surface ocean
sion might depend on coastal geomorphology, and currents.
therefore we consider these runs as a first exploration While PBMPD can leave and return to the coastal
of the potential role of coastal geomorphology on the zone, a large portion of PBMPD never travels far
global beached plastic budget and distribution. from the coastline (figure 2(b)). Over 25% of PBMPD
mass never travels beyond 50 km from the nearest
2.5. Model concentration units coastline even with the lowest beaching probability
Model concentrations are computed by binning (supplementary table 1). The likelihood for plastic to
beached particle masses onto the same grid as the leave the coastal zone is not uniform worldwide, as
HYCOM reanalysis data, and then dividing the total PBMPD that enters the ocean from island sources or
beached mass in each cell by the length of model from sources close to energetic boundary currents is
coastline (sum of cell edges shared with land cells) more likely to travel further from shore (figure 2(c)).
for that cell. This is because the beached plastic is However, there are long stretches of coastline where
not distributed homogeneously over the entire cell, most plastic remains near shore, as the median of the
but is instead concentrated on the shoreline interface maximum distances from shore reached by particles
between land and water, such as beaches. Since there released from those coastlines is less than 20 km off-
is no global dataset of beach area, concentrations are shore.
4Environ. Res. Lett. 16 (2021) 064053 V Onink et al
Figure 1. The global percentage of beached PBMPD, using the Jambeck input. (a) The beached fractions as a function of the
beaching timescale λB in days. (b) The beached fractions as a function of the resuspension timescale λR in days.
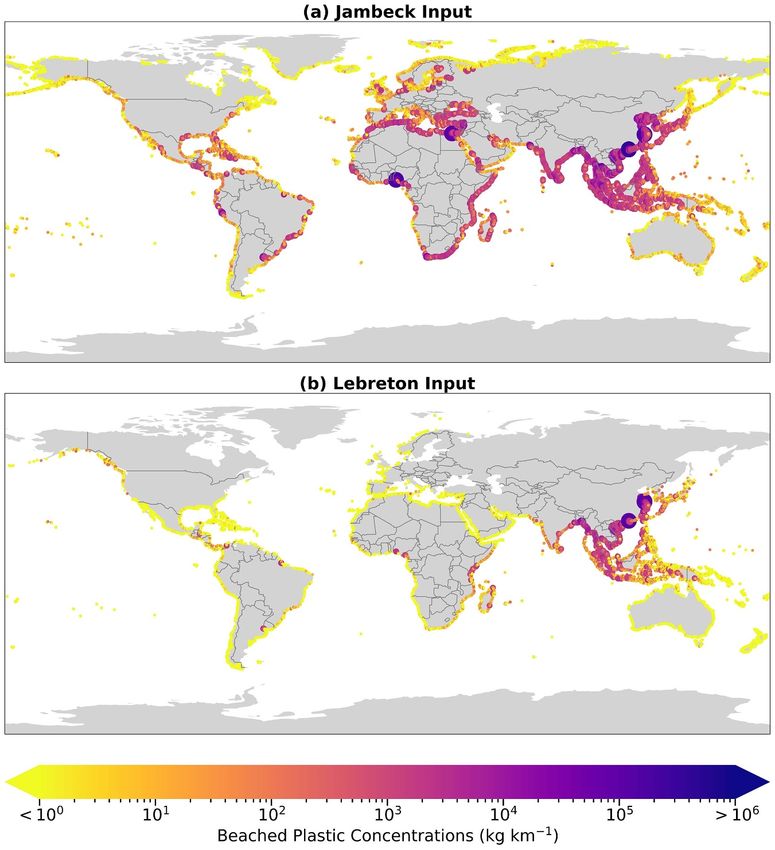
3.2. Global beached plastic distribution of PBMPD that is beached over the last year of simu-
Across all simulations, the highest beached PBMPD lation is 3% higher in comparison to using the Jam-
concentrations are found near regions with the largest beck input (supplementary figure 3). However, abso-
PBMPD sources. These include areas such as South- lute beached PBMPD concentrations are significantly
east Asia and the Mediterranean Sea (figure 3(a)), and lower, and a larger fraction of beached PBMPD is
have concentrations up to 106 kg km−1 . The lowest concentrated in Southeast Asia (figure 3(b)), reflect-
concentrations are in areas with low population dens- ing higher inputs in this region. Therefore, detailed
ities, such as polar regions, the Chilean coastline and knowledge of the distribution and size of marine
parts of the Australian coast. No PBMPD reaches the plastic debris sources are essential for understanding
Antarctic mainland in any of our simulations. This is the global distribution of beached PBMPD.
largely in line with measurements of plastic in Ant- While the overall distribution of beached plastic is
arctica, which have been very low both on beaches largely shaped by the plastic input scenario, the ocean
[15] and afloat [51]. The lack of PBMPD in Antarc- currents can play an important local role for beached
tica is due to a lack of terrestrial input sources and the PBMPD concentrations. For example, while higher
Antarctic Circumpolar Current blocking transport of beaching probabilities lead to higher global beached
PBMPD to Antarctic coastlines. fractions, certain coastlines exhibit lower beached
The global pattern of beached plastic is fairly concentrations, such as Kenya, the Indian west coast
robust towards the choice of beaching and resus- and Libya (supplementary figure 5). More beached
pension probabilities (supplementary figure 5) but PBMPD globally results in less PBMPD afloat, and
strongly depends on the plastic input distribution. therefore reduced transport of PBMPD by the ocean
With the Lebreton input, the relative global fraction currents to these areas.
5Environ. Res. Lett. 16 (2021) 064053 V Onink et al
Figure 2. (a) The global PBMPD budget of beached, coastal and coastal + beached PBMPD as a percentage of the total of amount
of PBMPD that enters the ocean. The fractions are averages over the fifth year of the simulation. Coastal PBMPD is defined as
non-beached PBMPD floating within 10 km from shore. The lines indicate fits (a × exp(x ∗ k1) + b × exp(x ∗ k2) + c) for the
beached, coastal and coastal + beached fractions. (b) The cumulative fraction of PBMPD as a function of the maximum distance
from land that particles reach during their entire trajectory. (c) The median maximum distance from shore reached by particles
over the course of their entire trajectories, with each point indicating an input location. The median is calculated over all
simulations shown in 2(a).
3.3. Local versus remote origin of beached plastic to the contribution of maritime sources [36, 54, 55],
debris which are not included in this model.
On a global average, 48.5% of beached PBMPD Higher local fractions of beached PBMPD are due
within all exclusive economic zones (EEZ, [52]) is to a combination of factors. Large local inputs gener-
local, in that it originates from a source within the ally lead to a higher local fractions, as a large fraction
EEZ. However, the local fraction of beached PBMPD of PBMPD beaches close to its initial input. Examples
is highly variable (figure 4). Generally, the local of such EEZ’s include China, Indonesia and Brazil. In
fraction for island EEZs is relatively low, matching addition, the ocean currents can play a critical role
recent reports for individual islands in various oceans (see also figure 2(c)). Eastern Africa has relatively low
[36, 53–55]. This is likely since their location in the local beached fractions, partly due to receiving high
open ocean exposes them to floating PBMPD ori- amounts of PBMPD from Indonesia transported by
ginating from a wide range of EEZ’s, while at the the Indian Ocean South Equatorial Current (match-
same time, PBMPD originating from an island EEZ ing observations by Ryan [56]). Meanwhile, coastlines
itself is less likely to beach locally than on a main- such as the Russian Arctic and Chilean mainland have
land shore due to the comparatively small coastline high local fractions despite low local inputs, since the
of islands on which beaching can occur. In the field prevailing local currents do not carry much PBMPD
the fraction from local sources is further reduced due from other regions.
6Environ. Res. Lett. 16 (2021) 064053 V Onink et al
Figure 3. Average beached PBMPD concentrations over the final year of the simulation. (a) The beached PBMPD concentrations
with the Jambeck input. (b) The beached PBMPD concentrations with the Lebreton input. Both simulations use λB = 10 d and
λR = 69 d.
However, our local beached fraction estimates are due to the lack of a standardized measurement meth-
only based on PBMPD that enters the ocean and sub- odology of beached plastic [1], which prevents com-
sequently beaches. Coastlines can also contain debris parisons of plastic debris concentrations reported by
that is littered onto the coastline directly and never different studies. Beached plastic concentrations are
enters the ocean, and plastic debris that originates reported either as counts or masses, per unit area
from maritime sources. Furthermore, ocean surface or unit length of coastline, and considering differ-
plastic removal processes such as sinking can further ent debris sizes. Furthermore, our parameterizations
reduce the non-local fraction, but it is uncertain how do not account for beach cleanups, which are known
large an effect this would have. As such, our estimates to occur at many study sites (table 1). Additionally
are only approximations of the actual local fraction of our simulations represent idealized scenarios: there is
beached PBMPD. only one year of input; we do not consider loss pro-
cesses such as sinking, ingestion, or burial in sediment
4. Discussion [70]; maritime sources of PBMPD and beach littering
are not considered.
A systematic evaluation of our model based on a large Nevertheless, we compare the modeled relat-
number of field observations is currently impossible ive distribution of beached plastic with studies that
7Environ. Res. Lett. 16 (2021) 064053 V Onink et al
Figure 4. The percentage of beached PBMPD that originates from within the EEZ for each EEZ. (a) Global, (b) Europe,
(c) Central America and the Caribbean. The shown values are averages over all stochastic simulations, and over all beached plastic
over the course of each simulation. Data for EEZs are not shown if beaching did not occur in this EEZ in each considered
stochastic simulation. Some EEZs are split where one EEZ consisted of multiple distinct regions (e.g. the United States EEZ has
been split into the US East coast, West coast, Alaska and Hawaii).
measured beached plastic concentrations with a drivers of beaching on a continental scale. However,
standardized method over multiple study sites. The these studies only allow comparisons of the relative
modeled beached PBMPD distribution for South patterns, as the model units (kg km−1 ) do not match
Africa closely resembles the distribution from field the field measurement concentrations. Compared to
measurements [39], likewise our model captures studies that do report concentrations in terms of
the very low concentrations found on the Aus- mass, the model generally overestimates field concen-
tralian Northwestern coast [38]. However, the model trations by a factor of 5–560 (table 1). This either
appears to over-predict the amount of beached plastic indicates that substantial losses of beached and float-
on the Northeastern Australian coastline, potentially ing plastic occur on short timescales that our model
due an overestimated input of plastic from Polynesian does not account for (such as burial within sediments
islands. In the United States, the concentration ratio [55, 71], sinking [35, 72, 73] and beach cleanups
between the Northern Pacific coast and the Southern [74, 75]), and/or that the input estimates are too high.
California Bight is approximately equal to the ratio The sites where beached concentrations are underes-
reported in Ribic et al [62], but the relative amount of timated (both in absolute and relative terms) are all
beached plastic in Hawaii is underestimated (table 1). islands, which could be due to neglecting maritime
PBMPD from maritime sources is often an important sources in the model.
contributor of beached plastic on remote shores and Our results depend strongly on the representa-
islands [1, 55], and the lack of maritime sources in the tion of the ocean currents, the accuracy of the plastic
input scenarios might partially account for this dis- input estimate, the beaching/resuspension paramet-
crepancy. The overall relative similarity of the meas- erizations and the relative importance of processes
ured and modeled distribution is encouraging and that are not included. HYCOM has been shown to
indicates that we may have captured the dominant represent circulation patterns well in various parts
8Environ. Res. Lett. 16 (2021) 064053 V Onink et al
Table 1. A comparison of measurements of plastic debris with model simulations. The average, minimum and maximum model outputs
are calculated over all stochastic simulations with the Jambeck input. Studies that do not report the occurrence of beach cleanups are
indicated by a hyphen.
Concentration Model mean [min
Study Location (items km−1 ) Cleanup max] (kg km−1 )
Barnes and Milner Iceland 40 — 3.28 [0.72 8.98]
[58]a,b Faeroe Islands 210 — 6.41 [0.04 30.58]
La Gomera, Canary 1910 — 69.58 [0.55 178.99]
Islands
Ascension 3400 — 0.45 [0.00 6.14]
Falkland Islands 430 — 2.49 [0.68 7.68]
Dominica 1500 — 124.54 [0.00 918.14]
Pieper et al [37]a Faial, Azores 4610 Regular during 93.59 [0.00 285.74]
summer, none during
the study period
Ryan [59]a Tristan da Cunha 240 — 16.31 [0.00 100.53]
Gough Island 100 — 9.12 [0.00 96.57]
Otley and Ingham Falkland Islands 370 — 2.49 [0.68 7.68]
[60]a
Convey et al [15] Candlemas Island 31 None 0.00 [0.00 0.00]
Saunders Island 50 None 0.00 [0.00 0.00]
Adelaide Island 0 None 0.00 [0.00 0.00]
Ribic et al [61]b Northeast US Atlantic 102 — 12.46 [1.96 43.55]
Coast
Middle US Atlantic 429 — 106.09 [5.86 397.56]
Coast
Southeast US Atlantic 83 — 220.50 [64.85 683.85]
Coast
Ribic et al [62]b Northern US Pacific 56 Not regularly 56.65 [35.00 116.03]
Coast
Southern California 139 Not regularly 160.80 [43.92 623.58]
Bight
Hawaii 134 Not regularly 33.24 [4.90 120.65]
Concentration Model mean [min
Study Location (kg km−1 ) Cleanup max] (kg km−1 )
Corbin and Singh Dominica 8 — 124.54 [0.00 918.14]
[63] St. Lucia 3 — 110.18 [0.00 550.12]
Debrot et al [16] Bonaire 647 — 53.26 [0.00 285.57]
Debrot et al [40] Curaçao 506 Occasionally 43.12 [0.00 362.68]
Claereboudt [64] Northern Oman 15 Occur, but frequency 86.43 [10.08 449.02]
not specified
Ali and Shams [65] Clifton Beach, 11 Periodically, but 4718.88 [167.62
Karachi, Pakistan frequency not 55 688.46]
specified
Hong et al [66] South Korea 262 Not regularly 970.65 [263.95
1611.52]
Pervez et al [67] Shilaoren Beach, 5 Daily 2721.28 [327.44
Qingdao, China 13 124.59]
Pervez et al [68] No. 1 Bathing Beach, 73 Daily 2721.28 [327.44
Qingdao, China 13 124.59]
Madzena and Lasiak Transkei Coast, South 47 Not regularly 1383.42 [111.45
[69] Africa 5084.47]
Total Plastic Model mean [min
Study Location (metric tons) Cleanup max] (kg km−1 )
Lavers and Bond [55] Henderson Island 17.6 Never 0.08 [0.00 0.49]
a
Concentrations as reported in Monteira et al [57].
b
Total of marine debris, not solely plastic.
of the world [76–78]. However, HYCOM does not sum of the HYCOM currents and Stokes drift from
account for Stokes drift, which plays an important the WaveWatch III reanalysis [24, 25], and we con-
role in shoreward surface transport [18]. In line with sider this the best available representation of global
earlier modeling studies [10, 28, 29], we take the scale circulation. Nevertheless, we acknowledge that
9Environ. Res. Lett. 16 (2021) 064053 V Onink et al
trajectory modeling is more accurate in the open consequence, the beached PBMPD budgets are upper
ocean than on the coastal shelf, where we also miss estimates given that PBMPD is unable to exit the cycle
the effects of tidal currents [79–81]. of beaching and resuspension in our model.
With an estimated global beached fraction of Finally, we assume globally uniform beaching
31%–95%, we show that the beached amount of and resuspension probabilities. Exploratory tests with
plastic is a lot less constrained than suggested in shore type dependent resuspension affects the global
Lebreton et al [12], whose simple 6-box model pre- budget and distribution of beached plastic only
dicted that 69% of plastic that has entered the ocean minimally (supplementary figures 6 and 7), even
since 1950 is found beached. In this box model, when applying substantial differences in resuspen-
the authors assumed a 97% annual beaching rate of sion probability. These results indicate that on a
coastal PBMPD (equivalent to λB = 104 d), which is global scale, local variations in resuspension prob-
at the upper end of our tested range of plausible λB ability driven by factors such as wind direction or
values (1–100 d), and they tuned their resuspension coastal geomorphology play only a minor role. Nev-
rate to match the global amount of floating PBMPD, ertheless, more research is needed to understand how
resulting in a 1% annual resuspension rate of beached both beaching and resuspension are influenced by
plastic (equivalent to λR = 36 317 d) that is much geomorphology and climatological factors, particu-
slower than what is indicated by field experiments larly on local to regional scales.
(69–273 d, [17]). In addition, the box model of Lebre-
ton et al [12] assumes uniform off-shore transport, 5. Conclusion
while we show that transport varies strongly in dif-
ferent regions (figure 2(c)). Our results indicate that part of the discrepancy
We mostly use the Jambeck input scenario for our between current plastic input estimates and estim-
model [4]. There have been a number of estimates for ates of floating plastic debris in the open ocean is
plastic inputs into the ocean [4–6, 82], but it is unclear due to high amounts of beached and coastal PBMPD.
which are most accurate. Furthermore, all alternative We have also identified coastlines where PBMPD is
estimates also neglect contributions from maritime much more likely to reach the open ocean, such as
sources and primary microplastics. There are indic- the Eastern United States, Eastern Japan and Indone-
ations that the amount of plastic entering the ocean sia. Here, cleanups would be particularly effective in
is lower than estimated in the Jambeck input [83, 84] intercepting PBMPD before it escapes to the open
and given how strongly the modeled global distribu- ocean. However, more work needs to be done invest-
tion of PBMPD is influenced by the input scenario, it igating the behavior of PBMPD in coastal waters, spe-
is crucial to get better estimates of plastic debris input cifically the role of wind, waves, tides, and coastal
sources, both terrestrial and maritime. morphology in PBMPD transport, beaching and
The model assumes that there are no PBMPD loss resuspension. This would be strongly aided by stand-
processes, or at least that they do not play a significant ardized beached PBMPD field measurements, allow-
role during the first 5 years. For example, we assume ing comparisons of PBMPD concentrations at differ-
PBMPD remains at the ocean surface, but processes ent measurement sites. Furthermore, future studies
such as biofouling can cause the density of PBMPD to ought to consider the influence of maritime sources
increase until it starts to sink [85]. PBMPD can also be on beached PBMPD, as this study only considers ter-
removed through ingestion by wildlife [86]. Experi- restrial inputs.
ments with tethered PBMPD biofouling show sinking
of cm-sized plastic sheets after 17–66 d underneath a Data availability statement
floating dock [85], but it is unclear how this translates
to sinking rates for free floating PBMPD for differ- The data that support the findings of this study are
ent sizes, shape and regions. PBMPD has been found available upon reasonable request from the authors.
at the surface up to 50 years after its estimated pro-
duction date [10], and while this PBMPD might not Acknowledgments
have floated at the ocean surface over this entire time
period, it does suggest biofouling requires more than Calculations were performed on UBELIX
66 d to sink PBMPD in the open ocean. Given these (www.id.unibe.ch/hpc), the HPC cluster at the Uni-
uncertainties, sinking was not included as PBMPD versity of Bern. V O and C L acknowledge support
removal process in this study. Plastic ingestion has from the Swiss National Science Foundation (Project
been found to occur with a wide range of species PZ00P2_174124 Global interactions between micro-
[87], but it is unclear how much total plastic has plastics and marine ecosystems). E v S was supported
been ingested and at what rate this occurs. We also by the European Research Council (ERC) under the
assume beached PBMPD remains available for resus- European Unions Horizon 2020 research and innov-
pension indefinitely, but PBMPD can be transported ation programme (Grant Agreement No. 715386). C
towards the backshore [88] or be buried [1]. As a E J is supported by a Skempton Scholarship.
10Environ. Res. Lett. 16 (2021) 064053 V Onink et al
Author’s contribution [11] Geyer R, Jambeck J R and Law K L 2017 Production, use and
fate of all plastics ever made Sci. Adv. 3 e1700782
[12] Lebreton L, Egger M and Slat B 2019 A global mass budget
Development of the beaching and resuspension para-
for positively buoyant macroplastic debris in the ocean Sci.
metrizations was done by V O, C E J, and C L, with Rep. 9 1–10
input from M J H. The manuscript was written by V O [13] Hardesty B D et al 2017 Using numerical model simulations
and C L, with extensive input from C E J, M J H and to improve the understanding of micro-plastic distribution
and pathways in the marine environment Front. Mar. Sci.
E v S. Everyone contributed to the study design and
4 30
discussion of the analysis, with V O carrying out the [14] Schwarz A, Ligthart T, Boukris E and Van Harmelen T 2019
analysis. Sources, transport and accumulation of different types of
plastic litter in aquatic environments: a review study Mar.
Pollut. Bull. 143 92–100
Conflict of interests [15] Convey P, Barnes D and Morton A 2002 Debris
accumulation on oceanic island shores of the Scotia Arc,
Antarctica Polar Biol. 25 612–17
The authors declare no competing interests.
[16] Debrot A O, van Rijn J, Bron P S and de León R 2013 A
baseline assessment of beach debris and tar contamination in
Code availability Bonaire, Southeastern Caribbean Mar. Pollut. Bull. 71 325–9
[17] Hinata H, Mori K, Ohno K, Miyao Y and Kataoka T 2017 An
estimation of the average residence times and
The code for the Lagrangian simulations is avail- onshore-offshore diffusivities of beached microplastics based
able at: https://github.com/VictorOnink/Modeling- on the population decay of tagged meso-and macrolitter
Global-Plastic-Beaching. Mar. Pollut. Bull. 122 17–26
[18] Onink V, Wichmann D, Delandmeter P and van Sebille E
2019 The role of Ekman currents, geostrophy and Stokes
ORCID iDs drift in the accumulation of floating microplastic J. Geophys.
Res. Oceans 124 1474–90
[19] Miladinova S, Macias D, Stips A and Garcia-Gorriz E 2020
Victor Onink https://orcid.org/0000-0003-4177- Identifying distribution and accumulation patterns of
9893 floating marine debris in the black sea Mar. Pollut. Bull.
Cleo E Jongedijk https://orcid.org/0000-0001- 153 110964
[20] Lebreton L-M, Greer S and Borrero J C 2012 Numerical
9847-5212 modelling of floating debris in the world’s oceans Mar.
Matthew J Hoffman https://orcid.org/0000-0002- Pollut. Bull. 64 653–61
9430-005X [21] Critchell K et al 2015 Modelling the fate of marine debris
Erik van Sebille https://orcid.org/0000-0003- along a complex shoreline: lessons from the great barrier reef
Estuar. Coast. Shelf Sci. 167 414–26
2041-0704 [22] Carlson D F et al 2017 Combining litter observations with a
Charlotte Laufkötter https://orcid.org/0000-0001- regional ocean model to identify sources and sinks of
5738-1121 floating debris in a semi-enclosed basin: the adriatic sea
Front. Mar. Sci. 4 78
[23] Bleck R 2002 An oceanic general circulation model framed
References in hybrid isopycnic-cartesian coordinates Ocean Model.
4 55–88
[1] Browne M A et al 2015 Spatial and temporal patterns of [24] Tolman H L 1997 User manual and system documentation of
stranded intertidal marine debris: is there a picture of global WAVEWATCH-III version 1.15 (US Department of
change? Environ. Sci. Technol. 49 7082–94 Commerce, National Oceanic and Atmospheric
[2] Li R, Yu L, Chai M, Wu H and Zhu X 2020 The distribution, Administration, National Weather Service, National Centers
characteristics and ecological risks of microplastics in the for Environmental Prediction)
mangroves of Southern China Sci. Total Environ. [25] Tolman H L 2009 User manual and system documentation of
708 135025 WAVEWATCH IIITM version 3.14 Technical Note, MMAB
[3] Ballance A, Ryan P and Turpie J 2000 How much is a clean Contribution vol 276 p 220
beach worth? The impact of litter on beach [26] Tamura H, Miyazawa Y and Oey L-Y 2012 The Stokes drift
users in the Cape Peninsula, South Africa South Afr. J. Sci. and wave induced-mass flux in the North Pacific J. Geophys.
96 210–30 Res. Oceans 117 C08021
[4] Jambeck J R et al 2015 Plastic waste inputs from land into the [27] Rascle N and Ardhuin F 2013 A global wave parameter
ocean Science 347 768–71 database for geophysical applications. Part 2: model
[5] Lebreton L C et al 2017 River plastic emissions to the world’s validation with improved source term parameterization
oceans Nat. Commun. 8 15611 Ocean Model. 70 174–88
[6] Schmidt C, Krauth T and Wagner S 2017 Export of plastic [28] Fraser C I et al 2018 Antarctica’s ecological isolation will be
debris by rivers into the sea Environ. Sci. Technol. broken by storm-driven dispersal and warming Nat. Clim.
51 12246–53 Change 8 704–8
[7] Cózar A et al 2014 Plastic debris in the open ocean Proc. Natl [29] Lacerda A L d F et al 2019 Plastics in sea surface waters
Acad. Sci. 111 10239–44 around the Antarctic Peninsula Sci. Rep. 9 3977
[8] Eriksen M et al 2014 Plastic pollution in the world’s oceans: [30] Van Den Bremer T and Breivik Ø 2018 Stokes drift Phil.
more than 5 trillion plastic pieces weighing over 250,000 Trans. R. Soc. A 376 20170104
tons afloat at sea PLoS One 9 e111913 [31] Lange M and van Sebille E 2017 Parcels v0.9: prototyping a
[9] van Sebille E et al 2015 A global inventory of small floating Lagrangian ocean analysis framework for the petascale age
plastic debris Environ. Res. Lett. 10 124006 Geosci. Model Dev. Discuss. 10 4175–86
[10] Lebreton L et al 2018 Evidence that the great pacific [32] Delandmeter P and Van Sebille E 2019 The parcels v2.0
garbage patch is rapidly accumulating plastic Sci. Rep. Lagrangian framework: new field interpolation schemes
8 4666 Geosci. Model Dev. 12 3571–84
11Environ. Res. Lett. 16 (2021) 064053 V Onink et al
[33] Liubartseva S, Coppini G, Lecci R and Clementi E 2018 [55] Lavers J L and Bond A L 2017 Exceptional and rapid
Tracking plastics in the Mediterranean: 2D Lagrangian accumulation of anthropogenic debris on one of the world’s
model Mar. Pollut. Bull. 129 151–62 most remote and pristine islands Proc. Natl Acad. Sci.
[34] Center for International Earth Science Information 114 6052–5
Network—CIESIN—Columbia University 2016 Gridded [56] Ryan P G 2020 Land or sea? what bottles tell us about the
population of the world, version 4 (gpwv4): population origins of beach litter in Kenya Waste Manage. 116 49–57
density [57] Monteiro R C, do Sul J A I and Costa M F 2018 Plastic
[35] Ryan P G 2015 Does size and buoyancy affect the pollution in islands of the Atlantic ocean Environ. Pollut.
long-distance transport of floating debris? Environ. Res. Lett. 238 103–10
10 084019 [58] Barnes D K and Milner P 2005 Drifting plastic and its
[36] Brignac K C et al 2019 Marine debris polymers on main consequences for sessile organism dispersal in the Atlantic
Hawaiian island beaches, sea surface and seafloor Environ. Ocean Mar. Biol. 146 815–25
Sci. Technol. 53 12218–26 [59] Ryan P G 1987 The origin and fate of artefacts stranded on
[37] Pieper C, Ventura M A, Martins A and Cunha R T 2015 islands in the African sector of the Southern Ocean Environ.
Beach debris in the azores (NE Atlantic): Faial island as a Conserv. 14 341–6
first case study Mar. Pollut. Bull. 101 575–82 [60] Otley H and Ingham R 2003 Marine debris surveys at
[38] Hardesty B D, Lawson T, van der Velde T, Lansdell M and volunteer beach, Falkland Islands, during the summer of
Wilcox C 2017 Estimating quantities and sources of marine 2001/02 Mar. Pollut. Bull. 46 1534–9
debris at a continental scale Front. Ecol. Environ. 15 18–25 [61] Ribic C A, Sheavly S B, Rugg D J and Erdmann E S 2010
[39] Ryan P G, Perold V, Osborne A and Moloney C L 2018 Trends and drivers of marine debris on the Atlantic coast of
Consistent patterns of debris on South African beaches the United States 1997–2007 Mar. Pollut. Bull.
indicate that industrial pellets and other mesoplastic items 60 1231–42
mostly derive from local sources Environ. Pollut. 238 1008–16 [62] Ribic C A, Sheavly S B, Rugg D J and Erdmann E S 2012
[40] Debrot A O, Tiel A B and Bradshaw J E 1999 Beach debris in Trends in marine debris along the U.S. Pacific coast and
Curacao Mar. Pollut. Bull. 38 795–801 Hawai’i 1998–2007 Mar. Pollut. Bull. 64 994–1004
[41] Smith S D 2012 Marine debris: a proximate threat to marine [63] Corbin C and Singh J 1993 Marine debris contamination of
sustainability in bootless bay, Papua New Guinea Mar. Pollut. beaches in St. Lucia and Dominica Mar. Pollut. Bull. 26 325–8
Bull. 64 1880–3 [64] Claereboudt M R 2004 Shore litter along sandy beaches of
[42] Thiel M et al 2013 Anthropogenic marine debris in the the Gulf of Oman Mar. Pollut. Bull. 49 770–7
coastal environment: a multi-year comparison between [65] Ali R and Shams Z I 2015 Quantities and composition of
coastal waters and local shores Mar. Pollut. Bull. 71 307–16 shore debris along Clifton Beach, Karachi, Pakistan J. Coast.
[43] Kaandorp M L A, Dijkstra H A and van Sebille E 2020 Conserv. 19 527–35
Closing the Mediterranean marine floating plastic mass [66] Hong S, Lee J, Kang D, Choi H-W and Ko S-H 2014
budget: inverse modeling of sources and sinks Environ. Sci. Quantities, composition and sources of beach debris in
Technol. 54 11980–9 Korea from the results of nationwide monitoring Mar. Pollut.
[44] Stanev E et al 2019 Extreme westward surface drift in the Bull. 84 27–34
North Sea: public reports of stranded drifters and [67] Pervez R, Wang Y, Ali I, Ali J and Ahmed S 2020 The analysis
Lagrangian tracking Cont. Shelf Res. 177 24–32 of the accumulation of solid waste debris in the summer
[45] Weideman E A, Perold V, Omardien A, Smyth L K and season along the Shilaoren Beach Qingdao, China Reg. Stud.
Ryan P G 2020 Quantifying temporal trends in Mar. Sci. 34 101041
anthropogenic litter in a rocky intertidal habitat Mar. Pollut. [68] Pervez R, Wang Y, Mahmood Q, Zahir M and Jattak Z 2020
Bull. 160 111543 Abundance, type and origin of litter on no. 1 bathing beach
[46] Samaras A G, De Dominicis M, Archetti R, Lamberti A and of Qingdao, China J. Coast. Conserv. 24 34
Pinardi N 2014 Towards improving the representation of [69] Madzena A and Lasiak T 1997 Spatial and temporal
beaching in oil spill models: a case study Mar. Pollut. Bull. variations in beach litter on the Transkei coast of South
88 91–101 Africa Mar. Pollut. Bull. 34 900–7
[47] Luijendijk A et al 2018 The state of the world’s beaches Sci. [70] Van Sebille E et al 2020 The physical oceanography of the
Rep. 8 6641 transport of floating marine debris Environ. Res. Lett.
[48] Ryan P G 2013 A simple technique for counting marine 15 023003
debris at sea reveals steep litter gradients between the [71] Martin C et al 2020 Exponential increase of plastic burial in
Straits of Malacca and the Bay of Bengal Mar. Pollut. Bull. mangrove sediments as a major plastic sink Sci. Adv.
69 128–36 6 eaaz5593
[49] Pedrotti M L et al 2016 Changes in the floating plastic [72] Choy C A et al 2019 The vertical distribution and biological
pollution of the Mediterranean sea in relation to the distance transport of marine microplastics across the epipelagic and
to land PLoS One 11 e0161581 mesopelagic water column Sci. Rep. 9 1–9
[50] Ruiz-Orejón L F, Sardá R and Ramis-Pujol J 2018 Now, you [73] Egger M, Sulu-Gambari F and Lebreton L 2020 First
see me: high concentrations of floating plastic debris in the evidence of plastic fallout from the North Pacific garbage
coastal waters of the Balearic Islands (Spain) Mar. Pollut. patch Sci. Rep. 10 1–10
Bull. 133 636–46 [74] Uneputty P, Evans S and Suyoso E 1998 The effectiveness of a
[51] Suaria G et al 2020 Floating macro-and microplastics around community education programme in reducing litter
the Southern Ocean: results from the Antarctic pollution on shores of Ambon Bay (Eastern Indonesia)
circumnavigation expedition Environ. Int. 136 105494 J. Biol. Educ. 32 143–7
[52] Institute F M 2019 Union of the ESRI country shapefile and [75] Willis K, Maureaud C, Wilcox C and Hardesty B D 2018
the exclusive economic zones (version 3) (available at: https:/ How successful are waste abatement campaigns and
/doi.org/10.14284/403) government policies at reducing plastic waste into the
[53] Pieper C, Amaral-Zettler L, Law K L, Loureiro C M and marine environment? Mar. Policy 96 243–9
Martins A 2019 Application of matrix scoring techniques to [76] Savage J A, Tokmakian R T and Batteen M L 2015
evaluate marine debris sources in the remote islands of the Assessment of the HYCOM velocity fields during Agulhas
Azores Archipelago Environ. Pollut. 249 666–75 return current cruise 2012 J. Oper. Oceanogr. 8 11–24
[54] Ryan P G, Dilley B J, Ronconi R A and Connan M 2019 [77] Metzger E J et al 2010 Simulated and observed
Rapid increase in Asian bottles in the south Atlantic ocean circulation in the Indonesian seas: 1/12 global HYCOM
indicates major debris inputs from ships Proc. Natl Acad. Sci. and the instant observations Dyn. Atmos. Oceans
116 20892–7 50 275–300
12Environ. Res. Lett. 16 (2021) 064053 V Onink et al
[78] Wang M et al 2019 Origin and formation of the Ryukyu [83] Tramoy R et al 2019 Assessment of the plastic inputs from
current revealed by HYCOM reanalysis Acta Oceanol. Sin. the seine basin to the sea using statistical and field
38 1–10 approaches Front. Mar. Sci. 6 151
[79] Liu Y and Weisberg R H 2011 Evaluation of trajectory [84] Van Emmerik T, Loozen M, Van Oeveren K, Buschman F
modeling in different dynamic regions using normalized and Prinsen G 2019 Riverine plastic emission from Jakarta
cumulative Lagrangian separation J. Geophys. Res. Oceans into the ocean Environ. Res. Lett. 14 084033
116 C09013 [85] Fazey F M and Ryan P G 2016 Biofouling on buoyant marine
[80] Liu Y, Weisberg R H, Vignudelli S and Mitchum G T 2014 plastics: an experimental study into the effect of size on
Evaluation of altimetry-derived surface current products surface longevity Environ. Pollut. 210 354–60
using Lagrangian drifter trajectories in the Eastern Gulf of [86] Van Franeker J A and Law K L 2015 Seabirds, gyres and
Mexico J. Geophys. Res. Oceans 119 2827–42 global trends in plastic pollution Environ. Pollut.
[81] Sterl M F, Delandmeter P and van Sebille E 2020 Influence of 203 89–96
barotropic tidal currents on transport and accumulation of [87] Derraik J G 2002 The pollution of the marine
floating microplastics in the global open ocean J. Geophys. environment by plastic debris: a review Mar. Pollut. Bull.
Res. Oceans 125 e2019JC015583 44 842–52
[82] Lebreton L and Andrady A 2019 Future scenarios of global [88] Pham C K et al 2020 The Azores archipelago as a transitory
plastic waste generation and disposal Palgrave Commun. repository for small plastic fragments floating in the
5 1–11 North-East Atlantic Environ. Pollut. 263 114494
13You can also read