Rapidly rising transboundary atmospheric pollution from industrial and urban sources in Southeast Asia and its implications for regional ...
←
→
Page content transcription
If your browser does not render page correctly, please read the page content below
LETTER • OPEN ACCESS

Rapidly rising transboundary atmospheric pollution from industrial and
urban sources in Southeast Asia and its implications for regional
sustainable development
To cite this article: Qinqin Chen et al 2020 Environ. Res. Lett. 15 1040a5

View the article online for updates and enhancements.

                                This content was downloaded from IP address 46.4.80.155 on 13/02/2021 at 00:06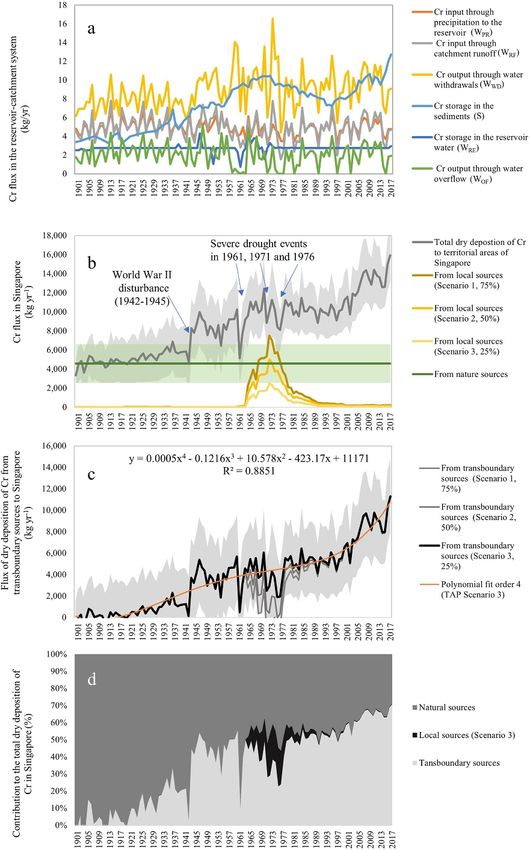
Environ. Res. Lett. 15 (2020) 1040a5 https://doi.org/10.1088/1748-9326/abb5ce
Environmental Research Letters
LETTER
Rapidly rising transboundary atmospheric pollution from industrial
OPEN ACCESS
and urban sources in Southeast Asia and its implications for
RECEIVED
27 March 2020 regional sustainable development
REVISED
20 August 2020 Qinqin Chen1, Suzanne McGowan2, Chris Gouramanis1, Letisha Fong1,
ACCEPTED FOR PUBLICATION Rajasekhar Balasubramanian 3 and David Taylor1
7 September 2020
1
PUBLISHED
Department of Geography, Faculty of Arts and Social Sciences, National University of Singapore, 117570 Singapore
2
9 October 2020 School of Geography, University of Nottingham, Nottingham NG7 2RD, United Kingdom
3
Department of Civil and Environmental Engineering, Faculty of Engineering, National University of Singapore, 117576 Singapore
4
Department of Geography, National University of Singapore, 21 Lower Kent Ridge Road, 119077 Singapore
Original content from
this work may be used E-mail: e0008676@u.nus.edu
under the terms of the
Creative Commons Keywords: air pollution, Southeast Asia, industrial pollution, environmental sustainability, transboundary environmental governance,
Attribution 4.0 licence. mass balance, palaeolimnology
Any further distribution
of this work must Supplementary material for this article is available online
maintain attribution to
the author(s) and the title
of the work, journal
citation and DOI. Abstract
Transboundary atmospheric pollution is a major concern throughout much of Southeast Asia
(SEA), although most attention has, to date, focused on episodic haze events associated with
biomass burning in the region. Here, we reconstruct long-term variations in transboundary inputs
of chromium (Cr), an industrial pollutant, to Singapore over the period 1900–2017 by adopting a
novel catchment-reservoir mass balance methodology that combines a national emissions
inventory and a paleolimnological approach. Results show periods of low (before the 1950s) and
relatively stable (the 1950s–1980s) levels of transboundary Cr deposition in Singapore followed by
an unambiguous increase from ca. 1990 onwards, most likely linked to the onset of rapid
industrialisation in neighbouring parts of Malaysia and Indonesia. Notably, from ca. 2000 onwards,
fluxes of transboundary Cr deposition in Singapore further increased by 3% per year, almost
doubling from 6 ± 3 tonne Cr yr−1 in 2000 to around 11 ± 3 tonne Cr yr−1 in 2017. This
post-2000 rapid increase may reflect the effects of globalisation, pro-export driven economic
growth policies and increasing capital inflows to the whole region, including from Singapore, all of
which combined to drive industrialisation throughout much of SEA. The current trend of
increasing transboundary pollution from anthropogenic activity highlights an urgent need for
effective collaboration among countries in SEA in order to improve well-being and help guarantee
sustainable development throughout the region.
1. Introduction periodic smoke haze events associated with the burn-
ing of forests and peatlands [4, 5] and with sub-
The atmospheric residence time of some pollutants, stantially reduced visibility [6] and enhanced res-
such as heavy metals, can range from days to weeks, piratory distress in affected populations across the
enabling long-distance transportation that can result region [7]. Public pressure on governments to address
in deposition far from their sources [1] and trans- TAP has therefore been largely driven by, and skewed
boundary atmospheric pollution (TAP) [2]. As a res- towards, these major haze pollution events [4, 8].
ult of rapid and widespread industrialisation and An example is the establishment of the legally-
urbanisation, TAP is now a global problem [3]. In binding ‘Agreement on Transboundary Haze Pollu-
Southeast Asia (SEA), TAP typically peaks during tion’ in 2002 among members of the Association of
© 2020 The Author(s). Published by IOP Publishing Ltd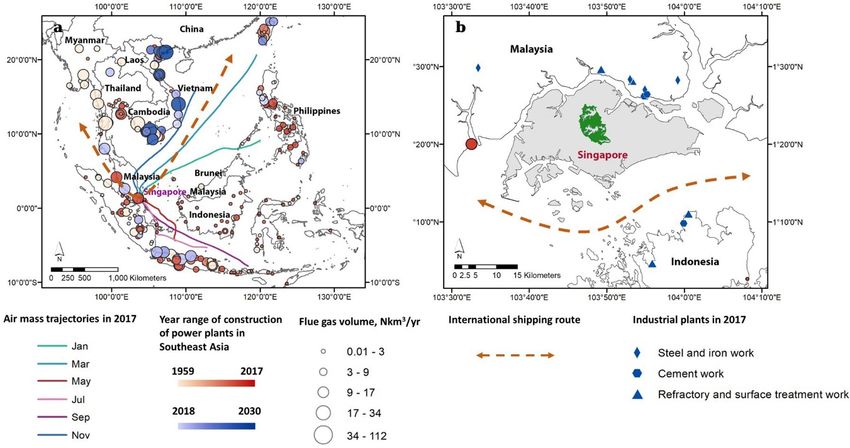
Environ. Res. Lett. 15 (2020) 1040a5                                                                               Q Chen et al

Southeast Asian Nations (ASEAN)5 to tackle biomass                   to represent pollution from industrial and urban
burning-related TAP [9]. By contrast, other non-                     sources and is used in the current research as a proxy
biomass burning-related pollutants, such as those                    of non-biomass burning-related pollution [21]. A
arising from industrial activities, maritime traffic and             novel catchment-reservoir mass balance approach,
fossil fuel power stations, tend to receive relatively               combining field- and laboratory-based paleolimno-
little attention [7, 10].                                            logical techniques and a document-based national
     Unlike highly episodic haze events, air pollu-                  emission inventory (NEI), was adopted to distinguish
tion from non-biomass burning sources tends to be                    and quantify levels of dry Cr deposition in Singapore
sustained and can, therefore, pose a chronic risk                    from transboundary sources between 1900 and 2017.
to human health [11]. In SEA, where air pollu-
tion monitoring systems are not widely implemented                   2. Materials and methods
and those that do exist are often poorly maintained
[12], information on TAP is generally lacking. Con-                  2.1. Research site
sequently, no regional agreement exists to regulate                  Singapore (ca. 1◦ N, 103◦ E) is a highly urban-
TAP from, for example, fossil fuel combustion or                     ized island state with a land area of 721 km2 (2018)
heavy industries. This legislative gap reflects the neg-             that neighbours Indonesia and Malaysia and major
lect of the obvious risks to health of pollution from                international shipping routes (figure 1(a)). Singa-
industrial and urban sources. For example, the estim-                pore has a tropical climate, with abundant rainfall
ated annual premature deaths in SEA from TAP                         of 2166 mm yr−1 (1981–2010 average), and is influ-
linked to emissions from coal-fired power stations                   enced by Northeast and Southeast monsoonal air-
are more than twice those from TAP associated with                   flows [22]. The wind speed in Singapore increases
major biomass (peatland and forest) fires in Indone-                 from an overall average of 2.5 m s−1 (1981–2010)
sia from October to December in 2015 [13, 14]. This                  to >10 m s−1 during monsoon periods [23]. Singa-
discrepancy highlights a major shortcoming in know-                  pore underwent rapid industrialisation and urbanisa-
ledge and underpins an inadequate response to TAP                    tion from the 1960s to the late 1980s but has since
in all its forms. This inadequate response risks human               transitioned towards a more services-based economy
health and well-being and undermines attempts by                     [24, 25].
SEA countries to achieve the United Nations Sustain-                      In the absence of natural lakes in Singapore, the
able Development Goals (UN SDGs). Attaining SDG                      country’s oldest artificial reservoir [26] along with its
3.9, for example, requires substantial reductions in                 catchment, a total of ca. 8 km2 and part of the largest
mortality rates linked to atmospheric pollution by                   nature reserve in Singapore (table 1, figure 1(b), sup-
2030 [15].                                                           plementary material (SM) figure 1 (available online
     Determining TAP is challenging, especially in                   at https://stacks.iop.org/ERL/15/1040a5/mmedia)),
urban areas where pollution originates from a mix-                   were selected as the principal focus of study. The
ture of sources; natural, anthropogenic, local and                   main sources of water to the reservoir are direct rain-
transboundary. Past studies of TAP in SEA tend to                    fall and runoff from the catchment [27]. Water levels
assume that the total measured pollution during haze                 have been kept stable over time by actively dischar-
events equates entirely to TAP [16–19]. This assump-                 ging and pumping water during wet and dry periods,
tion neglects the possibility of local sources contrib-              respectively [27]. Annual water inputs via direct rain-
uting to poor air quality and for the level of that                  fall and runoff from the catchment (ca. 11 million
contribution to vary over time [6]. Furthermore,                     m3 ) are much larger than the reservoir capacity (ca.
past studies of TAP in SEA tend to rely on relat-                    3 million m3 ) [28]. The water residence time of the
ively short-term observations, often spanning less                   reservoir, therefore, may not exceed one year. There
than a year [6, 10, 19]. Such short-term studies are                 is negligible groundwater exchange to the reservoir
unlikely to capture variations in TAP from non-                      [29] as a large part of the reservoir and its catchment
biomass burning-related sources due, for example, to                 sits on top of the Bukit Timah Granite formation,
changes in the pace of industrialisation and urbanisa-               which has very low permeability [30]. Although the
tion in the region and/or following the implementa-                  reservoir and its catchment are well protected today
tion of environmental regulations.                                   [26], the site has suffered from disturbances in the
     This paper quantifies past variations in the dry                past, notably during World War II (1942–1945) [31].
deposition of TAP-associated chromium (Cr) in
Singapore, the most affluent ASEAN country in GDP                    2.2. Environmental proxy
per capita terms [20]. Cr, a heavy metal, is assumed                 Several reasons underpin the choice of Cr as a proxy
                                                                     of non-biomass burning-related TAP. First, Cr has
                                                                     well-documented biological toxicity, with the World
5 A regional organisation established in 1967, comprising Brunei,
                                                                     Health Organization setting benchmarks for accept-
Cambodia, Indonesia, Laos, Malaysia, Myanmar, the Philippines,
                                                                     able environmental concentrations of it [34, 35].
Singapore, Thailand, and Vietnam by 2019. The organisation is
aimed at building economic, political-security, and social-culture   Second, although Cr can be released through nat-
communities among the member states.                                 ural processes, such as volcanic eruptions and soil

                                                       2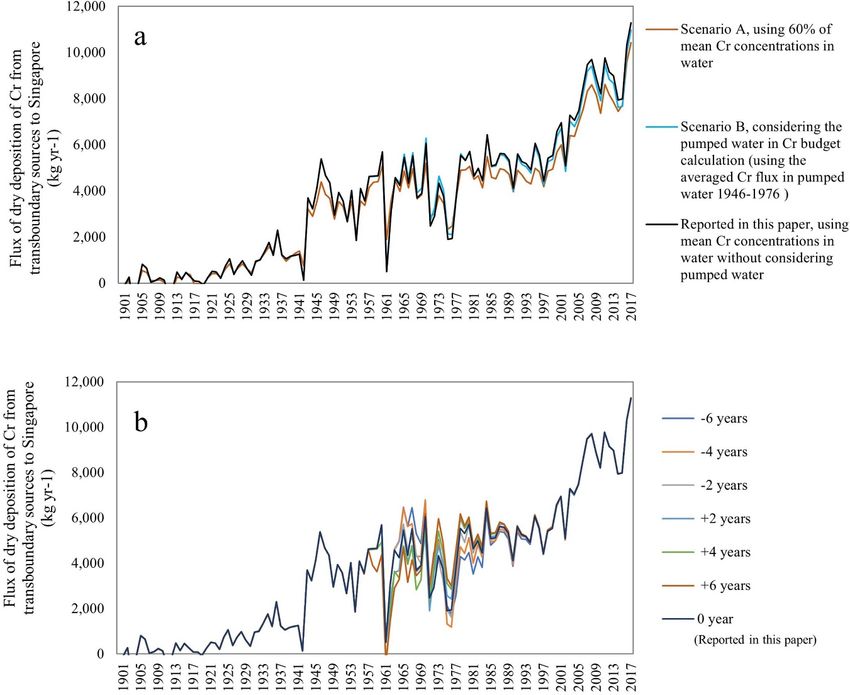
Table 1. Descriptive summary of the reservoir, catchment, and the five sediment cores (Core 1 to Core 5) used to determine annual Cr fluxes in sediments.

    Name                Location                                      Area                                          Water depth (m)                                       Core length (cm)             pHb           Temperatureb (◦ C)
                                                                                                                                                                                                                                          Environ. Res. Lett. 15 (2020) 1040a5

    Reservoir           Central Singapore                             779 700 m2 (except during                     Maximum depth ranges from 6.0 to 8.0
                                                                      extreme drought events)
    Catchment           Southern part of Central Catch-               7 649 000 m2
                        ment Natural Reserve
    Core 1              Eastern part of the reservoir                 Core 1 and Core 2 represent                   6.9                                                           43                   7.70                  30.6
                                                                      areas with depths of 6–8 m (25%

3
                                                                      of the total reservoir areaa )
    Core 2              Eastern part of the reservoir;                                                              7.4                                                           31                   7.46                  31.1
                        near Core 1 and the dam of the
                        reservoir
    Core 3              Central part of the reservoir                 Core 3 and Core 4 represent                   5.0                                                           68                   7.70                  30.6
                                                                      areas with depths of 4–6 m (30%
                                                                      of the total reservoir areaa )
    Core 4              Central part of the reservoir,                                                              5.4                                                           26                   7.10                  31.3
                        near Core 2
    Core 5              Western part of the reservoir,                Core 5 represents areas with                  2.9                                                           29                   7.26                  30.1
                        near a golf course                            depths of 1.5–4 m (28% of the
                                                                      total reservoir areaa )
    a
      Near-shore areas of the reservoir with depths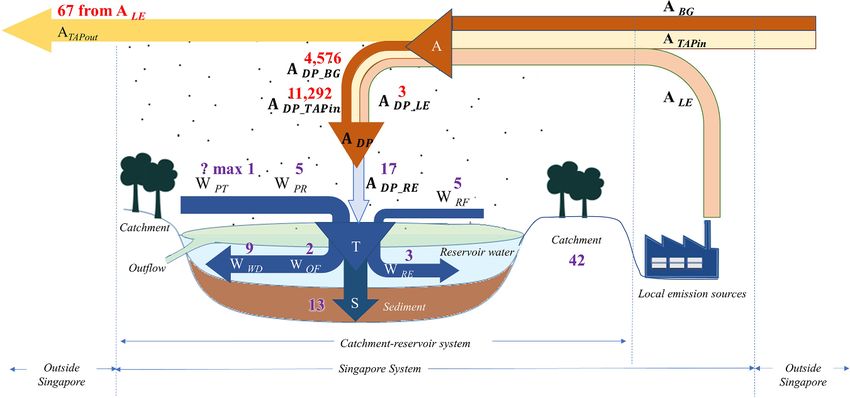
Environ. Res. Lett. 15 (2020) 1040a5                                                                      Q Chen et al

                                                                               ∑
erosion [36], a significant portion of Cr in the atmo-                    S=         scj × δj × γj × aj           (2)
sphere is from anthropogenic activities (a global aver-                          j
age of 59% in 1983) [37], notably the combustion of
fossil fuels and manufacturing of steel [21]. Third,           Step 2: Reconstruction of the flux of total dry
Cr tends to attach to airborne fine particulates and       deposited Cr in Singapore (ADP , equation 3) from
has a 7–10 d atmospheric residence time that enables       the total dry deposited Cr in the catchment-reservoir
long-distance transportation [38, 39]. Cr thus has the     system (ADP_RE ) through mass balance (equation 4)
potential to act as a TAP, particularly in the con-        using data generated from Step 1. Calculations were
text of Singapore, the territory of which immediately      based on the assumption that dry deposited Cr in
adjoins rapidly industrialising and urbanising parts of    the reservoir area (aRE ) is representative of that across
neighbouring Malaysia and Indonesia. Fourth, Cr is         Singapore (aSG ) (SM equations 4 and 5).
assumed to represent a broad range of potential trans-                   ADP = ADP_RE × aSG ÷ aRE                 (3)
boundary atmospheric pollutants. This assumption is
based on empirical evidence from the same study site
in Singapore, from which it is clear that Cr concen-
trations vary over time in concert with other poten-         ADP_RE = S + WRE + WWD + WOF − WPR − WRF
tial transboundary atmospheric pollutants, including                    − WPT                                     (4)
lead, cadmium, zinc, copper and mercury [25, 40].
                                                               Step 3: Reconstruction of the flux of dry depos-
                                                           ition of Cr from local sources in Singapore (ADP_LE ).
2.3. Model development and application
                                                           Estimates were produced for three scenarios, which
A catchment-reservoir mass balance approach depict-
                                                           assume that the maximum annual contributions of
ing the movement of Cr in a hydrological system
                                                           local emissions to ADP from 1900 to 2017 are 75%,
and depositions of Cr in sediments [41] was adop-
                                                           50% and 25%, respectively, using 1972 as a refer-
ted. Following existing studies [32, 33, 42], we defined
                                                           ence year, when local emissions of Cr peaked [45] to
a ‘catchment-reservoir system’ (the sampling site),
                                                           determine the percentage of local Cr emissions that
and a ‘Singapore system’, comprising all terrestrial
                                                           were deposited within Singapore (SM equations 6 and
areas of Singapore and hereafter referred to simply
                                                           7). Data on local Cr emissions in Singapore from 1900
as Singapore, to construct a Cr budget (figure 2).
                                                           to 2017 were compiled through a NEI analysis [45].
Within the catchment-reservoir system, Cr inputs
                                                               Step 4: Reconstruction of the flux of dry depos-
(from dry deposition (ADP_RE ), precipitation (WPR ),
                                                           ition of Cr from transboundary sources (ADP_TAPin )
catchment runoff (WRF ), and pumped water (WPT ))
                                                           through mass balance using data generated in Step 2
were assumed to be equal to the sum of Cr storage (in
                                                           and 3 for Singapore (equation 5; SM equation 8). We
sediment (S) and reservoir water (WRE )) and Cr out-
                                                           assumed ADP_BG equal to the mean value of ADP from
puts (through water overflow (WOF ) and withdrawal
                                                           1900 to 1920 when ADP was in the lowest level.
(WWD )).
    Within Singapore, the total dry deposited Cr                    ADP_TAPin = ADP − ADP_LE − ADP_BG             (5)
(ADP ) was assumed to be equal to the sum of
dry deposited Cr from anthropogenic transbound-            2.4. Sample collection
ary sources (ADP_TAPin ), anthropogenic local sources      Five sediment cores were collected from the reservoir
(ADP_LE ), and natural sources (ADP_BG ). Based on this    in June 2017 using a UWITECTM gravity corer. The
framework, four steps were taken to determine the          five cores were collected from the eastern (Core 1 and
component of transboundary Cr pollution (SM sec-           Core 2), central (Core 3 and Core 4), and western
tion 1.1):                                                 (Core 5) sections of the reservoir (table 1). All cores
    Step 1: Reconstruction of annual Cr fluxes in          were subsampled at 1 cm vertical intervals upon col-
water (W) and sediments (S) in the catchment-              lection. Following the United States Geological Sur-
reservoir system following approaches from Yang et al      vey water sampling protocol [46], water samples were
[43] and Sarkar et al [44]. The former was calcu-          collected from the reservoir (12 samples), main inflow
lated for catchment runoff, precipitation, reservoir       streams (four samples), reservoir overflows (three
water, pumped water, withdrawal, and overflow (x)          samples) and rainwater (ten samples) from June to
based on Cr concentrations in water (wc) and hydro-        December 2017 (SM section 2.1, SM figure 1). It was
logical fluxes (Q) (equation 1, provided in full in        not possible to sample the water that is occasionally
SM equations 1 and 2). The latter was calculated           pumped to the study site to adjust water levels in the
for the whole reservoir from five sediment cores (j)       reservoir because the inlet was inaccessible.
using information including sediment Cr concentra-             Historical economic, meteorological, and hydro-
tions (sc), sedimentation rates (δ), sediment focusing     logical data were also collected from a variety of
factors (γ), and represented reservoir areas (a) (equa-    sources, including government statistical reports,
tion 2, provided in full in SM equation 3).                third-party open databases, peer-reviewed publica-
                                                           tions, and local newspapers (SM section 2.2, SM
                       Wx = wcx × Qx                (1)    figures 2 and 3).
                                              4
Environ. Res. Lett. 15 (2020) 1040a5 Q Chen et al
Figure 1. (a) Southeast Asia with locations of ten member states of the Association of Southeast Asian Nations shown. Impact
range of monsoons are indicated by 72-hour air mass back trajectories in 2017, using Singapore as the destination with the
computing height of 100 meters above ground level. Coal-fired power plants and the corresponding flue gas volumes, which are
possible sources of transboundary Cr pollution, are indicated using data from Koplitz et al [13]. (b) Location of Singapore, the
Central Catchment Natural Reserve (in green), and the targeted reservoir. Possible sources of Cr in Indonesia and Malaysia within
a 30 km radius from Singapore are also indicated, including steel and iron works, cement works, refractory and surface treatment
works, and coal-fired power plants. The major maritime international shipping routes, important sources of pollution emissions,
are shown on both panels.
Figure 2. Mass balance of Cr for Singapore and the catchment-reservoir system. Numbers are Cr budgets in the Singapore system
(red) and the catchment-reservoir system (purple) in 2017. ATAPin is the Cr input from transboundary atmospheric pollution. ALE
is the input of Cr from local emission sources. ABG is the Cr input from natural sources. A is the total received Cr in Singapore.
ATAPout is the Cr output from Singapore, including contributions from local, transboundary and natural sources. ADP_TAPin is the
dry deposition of Cr from transboundary sources. ADP_BG is the dry deposition of Cr from natural sources. ADP_LE is the dry
deposition of Cr from local sources. ADP is the total dry deposition of Cr in Singapore. ADP_RE is the total dry deposition of Cr to
the reservoir surface. WRF is the Cr input to the reservoir through catchment runoff. WPR is the Cr input to the reservoir surface
through direct precipitation. WPT is the Cr input to the reservoir through water pumping from adjacent rivers and reservoirs.
T is the total Cr input to the reservoir. WOF is the Cr output through water overflow. WWD is the Cr output through water
withdrawal for domestic consumption. WRE is the Cr storage in the reservoir water. S is the Cr storage in the reservoir sediments.
Estimates in red are Cr fluxes in Singapore, and those in purple are Cr fluxes in the catchment-reservoir system.
2.5. Analytical procedures plasma mass spectrometry following protocols estab-
Concentrations of Cr in sediment samples lished by the United States Environmental Protection
(mg Cr kg−1 ) and water samples (µg Cr l−1 ) were Agency [47, 48]. Triplicate measurements, replication
determined by inductively coupled plasma optical tests and spike sample tests were also performed (SM
emission spectrometry and inductively coupled section 2.3).
5Environ. Res. Lett. 15 (2020) 1040a5 Q Chen et al
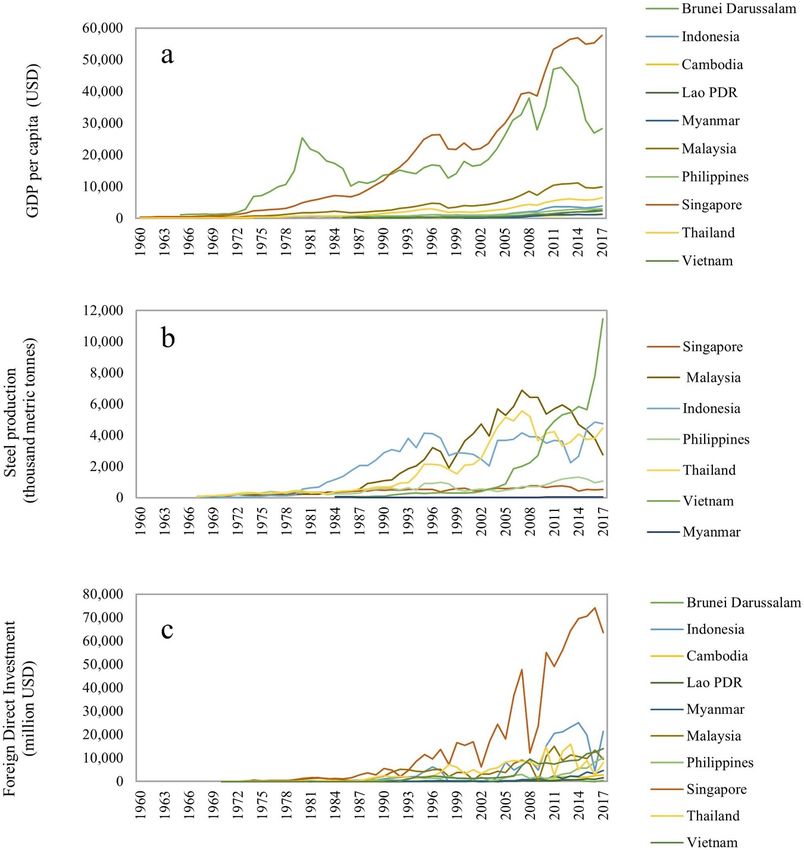
Figure 3. Temporal variations in the Cr budget for Singapore from 1900 to 2017. (a) Mean Cr fluxes in sediments and water
budget components for the study reservoir. See SM sections 3.5 and 3.6 for details. (b) The flux of total dry deposition of Cr to
Singapore, flux of dry deposition from natural sources, and flux of dry deposition from local sources under three scenarios which
assume that the maximum contributions of local emissions (ADP_LE ) to total dry deposition of Cr (ADP ) are 75%, 50% and 25%.
Grey areas represent the upper and lower error bounds aggregated from all the errors involved in the Cr budget calculations. Green
areas represent the upper and lower error bounds of possible natural background deposition of Cr, determined using the upper
and lower error bounds of the total dry deposition of Cr from 1900 to 1920, respectively. (c) The flux of dry deposition of Cr from
transboundary sources. Grey areas represent the possible uncertainties involved in the whole mass balance-based calculation
process for Singapore under Scenario 3, in which we defined the maximum annual contribution of ADP_LE to ADP to be 25%. The
yellow line is the polynomial fit line. d) Contributions of dry deposition of Cr from natural sources, transboundary sources, and
local sources under Scenario 3 to the total dry deposition of Cr in Singapore. Contributions were calculated using mean fluxes.
Chronological control was established for sedi- sedimentation rates and sediment focusing, both of
mentary evidence by the radiometric dating of sedi- which are useful in determining sediment Cr fluxes
ment cores 1 and 3, based on activities of the isotopes (SM section 2.4).
210
Pb [25]. The ages of material in cores 2, 4, and 5 Contemporary Cr concentrations of water
were estimated through a process of sequence slot- samples were used in the estimation of historical Cr
ting involving comparisons across all five cores based fluxes due to a lack of historical measurements. Addi-
on up-core variations in the abundances of spher- tionally, WPT was not included in the calculation of
oidal carbonaceous particles [49], organic-content Cr budget owing to a lack of complete time-series
based on loss-on-ignition analysis, and concentra- records. Errors induced by using static concentra-
tions of zinc (SM figure 4). Core sequence slotting tions and excluding WPT are discussed in SM section
was performed using CPLslot software V.2.4 [50]. 4.1. Given that our calculation of Cr fluxes is based
Chronological control also yields information on on a variety of data and associated expressions of
6Environ. Res. Lett. 15 (2020) 1040a5 Q Chen et al
Figure 4. Error analyses. (a) Fluxes of dry deposition of Cr from transboundary sources to Singapore under two scenarios.
Scenario A based on 60% of the mean Cr concentrations in water was selected in order to accommodate the possible range of
errors induced by adopting static contemporary Cr concentrations in the estimation of historical dry Cr deposition. The figure of
60% is based on a study of Cr concentrations in rainwater in Singapore in 2000 (84 samples, mean 1.62 µg l−1 , or 60% of the level
in 2017) [51]. Scenario B that includes consideration of pumped water aims to accommodate the possible range of errors induced
by excluding pumped water in the Cr budget calculation. (b) Possible range of dry deposition of Cr from transboundary sources
under different scenarios with a chronological error of ± 6 years from the 1960s to the 1980s, when Cr deposition from local
sources was prominent. See SM section 4.1 for details.
error, the aggregated errors of Cr fluxes presented in Estimates of W generally remained stationary
this study only provide possible ranges of the mean over time, albeit with some interannual fluctuations
fluxes without any further numerical estimation of (figure 3(a), SM figure 13, and SM table 5). Res-
probability. ults show that WWD had the highest Cr flux at
8 ± 2 kg Cr yr−1 . By comparison, Cr fluxes of
3. Results and discussion the other budget components, namely WOF , WRE ,
WRF and WPR , ranged between 3 ± 1 kg Cr yr−1
3.1. Cr fluxes in sediments (S) and water (W) and 5 ± 1 kg Cr yr−1 . Estimates of W are associ-
(Step 1) ated with relatively small chronological errors as they
Estimates of S are relatively low for the period 1900 were determined based on documentary sources of
to ca. 1920 at around 4 ± 3 kg Cr yr−1 . This period hydrological information that include clear calendar
is also associated with the highest level of chro- dates.
nological uncertainty at ±11–17 years (figure 3(a), Measurements of Cr concentrations in reservoir
and SM sections 3.1–3.5, including SM figures 5–12 water samples (mean 1 µg l−1 , SM section 3.6) were
and SM tables 1–4). From the 1920s onwards, S all significantly below the safety benchmark adopted
increased and initially peaked at 10 ± 3 kg Cr yr−1 in Singapore and recommended by the World Health
in 1970 ± 6 years, following which it declined to a Organization (50 µg l−1 ) [34, 35]. Cr concentrations
low of 7 ± 1 kg Cr yr−1 , a level similar to that of in the surface sediment samples (16–30 mg kg−1 ,
the 1950s, by the end of the 1990s. From ca. 2000 SM section 3.1.2) were also below the heavy metal
onwards, S increased again, peaking for a second time benchmarks adopted in Canada (37 mg kg−1 ) [54]
at 13 ± 2 kg Cr yr−1 in 2017 ± 2 years. and the United States (43.4 mg kg−1 ) [55].
7Environ. Res. Lett. 15 (2020) 1040a5 Q Chen et al
Figure 5. Key economic indicators for ten countries comprising the Association of Southeast Asian Nations (ASEAN). (a)
Time-series of GDP per capita in the ten ASEAN nations from 1960 to 2017 [20]. (b) Time-series of steel production in seven
ASEAN nations from 1967 to 2017 [52]. (c) Time-series of Foreign Direct Investment net inflows to the ASEAN nations from
1970 to 2017 [53].
3.2. Total dry deposition of Cr (ADP ) (Step 2) to 1945 when bombing and associated civil strife
ADP was at its lowest for the entire record between and disruptions to water supplies occurred in Singa-
1900 and 1920 at 5 ± 2 tonne Cr yr−1 (figure 3(b)). pore [27]. From the 1950s, ADP commenced a steady
This low-level was assumed to approximate to the increase at an average rate of 2% per year, peak-
natural background baseline and accords with a neg- ing at 12 ± 3 tonne Cr yr−1 in 1970 ± 6 years. An
ligible intensity of Cr-emitting anthropogenic activ- abrupt deviation in steadily increasing ADP occurred
ities in both Singapore and SEA at the time; there in the early 1960s possibly due to the effects of severe
was only one Cr emission source in Singapore before drought conditions that persisted in Singapore and
1920, a privately-owned coal-fired power plant (capa- neighbouring parts of the region from 1961 to 1963
city of 2 megawatts) [56] and there were no large- [57] when annual precipitation and catchment runoff
scale coal-fired power plants in SEA before 1960 [13]. were ca. 20% lower than average [27] (SM figure 13).
From the 1920s onwards, ADP slowly increased until Following its ca. 1970 peak, ADP declined slightly to
the early 1940s, when an abrupt increase in fluxes 10 ± 2 tonne Cr yr−1 in 2000 ± 2 years. Two obvious
from 6 ± 3 tonne Cr yr−1 in 1942 ± 12 years to but short-lived declines in ADP occurred during the
10 ± 3 tonne Cr yr−1 in 1946 ± 12 years occurred. 1970s, which could reflect the effects of two droughts
This major change may have been linked to dis- recorded in Singapore in 1971 and 1976 (SM sec-
turbances associated with World War II from 1942 tion 2.2.2). Noted that the drought-induced drops in
8Environ. Res. Lett. 15 (2020) 1040a5 Q Chen et al
ADP might be overestimated based on equation (3), from transboundary sources from the 1900s to 1940s
considering the reduced but unknown lake area over accords with limited economic activity in neighbour-
the duration of the drought. From ca. 2000 onward, ing parts of SEA, as is evident in GDP per capita data
ADP started to increase for a second time, peaking at [60]. In the 1950s, ADP_TAPin slightly increased from
16 ± 3 tonne Cr yr−1 in 2017 ± 1 year. 3 ± 3 tonne Cr yr−1 to 5 ± 4 tonne Cr yr−1 , with
a potential overestimation of 6% of ADP_TAPin in the
3.3. Local sources of dry deposition of Cr (ADP _LE ) 1950s arising from the adoption of static Cr water
(Step 3) concentrations and the exclusion of WPT (figure 4(a),
A thorough discussion of local Cr emissions is SM section 4.1). This slow and small increase in TAP
presented in Chen and Taylor [45]. Local Cr emis- may reflect nascent economic development, post-
sions are associated with limited chronological errors World War II, in the form of the early stages of indus-
as they were determined based on dated annual trialisation and urbanisation in the region.
statistical reports and newspaper articles. In brief, Scenario 3 appears to result in the most reliable
a NEI analysis of Cr in Singapore from 1900 to estimate of ADP_TAPin from the 1960s to the 1980s,
2017 showed that local emissions were relatively low which indicates a stable level of deposition of around
(Environ. Res. Lett. 15 (2020) 1040a5 Q Chen et al
Industrial development was more widespread in the levels of pollution, including Cr [79–81], and are
region at the time, judging from the 44% increase thus highly likely to have contributed to a rising
of nitrogen oxide and 40% increase of sulfur diox- trend of ADP_TAPin in Singapore over the past two
ide emissions in SEA over the same decade [66, 67]. decades.
As opposed to the previously low and stable levels
of deposition, this increasing trend since the 1990s 4. Conclusion
provides unambiguous evidence of rising trans-
boundary Cr pollution in Singapore. Our study adopted a catchment-reservoir mass bal-
ADP_TAPin rose rapidly from ca. 2000 at an ance approach and reconstructed variations in trans-
average rate of about 3% per year, doubling to boundary sources of Cr in Singapore from 1900 to
11 ± 3 tonne Cr yr−1 , or 15 ± 4 kg km−2 yr−1 , in 2017. A doubling of dry deposition of Cr attests a sub-
2017 ± 2 year, under all three scenarios. The estimate stantial increase in transboundary pollution received
accords with the results of other studies in urban areas in Singapore since the 2000s. Many ASEAN countries
across the world, ranging from 10–63 kg km−2 yr−1 are currently undergoing rapid industrialisation, and
[68, 69] (SM section 4.2, SM table 6). The use of con- the region is projected to become the world’s fourth-
stant contemporary Cr water concentrations and the largest economy by 2030 [82]. Economic develop-
exclusion of WPT have limited impacts on both the ment is, however, potentially associated with adverse
estimates (average overestimation of 12%) and the environmental impacts that clearly go beyond those
overall increasing trend (figure 4(a)). The contribu- primarily associated with biomass burning. Our study
tion of ADP_TAPin to ADP rose from ca. 50% in 2000 provides strong evidence of an increasing trend of
to ca. 70% in 2017, with natural sources account- non-biomass burning-related TAP within SEA. If no
ing for the remainder as local emissions remained effective measures are taken to regulate such pollu-
negligible. The rapid increase in ADP_TAPin from 2000 tion, SEA may become a major source of TAP to
to 2017, in agreement with the increasing regional other parts of the world, including neighbouring East
mean concentrations of ambient PM2.5 by 2.7% per Asia, by 2030 [13], and could undermine attempts
year since 2000 [70], is amongst the highest in the to achieve regional sustainable development and to
world [71]. Simultaneously, Singapore experienced a meet the UN SDGs within the stated timeframes.
decrease of 1% per year in mean visibility [72]. This There is an urgent need to reduce pollution gener-
decrease of visibility does not accord with the effective ally in the region, including that from non-biomass
enforcement of stringent environmental regulations burning-related sources. Based on experiences in
in Singapore [73], which has significantly alleviated other parts of the world, the most effective way of
local pollution, as evidenced by the low levels of local reducing emissions would be through regional col-
Cr emissions [45]. laboration and the implementation of agreed, region-
There are three possible reasons for the rapid wide regulations.
increase in ADP_TAPin after 2000. First, accelerating
economic growth in the region (figure 5(a)), driven Acknowledgments
at least in part by a six-fold increase in foreign direct
investment (figure 5(c)) [53]. These capital inflows We thank Public Utilities Board, Singapore’s National
were mainly oriented towards Cr-emitting industries, Water Agency, and National Park Board for granting
such as steel manufacturing (figure 5(b)), and energy us permission and providing access to the reservoir
production (figure 1(a)) in order to boost export- and catchment. We especially thank Elvagris Segovia
oriented industrialisation [74]. Second, the reloca- for extensive assistance with lab work. We also thank
tion and aggregation of industries in the context of Tay Hui Pin Shermaine, Heng Su Li, Alex Finnegan,
free trade and globalisation. A possible case asso- and Wayne Bannister for their valuable suggestions
ciated with this type of pollution is the Singapore- and comments on earlier versions of this paper.
Malaysia-Indonesia Growth Triangle scheme, which We are indebted to Academic Research Fund Tier 1
involves locating labour-intensive and pollutive man- (FY2017-FRC1-005) from the Ministry of Education
ufacturing factories in Indonesia and Malaysia, with (MoE), Singapore for financial support, and to the
cleaner high-tech and services industries based in MoE, Singapore for a Ph.D. Research Scholarship to
Singapore [75]. Cr emissions generated from indus- CQ. CG was partially supported by the National Uni-
trial centres located in neighbouring parts of Indone- versity of Singapore start-up grant (R-109-000-223-
sia and Malaysia (figure 1(b)) are relatively easily 133). We also thank the two anonymous reviewers for
transported to Singapore by the prevailing monsoon their valuable suggestions to improve the paper.
winds due to their close proximity [45]. Third, rising
levels of maritime pollution. The port of Singapore Data availability statement
ranks as the second largest in the world in terms of
volume of container traffic [76]. The number of ships All data that support the findings of this study are
docking in Singapore in 2017 was 16 times the num- included within the article (and any supplementary
ber recorded in 1985 [77, 78]. Ships emit substantial information files).
10Environ. Res. Lett. 15 (2020) 1040a5 Q Chen et al
Conflict of interest management strategies to reduce downwind smoke exposure
Environ. Res. Lett. 11 094023
[15] United Nations General Assembly 2017 Global Indicator
The authors declare that there is no potential and/or
Framework for the Sustainable Development Goals and Targets
relevant competing financial or other interest. of the 2030 Agenda for Sustainable Development (New York:
United Nations Publication)
[16] Betha R, Behera S N and Balasubramanian R 2014 2013
ORCID iDs Southeast Asian smoke haze: fractionation of
particulate-bound elements and associated health risk
Qinqin Chen https://orcid.org/0000-0002-1354- Environ. Sci. Technol. 48 4327–35
[17] Urbančok D, Payne A J and Webster R D 2017 Regional
0263 transport, source apportionment and health impact of PM10
Suzanne McGowan https://orcid.org/0000-0003- bound polycyclic aromatic hydrocarbons in Singapore’s
4034-7140 atmosphere Environ. Pollut. 229 984–93
Chris Gouramanis https://orcid.org/0000-0003- [18] Hansen A B, Witham C S, Chong W M, Kendall E,
Chew B N, Gan C, Hort M C and Lee S-Y 2019 Haze in
2867-2258 Singapore–source attribution of biomass burning PM 10
Letisha Fong https://orcid.org/0000-0002-2057- from Southeast Asia Atmos. Chem. Phys.
1906 19 5363–85
Rajasekhar Balasubramanian [19] See S, Balasubramanian R and Wang W 2006 A study of the
physical, chemical, and optical properties of ambient aerosol
https://orcid.org/0000-0002-5627-3628 particles in Southeast Asia during hazy and nonhazy days J.
Geophys. Res.: Atmos. 111 D10S08
[20] World Bank 2020 GDP per capita of ASEAN member
References nations 1970–2017 (current US$) (available
from: https://data.worldbank.org/indicator/IS.AIR.
[1] Arya S P 1999 Air Pollution Meteorology and Dispersion (New PSGR?locations=BN-TH-SG-ID-KH-MY-MM-PH-VN-LA)
York: Oxford University Press) [21] Nriagu J O and Nieboer E 1988 Chromium in the Natural
[2] United Nations 1997 Glossary of Environment Statistics (New and Human Environments (New York: Wiley)
York: United Nations Publication) [22] Friess D A and Oliver G J H 2015 Dynamic Environments of
[3] Fenger J 2009 Air pollution in the last 50 years–from local to Singapore (Singapore: McGraw Hill)
global Atmos. Environ. 43 13–22 [23] Meteorological Service Singapore 2020 Climate of
[4] Forsyth T 2014 Public concerns about transboundary haze: a Singapore (available from: www.weather.gov.sg/
comparison of Indonesia, Singapore, and Malaysia Glob. climate-climate-of-singapore/)
Environ.l Change 25 76–86 [24] Yue C S 2001 Singapore: towards a knowledge-based
[5] Biswas A K and Tortajada C 2018 Pollution across borders: economy Industrial Restructuring in East Asia: Towards the
transboundary fire, smoke and haze in Southeast Asia 21st Century 25 169–208
(Chapter 1) Managing Indonesian Haze: Complexities and [25] Fong L, Leng M and Taylor D 2019 A century of
Challenges, ed E Quah (Singapore: World Scientific anthropogenic environmental change in tropical Asia:
Publishing Co. Pte Ltd) 1–18 multi-proxy palaeolimnological evidence from Singapore’s
[6] Lee H-H, Bar-Or R Z and Wang C 2017 Biomass burning Central Catchment The Holocene 30 1
aerosols and the low-visibility events in Southeast Asia [26] Tan Y S, Lee T J and Tan K and Institute of Southeast Asian S
Atmos. Chem. Phys. 17 965–80 2009 Clean, Green and Blue: Singapore’s Journey Towards
[7] Lee J S H, Jaafar Z, Tan A K J, Carrasco L R, Ewing J J, Environmental and Water Sustainability
Bickford D P, Webb E L and Koh L P 2016 Toward clearer (Singapore: ISEAS)
skies: challenges in regulating transboundary haze in [27] Water Department of Singapore 1976 Annual Report of the
Southeast Asia Environ. Sci. Policy 55 87–95 Water Department 1942, 1946-1947, 1950, 1952, 1954, 1956,
[8] Murdiyarso D, Lebel L, Gintings A, Tampubolon S, Heil A 1958-1962, 1964-1976 Singapore
and Wasson M 2004 Policy responses to complex [28] Singapore Water Department 1973 How Singapore Gets Its
environmental problems: insights from a science–policy Water Supply (Singapore: Singapore Water Department)
activity on transboundary haze from vegetation fires in [29] Binnie, Partners 1981 Report on Singapore water supply
Southeast Asia Agric. Ecosyst. Environ. 104 47–56 Singapore National University of Singapore
[9] ASEAN Secretariat 2002 ASEAN Agreement on [30] Zhao J, Broms B B, Zhou Y and Choa V 1994 A study of the
Transboundary Haze Pollution (Jakarta, Indonesia: weathering of the bukit timah granite part a: review, field
Association of Southeast Asian Nations) observations and geophysical survey Bull. Int. Assoc. Eng.
[10] Lee -H-H, Iraqui O, Gu Y, Yim S H-L, Chulakadabba A, Geol. 49 97–106
Tonks A Y-M, Yang Z and Wang C 2018 Impacts of air [31] Simson I 1970 Singapore: Too Little, Too Late: The Failure of
pollutants from fire and non-fire emissions on the Malaya’s Defences in 1942 (Canberra, Australia: Asia Pacific
regional air quality in Southeast Asia Atmos. Chem. Phys. Press)
18 6141–56 [32] Kenney W F, Whitmore T J, Buck D G, Brenner M,
[11] Jiang X-Q and Mei X-D F D 2016 Air pollution and chronic Curtis J H, Di J J, Kenney P L and Schelske C L 2014
airway diseases: what should people know and do? J. Thorac. Whole-basin, mass-balance approach for identifying critical
Dis. 8 31–40 phosphorus-loading thresholds in shallow lakes J.
[12] Chen Q and Taylor D 2018 Transboundary atmospheric Paleolimnol. 51 515–28
pollution in Southeast Asia: current methods, limitations [33] Engstrom D R and Rose N L 2013 A whole-basin,
and future developments Crit. Rev. Environ. Sci. Technol. mass-balance approach to paleolimnology J. Paleolimnol.
48 1–33 49 333–47
[13] Koplitz S N, Jacob D J, Sulprizio M P, Myllyvirta L and [34] WHO Press 2017 Guidelines for Drinking-Water Quality
Reid C 2017 Burden of disease from rising coal-fired power (Geneva: WHO Press) (https://apps.who.
plant emissions in Southeast Asia Environ. Sci. Technol. int/iris/bitstream/handle/10665/254637/9789241549950-
51 1467–76 eng.pdf?sequence=1)
[14] Koplitz S N et al 2016 Public health impacts of the severe [35] World Health Organization 2019 Environmental Public
haze in Equatorial Asia in September–October 2015: Health (Water Suitable for Drinking) Regulations (Geneva:
demonstration of a new framework for informing fire WHO)
11Environ. Res. Lett. 15 (2020) 1040a5 Q Chen et al
[36] Nriagu J O and Pacyna J M 1988 Quantitative assessment of www.singstat.gov.sg/find-data/search-by-theme/
worldwide contamination of air, water and soils by trace economy/national-accounts/l)
metals Nature 333 134–9 [60] Avakov A V 2015 Two Thousand Years of Economic Statistics,
[37] Nriagu J O 1989 A global assessment of natural sources of Years 1–2012: Population, GDP at PPP, and GDP per Capita.
atmospheric trace metals Nature 338 47–49 Volume 1, by Rank (New York: Algora Publishing)
[38] Santonen T 2009 Inorganic Chromium (III) Compounds [61] Baek J 2016 A new look at the FDI–income–energy–
(Geneva, Switzerland: WHO Press) environment nexus: dynamic panel data analysis of ASEAN
[39] Kimbrough D E, Cohen Y, Winer A M, Creelman L and Energy Policy 91 22–27
Mabuni C 1999 A critical assessment of chromium in the [62] Rasiah R and Yun H A 2009 Industrializing Southeast Asia J.
environment Crit. Rev. Environ. Sci. Technol. 29 1–46 Asia Pac. Econ. 14 107–15
[40] Chen M, Boyle E A, Switzer A D and Gouramanis C 2016 A [63] Japan National Institute of Development Administration
century long sedimentary record of anthropogenic lead (Pb), United Nations Centre for Regional Development (ed) 1989
Pb isotopes and other trace metals in Singapore Environ. Report and Summary of Proc. of the Int. Seminar on
Pollut. 213 446–59 Industrialization and Development: Focus on ASEAN (21–26
[41] Blais J M, Rosen M R and Smol J P 2015 Environmental August) (Bangkok, Thailand: United Nations Centre for
Contaminants: Using Natural Archives to Track Sources and Regional Development)
Long-term Trends of Pollution (Berlin: Springer) [64] Stubbs R 1999 War and economic development:
[42] Heyvaert A C, Reuter J E, Slotton D G and Goldman C R export-oriented industrialization in East and Southeast Asia
2000 Paleolimnological reconstruction of historical Comp. Polit. 31 337–55
atmospheric lead and mercury deposition at Lake Tahoe, [65] U.S. Energy Information Administration 2020 International
California-Nevada Environ. Sci. Technol. 34 3588–97 Energy Statistics (available from: www.eia.gov/beta/
[43] Yang H, Rose N L, Battarbee R W and Boyle J F 2002 Mercury international/data/browser/)
and lead budgets for Lochnagar, a Scottish mountain lake [66] Ohara T, Akimoto H, Kurokawa J-I, Horii N, Yamaji K,
and its catchment Environ. Sci. Technol. 36 1383–8 Yan X and Hayasaka T 2007 An Asian emission inventory of
[44] Sarkar S et al 2015 History of atmospheric deposition of anthropogenic emission sources for the period 1980–2020
trace elements in lake sediments,~ 1880 to 2007 J. Geophys. Atmos. Chem. Phys. 7 4419–44
Res.: Atmos. 120 5658–69 [67] Akimoto H 2003 Global air quality and pollution Science
[45] Chen Q and Taylor D 2020 Economic development and 302 1716–9
pollution emissions in Singapore: evidence in support of the [68] Saha R, Nandi R and Saha B 2011 Sources and toxi-
Environmental Kuznets Curve hypothesis and its city of hexavalent chromium J. Coord. Chem.
implications for regional sustainability J. Clean. Prod. 64 1782–806
243 118637 [69] Moaref S, Sekhavatjou M S and Alhashemi A 2014
[46] Shelton L R 1994 Field guide for collecting and processing Determination of trace elements concentration in wet and
stream-water samples for the National Water-Quality dry atmospheric deposition and surface soil in the largest
Assessment Program USGS Earth Science Information Center. industrial city, Southwest of Iran Int. J. Environ. Res.
Report No.: 2331-1258 8 335–46
[47] United States Environmental Protection Agency 2007 [70] Van Donkelaar A, Martin R V, Brauer M and Boys B L 2014
Method 3051A: microwave assisted acid digestion of Use of satellite observations for long-term exposure
sediments, sludges, soils, and oils (Washington, DC: EPA) assessment of global concentrations of fine
[48] United States Environmental Protection Agency 2007 particulate matter Environ. Health Perspect.
Method 3015A: microwave assisted acid digestion of aqueous 123 135–43
samples and extracts (Washington, DC: EPA) [71] United Nations Economic and Social Council 2019
[49] Rose N L 2015 Spheroidal carbonaceous fly ash particles Special Edition of the Sustainable Development Goals
provide a globally synchronous stratigraphic marker for the Progress Report, Supplementary Information,
Anthropocene Environ. Sci. Technol. 49 4155–62 E/2019/68
[50] Thompson R, Clark R M and Boulton G S 2012 Core [72] U.S. National Oceanic and Atmospheric Administration
correlation Tracking Environmental Change Using Lake 2019 Global Surface Summary of the Day - GSOD-Mean
Sediments (Berlin: Springer) pp 415–30 visibility National Climatic Data Center, NESDIS, NOAA,
[51] Hu G-P and Balasubramanian R 2003 Wet deposition of U.S. Department of Commerce (Accessed 5 June 2019)
trace metals in Singapore Water Air Soil Pollut. 144 285–300 available from: (www.ncei.noaa.gov/data/global-summary-
[52] World Steel Association 2020 Steel Statistical Yearbook of-the-day/access/)
1978–2018 (available from: www.worldsteel.org/steel-by- [73] Lye L-H et al 2014 Environmental Law, Policy, Governance
topic/statistics/steel-statistical-yearbook-.html) and Management for Cities: getting it right for a sustainable
[53] World Bank 2020 Foreign Direct Investment, net inflows future — the Singapore experience ed J Huang and S Gupta
1970–2017 (available from: https://data.worldbank.org/ (Singapore: World Scientific Pub. Co.) 171–201
indicator/BX.KLT.DINV.CD.WD?locations=SG-ID-MY- [74] Sussangkarn C, Pak Y-C and Kang S-J 2011 Foreign Direct
TH-PH-KH-LA-VN-BN-MM) Investments in Asia (New York: Routledge)
[54] Canadian Council of Ministers of the Environment 2001 [75] Stewart T P and Png M L 1993 The growth of triangle of
Canadian Sediment Quality Guidelines for the Protection of Singapore, Malaysia and Indonesia Georgia J. Int. Comp. Law
Aquatic Life (Winnipeg, MB: CCME) 23 1
[55] United States Environmental Protection Agency 2006 [76] World Shipping Council 2017 Top 50 World Container Ports
Freshwater Sediment Screening Benchmarks (Washington, (available from: www.worldshipping.org/about-the-
DC: EPA) industry/global-trade/top-50-world-container-ports)
[56] Anonymous 1927 The Electricity Supply The Straits Times 9 [77] Maritime and Port Authority of Singapore 2020 Vessel calls
https://eresources.nlb.gov.sg/newspapers/Digitised/Article/ by purpose (available from: www.mpa.gov.sg/web/
straitstimes19271020.2.54 portal/home/maritime-singapore/port-statistics)
[57] Anonymous 1961 Drought dries up reservoir in Singapore [78] Anonymous 1985 PSA’s containerised cargo throughput
The Straits Times 11 https://eresources.nlb.gov.sg/ leads the way Bus. Times 13 (https://eresources.nlb.
newspapers/Digitised/Article/straitstimes19610625-1.2.55 gov.sg/newspapers/Digitised/Article/biztimes19851111-
[58] The Anti-Pollution Unit of Singapore 1971 The Clean Air 1.2.37.2)
Act 1971 (Act 29 of 1971) [79] Breitling U (ed) 2010 Sustainable shipping and port
[59] Singapore Department of Statistics 2020 Gross domestic development The Fifth Regional Environmental
production (GDP) by industry, 1960–2018 (available from: Sustainable Transport Forum in Asia (Bangkok,
12Environ. Res. Lett. 15 (2020) 1040a5 Q Chen et al
Thailand) 1–9 (www.uncrd.or.jp/content/documents/ [81] Johansson L, Jalkanen J-P and Kukkonen J 2017 Global
5EST-P4-BGP2.pdf) assessment of shipping emissions in 2015 on a high
[80] Corbett J J, Winebrake J J, Green E H, Kasibhatla P, spatial and temporal resolution Atmos. Environ.
Eyring V and Lauer A 2007 Mortality from ship 167 403–15
emissions: a global assessment Environ. Sci. Technol. [82] Chan C S 2018 A Resilient and Future-Ready ASEAN ASEAN
41 8512–8 Econ. Integr. Brief 11 2–4
13You can also read