Observation, Preconditioning and Recurrence of Exceptionally High Salinities in the Adriatic Sea - Frontiers
←
→
Page content transcription
If your browser does not render page correctly, please read the page content below
ORIGINAL RESEARCH
                                                                                                                                                        published: 06 July 2021
                                                                                                                                              doi: 10.3389/fmars.2021.672210

                                              Observation, Preconditioning and
                                              Recurrence of Exceptionally High
                                              Salinities in the Adriatic Sea
                                              Hrvoje Mihanović 1* , Ivica Vilibić 1,2 , Jadranka Šepić 3 , Frano Matić 1 , Zrinka Ljubešić 4 ,
                                              Elena Mauri 5 , Riccardo Gerin 5 , Giulio Notarstefano 5 and Pierre-Marie Poulain 5
                                              1
                                                Institute of Oceanography and Fisheries, Split, Croatia, 2 Division for Marine and Environmental Research, Ruder   ¯ Bošković
                                              Institute, Zagreb, Croatia, 3 Faculty of Science, University of Split, Split, Croatia, 4 Faculty of Science, Department of Biology,
                                              University of Zagreb, Zagreb, Croatia, 5 National Institute of Oceanography and Applied Geophysics - OGS, Sgonico, Italy

                                              The paper aims to describe the preconditioning and observations of exceptionally high
                                              salinity values that were observed in summer and autumn of 2017 in the Adriatic. The
                                              observations encompassed CTD measurements carried out along the well-surveyed
                                              climatological transect in the Middle Adriatic (the Palagruža Sill, 1961–2020), Argo
                                              profiling floats and several glider missions, accompanied with satellite altimetry and
                                              operational ocean numerical model (Mediterranean Forecasting System) products.
                                              Typically, subsurface salinity maximum, with values lower than 39.0, is observed in the
                                              Southern Adriatic (usually between 200 and 400 m), related to ingressions of saltier and
                             Edited by:
                      Katrin Schroeder,       warmer waters originating in the eastern Mediterranean (Levantine Intermediate Water—
Institute of Marine Science (CNR), Italy      LIW). However, seasonally strong inflow of warm and high salinity waters (S > 38.8)
                         Reviewed by:         has been observed much closer to the surface since spring 2015. The main LIW core
            Francesco Marcello Falcieri,
Institute of Marine Science (CNR), Italy      deepened at the same time (to 400–700 m). Such double-maxima vertical pattern was
                      Dimitris Velaoras,      eventually disturbed by winter convection at the beginning of 2017, increasing salinities
  Hellenic Centre for Marine Research
                                              throughout the water column. A new episode of very strong inflow of high salinity waters
                       (HCMR), Greece
                                              from the Northern Ionian was observed in late winter and spring of 2017, this time
                  *Correspondence:
                     Hrvoje Mihanović        restricted almost to the surface. As most of 2017 was characterized by extremely dry
              hrvoje.mihanovic@izor.hr        conditions, low riverine inputs and warmer than usual summer over the Adriatic and
                    Specialty section:
                                              Northern Ionian, salinity values above the sharp and shallow (15–40 m) thermocline
          This article was submitted to       significantly increased. The maximum recorded salinity was 39.26, as measured by the
               Physical Oceanography,         Argo float in the Southern Adriatic. Surface salinity maximum events, but with much
                a section of the journal
           Frontiers in Marine Science        lower intensity, have been documented in the past. Both past events and the 2017
         Received: 25 February 2021           event were characterized by (i) concurrence with overall high salinity conditions and
           Accepted: 09 June 2021             cyclonic or transitional phase of the Adriatic-Ionian Bimodal Oscillating System, (ii) very
            Published: 06 July 2021
                                              low river discharges preconditioning the events for a year or more, (iii) higher-than-
                                Citation:
        Mihanović H, Vilibić I, Šepić J,
                                              average heat fluxes during most of the summer and early autumn periods, forming a
Matić F, Ljubešić Z, Mauri E, Gerin R,      stable warm layer above the thermocline, and (iv) higher-than-average E-P (evaporation
     Notarstefano G and Poulain P-M           minus precipitation) acting on this warm surface layer. Importantly, the 2017 event was
 (2021) Observation, Preconditioning
and Recurrence of Exceptionally High          also preceded by strong near-surface inflow of very saline waters from the Northern
          Salinities in the Adriatic Sea.     Ionian in early 2017.
            Front. Mar. Sci. 8:672210.
    doi: 10.3389/fmars.2021.672210            Keywords: surface salinity maximum, heat fluxes, river discharges, decadal salinity oscillations, Adriatic Sea

Frontiers in Marine Science | www.frontiersin.org                                      1                                                  July 2021 | Volume 8 | Article 672210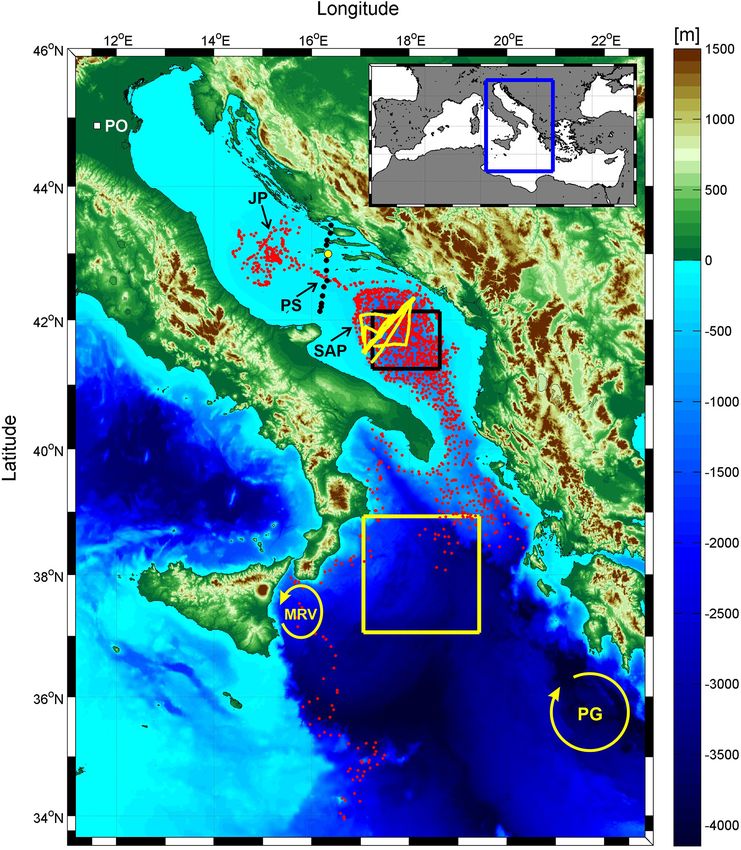
Mihanović et al.                                                                                                          High Salinities in the Adriatic

INTRODUCTION                                                                 Figure 1), that may redirect the path of the Mid-Ionian Jet
                                                                             and therefore re-shape the circulation in the Northern Ionian
For almost 70 years it has been known that the thermohaline and              Sea (Menna et al., 2019), (iii) climate change, as weakening of
biogeochemical conditions oscillate substantially in the Adriatic            the Adriatic-Ionian thermohaline circulation has been observed
Sea—the northernmost embayment of the Mediterranean Sea                      (Vilibić et al., 2013), or other.
(Figure 1)—over a decadal timescale (Buljan, 1953; Buljan and                    Substantial changes in thermohaline properties were observed
Zore-Armanda, 1976; Civitarese et al., 2010; Batistić et al.,               in both Adriatic and Eastern Mediterranean basins during the
2014; Dautović et al., 2017). These oscillations reflect changes            recent decades, which might be a reflection of ongoing climate
in the Adriatic-Ionian thermohaline circulation and are partly               change in the Mediterranean (Giorgi, 2006; Gualdi et al., 2013).
controlled by (i) the fresher waters originating from Northern               This includes the increase of sea surface temperatures throughout
Adriatic rivers, advected south-eastwards along the western                  the basin (Pastor et al., 2018), largely related to both climate
Adriatic shore (Western Adriatic Coastal Current, WACC, Orlić               warming and multidecadal oscillations originating from the
et al., 1992; Artegiani et al., 1997), and (ii) deep outflow driven by       North Atlantic (Marullo et al., 2011; Skliris et al., 2012; Macias
the dense water formation (DWF) events in the South Adriatic                 et al., 2013). Further, the substantial increase in surface salinity,
Pit (SAP) through wintertime open ocean convection (Gačić                  especially after 2006, has been observed, conjoined with the
et al., 2002) and on the Northern Adriatic shelf through extensive           reduction in advection of less saline Atlantic waters toward the
cooling (Bergamasco et al., 1999; Mihanović et al., 2013). The              Eastern Mediterranean (Kassis and Korres, 2020). The salinity
DWF processes generate both the North Adriatic Dense Water                   increase has peaked in recent years (0.14 over a year between
(NAdDW) and the Adriatic Deep Water (AdDW) that flow                         2015 and 2018, Grodsky et al., 2019). Such an increase might
along the western slope of the Adriatic (Artegiani and Salusti,              be relevant for the change of the LIW source characteristics
1987; Vilibić and Mihanović, 2013) and out of the Adriatic                 (Kubin et al., 2019), which in turn may change characteristics
(Gačić et al., 1996), supplying oxygen and other tracers to the            of the Western Mediterranean intermediate waters and alter the
deepest Eastern Mediterranean layers (Roether and Schlitzer,                 thermohaline characteristics of the whole basin (Ben Ismail et al.,
1991; Malanotte-Rizzoli et al., 1997). In turn, warmer and high              2014; Vargas-Yáñez et al., 2017). This can also impact salinity
salinity ultraoligotrophic waters from the Levantine basin (Krom             distribution in the Adriatic Sea, where a substantial increase in
et al., 1991, 2004), the so-called Levantine Intermediate Water              salinity and change in its structure have been recently recorded
(LIW, Zore-Armanda, 1963; Artegiani et al., 1997), are advected              (Kokkini et al., 2020).
toward the Northern Adriatic, along the eastern coastline within                 Recent Adriatic observations, mostly by Argo profilers in the
the Eastern Adriatic Current (EAC, Orlić et al., 1992).                     SAP between 2013 and 2016 and by CTD probes, reveal: (i)
    This complex thermohaline circulation is subject to significant          deepening of the saline LIW core from near-surface layers (50–
decadal variability which is related to the basin-wide circulation           100 m) in 2013 to 200–400 m in 2014 and further to 400–700 m
reversals that occur in the Northern Ionian Sea. Many studies                in 2015–2016, while (ii) new surface and subsurface high salinity
show that these reversals are driven by the dense waters generated           waters started to enter the SAP in spring 2015, with surface
in the Adriatic that change the internal vorticity in the Northern           salinity as high as 38.9 in 2016, creating two salinity maxima
Ionian Sea (Gačić et al., 2010, 2014; Rubino et al., 2020) and may         in vertical profile (Babić et al., 2017; Hure et al., 2018; Kokkini
alternate at quasi-regular time intervals with the Aegean DWF                et al., 2020). The wintertime conditions during 2013 were in favor
site, affecting the upper eastern Mediterranean Sea thermohaline             of DWF, while 2014–2016 period was characterized by relatively
cell and influencing the circulation in the Northern Ionian Sea              mild winters. Additionally, a large freshwater load through rivers
(Theocharis et al., 2014; Reale et al., 2017). This mechanism                and precipitation, that created haline-driven stratification, was
is called the Adriatic-Ionian Bimodal Oscillating System (BiOS,              documented during 2014 (Mihanović et al., 2018; Kokkini et al.,
Gačić et al., 2010). Another hypothesis states that the local              2020). The surface inflow of high salinity waters from the Eastern
wind curl changes are responsible for the observed decadal                   Mediterranean continued in early 2017, preconditioning the
circulation changes (Pinardi et al., 2015; Nagy et al., 2019). In any        record-breaking salinities observed in summer and autumn at the
case, periodical reversals of the North Ionian Gyre (NIG) bring              coastal Stončica station (CJ009 – see Figure 1 for the location of
either ultraoligotrophic highly saline waters from the Eastern               the station) off the eastern Middle Adriatic coast, characterized
Mediterranean or less oligotrophic waters of lower salinity from             by unusual “inverse” salinity vertical structure (with the highest
the Western Mediterranean to the Adriatic, flushing the Adriatic             salinities observed in the surface and near-surface layers, Beg
within a few years at maximum (Mosetti, 1983; Vilibić and Orlić,           Paklar et al., 2020). Such a vertical structure is uncommon in
2002; Franić, 2005; Vilibić et al., 2020). Such a self-sustainable         the Adriatic, but it regularly appears in the Levantine basin,
reversals of circulation regimes may be impacted and modified                preconditioning (among other) the LIW formation (Kubin et al.,
by: (i) extraordinary Mediterranean-wide events like the Eastern             2019). A sharp negative halocline is collocated with a sharp
Mediterranean Transient (EMT, Klein et al., 1999; Incarbona                  seasonal thermocline there, to the depths of 20 to a 100 m
et al., 2016), which occurred from the late-1980s to the mid-                (Kubin et al., 2019; Kassis and Korres, 2020). The thermocline is
1990s and additionally strengthened anticyclonic BiOS, resulting             developed and maintained by extensive heat gain and low wind
in an unprecedented change in biogeochemical properties in the               conditions, while evaporation mostly affects surface waters, in
Adriatic (Grbec et al., 2009; Vilibić et al., 2012), (ii) local wind-       particular during summer and autumn, increasing the surface
driven vortices (like Messina Rise Vortex and Pelops Gyre—see                salinity. Both thermocline and halocline deteriorate during the

Frontiers in Marine Science | www.frontiersin.org                        2                                        July 2021 | Volume 8 | Article 672210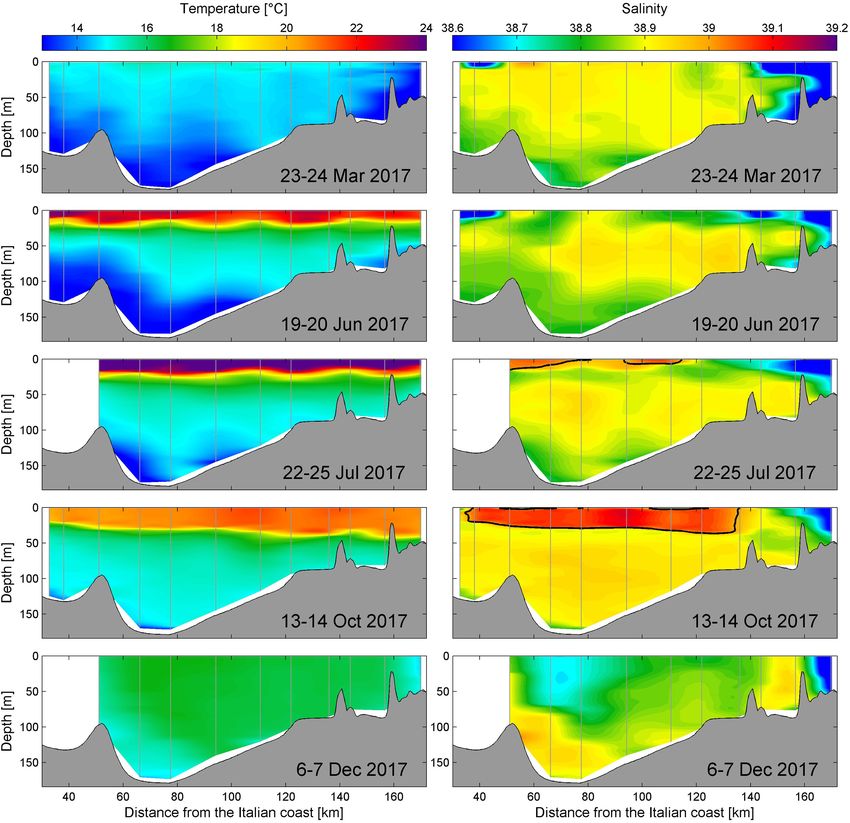
Mihanović et al.                                                                                                        High Salinities in the Adriatic

LIW formation in winter. Surface salinity maxima are also known             with surface salinity values higher than 38.8 observed on at least
to occur in subtropical regions where they are related to extensive         one station along the transect, between 0 and 20 m (considering
heating and evaporation (Bingham et al., 2014; Chen et al., 2018;           them as high surface salinity events). This threshold was based
Wang et al., 2019) during stable (low wind) weather conditions.             on long-term monthly measurements at the Stončica station
    An interesting consequence of the unusual salinity conditions,          (CJ009), as it is at least one standard deviation above long-term
hypothesized to be governed by local (heat and water fluxes)                average for any month of the year (Beg Paklar et al., 2020).
and remote (BiOS) drivers, documented in the eastern Middle                     Three winter (November/December) and two spring
Adriatic in 2017, was their effect on the microbial food web                (April/May) glider missions were carried out across the SAP
(Beg Paklar et al., 2020), in particular to the substantially               between 2015 and 2017, roughly from Bari to Dubrovnik
lower bacterial production and abundance. In this manuscript                (Figure 1 and Table 1). Teledyne Slocum gliders2 were used,
we intend to provide a wider basin-scale picture of the air-                sampling temperature and salinity down to 1,000 m, using
sea interactions and circulation in the Adriatic-Ionian basin               a Sea-Bird pumped payload CTD (GPCTD) with accuracies
during the appearance of surface and near-surface high salinity             of ± 0.002◦ C and ± 0.002, respectively (Stommel, 1989;
maxima. Moreover, the availability of historic thermohaline                 Merckelbach et al., 2008; Rudnick et al., 2012). The sensors
data enabled us to investigate similar events, which occurred               were calibrated prior to each deployment. More details on glider
previously in the Adriatic Sea, and to determine more precisely             campaigns may be found in Kokkini et al. (2020).
the preconditioning and processes responsible for the occurrence                Thermohaline data from seven Argo floats that were profiling
of high salinities. Section “Data and methods” overviews                    in the Adriatic and Northern Ionian between 2010 and 2017 were
measurements and other tools used to quantify thermohaline                  used in our study (Argo, 2021). The WMO numbers of the floats
changes during 2017 and the respective preconditioning period,              are: 1900848, 6901040, 6901822, 6901827, 3901978, 6901829,
and during occurrences of historical high surface salinity events           and 6901862. These measurements were conducted within the
(1961–2016). Section “Thermohaline properties in 2017” displays             framework of the MedArgo programme (Poulain et al., 2007) and
basin-wide thermohaline observations and outputs of the                     the European MOCCA project. Sea-Bird CTD sensors (model
Mediterranean Forecasting System operational numerical model                41/41 CP) with initial accuracies of ± 0.002◦ C and ± 0.003 were
for 2017. The processes contributing to anomalous thermohaline              used for temperature and salinity measurements, respectively,
properties in 2017, occurring from decadal to daily scales, are             while all floats had cycle duration between 1 and 5 days
documented in Section “Processes contributing to anomalous                  and a parking pressure of 350 dbar. Initial accuracies indicate
thermohaline properties in 2017”. Section “Past high surface                accuracies of Argo float sensors after their initial deployment,
and near-surface salinity events in the Adriatic” focuses on the            usually assessed by comparing the temperature and salinity
analysis of historical data in order to detect past events of surface       values measured in the first few cycles to CTD data obtained
salinity maximum and inverse subsurface halocline, and on                   shortly after the Argo float deployments (Nezlin et al., 2020).
investigation of the respective background processes. The results           The parking depth for float 1900848 was changed to 150 dbar
are discussed and the study is concluded in Section “Discussion             when it drifted to the Middle Adriatic area in the second part of
and Conclusion,” which also briefly documents the most recent               2010 (Vilibić and Mihanović, 2013). Moreover, recent data from
(2018–2020) thermohaline observations in the Adriatic.                      Argo floats 3901978 (Southern Adriatic and Ionian), 6903250
                                                                            (Southern Adriatic) and 6903263 (Jabuka Pit) were also analyzed,
                                                                            to document salinity properties in recent years (2018—2020). The
DATA AND METHODS                                                            parking depth of the float 6903250 was set to 1,000 dbar, as this
                                                                            is a Bio-Argo float and larger parking depth is usually set in
Thermohaline Data                                                           order to limit the drift of the float in other zones with different
Temperature and salinity data collected at the Palagruža Sill               biogeochemical characteristics. Therefore, it mostly remained
transect were acquired during five cruises in 2017, at 10–12                within the inner perimeter of the South Adriatic Pit. On the
stations (Figure 1 and Table 1). The sampling at the transect was           other hand, the Jabuka Pit float 6903263 profiled the entire water
done with Seabird 25 probe1 , which has accuracy of ± 0.002◦ C              column in a relatively small area during most cycles, as it was
for temperature and ± 0.002 for salinity.                                   configured with a parking depth close to the bottom.
    Long-term temperature and salinity data at the Palagruža
Sill transect collected between 1961 and 2017 were analyzed                 Ancillary Data
and episodes of vertical salinity distributions that resemble               Daily heat and water (evaporation minus precipitation, E-P)
the 2017 salinity distributions were extracted. These data were             fluxes were computed from the European Centre for Medium-
collected with monthly to seasonal resolution, using different              Range Weather Forecasts (ECMWF) ERA-Interim dataset
sampling techniques (reversing thermometers and various CTD                 (3 Dee et al., 2011) and averaged over the central part
probes for temperature; titration with AgNO3 , portable induction           of the Southern Adriatic, representing open sea conditions
salinometers and various CTD probes for salinity). The series               in the area (Figure 1). Daily averaged data of Po River
were homogenized and used in different studies (e.g., Vilibić              collected at the Pontelagoscuro sampling station were used
et al., 2013; Beg Paklar et al., 2020), in which more details on the        to present variability in river discharges (Figure 1). Finally,
measurements procedures can be found. We focused on episodes
                                                                            2
                                                                                http://www.teledynemarine.com
1
    www.seabird.com                                                         3
                                                                                www.ecmwf.int

Frontiers in Marine Science | www.frontiersin.org                       3                                       July 2021 | Volume 8 | Article 672210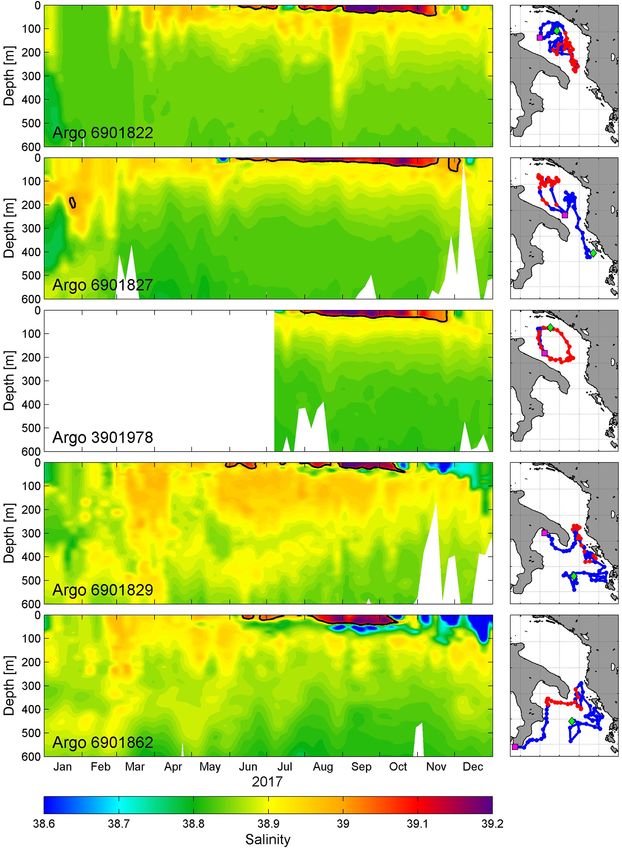
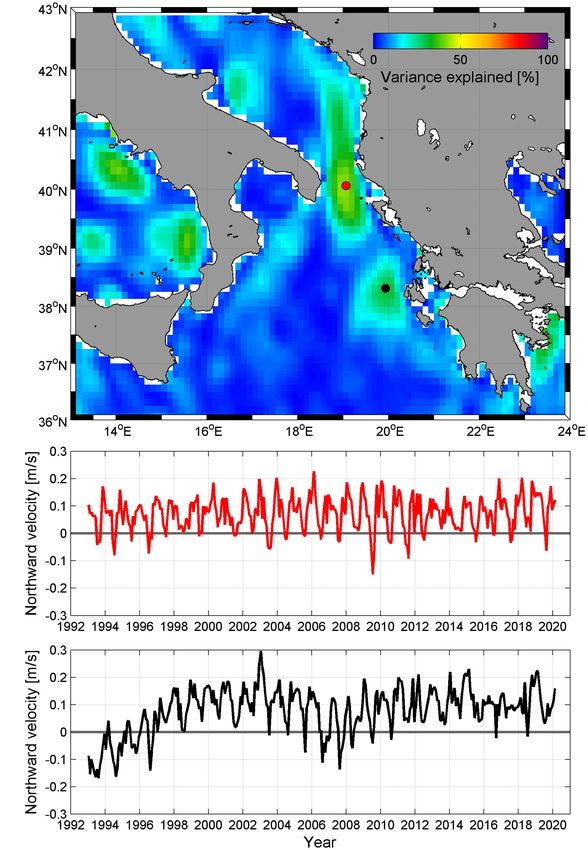
Mihanović et al.                                                                                                                               High Salinities in the Adriatic

  FIGURE 1 | The bathymetry of the Adriatic-Ionian basin. The positions of Argo profiles used in the study are denoted by small red dots. CTD stations at the
  Palagruža Sill transect are indicated by black dots, with Stončica station (CJ009) denoted by larger yellow dot. Glider trajectories in the Southern Adriatic are marked
  by yellow lines. JP, PS and SAP stand for the Jabuka Pit, the Palagruža Sill and the South Adriatic Pit, respectively. The black rectangle in the Southern Adriatic
  indicates the area over which heat and water fluxes were estimated. The yellow rectangle in the Northern Ionian represents the area used for computation of vorticity.
  The positions and the sense of rotation of the Messina Rise Vortex (MRV) and the Pelops Gyre (PG) are also indicated. Pontelagoscuro station, at which Po River
  discharge are measured, is indicated by the white square in the upper left part of the figure.

to detect anomalous conditions, the averages and standard                                    The Mediterranean Forecasting System (MFS) results
deviations were computed for the period between 1979 and                                 available at http://marine.copernicus.eu were used to assess
2017 and compared versus actual values, all averaged on                                  the surface thermohaline properties and the circulation during
monthly time scale.                                                                      2017 (Clementi et al., 2019). The MFS numerical analysis and
   Mean absolute dynamic topography (ADT) data were used                                 short-term forecasts are available since 2000 (Pinardi et al., 2003;
to quantify both seasonal variability in the surface circulation                         Pinardi and Coppini, 2010). The MFS hydrodynamic system
and the BiOS. ADT is AVISO+ (Gridded Sea Level Heights                                   is implemented over the entire Mediterranean basin including
and derived variables – Mediterranean Sea) product with a                                tides and is composed of two elements: the Nucleus for European
1/8◦ resolution that has been available since 1993 and can be                            Modeling of the Ocean (NEMO v3.6) and third generation Wave
accessed at http://marine.copernicus.eu. In order to quantify                            Model (Wave Watch-III). Numerical solutions are corrected by
BiOS-driven variability, vorticity was estimated from the surface                        a variational data assimilation scheme based on 3DVAR. The
currents and averaged over the central part of the Northern                              horizontal resolution of the model is 1/24◦ (around 4 km) and
Ionian Sea (Figure 1), following the procedure described                                 the model has 141 unevenly spaced vertical levels. It is forced by
by Shabrang et al. (2016).                                                               momentum, water and heat fluxes interactively computed using

Frontiers in Marine Science | www.frontiersin.org                                    4                                                July 2021 | Volume 8 | Article 672210
Mihanović et al.                                                                                                                  High Salinities in the Adriatic

TABLE 1 | The list of CTD cruises (Palagruža Sill), glider missions (Southern        with severe bora events, were recorded in the Adriatic (DHMZ,
Adriatic), and Argo profilers (Northern and Central Ionian Sea, Middle and
                                                                                     2018). Salinity in the Middle Adriatic in March 2017 was high,
Southern Adriatic) presented in the study, including their deployment periods.
                                                                                     between 38.8 and 38.93 at the transect stations, except close to
CTD cruises         Glider                           Argo floats                     the eastern (entire water column) and western (near the surface)
(Palagruža          missions                                                         Adriatic coast. Salinity values near the bottom, at the core of
Sill)               (Southern                                                        the NAdDW flow, were around 38.8, which is much higher than
                    Adriatic)
                                                                                     the average of ∼38.6 in the period 1952–2010 (Vilibić et al.,
Dates               Dates           Float number/Region        Dates                 2013). On 19–20 June 2017 (Figure 2B), the thermocline was
                                                                                     well developed and relatively shallow (15–25 m), while salinity
19–20 Aug           20 Nov–1 Dec    1900848/Middle and         1 Mar 2010–15         reached the maximum in the intermediate layers (∼38.94) where
2003                2015            Southern Adriatic          Nov 2014
                                                                                     the LIW normally crosses the Palagruža Sill (Buljan and Zore-
12–14 Aug           22 Apr–1 May    6901040/Southern           31 Mar 2012–12
                                                                                     Armanda, 1976; Martin et al., 2009). Surface salinity in the central
2005                2016            Adriatic and Northern      Oct 2014
                                    Ionian                                           part of the transect (38.8–38.9) was slightly lower than in the
22–24 Aug           3–11 Dec 2016   6901822/Southern           24 Mar 2013–27        intermediate layer (38.85–38.93), as was salinity in the deepest
2012                                Adriatic                   Feb 2018              parts (∼38.8), where the NAdDW outflow can still be seen.
1–4 Oct 2016        6–8 May 2017    6901827/Southern           13 May 2013–26           A month later, on 22–25 July 2017 (Figure 2C), the salinity
                                    Adriatic and Northern      Jun 2018              and temperature measurements were still reflecting the LIW
                                    Ionian                                           inflow at depths between 50 and 100 m and weakened NAdDW
23–24 Mar           2–13 Dec 2017   6901829/Southern           14 Feb 2014–21        outflow in the intermediate and deep layers of the transect,
2017                                Adriatic and Northern      Nov 2018
                                    Ionian
                                                                                     respectively. However, the upper-layer temperature increased
19–20 Jun                           6901862/Southern           27 Mar 2015–27
                                                                                     significantly, reaching almost 26◦ C. This very strong thermocline
2017                                Adriatic, Northern and     Jun 2019              did not deepen compared to June measurements and was still at
                                    Central Ionian                                   depths of around 15–25 m. Interestingly, the salinity maximum
22–25 Jul 2017                      3901978/Southern           7 July                started to develop at the very surface of the transect, surpassing
                                    Adriatic, Northern and     2017–present          39.0 at some stations. Such conditions continued to develop,
                                    Central Ionian
                                                                                     peaking on 13–14 October 2017, when a clear surface pool of
13–14 Oct                           6903250/Southern           10 Oct 2018–16
                                                                                     highly saline and warm waters was observed along most of the
2017                                Adriatic                   Jan 2021
                                                                                     transect (Figure 2D). The depth of thermocline and halocline
6–7 Dec 2017                        6903263/Middle             24 Mar
                                    Adriatic                   2019–present          ranged from 20 m at the southern section of the transect to about
10–12 Aug                                                                            40 m off the coastal region of the northern part of the transect.
2020                                                                                 The intensity of the thermocline and halocline was −2◦ C m−1
                                                                                     and −0.18 m−1 , respectively. The highest values of salinity in the
                                                                                     central part of the transect exceeded 39.1.
operational analysis and forecast fields from the ECMWF and the                         The last 2017 cruise along the Palagruža Sill transect,
model predicted surface temperatures (Pettenuzzo et al., 2010).                      carried out on 6–7 December (Figure 2E), indicated vertical
                                                                                     homogenization of the waters along the whole transect, except
                                                                                     in its deepest parts. The salinity decreased substantially in the
THERMOHALINE PROPERTIES IN 2017                                                      surface layer (38.7–38.85), while high values of salinity (up to
                                                                                     38.94) were still observed near the bottom. The surface salinity
CTD Observations at the Palagruža Sill                                               recorded on monthly basis at the Stončica station (CJ009) was
The temperature and salinity observations taken at the Palagruža                     higher than 38.8 throughout 2017, and it was 2–2.5 standard
Sill transect (Figure 2) indicate high salinity conditions                           deviations above the long-term average between June and
throughout 2017, in respect to values/data presented in previous                     November 2017, revealing exceptional conditions not previously
Adriatic climatologies and literature (Buljan and Zore-Armanda,                      documented for the Middle Adriatic (Beg Paklar et al., 2020).
1976; Artegiani et al., 1997; Lipizer et al., 2014; Beg Paklar
et al., 2020). The bilinear interpolation (e.g., Kirkland, 2010)
was used to plot these transects from available CTD casts, still                     Argo Profiling Floats and Glider
likely resulting in some artifacts due to small number of CTD                        Observations
profiles along the transect, such as somewhat peculiar salinity                      Trajectories and Hovmöller diagrams of salinity in the upper
vertical structures between the first three CTD casts on the right,                  600 m of five Argo profiling floats active during 2017 in the
which are likely generated by not accounting for the seamount                        Southern Adriatic, the Strait of Otranto and the Northern Ionian
in our interpolation. On 23–24 March 2017 (Figure 2A), the                           Sea are displayed in Figure 3. Interestingly, all floats recorded
very surface waters started to warm up, while the NAdDW                              an exceptional maximum in the surface and near-surface salinity
outflow, characterized by temperatures lower than 13◦ C and                          during summer and autumn seasons, peaking in values higher
salinities lower than 38.8, was detected near the bottom. The                        than 39.2 at the very surface. In particular, very high salinity
outflow followed the DWF on the Northern Adriatic shelf which                        values (above 38.9) can be detected in the upper 100 m in the
likely occurred in January 2017, when extreme cold periods,                          Southern Adriatic (Figures 3A,B) since early March 2017 and

Frontiers in Marine Science | www.frontiersin.org                                5                                        July 2021 | Volume 8 | Article 672210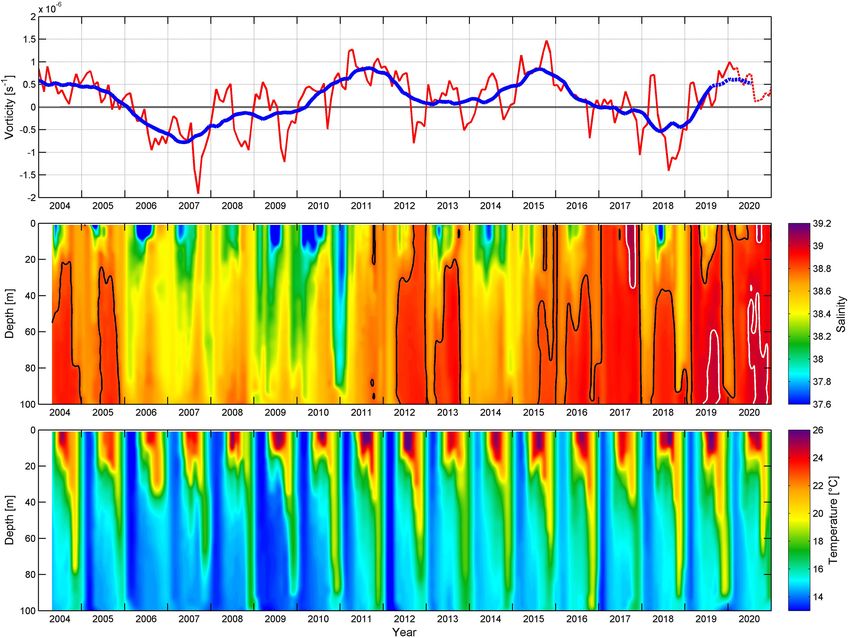
Mihanović et al.                                                                                                                            High Salinities in the Adriatic

  FIGURE 2 | Temperature and salinity measured at the Palagruža Sill transect: (A) 23–24 March 2017, (B) 19–20 June 2017, (C) 22–25 July 2017, (D) 13–14
  October 2017 and (E) 6–7 December 2017. Salinity values higher than 39.0 are encircled with black line in salinity plots. Vertical gray lines denote CTD casts.

down to 200–300 m in the Strait of Otranto (Figure 3E) and the                          6901827; Figure 3B). However, from late July all floats observed
Northern Ionian Sea (Figure 3D) during most of 2017.                                    exceptionally high surface salinity values. Some of them were
    The surface pools of exceptionally high salinity waters (thick                      sampled till mid-October in the Northern Ionian (Figures 3D,E).
black line in left panels in Figure 3 denotes 39.0 salinity contour)                    Surface salinity in the Southern Adriatic peaked between August
were first observed in the Argo profiling float data from the                           and October, and gradually decreased through November, as seen
northeastern Ionian Sea, just southeast of the Strait of Otranto                        in the data of three Southern Adriatic floats (Figures 3A–C),
(Argo float 6901829; Figure 3D), at the end of May 2017.                                likely pointing to enhanced vertical mixing.
Then, during June these pools were observed by the Southern                                Glider campaigns carried out in the Southern Adriatic during
Adriatic floats (6901822 and 6901827; Figures 3A,B) and by                              2017 indicated the surface salinity maximum as early as May
another Northern Ionian float (6901862; Figure 3E). Surface                             (Figure 4A), with values slightly lower than 39.0 in the layer
salinity values were slightly lower than 39.0 at locations of                           between the surface and 50 m depth. This relatively short glider
most of the analyzed floats during most of July 2017 (except                            campaign (2 days) documented the surface salinity increase in

Frontiers in Marine Science | www.frontiersin.org                                   6                                               July 2021 | Volume 8 | Article 672210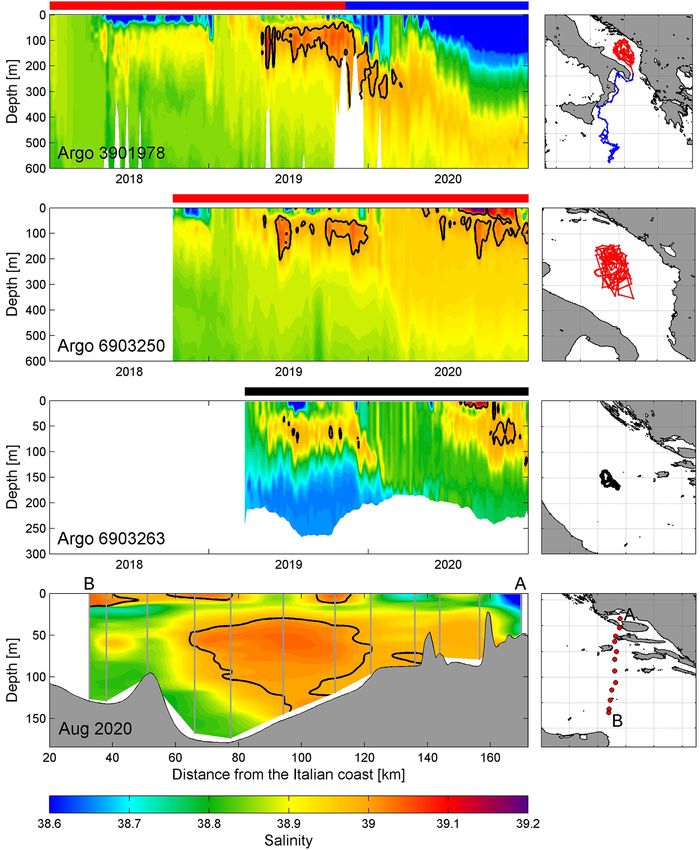
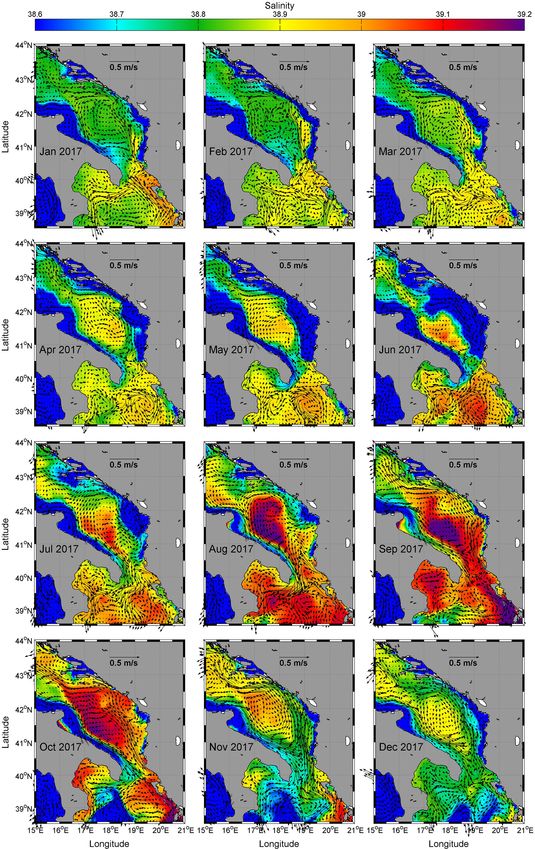
Mihanović et al.                                                                                                                                High Salinities in the Adriatic

  FIGURE 3 | (A) Hovmöller diagram of salinity data for Argo float 6901822 in the first 600 m in 2017 (left panel) with corresponding float trajectory (right panel). Thick
  black line in the left panel denotes 39.0 salinity contour, while the corresponding part of the trajectory is colored in red in the right panel. The location of the first
  vertical profile in 2017 is denoted by green diamond in right panel, while the last vertical profile in 2017 is marked with magenta square. (B–E) As in panel (A) except
  for Argo floats 6901827, 3901978, 6901829, and 6901862, respectively.

the central part of the SAP, as saline waters from the Northern                           “C-D” segments of the glider mission is indicated by letter “X,”
Ionian were entering in the Southern Adriatic already in March                            as this was the location that was sampled twice during this glider
2017 (Figures 3A,B). The surface/subsurface salinity maximum                              mission, on 4 December and on 12 December 2017).
was still present in the first 70–80 m along the central part
of the Southern Adriatic transect (Figure 4B) between 2 and                               Ocean Model Results
6 December 2017, with values close to 39.0. Interestingly, the                            The model outputs from the Mediterranean Forecasting System
upper layer of warmer and highly saline waters deepened to                                show monthly evolution of surface salinity and current fields
120 m toward the end of the glider mission, between 8 and 13                              during 2017 (Figure 5). The model indicated that surface inflow
December 2017, elucidating the ongoing mixing, cooling and                                of very saline surface waters (salinities above 38.9) was present
deepening of the surface salinity pool, most probably due to the                          from January to April 2017 between the Northern Ionian and
atmospheric forcing (the crossing point between the “A-B” and                             Southern Adriatic, and that spread across the Southern Adriatic.

Frontiers in Marine Science | www.frontiersin.org                                     7                                                July 2021 | Volume 8 | Article 672210
Mihanović et al.                                                                                                                          High Salinities in the Adriatic

  FIGURE 4 | (A) Glider temperature and salinity transects in the in the Southern Adriatic between 6 and 8 May 2017 (left panels) and the corresponding trajectory of
  the glider (right panel). (B) As in panel (A) except for glider transect from 2 to 13 December 2017. The crossing point between the “A–B” and “C–D” segments of the
  December 2017 glider mission is indicated by letter “X.”

This process is also reflected in two Argo floats measurements                        oriented and the majority of these waters was leaving the Adriatic
(Figures 3A,B) and in the May 2017 glider data (Figure 4).                            Sea. However, CTD measurements at the Palagruža Sill transect
Surface waters with such a high salinity values were then exposed                     in July 2017 indicated exceptionally high surface salinity in
to intense heating and evaporation during May and June (as it                         the central and southern part of the transect (Figure 2C),
will be shown later) and a pool of exceptionally highly saline                        possibly related to the inflow from the Southern Adriatic and
surface and near-surface waters (salinities surpassing 39.0) in                       local salinification above the thermocline. The surface salinity
the southwestern part of the SAP was already present in June                          reached 39.2 in the central and southwestern parts of the SAP in
2017 (Figure 5). According to the model results, the transport                        August. The core of the exceptionally highly saline salinity waters
between Adriatic and Ionian Seas was blocked by several gyres                         remained in the SAP throughout September, and the enhanced
within the Strait of Otranto in June 2017. The high-salinity waters                   EAC started to bring some of these waters northwestward
in the SAP were accompanied with weak currents, indicating                            over the Palagruža Sill. Simultaneously, the exchange between
their relative stationarity. Exceptionally high surface salinity                      the Adriatic and the Northern Ionian significantly increased,
(>39.0) could also be seen in the Northern Ionian Sea in                              enabling additional salt advection to the Southern Adriatic. The
June 2017, particularly in the cyclonic gyre just south of the                        advection of highly saline surface waters toward the Palagruža Sill
Strait of Otranto.                                                                    reached the maximum in October (Figures 2D, 5) during which
   The pool of high surface salinity waters in the SAP further                        the overall along-basin surface transport was the highest. Signs of
developed and widened in July (Figure 5), while the modeled                           the surface salinity decrease began in November (Figure 5), but
currents in the western part of the SAP were mostly southward                         still keeping the maximum value in the central SAP.

Frontiers in Marine Science | www.frontiersin.org                                 8                                               July 2021 | Volume 8 | Article 672210
Mihanović et al.                                                                                                                  High Salinities in the Adriatic

  FIGURE 5 | Modeled surface currents (Mediterranean Forecasting System) and salinities, monthly averaged between January and December 2017.

PROCESSES CONTRIBUTING TO                                                         Among these are quasi-decadal oscillations driven by the
ANOMALOUS THERMOHALINE                                                            Adriatic-Ionian Oscillating Bimodal System (BiOS). Following
                                                                                  Shabrang et al. (2016), who quantified the BiOS oscillations by
PROPERTIES IN 2017                                                                computing vorticity in the Northern Ionian Sea, we computed
                                                                                  surface vorticity in the Northern Ionian rectangle depicted in
Inflow of the Salty Surface Waters From                                           Figure 1 for the 1993–2020 period using satellite altimetry
the Ionian Sea Before 2017                                                        geostrophic currents. It was found that it oscillated between
The thermohaline variability in the Adriatic Sea is driven by                     positive and negative values, where positive values indicate
a number of processes acting on daily to decadal timescales.                      cyclonic and negative values anticyclonic BiOS regimes in the

Frontiers in Marine Science | www.frontiersin.org                             9                                           July 2021 | Volume 8 | Article 672210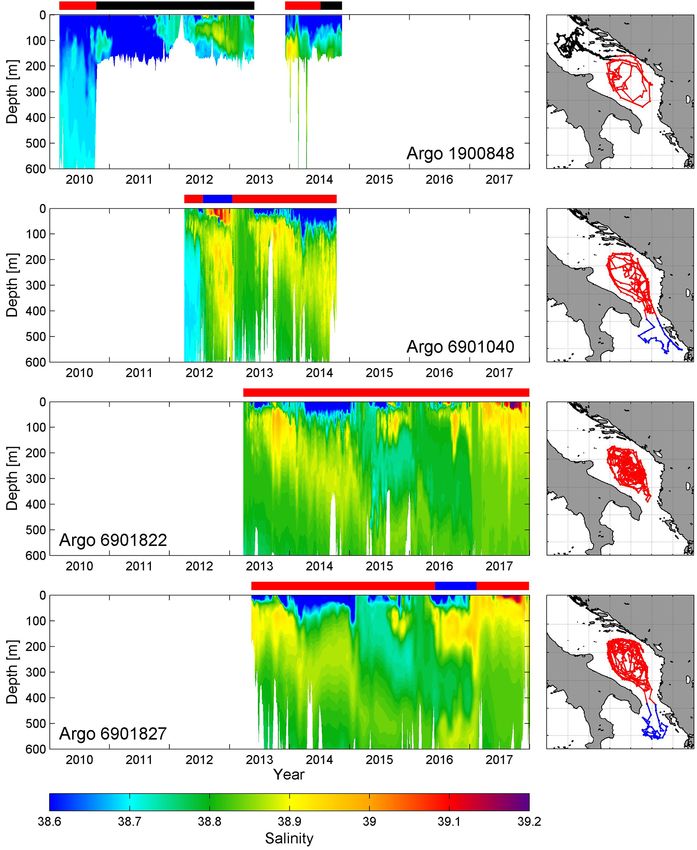
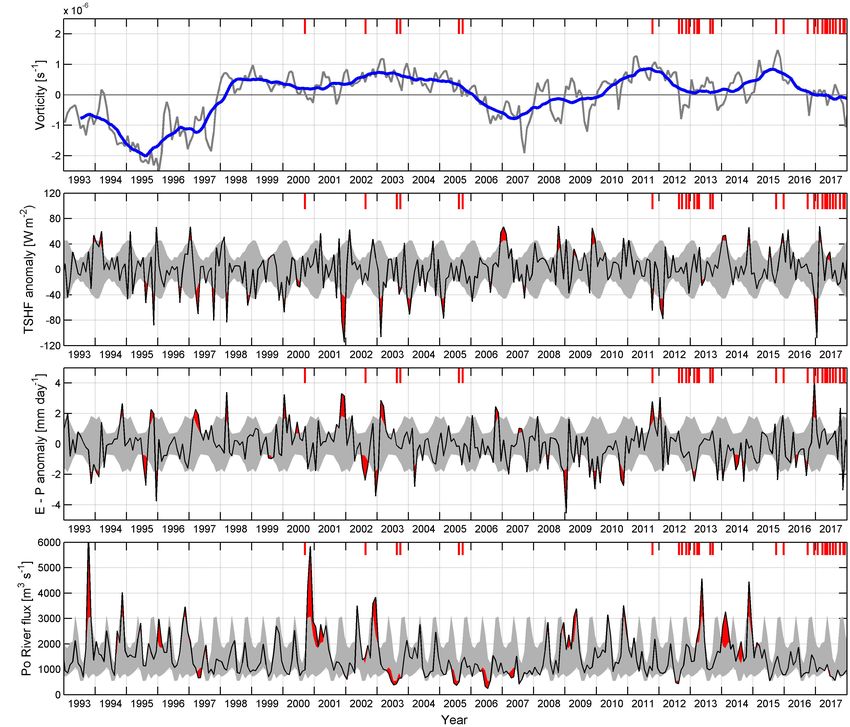
Mihanović et al.                                                                                                                                High Salinities in the Adriatic

  FIGURE 6 | (A) Monthly time series of the spatially averaged current vorticity (red line) and low-pass filtered (13 months) current vorticity (thick blue line) computed in
  the Northern Ionian Sea (37–39◦ N; 17–19.5◦ E) between January 2004 and December 2020. Dashed parts in panel (A) denote vorticity data based on near real time
  AVISO+ product. (B) Hovmöller diagram of salinity measurements at station CJ009 between April 2004 and December 2020. Thick black line in panel (B) indicates
  38.8 salinity contour (high salinity conditions), while thick white line denotes 39.0 contour (exceptionally high salinities). (C) Hovmöller diagram of temperature
  measurements at station CJ009 between April 2004 and December 2020.

Northern Ionian Sea. When analyzing the vorticity between 2004                             were also observed in 2013. The salinity then decreased in 2014
and 2020 (Figure 6A) i.e., during the period with a frequent                               (36.7–38.7 in the intermediate and bottom layers), as it was a year
(quasi-monthly) high quality CTD measurements available at the                             characterized by abundant precipitation and higher than usual
Palagruža Sill transect station CJ009 (Figure 6B), it appears that                         river discharges in the Adriatic Sea area (Kokkini et al., 2020;
the cyclonic BiOS regime was present until 2005, switching to                              see also Section “Physical setting in 2017” for higher than usual
anticyclonic BiOS regime until the beginning of 2010, then again                           Po River discharges during 2014). The salinity in the following
returning to cyclonic regime between the second half of 2010 and                           2 years rose again, surpassing 38.9 in the second part of 2016.
2016 (with a weakening in 2012–2013, due to extraordinary DWF                              During all these phases salinity mostly followed the BiOS-driven
in winter of 2012, Gačić et al., 2014). Predominantly transient and                      vorticity with a lag of 1–2 years, relating high salinity values with
anticyclonic regime was then observed during 2017 and 2018,                                positive vorticity and vice versa. However, such an interaction
shifting again to cyclonic circulation in 2019. Simultaneously,                            was not clearly present in the 2017–2018 period, as exceptionally
salinity at the station CJ009 (Figure 6B) exhibited a period                               high salinities (above 39.0 in 2017) observed at the Palagruža
with high values in 2004 and 2005 (reaching almost 38.9 in                                 Sill transect were associated with a weakening cyclonic BiOS
the intermediate and bottom layers), then it decreased to 38.2–                            phase switching to negative vorticity values and predominantly
38.6 between 2006 and 2010. New increase in salinity occurred                              transient and anticyclonic BiOS regime.
during 2011, reaching maximum values close to 38.9 in 2012 in                                  As for temperature measurements at CJ009 (Figure 6C),
the intermediate and bottom layers (also exceeding 38.8 at the                             seasonal signal is dominant, particularly close to the surface,
surface by the end of the year). Salinity values higher than 38.9                          indicating well developed seasonal thermocline. Moreover,

Frontiers in Marine Science | www.frontiersin.org                                     10                                                July 2021 | Volume 8 | Article 672210
Mihanović et al.                                                                                                                          High Salinities in the Adriatic

  FIGURE 7 | (A) Hovmöller diagram of salinity data for Argo float 1900848 in the first 600 m in the period 2010–2014 (left panel) with corresponding float trajectory
  (right panel). (B–D) As in panel (A) except for Argo floats 6901040 (2012–2014), 6901822 (2013–2017) and 6901827 (2013–2017), respectively. Argo trajectories are
  colored depending on the location of the float (black–Middle Adriatic, red–Southern Adriatic, blue–Northern Ionian). The same color notation is used in horizontal
  bars above left panels, indicating periods during which Argos were profiling in respective areas.

intermediate and bottom temperatures followed salinity                                 waters were observed in the Strait of Otranto and the Northern
variations during BiOS regimes, as the Western Mediterranean                           Ionian Sea in summer and autumn 2012 (Figure 7B), and shortly
intermediate waters that enter the Adriatic are characterized by                       during the summer in the Middle Adriatic (by the Argo float
lower temperature and salinity than waters originating in the                          1900848, Figure 7A). The vertical salinity profile (and vertical
Eastern Mediterranean (Vilibić et al., 2012).                                         temperature profile, not shown) exhibited homogenization of
   The corresponding changes in salinity, as measured by Argo                          the water column in the winter of 2013, apparently due to
profiling floats between 2010 and 2017 in the Adriatic (the                            open-ocean convection (Mihanović et al., 2018). This mechanism
Adriatic Argo measurements are available since 2010), indicate                         and subsequent dense water outflow presumably triggered the
the period of relatively lower salinity (below 38.6 in the upper                       Adriatic-Ionian thermohaline circulation (Orlić et al., 2006),
100 meters) observed in the Southern and Middle Adriatic                               inducing the subsurface LIW inflow in autumn 2013, at depths
in 2010 (Figure 7A). The salinity started to increase at the                           of 100–200 m. The LIW inflow gradually deepened in 2014 and
end of 2011 and during 2012 in both Middle (Argo float                                 2015 to depths of about 200–400 m (Figures 7A–C), presumably
1900848; Figure 7A) and Southern Adriatic (Argo float 6901040;                         driven by a weak open convection that pushed the LIW to
Figure 7B), following the change to the cyclonic phase of the                          even greater depths in 2015 and 2016 (400–700 m, Lučić et al.,
BiOS. Surface salinity maximum and a surface pool of saline                            2017; Hure et al., 2018; Kokkini et al., 2020). Simultaneously,

Frontiers in Marine Science | www.frontiersin.org                                 11                                              July 2021 | Volume 8 | Article 672210
Mihanović et al. High Salinities in the Adriatic
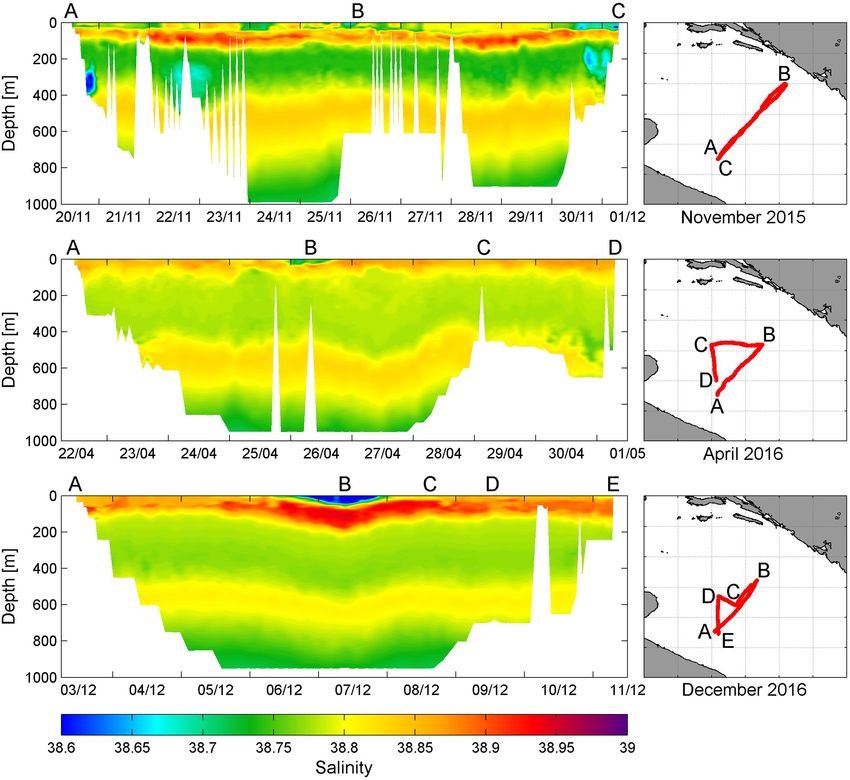
FIGURE 8 | (A) Glider salinity transect in the in the Southern Adriatic between 20 November and 1 December 2015 (left panel) and the corresponding trajectory of
the glider (right panel). (B) As in panel (A) except for glider transect from 22 April to 1 May 2016. (C) As in panel (A) except for glider transect from 3 to 11 December
2016. Please note that the salinity scale for these glider transects is different than in Figure 4.
a subsurface high salinity core started to be observed in the (Figure 8A), prior to the winter period in which open convection
Adriatic at depths between 50 and 200 m, with a patch firstly may take place in the SAP, reproduces the double salinity maxima
visible in the second part of 2015 and even stronger inflow in pattern across the whole SAP, i.e., subsurface salinity maximum
2016 (Figure 7C). (50–100 m) occasionally exceeding 38.9 and the deep salinity
The double salinity maxima that preceded high salinity maximum at 400 to 600 m (with values up to 38.85). Interestingly,
conditions in 2017 were also observed during the BIOTA the subsurface salinity maximum value in the second part of 2015
project (Bio-tracing Adriatic Water Masses) campaigns, that dominated over the deep salinity maximum, although restricted
encompassed the eastern section of the SAP (Babić et al., 2017; to a narrower layer. The subsurface salinity maximum indicated
Lučić et al., 2017; Hure et al., 2018), and in glider missions a subsurface advection of saline waters from the Levantine basin,
in the central SAP in 2015 and 2016 (Figure 8). The BIOTA while the deep salinity maximum did not show large changes
measurements in late February/early March 2015 were the in the salt content. After a weak winter convection period in
first indication of the double maxima pattern in the Southern early 2016, the deep salinity maximum was still present, but it
Adriatic (e.g., Babić et al., 2017), with near-surface maximum deepened to 550 to 700 m in the open Adriatic (Figure 8B).
values present in a narrow band along the northeastern shelf The near-surface salinity maximum moved toward the surface,
break (therefore not detected so early by Argo floats, which with high salinity waters encompassing the first 100 m of the
usually remained further offshore). These near-surface salinities water column in the open sea. The maximum was deeper at the
were slightly lower than contemporaneous deep-water salinity perimeter of the SAP (points A and D in Figure 8B). Very similar
maximum values. The salinity distribution in November 2015 salinity distribution remained till the end of 2016 (Figure 8C),
Frontiers in Marine Science | www.frontiersin.org 12 July 2021 | Volume 8 | Article 672210Mihanović et al. High Salinities in the Adriatic FIGURE 9 | (A) Monthly time series of the spatially averaged current vorticity (gray line) and low-pass filtered (13 months) current vorticity (blue line) computed in the Northern Ionian Sea (37–39◦ N; 17–19.5◦ E) between January 1993 and December 2017. (B) Monthly ERA-Interim total surface heat flux anomalies and (C) evaporation minus precipitation (E-P) anomalies averaged over the Southern Adriatic, together with (D) monthly Po River discharge between 1993 and 2017. Standard deviations (shaded in gray) were estimated for the period 1979–2017. Red shadings indicate values above or below one standard deviation. Red ticks in the upper part of each panel denote occurrence of surface or near-surface (0–20 m) salinity values higher than 38.8 observed on at least one station along the Palagruža Sill transect. with a large salt content in the layer that is normally mixed by (below 500 m). At the same time, a new inflow of high salinity the open sea convection during severe wintertime forcing (the waters to the Adriatic took place near the surface in 2015 mixing can extend to 900 m, Gačić et al., 2002; Dunić et al., 2019). and 2016, i.e., at much shallower depths than was previously In summary, the BiOS cyclonic regime in the Northern documented during Adriatic salt ingressions (e.g., Gačić et al., Ionian was increasing the salt content in the Adriatic for 1996; Vilibić and Orlić, 2001). several years prior to 2017 by advecting more saline waters, presumably originating in the Levantine basin or/and the Aegean Physical Setting in 2017 Sea, through the Strait of Otranto. This was particularly true A very strong open ocean convection episode occurred in January for 2015–2016, following the cyclonic regime maximum in 2017, characterized by severe bora wind and extremely cold 2015 (Figure 6A), thus preconditioning the 2017 high salinity weather along the Adriatic Sea (DHMZ, 2018). The severity event. Moderate open ocean convection events between 2014 of the event can be observed from the surface heat anomalies and 2016 deepened the salinity maximum to greater depths averaged from ERA-Interim reanalysis over the open Southern Frontiers in Marine Science | www.frontiersin.org 13 July 2021 | Volume 8 | Article 672210
Mihanović et al.                                                                                                           High Salinities in the Adriatic

Adriatic (Figure 9B), which were the second most negative                      Strait of Otranto (Figure 10A), reflecting seasonal variability in
(after December 2001) during the entire satellite altimetry era                the exchange of water masses between the Adriatic and Ionian
(1993–2017). Heat losses in the Southern Adriatic were even                    Seas. The seasonal oscillations in northward flow dominate there
stronger than the losses during the severe winter of 2012,                     and may range from 10 to 20 cm/s (Figure 10B), reaching
which peaked in the Northern Adriatic but was of moderate                      peak values during autumn and winter when they rapidly advect
intensity in the Southern Adriatic, causing a vertical mixing                  waters from the Northern Ionian to the Southern Adriatic.
in the SAP that reached only 500 m depth (Mihanović et al.,                   Interestingly, seasonal signal in surface geostrophic currents is
2013). In 2017 the open ocean convection in the SAP was                        also quite high in the area west of Cephalonia Island (Greece),
indeed much stronger and the water column was mixed to 700–                    and seasonal currents there are mostly in phase with currents in
800 m (Figure 3A; see also Kokkini et al., 2020). The mixing                   the Strait of Otranto (Figures 10B,C). The percentage of total
effectively destroyed the double salinity maxima vertical pattern              geostrophic velocity variance explained by the seasonal signal in
that was present in 2015–2016 period, and high salinities were                 northward surface geostrophic currents may reach 30% in that
measured throughout the water column (above 38.8 between                       area. Seasonal oscillations in surface currents have a range of
the surface and 700 m). The convection was preceded by                         about 10–20 cm/s (the same range as in the Strait of Otranto),
high and positive E-P anomalies (Figure 9C) that additionally                  peaking in autumn and winter.
increased the salinity in the surface layer, while freshwater                      These seasonal oscillations west of Cephalonia Island (i.e., in
inflow by rivers was lower than average during most of                         the eastern part of the Northern Ionian) are embedded on the
2016 (Figure 9D). This event enhanced the Adriatic-Ionian                      decadal signal that strongly resembles the BiOS-driven changes
thermohaline circulation during late winter and spring 2017,                   in vorticity in the central part of the Northern Ionian Sea.
but the inflow of warmer and highly saline waters from the                     The positive vorticity implies cyclonic BiOS regime (Figure 9A)
Northern Ionian remained close to the surface, in the upper                    and stronger northward currents in the eastern part of the
100 m (see also Figures 3A,B, 5 and Section “Thermohaline                      Northern Ionian (Figure 10C) and the negative vorticity implies
properties in 2017”).                                                          anticyclonic BiOS regime, and southward currents in the
    Very low river discharges were also present during the whole               eastern part of the Northern Ionian (Figure 10C). However,
2017 (Figure 9D), while heat fluxes were higher than average                   the characteristics of the NIG reversals are also affected by
in late spring and summer (Figure 9B), having the capacity to                  the interaction between basin-wide and mesoscale circulation
substantially heat the surface layer during the seasonal maximum               (Menna et al., 2019). Namely, the first two anticyclonic phases
in thermocline intensity in the summer (Buljan and Zore-                       of the BiOS regime observed from satellite altimetry data
Armanda, 1976). Precisely, heat fluxes in May and June 2017 were               (1993–1996 and 2006–2010) had some differences in basin-
both above one standard deviation estimated over the period                    wide circulation, depending on the mesoscale characteristics of
1979–2017 and the largest in the period 1993–2017 for that part                the Messina Rise Vortex and the Pelops Gyre. The effects of
of the year (Figure 9B).                                                       these differences were visible in changes of the northward flow
    To summarize, one of the most intense cooling during the                   west of Cephalonia, with much stronger southward currents
winter and heating in the following summer were present over                   present during the 1993–1996 anticyclonic mode, which was
most of the Southern Adriatic in 2017. They were related to                    more negative (in terms of vorticity) than during the 2006–
an inflow of highly saline waters from the Northern Ionian                     2010 anticyclonic mode (Figure 10C). During the 2005–
in the surface layer during late winter and early spring 2017,                 2010 anticyclonic phase, the Messina Vortex Rise was zonally
together with a very low precipitation rate and extremely low                  elongated (Menna et al., 2019), and the size and intensity of the
river discharges between mid-2015 and the end of 2017.                         NIG was reduced, therefore having lower impact on the currents
                                                                               in the eastern part of the Northern Ionian.
                                                                                   The matching between NIG reversals (Figure 6A) and
Variations of Surface Geostrophic                                              northward flow along the eastern Ionian Sea (Figure 10C)
Currents                                                                       was not preserved in the 2017–2018 period, when a relatively
It is well known that the DWF and the respective outflow of the                short reversal of the NIG (from cyclonic to anticyclonic)
NAdDW and AdDW within and from the Adriatic strengthen                         occurred in the Northern Ionian (Figure 6A). However, the
the thermohaline circulation and cause seasonal oscillations of                northward currents west of Cephalonia Island remained steady
the inflow from the Ionian Sea, with maximum salinity values                   (Figure 10C), implying that waters of higher salinities were
in summer and autumn in the Adriatic (Buljan and Zore-                         still advected to the northernmost part of the Ionian Sea, and
Armanda, 1976; Vilibić and Orlić, 2001; Orlić et al., 2006; see also        from there further to the Adriatic Sea (Figures 3, 5). It appears
Figure 6B). The strength of this seasonal cycle is evidenced by                that during this period variations of the Adriatic thermohaline
seasonal variations of monthly surface geostrophic currents, as                properties, in particular of salinity, were more related to the
estimated from the AVISO+ dataset (Figure 10A). The seasonal                   persistence of the northward coastal flow along the western
cycle was extracted from the data by least-squares fitting of the              coast of Greece than to the BiOS regime occurring in the
annual (12 months) and semi-annual (6 months) cosine functions                 central Northern Ionian Sea. The latter may not always affect
separately for each grid point, following the general harmonic                 the eastern coastal regions of the Northern Ionian (Menna
regression model (Wilks, 2020). The percentage of the seasonal                 et al., 2019), where the flow of warm and highly saline waters
circulation explaining total variance may surpass 40% in the                   originating from the Levantine region can continue to bring

Frontiers in Marine Science | www.frontiersin.org                         14                                       July 2021 | Volume 8 | Article 672210
Mihanović et al. High Salinities in the Adriatic
FIGURE 10 | (A) Percentage of total geostrophic velocity variance explained by the seasonal signal, with two grid points denoted by red (Otranto Strait) and black
(west of Cephalonia Island, Greece). (B) AVISO+ northward monthly geostrophic currents at the Otranto Strait grid point. (C) AVISO+ northward monthly
geostrophic currents at the grid point west of Cephalonia.
high salinity waters to the Adriatic even during transient or and 2016. The analysis was based on long-term measurements
anticyclonic BiOS phase. at the historical Stončica station (CJ009, Figure 1), which is
the most regularly surveyed station at the Palaguža Sill transect.
We looked at the transect observations characterized by surface
PAST HIGH SURFACE AND or near-surface (0–20 m) salinities which were at least one
NEAR-SURFACE SALINITY EVENTS IN standard deviation above the 1961–2016 mean summer values
THE ADRIATIC (Beg Paklar et al., 2020). This threshold was very close to
38.8. For an assessment of the processes eventually contributing
Here, we present the analysis of surface and near-surface salinity to the maxima, we analyzed heat fluxes and E-P over the
maxima observed over the Palagruža Sill transect between 1961 Southern Adriatic—using the ERA Interim dataset (available
Frontiers in Marine Science | www.frontiersin.org 15 July 2021 | Volume 8 | Article 672210Mihanović et al. High Salinities in the Adriatic
from 1979), discharges of the major Adriatic river, Po River
(available from 1961, Raicich, 1996; Vilibić et al., 2016), and
the decadal oscillations driven by the BiOS regime (based on
satellite altimetry data available since 1993). In general, from 1961
to 2016 several periods with high salinities along the Palagruža
Sill transect were observed: 1968–1971, 1975–1976, 1978–1982,
1987–1990, and 1999–2005 (Mihanović et al., 2015; Matić et al.,
2017) and in the 2011–2016 period (Figure 7). These periods
(at least after 1993, when altimetry data became available) were
mostly related to cyclonic circulation regime in the Northern
Ionian Sea (with 1–2 years phase shift).
However, surface and near-surface high salinity events as
defined above (with values higher than 38.8 observed between 0
and 20 m) were relatively rarely observed along the Palagruža Sill
transect before 2000. More precisely, they occurred in December
1978, December 1981, October 1986, March 1987 and September
1989. Salinity conditions during the 1990s in the Middle Adriatic
were mostly influenced by the very strong anticyclonic circulation
regime in the Northern Ionian Sea, that probably started in
late 1980s (Demirov and Pinardi, 2002), and lasted until 1997
(Gačić et al., 2010), additionally strengthened by the Eastern
Mediterranean Transient. As satellite altimetry measurements
are available since 1993, we focused on high salinity events
corresponding to this period. The BiOS regime phase shifted to
cyclonic by the end of 1997 and warm and saline waters from the
Eastern Mediterranean started entering the Adriatic. However, it
took several years before this continuous increase of the salinity
in the Adriatic enabled values higher than 38.8 to be observed
in the upper 20 m of the water column (high surface and near-
surface salinity events that occurred at the Palagruža Sill transect
are indicated by red ticks in the upper part of each panel in
Figure 9). Therefore, high salinity events were not observed
during 1990s along the Palagruža Sill transect. They occurred
again during several summer-autumn periods between 2000 and
2005 (September 2000, August 2002, August and October 2003,
August and September 2005), coinciding with the cyclonic phase
of the BiOS and prolonged dry periods in the region, usually with
warm summers. Several drought events were documented during
this period, among them the infamous European heat wave of
FIGURE 11 | (A) Salinity profile at the Palagruža Sill transect in the second
2003 (Grbec et al., 2007; Spinoni et al., 2015, 2019). Preceding this
half of August 2003. (B–D) As in panel (A) except for mid-August 2005, the
summer, heat losses were quite high in February 2003, pointing second part of August 2012 and the beginning of October 2016, respectively.
to a possibility of the open ocean convection in the SAP, while Vertical gray lines denote CTD casts.
the Northern Adriatic DWF also occurred, strongly affecting
Adriatic-Ionian thermohaline circulation (Dorman et al., 2006;
Orlić et al., 2006). Salinity distribution over the Palagruža Sill
transect in August 2003 is shown in Figure 11A. Surface salinities throughout this period (Figure 6B). The next change in the
over southern part of the transect surpassed 38.9, with the vertical Northern Ionian circulation (from anticyclonic to cyclonic)
extension to depths of about 10 m. Another salinity maximum started in 2010 (Bessiéres et al., 2013), which resulted in
was observed between 40 and 70 m, with values reaching almost renewed increase of salinity in the Southern and Middle Adriatic
38.85. Such conditions continued at least till October 2003, with (Figures 6B, 7). Near-surface salinities higher than 38.8 at the
the deepening of the second maximum (not shown). Another dry transect were first documented in October 2011. Severe winter
year was 2005, when surface salinities higher than 38.8 were again conditions and resulting DWF in the Northern and Middle
observed at the transect in August (Figure 11B) and September. Adriatic during the winter of 2012 enhanced the Adriatic-
During the successive anticyclonic BiOS phase (2006–early Ionian thermohaline circulation, and a significant increase in
2010) the near-surface salinities along the Palagruža Sill transect salinities in the Adriatic was observed in the following months,
remained below 38.8. Additionally, Stončica station (CJ009) resulting in several-months long period with salinity values
salinity values were lower than 38.8 at all sampled depths higher than 38.8 at the Stončica station in the second half of
Frontiers in Marine Science | www.frontiersin.org 16 July 2021 | Volume 8 | Article 672210You can also read


