Improving fuel efficiency for heavy-duty vehicles of 3.5-12 tonnes in India: Benefits, costs, and environmental impacts
←
→
Page content transcription
If your browser does not render page correctly, please read the page content below
LBNL Report

Improving fuel efficiency for heavy-duty vehicles of
3.5–12 tonnes in India: Benefits, costs, and
environmental impacts

 Authors:

 Nihan Karali, Nikit Abhyankar, Ben Sharpe1, Anup Bandivadekar1

 1 International Council on Clean Transportation

 Energy Analysis and Environmental Impacts Division
 Lawrence Berkeley National Laboratory
 International Energy Studies Group

 February 2019

 1
DISCLAIMER

This document was prepared as an account of work sponsored by the United States Government. While this
document is believed to contain correct information, neither the United States Government nor any agency thereof,
nor The Regents of the University of California, nor any of their employees, makes any warranty, express or implied,
or assumes any legal responsibility for the accuracy, completeness, or usefulness of any information, apparatus,
product, or process disclosed, or represents that its use would not infringe privately owned rights. Reference herein
to any specific commercial product, process, or service by its trade name, trademark, manufacturer, or otherwise,
does not necessarily constitute or imply its endorsement, recommendation, or favoring by the United States
Government or any agency thereof, or The Regents of the University of California. The views and opinions of authors
expressed herein do not necessarily state or reflect those of the United States Government or any agency thereof,
or The Regents of the University of California.

Ernest Orlando Lawrence Berkeley National Laboratory is an equal opportunity employer.

 COPYRIGHT NOTICE

This manuscript has been authored by an author at Lawrence Berkeley National Laboratory under Contract No. DE-
AC02-05CH11231 with the U.S. Department of Energy. The U.S. Government retains, and the publisher, by
accepting the article for publication, acknowledges, that the U.S. Government retains a non-exclusive, paid-up,
irrevocable, world-wide license to publish or reproduce the published form of this manuscript, or allow others to
do so, for U.S. Government purposes.

 2
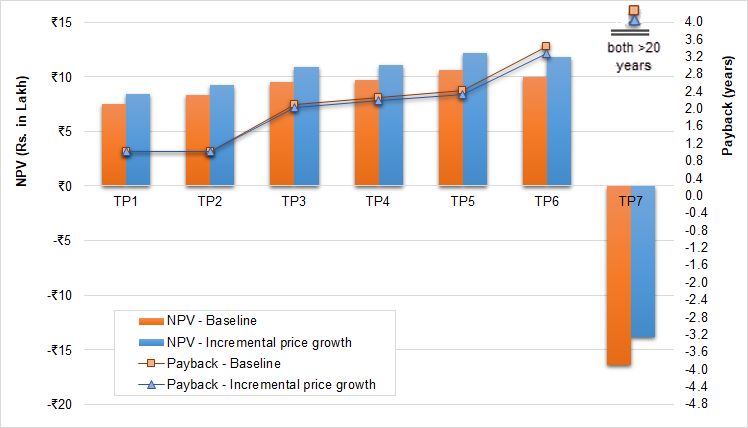
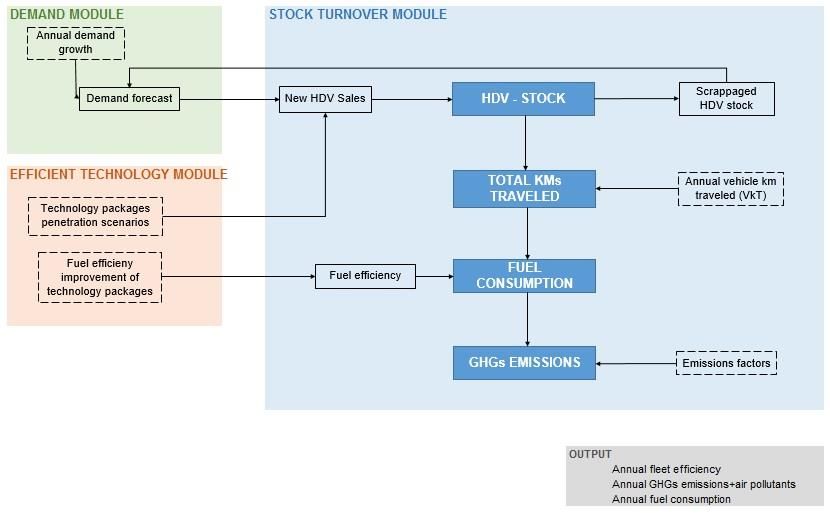
Table of Contents

Executive Summary ...................................................................................................................................... 6
1 Introduction.......................................................................................................................................... 10
2 Baseline and Efficient Vehicle Technologies ...................................................................................... 12
 2.1 Baseline Vehicle Characteristics ................................................................................................. 12
 2.2 Engine Technologies ................................................................................................................... 13
 2.3 Transmission Technologies ........................................................................................................ 14
 2.4 Tire Technologies ........................................................................................................................ 15
 2.5 Aerodynamic Technologies ......................................................................................................... 16
 2.6 Weight-Reduction Technologies ................................................................................................. 17
 2.7 Technology Packages ................................................................................................................. 17
3 Benefit-Cost Analysis .......................................................................................................................... 20
 3.1 Methods and Key Assumptions................................................................................................... 20
 3.1.1 Baseline Fuel efficiency Values .......................................................................................... 20
 3.1.2 Annual Vehicle Kilometers Traveled ................................................................................... 21
 3.1.3 Diesel Prices ....................................................................................................................... 21
 3.1.4 Other Parameters ................................................................................................................ 21
 3.2 BCA Results ................................................................................................................................ 22
 3.2.1 BCA Fuel efficiency Scenario Results................................................................................. 22
 3.2.2 BCA Sensitivity Analysis Results ........................................................................................ 24
4 Oil and CO2 Emissions Projections ..................................................................................................... 28
 4.1 HDV Fleet Energy Model and Key Assumptions ........................................................................ 28
 4.1.1 Scrappage Function ............................................................................................................ 29
 4.1.2 Vehicle Fuel Consumption .................................................................................................. 30
 4.1.3 Others Parameters .............................................................................................................. 30
 4.1.4 Demand Projection .............................................................................................................. 30
 4.1.5 Model Calibration and Validation ........................................................................................ 32
 4.2 Oil and CO2 Emissions Results ................................................................................................... 34
 4.2.1 Fuel efficiency Scenario Results ......................................................................................... 35
 4.2.2 Sensitivity Analysis Results................................................................................................. 38
5 Conclusions and Recommendations .................................................................................................. 41
References .................................................................................................................................................. 43

 3
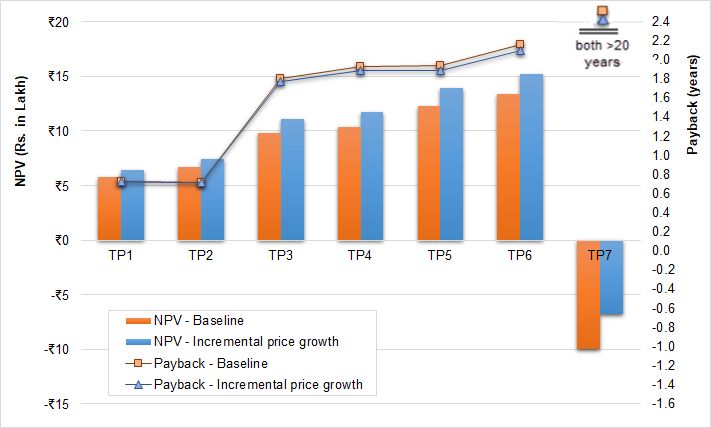
Table of Figures

Figure 1. HDV stock and share of HDVs with GVW between 3.5 and 12 tonnes in India, 2000–2016 ...... 11
Figure 2. Summary of methods ................................................................................................................... 12
Figure 3. Fuel consumption reduction for each technology package ......................................................... 18
Figure 4. Incremental cost breakdown for each technology package ........................................................ 19
Figure 5. General structure of the HDV BCA model ................................................................................... 20
Figure 6. Payback periods for the 11.9-tonne rigid truck with each technology package, assuming one-
time upfront payment .................................................................................................................................. 22
Figure 7. Payback periods for the 7.5-tonne transit bus with each technology package, assuming one-
time upfront payment .................................................................................................................................. 23
Figure 8. NPV results for each technology package and HDV category, assuming one-time upfront
payment....................................................................................................................................................... 23
Figure 9. Benefits, costs, and NPV of rigid truck for TP1–TP6 ................................................................... 24
Figure 10. Benefits, costs, and NPV of transit bus for TP1–TP6 ................................................................ 24
Figure 11. Sensitivity of the payback period to ± 25% change in incremental cost .................................... 25
Figure 12. Sensitivity of the NPV to ± 25% change in incremental cost ..................................................... 25
Figure 13. Sensitivity of the payback period to ± 25% change in diesel price ............................................ 26
Figure 14. Sensitivity of NPV to ± 25% change in diesel price ................................................................... 26
Figure 15. Sensitivity of the payback period and NPV of rigid trucks to incremental growth of diesel price
 .................................................................................................................................................................... 27
Figure 16. Sensitivity of the payback and NPV of transit buses to incremental growth of diesel price ...... 27
Figure 17. Cumulative benefits for rigid truck with TP6, with and without 3-year loan ............................... 28
Figure 18. Cumulative benefits for transit bus with TP6, with and without 3-year loan .............................. 28
Figure 19. HDV fleet energy model ............................................................................................................. 29
Figure 20. Correlation of HDV stock between 3.5 and 12 tonnes with per-capita GDP using data from
2000 to 2014 ............................................................................................................................................... 30
Figure 21. GDP growth forecasts for India between 2017 and 2050 .......................................................... 31
Figure 22. Demand projection for HDVs between 3.5 to 12 tonnes (using the baseline GDP projections
from OECD) ................................................................................................................................................ 32
Figure 23. New HDV sales of 3.5 to 12 tonnes, 2001–2016: model results versus historical data ............ 33
Figure 24. Total diesel consumption of HDVs in Million Metric tonne (MMT), 2010–2016: model results
versus historical data .................................................................................................................................. 34
Figure 25. Annual VKT by HDV type .......................................................................................................... 34
Figure 26. Baseline HDV diesel consumption and CO2 emissions............................................................. 35
Figure 27. Populations of HDVs under 12 tonnes with and without efficiency technology packages over
the study period ........................................................................................................................................... 36
Figure 28. HDV diesel consumption reduction from each technology package ......................................... 37
Figure 29. HDV CO2 emissions reduction from each technology package ................................................ 37
Figure 30. Baseline diesel consumption sensitivity to different GDP growth rates..................................... 38
Figure 31. Sensitivity of fuel savings in the TP1 scenario (compared with the baseline scenario) to
variations in demand growth, VKT decline by age (α), utilization rate, and vehicle lifetime ....................... 39
Figure 32. Sensitivity of fuel savings in the TP1 scenario (compared with the baseline scenario) to 5%
and 10% rebound impacts .......................................................................................................................... 40

 4
Table of Tables

Table 1. Classification of HDVs between 3.5 and 12 tonnes ...................................................................... 11
Table 2. Baseline vehicle parameters ......................................................................................................... 12
Table 3. Engine technology progression..................................................................................................... 14
Table 4. Percentage reduction in fuel consumption due to axle and lubrication improvements................. 15
Table 5. Tire technology progression.......................................................................................................... 16
Table 6. Efficient technology packages ...................................................................................................... 17
Table 7. Baseline HDV fuel efficiencies used in BCA calculations ............................................................. 21
Table 8. Operational characteristics of HDVs in India ................................................................................ 22
Table 9. Correlation of GDP with vehicle stock, 2000–2014 ...................................................................... 31

 5
Executive Summary
This report examines how deploying fuel-saving technologies for new heavy-duty vehicles (HDVs) with
gross vehicle weights (GVWs) of 3.5 to 12 tonnes in India could reduce petroleum consumption and
carbon dioxide (CO2) emissions. Such HDVs play a vital role in India’s economic growth, but they also
consume substantial fuel and produce major environmental impacts. Analyzing the efficiency
improvement potential for this category of vehicles helps clarify the potential impacts of fuel efficiency and
emission standards for all HDVs in India, the home of 18 of the world’s 100 worst pollution-affected cities
(WHO, 2018). This report builds on a previous analysis of Indian heavy-duty vehicles over 12 tonnes.
Methods
The analytical framework previously developed to examine Indian HDVs over 12 tonnes are adapted in
this study. Baseline technology profiles are created for two representative HDV types—an 11.9-tonne
rigid truck and 7.5-tonne transit bus—based on top-selling vehicle models in the Indian market, using
India-specific engine data and vehicle specification information from manufacturer literature and input
from industry experts. For each vehicle type, seven efficiency technology packages (TPs) across five
major areas, based largely on research supporting U.S. HDV fuel efficiency and associated regulations,
are developed: engine, transmission and driveline, tires, aerodynamics, and weight reduction. The
economic benefits and costs for each technology package and vehicle type are estimated to assist Indian
stakeholders to determine feasible levels for HDV fuel efficiency standards for 3.5 to 12 tonnes category.
The fuel-saving technologies for the 2025-2030 timeframe are based heavily on research done in support
of the fuel efficiency and greenhouse gas regulation for HDVs in the U.S.
Another model is also developed to estimate the fleet-wide fuel demand and GHG impacts of deploying
new HDVs with the TPs starting in 2020. The model is calibrated for new HDV vehicle sales, overall
population, and total fuel consumption using historical statistics from the Indian government.
Results
Results show that India has substantial opportunity to improve the fuel efficiency of HDVs of 3.5 to 12
tonnes using cost-effective technologies. As shown in Table ES 1, TPs improve the fuel economy of
these vehicles by 7% (TP1) to 28% (TP6) and provide a return on the initial capital investment within
about one year (TP1) to three years (TP6). Since HDVs are typically driven more and have substantially
higher fuel consumption compared with personally owned vehicles, fuel-saving technologies for HDVs
generally have relatively short payback periods. Use of the loan shortens payback periods even more
while decreasing NPV. TP7—which adds the relatively expensive hybrid-electric system—is the only
exception. Its initial cost is not paid back within the lifetime of the vehicles analyzed.

Across all the technology packages and vehicle types, engine and tire technologies provide the most
cost-effective efficiency improvements, primarily for two reasons: 1) under India-specific driving conditions
(low average speeds and prevalent overloading), the combined energy losses due to the engine and tires
represent between 75% and 85% of the total losses, and 2) engine and tire technologies are relatively
inexpensive compared with advancements in other technology areas.

Most technologies in the technology packages are currently unavailable in India. However, the country’s
recent regulation of HDVs over 12 tonnes could spur significant deployment of such technologies, which
are available in more advanced markets such as the United States and European Union.

 6
Table ES 1. Results: Fuel consumption reduction, incremental cost, and payback time of each TP

 Incremental
 Fuel
 Vehicle cost, including Payback
 Technology packages consumption
 type tax and 20% (years)
 reduction
 markup
 Baseline 0.0%
 TP1. Radial tires + BS VI engine 14.0% 8.0% 1.0
 TP2. LRR tires + BS VI engine 15.4% 8.8% 1.0
 TP3. LRR tires + 'Advanced Level 1' engine +
 21.1% 23.4% 2.1
 AMT
 TP4. LRR tires + 'Advanced Level 1' engine +
 Rigid 22.0% 25.8% 2.3
 Advanced AMT
 truck
 TP5. LRR tires + 'Advanced Level 2' engine +
 24.6% 30.6% 2.4
 Advanced AMT + 1% weight reduction
 TP6. Advanced tires + 'Advanced Level 2'
 engine + Advanced AMT + Moderate truck aero 27.8% 46.5% 3.5
 + 2.5% weight reduction
 TP7. Advanced tires + 'Advanced Level 2'
 engine + hybrid + Advanced truck aero + 5% 40.4% 257.7% >20
 weight reduction
 Baseline 0.0%
 TP1. BS VI engine 6.9% 6.8% 0.9
 TP2. LRR tires + BS VI engine 8.0% 7.8% 0.9
 TP3. LRR tires + 'Advanced Level 1 Engine'
 14.2% 33.0% 2.6
 engine + AMT
 TP4. LRR tires + 'Advanced Level 1' engine +
 Transit 15.3% 37.8% 2.8
 Advanced AMT + 1% weight reduction
 bus
 TP5. LRR tires + 'Advanced Level 2' engine +
 18.2% 45.1% 2.8
 Advanced AMT + 2.5% weight reduction
 TP6. Advanced tires + 'Advanced Level 2'
 engine + Advanced AMT + 5% weight 20.6% 56.0% 3.1
 reduction
 TP7. Advanced tires + 'Advanced Level 2'
 36.2% 410.7% >20
 engine + hybrid + 7.5% weight reduction
AMT: automated manual transmission, BS: Bharat Stage, LRR: low rolling resistance.

Introducing fuel efficiency standards for these HDVs in India would provide significant petroleum and
GHG reductions. Figure ES 1 shows diesel savings from each TP between 2020 and 2050. Compared
with the baseline scenario (diesel consumption of 86 billion L and related direct CO2 emissions of 230
million tonnes in 2050), projections show that achieving the TP scenarios would reduce annual diesel
consumption and related direct CO2 emissions by about 10% (TP1), 11% (TP2), 17% (TP3), 18% (TP4),
21% (TP5), 24% (TP6), and 38% (TP7) in 2050. Consequently, the impact of this segment of
transportation on the environment would be reduced.

 7
Diesel Consumption Reduction in Technology 100
 90
 80
 Packages (Billion L)

 70
 TP1
 60
 TP2
 50 TP3
 40 TP4
 30 TP5
 20 TP6

 10 TP7

 0

Figure ES 1. Diesel consumption reduction from each TP

Policy Recommendations

The fuel consumption and GHG reduction benefits from improving the efficiency of 3.5 to 12 tonne
HDVs can best be realized via near-term implementation of fuel efficiency standards. Due to their
relatively high turnover rates and extreme daily usage, freight truck and transit bus fleets in this HDV
category offer great potential for rapid penetration of efficiency technologies. The following actions by
policymakers and other key stakeholders in India’s commercial vehicle industry can create the enabling
environment and potentially pave the way for improving fuel efficiency of small and medium heavy duty
vehicles:

 1. Establish fuel efficiency standards: Since 2017, India has set up fuel efficiency standards
 (administered by the Bureau of Energy Efficiency) for commercial HDVs with GVW of 12 tonnes
 and above. These standards will be ratcheted up by 8-10%, depending on the GVW and axle
 configuration, in April 2021. Medium and Light HDVs with GVW between 3.5 tonnes and 12
 tonnes are not governed by any fuel efficiency standards. These vehicles are responsible for
 roughly 40% of the total fuel consumption and thus emissions by HDVs in India (Karali et al.,
 2017). Given the cost-effectiveness of key efficiency technologies shown in this report,
 establishing fuel efficiency standards for this category of HDVs in the near future will make a
 large impact in the overall fuel consumption, imports, and GHG emissions. It is also important to
 harmonize standards for smaller and larger HDVs to avoid large differences in fuel efficiency
 targets at GVWs of exactly 12 tonnes.

 2. Develop fuel efficiency regulatory norms with long term targets: Early signaling of efficiency
 targets gives industry sufficient time for research, development, and deployment of new and
 improved technologies. For example, Japan’s Top Runner Program sets the fuel efficiency
 standard of cars as well as HDVs. The Top Runner Program determines the fuel efficiency target
 for a future year based on the most efficient product in that class already available in the market.
 Typically, this raises the efficiency target significantly, but manufacturers are given several years
 to comply. In the United States, the HDV fuel efficiency standards have a long-term target as well.
 For example, in 2011 HDV fuel efficiency and GHG emission targets were set for 2017 and
 targeted ~24% fuel efficiency improvement over the 2010 models. Also, 2027 fuel efficiency

 8
norms were enforced in 2016 with a target of improving the efficiency by 30% over 2017 models.
 India is well positioned to leverage the lessons learned and the technical data from existing HDV
 fuel efficiency and GHG regulations. The Indian HDV industry needs to comply to the Bharat VI
 emission standards from 2020 onward.1 Therefore, it would be advantageous to align the staging
 of fuel efficiency standards with the emission standards schedule. Requiring simultaneous
 technology upgrades for pollutant emissions and efficiency will likely ease the burden on
 manufacturers’ design cycles, which typically occur at three to four year intervals.

 3. Cultivate testing efforts for heavy duty vehicles, engines, and component systems.
 Accelerating efforts to: (a) develop and implement testing campaigns will provide the data critical
 for better fuel efficiency regulations and real-world benefits, (b) make the standardized test results
 widely accessible.2 This will also potentially help streamline vehicle testing efforts. Moreover,
 streamlining testing campaigns will be immensely helpful in eventually moving towards a
 simulation based testing framework for more accurate representation of the vehicle efficiency in
 real-world driving conditions. The Government of India, industry, and research community play a
 part in cultivating testing regimes.

 4. Develop complementary policies for alternative fuel and electric vehicles. Another possible
 pathway could be a corresponding transition to alternative powertrain technologies, such as electric
 buses and trucks, to reach a significant share of the on-road fleet by 2050. India has already
 announced an aspirational goal of electrifying all vehicles sales by 2030. Several cities have
 already implemented pilot programs for including electric buses in their municipal bus fleets. As a
 policy example at the subnational level in the U.S., California’s Zero Emissions Vehicle (ZEV)
 mandate has been successfully used to encourage the long-term transition to cleaner mobility
 options.

1
 https://www.theicct.org/sites/default/files/publications/India%20BS%20VI%20Policy%20Update%20vF.pdf
2
 Test drive cycle and the real-world drive cycle of a vehicle may be significantly different from each other, which could create
discrepancy between the design fuel efficiency and real-world fuel efficiency.

 9
1 Introduction
India’s transportation sector grew at an average rate of 6.8% between 2000 and 2015, and it currently
accounts for 14% of the country’s final energy consumption (IEA, 2015). The sector’s energy
consumption is dominated by diesel fueled heavy-duty vehicles (HDVs). About 70% of the country’s
diesel is consumed by the transportation sector (PPAC, 2013). Trucks and buses together account for
54% of the total diesel consumed by road transport (PPAC, 2013). India's diesel consumption has
doubled in the past decade, increasing from 36.6 million metric tonnes (MMT) in 2002 to 79.3 MMT in
2017. (MoPNG, 2018). Overall the import dependence of India’s petroleum product consumption is very
high. For example, nearly 87% of total crude oil consumption (220.4 MMT) in 2017-18 was imported.
Between the 1950s and 2011, road transportation’s share of passenger travel in India increased from
15% to 86%, and its share of freight movement increased from 14% to roughly 70%, while total road
network length increased from 0.4 million km to 4.7 million km (Malik and Tiwari, 2017). Most of the
growth has been realized in the last two decades. For example, road freight movement (in tonne-
kilometers) and road passenger movement (in passenger-kilometers) increased at an average annual
growth rate of 8.9% and 10.2% between 2002 and 2012, respectively (MoRTH, 2015). The HDV
population, including all bus and truck categories, increased from about 1.7 million in 2000 to about 4.7
million in 2016 (International Council on Clean Transportation, 2018). This growth in HDVs is expected to
continue and increase India’s petroleum import dependency from 76% to 90% by 2030 (Sharma et al.,
2014).
In addition to consuming substantial petroleum, HDVs in India release large amounts of toxic air
pollutants and greenhouse gases (GHGs). Emission analyses for different cities in India suggest that
diesel operated commercial vehicles are the largest contributors to overall emissions (Clean Air Asia,
2012; Goel and Guttikunda, 2015; Guttikunda and Kopakka, 2014; Guttikunda and Mohan, 2014;
Ravinder et al., 2014; Sharma et al., 2014).
In Karali et al. (2017), it was estimated that HDVs with a gross vehicle weight (GVW) above 12 tonnes
represent 60% of total fuel use and GHG emissions from the entire Indian HDV fleet. In the same study,
the costs and benefits of fuel-saving technologies for new HDVs above 12 tonnes over the next 10 years
was analyzed. The study also explored how various scenarios for the deployment of vehicles with these
technologies would impact oil consumption and carbon dioxide (CO2) emissions over the next three
decades. On August 16, 2017, India regulated HDVs with a GVW of 12 tonnes or greater. Phase 1 went
into effect on April 1, 2018, while Phase 2 is effective beginning April 1, 2021 (Garg and Sharpe, 2017).
This study complements Karali et al. (2017) by focusing on heavy-duty trucks and buses with GVW
between 3.5 and 12 tonnes. As seen in Figure 1, HDVs within this category represented about 34% of
India’s total HDV fleet in 2016. These vehicles are responsible for roughly 40% of India’s total HDV fuel
consumption and emissions (Karali et al., 2017), which corresponds to about 15% of total diesel
consumption of India. Currently, India has no fuel efficiency standards for this category of vehicles.

 10
5.0 100%
 4.5 90%
 HDV Stock (Million vehicles)

 4.0 80%

 Share of
Figure 2. Summary of methods

2 Baseline and Efficient Vehicle Technologies

This section describes the representative vehicle models and technology areas explored in this analysis.
After discussing the baseline vehicle technology levels and the methods used to project opportunities for
efficiency technologies, the vehicle-level fuel consumption reduction potential for seven technology
packages are estimated.
 2.1 Baseline Vehicle Characteristics

The baseline vehicle technology levels are derived from manufacturer specification sheets and insights
provided by industry experts for the India’s best-selling new, less than 12 tonne vehicles in fiscal year
2013–2014 (Table 2).3 Both vehicles have the same 3.8-L diesel engine with a peak rated power of 92
kW, which simulated using brake-specific fuel consumption data developed from engine dynamometer
testing performed by an automotive research facility in India. The engine is certified at the Bharat Stage
IV (BS IV) emission level.
Table 2. Baseline vehicle parameters

 Parameter Rigid truck Transit bus
 Model year 2017

 Engine Bharat Stage IV with exhaust gas recirculation, 3.8 liter, 92.1 kW
 Transmission 6-speed manual

 (gear ratios: 1st, 2nd, 3rd, …, 6th) (7.9 (reverse), 9.2, 5.3, 3.2, 2.1, 1.4, 1)

3
 Total sales for each model include all currently available models sold in India.

 12
4,698 Maximum payload (kg) 8,405 (roughly 80 passengers if 60 kg per person is assumed)4 Gross vehicle weight (kg) 11,990 7,490 Coefficient of aerodynamic drag (CD) 0.7 Frontal area (m2) 5.5 6.2 Coefficient of rolling resistance (CRR) 0.0088 0.0072 Final drive ratio 5 5 There is no available data on typical loading factors for trucks or buses in India, so these vehicles are modeled assuming maximum GVW and thus maximum payload. Discussions with fleets and experts from the trucking industry indicate that very heavy loading is common for the HDV sector in India. For the technology packages in which it is assumed that weight-reduction technologies such as material substitution reduce the curb (or empty) weight of the vehicle, the payload is increased such that the GVW remains constant. For example, if the curb weight of the vehicle is decreased by 200 kg, the payload value is increased by 200 kg. The simulations are performed using Autonomie, a modeling tool developed in the United States (UChicago Argonne LLC, 2016), to evaluate the reduced fuel consumption due to individual technologies and technology packages. The packages are detailed in Sections 2.2. through 2.6, and the simulation results are discussed in Section 2.7. 2.2 Engine Technologies Beginning on April 1, 2017, all HDVs in India were required to achieve the BS IV emission standard. BS IV is the Indian version of the Euro IV emission-control regulation that was introduced in the European Union in January 2005 (Central Pollution Control Board, 2017). In early 2016, India’s Ministry of Road Transport and Highways issued a draft notification for leapfrogging BS V to go directly to the BS VI emission standard starting April 1, 2020. The shift from BS IV to BS VI requires manufacturers to make substantial investments in technology, primarily diesel particulate filters (DPFs). DPFs are highly effective in reducing particulate matter emissions. However, as a result of increased backpressure and elevated fuel use that is often required during periodic regeneration, DPFs tend to increase fuel consumption by around 2%–3%. Manufacturers in other markets such as Europe, North America, and Japan have introduced fuel efficiency technologies to mitigate this increased fuel consumption. Table 3 shows the three additional steps in engine technology advancement beyond BS VI assumed in this analysis. On the basis of interview responses from industry experts in India, it is assumed that roughly comparable engine technologies can be used in the Indian HDV market. These engine technology areas include: Friction reduction On-demand accessories Combustion system optimization Advanced engine controls Turbocharger improvements After treatment improvements Waste heat recovery systems, including turbo compounding and Rankine bottoming cycles In Table 3, the fuel consumption reduction percentages for each of the four engine levels beyond the baseline (BS IV engine) are approximations based on Delgado and Lutsey (2015) and on the required engine efficiency improvements for tractor-trailers and vocational vehicles in the U.S. Phase 1 and 2 4 While the manufacturer product specification sheet lists this bus as having a 32-person capacity, anecdotal evidence suggests that passenger over-loading is fairly commonplace in India, this is why this study evaluates the bus at maximum allowable weight. 13
regulations. Delgado and Lutsey assume a U.S. model year 2010 baseline, which is roughly equivalent to
a BS VI (or Euro VI) engine, because both emission levels require roughly the same emission control
technologies to achieve about the same emission benefits (Sharpe and Delgado, 2016). The U.S. fuel
efficiency and GHG regulations for commercial vehicles have separate requirements for engines in
tractor-trailers and vocational vehicles. In both phases of the U.S. regulations, the stringency targets for
the engines of tractor-trailers and vocational vehicles are similar in magnitude.5 However, it is assumed
that similar levels of engine improvements are applicable for rigid trucks and transit buses, although the
specific technology pathways vary according to differences in load and duty cycle. Nearly equivalent
levels of fuel efficiency technology potential have been evidenced in engines across the various HDV
classes and engine sizes in the U.S. regulatory program (US Environmental Protection Agency and
Department of Transportation, 2016).

In addition, it is assumed the transit buses in this analysis are not loaded with air conditioning, since this
is more representative of the current baseline in India. However, if the buses with air conditioning become
the preferred choice for transit agencies, it would be prudent to include air conditioning in the analysis due
to the additional associated auxiliary loads on the engine.
Table 3. Engine technology progression

 Engine technology level Approximate U.S. model year, based on Reduction in engine fuel
 improvements required by U.S. Phase 1 consumption versus baseline
 and 2 fuel efficiency regulations
 Baseline: BS IV engine 2004 —
 BS VI engine 2010 5%
 Advanced Level 1 engine 2014 10%
 Advanced Level 2 engine 2017 12.5%
 Advanced Level 3 engine 2021 15%

 2.3 Transmission Technologies

Advanced transmission technologies include various friction-reduction measures and more highly
integrated engine/transmission strategies, which allow increased engine operation near the highest-
efficiency speed/torque points. Automated manual transmissions (AMTs) are standard manual
transmissions with additional sensors and actuators that allow the transmission control module to shift
gears automatically and without intervention from the driver. Fuel savings are realized because the
engine operates for a larger percentage of time in higher-efficiency regimes. Although the fuel savings
benefits of AMTs are different for the rigid truck and transit bus, data from U.S. regulatory agencies
suggest that these differences are likely one to two percentage points or less ((U.S. Environmental
Protection Agency and Department of Transportation, 2016). Therefore, as a simplification in this study, it
is assumed that the AMT efficiency benefits are the same for both vehicle types. This study assumes two
levels of AMT in operation for India: 1) equivalent to the commercial AMTs currently available in more
advanced markets such as North America and Europe, and 2) accounting for the improvements in AMT
operational efficiency expected to occur in the post-2020 timeframe.

Beyond AMTs, the transmission technology is assumed to have the greatest impact and can be
commercialized between 2020 and 2030 in India is the hybrid-electric drivetrain. A hybrid-electric
drivetrain derives power from two energy sources: the internal combustion engine and the onboard
battery pack. The fuel consumption benefits of a hybrid-electric drivetrain primarily stem from enabling the
engine to operate in higher-efficiency regimes for a larger percentage of the time and from recovering a
portion of the energy otherwise lost as heat during the braking process. Hybrid-electric powertrains are
generally most beneficial in highly transient driving situations. Many HDVs in India, especially the ones
under 12-tonne category, operate in stop-and-go urban driving conditions, so hybrid-electric trucks and

5
 Tractor-trailer engines are evaluated over a steady-state cycle, which is meant to represent highway driving. In
contrast, vocational vehicles, which are assumed to operate much more frequently in urban conditions, have their
engines evaluated with a transient cycle.

 14
buses would likely be highly effective in the Indian context. However, as is the case in other major
markets, hybrid HDVs have seen very limited adoption in India, largely because of prohibitively high
vehicle costs and advances in other fuel-saving technologies areas that are more cost-effective.

Simulating benefits is more difficult for transmission technologies such as AMTs and hybrid-electric
drivetrains than for other technology areas, because much of the fuel-savings potential of these systems
is based on proprietary manufacturer control systems and sophisticated integration of the engine and
transmission. Therefore, the fuel consumption benefits of AMTs and hybrid drivetrains are estimated
during post-processing. For the conventional and advanced AMTs, overall vehicle fuel consumption
reductions of 2.5% and 3.5% are assumed, respectively, based on values in Delgado and Lutsey (2015)
and U.S. HDV GHG regulations. Although the fuel-savings benefits of AMTs are different for the rigid
truck and transit bus, data from the U.S. regulatory supporting materials suggest that these differences
are likely one to two percentage points or less. Therefore, as a simplification in this study, it is assumed
that the AMT efficiency benefits are the same for both vehicle types. For hybrid-electric drivetrains, a 15%
overall fuel efficiency benefit for both the rigid truck and transit bus are assumed, based on values for
light heavy-duty urban vehicles in the U.S. Phase 2 rule (U.S. Environmental Protection Agency and
Department of Transportation, 2016).

Beyond the adoption of advanced transmission technologies such as AMTs and hybridization, it is also
assumed that improvements in axles and lubrication will provide benefits for trucks and buses in India. As
discussed in the Regulatory Impact Analysis for the U.S. Phase 2 regulation, low friction axle lubricants
and other friction-reduction approaches across the driveline can reduce overall fuel consumption by up to
2% (U.S. Environmental Protection Agency and Department of Transportation 2016). As shown in Table
4, axle efficiency and lubrication improvements are assumed to provide between 0.8% (TP1) and 1.5%
(TP7) fuel savings and that these percentages are the same across the two vehicle types.
Table 4. Percentage reduction in fuel consumption due to axle and lubrication improvements

 Technology package Fuel savings due to low friction axle lubricants and other driveline
 friction-reduction inventions
 1 0.8%
 2 0.9%
 3 1.0%
 4 1.1%
 5 1.3%
 6 1.4%
 7 1.5%

 2.4 Tire Technologies

Rolling resistance, or rolling friction, is the force resisting the motion of the tires on a surface. As the
vehicle moves, the tire undergoes repeated cycles of deformation to adopt a moving contact patch with
the surface. The energy difference between deformation and recovery results in hysteresis losses in the
form of heat energy. The force can be calculated as a function of vertical load, the wheel radius, and the
tow force applied on the vehicle. The constant of proportionality is termed the coefficient of rolling
resistance (CRR) and is defined as follows:

 = / (Eq.1)

Values for CRR are dimensionless and are typically less than 0.01 (Committee to Assess Fuel Economy
Technologies for Medium- and Heavy-Duty Vehicles, 2010). The two different types of tire construction
are bias-ply (“bias”) and radial. Bias tires consist of layering, where rubber plies overlap one another and
run across the tires in alternating layers. In radial tires, the casing ply runs perpendicular to the
circumference of the tire, thereby increasing the tire flexibility, because the sidewalls of a radial tire are
not as thick as those of a bias tire. Increased tire flexibility results in lower hysteresis losses as well as a
larger contact patch with the road surface. The biggest advantage of bias tires is their lower cost,

 15
whereas radial tires yield better fuel efficiency, longer useful life, and better performance. Interviews in
2016 with tire manufacturers in India indicate that roughly 80% of the HDV market in India uses bias tires.
According to industry experts, the continued prevalence of bias tires is driven primarily by upfront cost
sensitivity of the Indian market. In contrast, the transition to radial tires for HDVs is virtually complete in
regions such as North America, Europe, and Japan (Malik et al., 2016).

Beyond the transition from bias to radial tires, two additional levels of radial tire technology improvements
are used, based on advances that have happened, or are anticipated, in more technologically advanced
regions. These two levels of low-rolling-resistance (LRR) tires represent improvements in the choice of
elastomers, arrangement of belts and reinforcement, and tread design. Adjustments in each of these
factors work together to reduce CRR values, but reduced rolling resistance must be balanced with
sufficient traction and braking performance. The three tire technology levels beyond the baseline and their
respective reduction in CRR values are shown in Table 5. The CRR values for each technology level are
based on input from industry experts and data from both phases of the U.S. HDV fuel efficiency and GHG
regulation. While simulation modeling results indicate that as vehicle weight increases, the tire rolling
resistance contribution to overall losses increases, this study does not try to take into account the
potential impacts of vehicle overloading beyond the maximum GVW.
Table 5. Tire technology progression

 Tire technology level Reduction in CRR versus the baseline
 Baseline: Bias tires* —
 Radial tires 15%–30%
 LRR radial tires 30%–40%
 Advanced LRR radial tires 40%–50%
* Bias tires are the baseline technology for the rigid truck; radial tires are the assumed baseline for the transit bus.

On the basis of information from tire industry experts in India, it is assumed that bias tires are the baseline
for rigid trucks. However, radial tires are already used with transit buses on a large scale, so radial tires
are applied as the baseline technology level for the bus.

In addition to improved tire designs, systems such as automatic tire inflation and air pressure monitoring
can help reduce rolling resistance by maintaining optimum air pressure. As the amount of air in the tire
decreases, the area of the tire in contact with the surface increases, resulting in higher frictional losses.
According to Goodyear, the approximate relationship is that every 10 psi (69 kPa) of under inflation
results in 1.5% lower fuel economy (Goodyear Tire and Rubber Company, 2015). On the basis of
conversations with tire manufacturers and other industry experts, it is assumed that tire pressure
management systems can play an important role in improving the fuel efficiency of commercial vehicles in
India.
 2.5 Aerodynamic Technologies

As a vehicle moves down the road, a pressure distribution acts on the vehicle’s surface and exerts a
normal pressure on the body. The summation of these normal forces that act downstream to the direction
of motion represents the drag force acting on the vehicle. The aerodynamic drag force, F, is defined as:

 = 0.5 D 2 (Eq.2)

where A is the frontal area of the vehicle around which the air must flow, V is the velocity of the vehicle,
and CD is the coefficient of drag. Aerodynamic improvements allow the air around the vehicle to move
more smoothly, thereby decreasing the drag force exerted on the vehicle. Because aerodynamic force is
directly proportional to the square of the velocity of the vehicle, aerodynamic improvements have a
greater effect at highway speeds than in urban settings, which typically have lower speeds and include
stop-and-go conditions. It is assumed that there are limited opportunities for aerodynamic improvements
on transit buses in India because of their low average speeds and frequent stops. Therefore, this study

 16
does not include aerodynamic technologies in any of the transit bus technology packages. For rigid trucks, a larger percentage of operations at higher speeds and apply aerodynamic interventions in the more advanced technology packages are assumed. 2.6 Weight-Reduction Technologies Reducing vehicle weight results in lower power requirements, thereby making the vehicle more fuel- efficient. Across all types of HDVs, manufacturers have commercialized and continue to develop products using alternative materials such as aluminum and composites that lower vehicle curb (empty) weight. In addition to reducing inertial and rolling resistance forces, the efficiency benefits of weight reduction are compounded if the operator can increase the payload as a direct result of reducing the vehicle curb weight. The potential benefit of increasing payload as a result of vehicle weight reduction is substantial in India, where freight vehicles often exceed maximum allowable GVW limits. This study represent reduced vehicle weight as a lower curb weight; the payload value is kept constant, and thus the total weight (i.e., vehicle curb weight + payload) decreases in the simulations. However, it is likely that if lightweighting presented opportunities for additional payload, trucking fleets in India would take advantage and increase the payload accordingly. For the sake of showing the fuel efficiency benefits of lightweighting, payload is held constant in the simulations. In the technology packages described below, the first four levels for rigid trucks and the first three levels for transit buses have no weight reduction beyond baseline values; the more advanced levels incorporate weight reductions incrementally, reaching 5% for trucks and 7.5% for transit buses. The more aggressive approach to weight reduction for transit buses is evidenced in the literature (Committee to Assess Fuel Economy Technologies for Medium- and Heavy-Duty Vehicles, 2010), and it addresses the lack of aerodynamic improvement for the transit bus in this study. 2.7 Technology Packages Fuel efficiency technology packages are developed by incrementally adding increasingly efficient technologies in the following areas: Engine Transmission and driveline Tires Aerodynamics (trucks only) Weight reduction Table 6 summarizes the technology packages for the rigid truck and transit bus. Figures 3 summarizes the per-vehicle fuel consumption results for each technology package, and Figure 4 shows the incremental cost breakdown for each package by major technology area (i.e., showing the differences between costs for the baseline vehicles versus the vehicles with specified technology packages). Table 6. Efficient technology packages Vehicle Technology Packages Baseline TP1. Radial tires + BS VI engine TP2. LRR tires + BS VI engine Rigid truck TP3. LRR tires + 'Advanced Level 1' engine + AMT TP4. LRR tires + 'Advanced Level 1' engine + Advanced AMT TP5. LRR tires + 'Advanced Level 2' engine + Advanced AMT + 1% weight reduction TP6. Advanced tires + 'Advanced Level 2' engine + Advanced AMT + Moderate truck aero + 2.5% weight reduction 17
TP7. Advanced tires + 'Advanced Level 2' engine + hybrid + Advanced truck aero + 5% weight
 reduction
 Baseline
 TP1. BS VI engine
 TP2. LRR tires + BS VI engine
 TP3. LRR tires + 'Advanced Level 1 Engine' engine + AMT
Transit bus
 TP4. LRR tires + 'Advanced Level 1' engine + Advanced AMT + 1% weight reduction
 TP5. LRR tires + 'Advanced Level 2' engine + Advanced AMT + 2.5% weight reduction
 TP6. Advanced tires + 'Advanced Level 2' engine + Advanced AMT + 5% weight reduction
 TP7. Advanced tires + 'Advanced Level 2' engine + hybrid + 7.5% weight reduction

 45%

 40%
 Fuel consumption reduction

 35%

 30%

 25%

 20%

 15%

 10%

 5%

 0%
 TP1 TP2 TP3 TP4 TP5 TP6 TP7 TP1 TP2 TP3 TP4 TP5 TP6 TP7
 Rigid truck Transit bus

 Engine Transmission and driveline Tires Aerodynamics Weight reduction

Figure 3. Fuel consumption reduction for each technology package

 18
Figure 4. Incremental cost breakdown for each technology package
Note: Cost breakdown for a TP7 truck: 11% engine, 77% transmission and driveline, 2 % tires, 4% aerodynamics, and
6% weight reduction. Cost breakdown for a TP7 bus: 11% engine, 84% transmission and driveline, 1.5 % tires, and
3.5% weight reduction.

 19
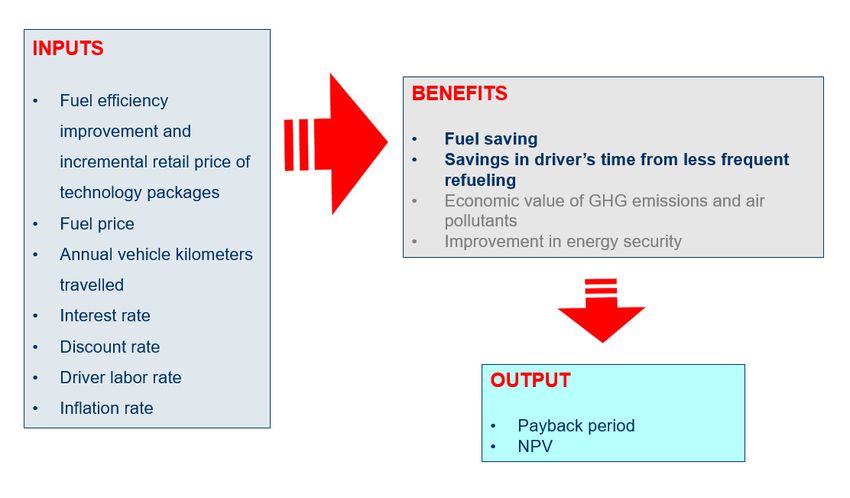
3 Benefit-Cost Analysis

In this section, a comprehensive assessment of the costs and benefits associated with each of the
technology packages defined in Section 2 are performed.
 3.1 Methods and Key Assumptions

The HDV BCA follows a standard BCA approach to estimating common socioeconomic indicators, such
as net present value (NPV) and payback period (Figure 5). See Karali et al. (2017) for a detailed
description of the model and equations. The inputs include annual vehicle kilometers traveled (VKT),
vehicle fuel efficiency, fuel prices, driver labor rates, vehicle inflation rate, discount and interest rates, and
incremental technology costs. This study only considers costs and benefits directly experienced by truck
and bus owners and operators in India, including the benefits of fuel cost savings and reduced refueling
time. Please note that this study does not include the economic value of reduced GHG emissions and air
pollution as well as improvements in energy security due to oil import reductions (grayed-out benefits in
Figure 5) in the current analysis. A separate analysis would be required to determine such benefits in
India. For context, India imported 2.25 Billion bbl of oil/refined products in 2017.

Figure 5. General structure of the HDV BCA model
Note: See Karali et al. (2017) for the details of the model and equations. Sensitivity analysis is performed for the input
parameters circled in orange.

 3.1.1 Baseline Fuel efficiency Values
Baseline fuel efficiency levels for the representative vehicles in each category are summarized in Table 7.

 20
Table 7. Baseline HDV fuel efficiencies used in BCA calculations

 Weight (tonnes GVW) Fuel Efficiency (km/L)
 LDT 7.5 4.91
 MDT 11.9 4.44
 LDB 7.5 4.94
 MDB 10.0 4.55
 3.1.2 Annual Vehicle Kilometers Traveled
First-year VKTs for new trucks of 35,000 km for LDTs and 65,000 km for MDTs are assumed. The first-
year VKT for all transit buses is 114,425 km (Association of State Road Transport Undertakings, 2012). It
is also assumed that VKT per vehicle decreases exponentially with vehicle age, as is generally the case
in other vehicle activity, fuel, and emissions models (US Environmental Protection Agency, 2011;
California Air Resources Board, 2015). The equation to calculate VKT over time is as follows:

 = 1 ∗ − ∗ (Eq.3)

 where represents the annual VKT of the vehicle at a certain age,
 1 is the first-year VKT of the vehicle,
 is the age of the vehicle,
 is a decline parameter that controls how fast VKT declines over time.

 is set at 0.07 for trucks and buses, based on Karali et al. (2017).
 3.1.3 Diesel Prices
The average price of transportation diesel fuel in India was about 65 Rs/L in 2018 (PPAC, 2018).
Because the phase-in of diesel price deregulation was completed in 2014, there is no longer diesel price
certainty in India (Editorial Board of the Times of India, 2014). To account for this, the diesel price is kept
constant at 65 Rs/L and varied by ± 25% in a sensitivity analysis, and there is also another sensitivity
analysis based on the U.S. Energy Information Administration’s (EIA) diesel price growth forecasts in the
United States (US Energy Information Administration, 2018).
 3.1.4 Other Parameters
Other parameters relating to the operational characteristics of HDVs in India are summarized in Table 8.
In addition, the assumed discount rate is 6.25% (U.S. Central Intelligence Agency, 2018). The annual
depreciation and interest charges are applied as 16% and 12%, respectively, of the purchase price (Axis
Bank India, 2018). The total markup is subject to large variation, and there is no evidence to back up any
markup rate in India. The markup rate on manufacturing cost in this study is assumed to be 20% based
on the markup value used in the U.S. HDV GHG regulation (U.S. Environmental Protection Agency and
Department of Transportation, 2016).
In 2015, the Federation of Indian Chambers of Commerce and Industry (FICCI, 2015) assumed that
average life for diesel trucks was 13–16 years. The average life of buses in India is 10–12 years
according to the Association of State Road Transport Undertakings (2012). It is assumed that average
lifetimes of trucks and buses are 14 and 12 years, respectively.

 21
Table 8. Operational characteristics of HDVs in India

 Average Driver labor Tank Fuel Refueling
 lifetime rate* Rs/hour) volume** dispensing fixed
 (years) (L) rate*** time***
 (L/min) (min/refill)
 LDT and MDT 14 63 160 76 3.5
 LDB and MDB 12 63 160 38 3.5
Note: The average age is assumed to be 5 years for both rigid trucks and transit buses in 2000, based on the CSIR-
CRRI report (Ravinder et al., 2014).
* Source: TCI (2016). The driver labor rate was increased by the inflation rate of 4.36% (Ministry of Statistics and
Programme Implementation, 2018).
** Source: Assumption based on vehicle specification sheets (Tata Motors 2018a, Tata Motors 2018b).
*** Source: Assumption based on refueling rates presented in US Environmental Protection Agency and Department
of Transportation (2016).

 3.2 Benefit-Cost Analysis Results
 3.2.1 BCA Fuel efficiency Scenario Results
Figure 6 shows payback periods of the technology packages versus the baseline scenario for 11.9-tonne
rigid trucks, and Figure 7 shows the results for 7.5-tonne transit buses, which are the two primary weight
categories analyzed in this project. For the trucks, the payback period is about 1 year with TP1 and TP2,
less than 2.5 years with TP3, TP4, and TP5, and about 3.5 years with TP6. For the buses, the payback
period is less than 1 year with TP1 and TP2, less than 2 years with TP3, TP4, and TP5, and 2.2 years
with TP6. For both vehicle types, the payback time with TP7—which adds the relatively expensive hybrid-
electric system—is over 20 years and thus longer than the vehicle lifetimes.

Figure 6. Payback periods for the 11.9-tonne rigid truck with each technology package, assuming one-time
upfront payment
Note: Bars represent incremental cost, and markers represent payback.

 22
Figure 7. Payback periods for the 7.5-tonne transit bus with each technology package, assuming one-time
upfront payment
Note: Bars represent incremental cost, and markers represent payback.

Figure 8 shows the NPV of the two vehicle types. Investing in an efficient technology package would save
between $11,573 (TP1) and $16,254 (TP5) per rigid truck, and between $8,895 (TP1) and $20,644 (TP6)
per transit bus over the lifetime of each vehicle. From the customer point of view, the most attractive
technology packages are TP5 for the rigid truck and TP6 for the transit bus, because they provide the
highest NPV over the vehicle lifetime. The truck’s NPV with TP6 is slightly lower than with TP5, because
the net-present cost increase more than offsets the net-present benefit increase when moving from TP5
to TP6 (Figure 9). The NPV is higher for the truck than for the bus when both vehicle types have TP1 or
TP2, but the bus has a higher NPV under all the other TP scenarios owing to more favorable
combinations of cost and benefit (Figure 9, Figure 10). For both vehicle types, NPV with TP7 is negative
(Figure 8).

 ₹15

 ₹10
 NPV (Rs. in Lakh)

 ₹5

 ₹0
 TP1 TP2 TP3 TP4 TP5 TP6 TP7
 -₹5

 -₹10

 -₹15

 -₹20
 Rigid truck Transit bus

Figure 8. NPV results for each technology package and HDV category, assuming one-time upfront payment

 23
Note: HDV categories illustrated here represents a 11.9-tonne rigid truck and 7.5-tonne transit bus.

 ₹20

 ₹15

 ₹10

 ₹5

 ₹-
 TP1 TP2 TP3 TP4 TP5 TP6
 ₹-5

 ₹-10

 NPV of Benefits ($) NPV of Cost ($) NPV ($)

Figure 9. Benefits, costs, and NPV of rigid truck for TP1–TP6
Note: HDV categories illustrated here represents a 11.9-tonne rigid truck and 7.5-tonne transit bus.

 ₹25

 ₹20

 ₹15

 ₹10

 ₹5

 ₹-
 TP1 TP2 TP3 TP4 TP5 TP6
 ₹-5

 ₹-10

 NPV of Benefits ($) NPV of Cost ($) NPV ($)

Figure 10. Benefits, costs, and NPV of transit bus for TP1–TP6
Note: HDV categories illustrated here represents a 11.9-tonne rigid truck and 7.5-tonne transit bus.

 3.2.2 BCA Sensitivity Analysis Results
The incremental costs of future technologies and long-term diesel prices likely represent the largest
uncertainties in this analysis. Figures 11 and 12 shows the sensitivity of the payback period and NPV to a
± 25% change in incremental cost for TP1–TP6. The payback variations are less than 1 year under most
scenarios, except for the 1.2 years for trucks with TP6 (Figure 11). NPV shows an opposite trend as
expected. NPV goes down as incremental cost goes up (Figure 12). For trucks, changes in NPV range
from about ± $500 with TP1 to about ± $3,000 with TP6. For buses, the range is about ± $280 with TP1 to

 24
You can also read