Rocky reef impacts of the 2016 Kaikōura earthquake: extended monitoring of nearshore habitats and communities to 3.5 years
←
→
Page content transcription
If your browser does not render page correctly, please read the page content below
Rocky reef impacts of the 2016 Kaikōura
earthquake: extended monitoring of
nearshore habitats and communities to 3.5
years
New Zealand Aquatic Environment and Biodiversity Report No. 253

        T. Alestra,
        S. Gerrity,
        R.A. Dunmore,
        D. Crossett,
        S. Orchard,
        D.R. Schiel

ISSN 1179-6480 (online)
ISBN 978-1-99-100331-7 (online)

March 2021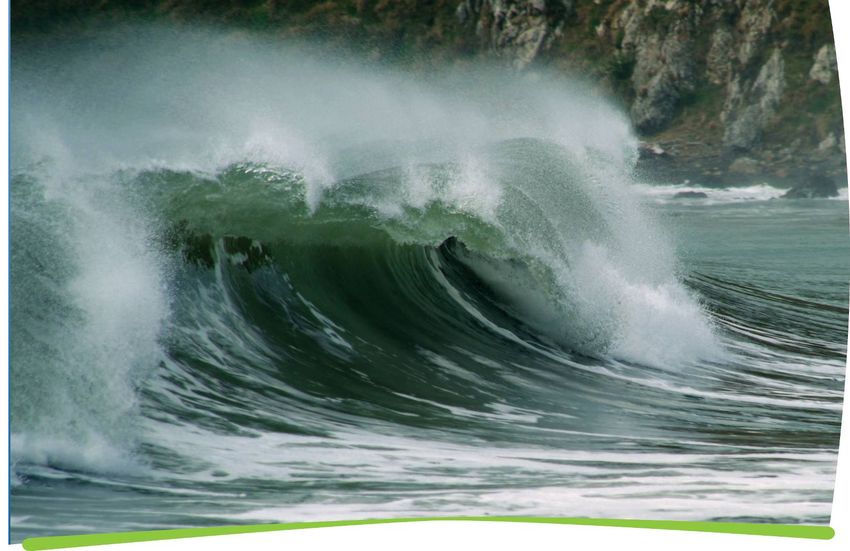
Requests for further copies should be directed to:

Publications Logistics Officer
Ministry for Primary Industries
PO Box 2526
WELLINGTON 6140

Email: brand@mpi.govt.nz
Telephone: 0800 00 83 33
Facsimile: 04-894 0300

This publication is also available on the Ministry for Primary Industries websites at:
http://www.mpi.govt.nz/news-and-resources/publications
http://fs.fish.govt.nz go to Document library/Research reports

© Crown Copyright – Fisheries New Zealand
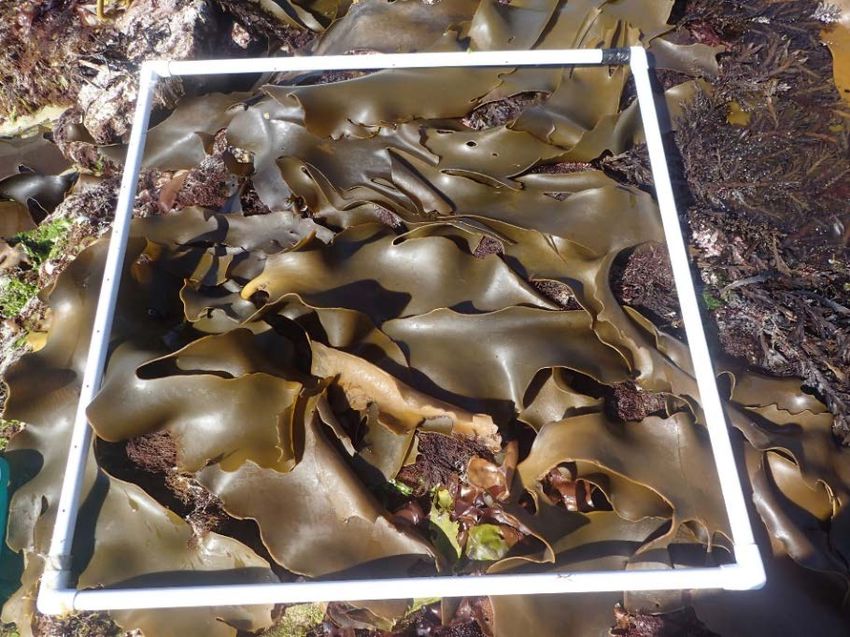
TABLE OF CONTENTS
EXECUTIVE SUMMARY                                                                  1

1.         INTRODUCTION                                                            3

2.         METHODS                                                                 4
     2.1     Survey design                                                         4
     2.2       Intertidal community surveys                                        6
     2.3       Subtidal community surveys                                          6

3.         RESULTS                                                                 7
     3.1     Intertidal benthic community structure                                7
     3.2       Abundance of key intertidal taxa                                   11
       3.2.1       Large brown algae                                              11
       3.2.2       Fleshy red algae                                               17
       3.2.3        Relationship between large brown algae and fleshy red algae   18
       3.2.4       Coralline red algae                                            20
       3.2.5       Limpets                                                        21
     3.3      Subtidal community structure                                        24

4.         DISCUSSION                                                             36
     4.1      Intertidal rocky reefs                                              36
     4.2       Subtidal rocky reefs                                               39
     4.3       Conclusions                                                        40

5.         ACKNOWLEDGMENTS                                                        40

6.         REFERENCES                                                             40

7.         APPENDICES                                                             43
EXECUTIVE SUMMARY

Alestra, T.; Gerrity, S.; Dunmore, R.A.; Crossett, D.; Orchard, S.; Schiel, D.R. (2021).
Rocky reef impacts of the 2016 Kaikōura earthquake: extended monitoring of nearshore
habitats and communities to 3.5 years.

New Zealand Aquatic Environment and Biodiversity Report No. 253. 46 p.

The 7.8 magnitude Kaikōura earthquake in November 2016 caused extensive uplift along
approximately 130 km of the north-eastern coastline of the South Island of New Zealand. This resulted
in widespread mortality of marine organisms and alteration to the community structure and, in many
places, the integrity of intertidal and subtidal rocky reefs. The disturbance adversely affected important
taonga and habitat-forming species, such as pāua (Haliotis iris) and bull kelp (Durvillaea spp.),
prompting an emergency ban on harvesting shellfish and seaweeds that is still in place. This report
describes the results of nearshore reef surveys done at long-term monitoring sites between 2.5 and 3.5
years after the earthquake to assess the community structure and trajectories of recovery of rocky reef
communities. A major goal of this work is to provide detailed information for underpinning informed
decisions about re-opening fishery closures. The sites were first surveyed in 2017 as part of the Ministry
for Primary Industries (MPI) Kaikōura Earthquake Marine Recovery Package. The new results included
in this report relate to the fifth and fourth rounds of intertidal and subtidal surveys, respectively. These
include (i) intertidal surveys done in November 2019 at 16 sites along the coastline between Oaro and
Cape Campbell, encompassing uplift levels between approximately 0 and 6 metres; and (ii) subtidal
surveys at 6 sites (2 around the Kaikōura Peninsula and 4 north of Kaikōura, in the Okiwi Bay/Waipapa
Bay area) in mid-2019 and mid-2020, encompassing uplift levels between approximately 0.7 and
6 metres.

The results of these recent surveys are presented in the context of previous surveys to give a clear
indication of the status and recovery of rocky reef communities. The intertidal surveys showed that
three years after the earthquake all uplifted reefs were still largely unvegetated, with diverse algal
communities found only in the lowest tidal zone. High intertidal areas had limpets and occasional
ephemeral algae but remain barren. Similarly, the mid-tide zone had grazing invertebrates, occasional
ephemeral algae, and occasional small recruits of large brown algae such as Hormosira banksii, but
these algae were burned off in the warmer months. In the low intertidal zone, the presence and
abundance of habitat-forming large brown algae (primarily Durvillaea spp., Carpophyllum
maschalocarpum, Cystophora spp., and Marginariella boryana) varied across uplift levels, with the
greatest abundance at control and low-uplift (under 1 m) sites and the lowest abundance at high-uplift
(up to 6 m) sites. The major noteworthy features of algal changes in the low intertidal zone were: (i)
bull kelp canopy cover remained low at most sites. Their pre-earthquake abundance (as detected by the
initial surveys of uplifted areas immediately post-earthquake) was high in most places; (ii) in many
places, bull kelp was replaced by other large brown algae, primarily Carpophyllum maschalocarpum,
but also a suite of other low-shore fucoids; and (iii) over the last survey period, there was replacement
of large brown algae by fleshy red algae in many places, so their recovery has been poor. In fact, there
was a negative relationship between the covers of large brown algae and fleshy red algae, which
accounted for 10% of the variability in the abundance of large brown algae across all sites in November
2019. Pre-earthquake data show that algal communities at medium- and high-uplift sites were not
dominated by fleshy red algae before the earthquake. Fleshy reds most likely benefitted from the high
mortality of large brown algae following the earthquake and their widespread expansion is now
precluding recruitment of large brown algae.

Coralline algae, which play an important role in the settlement and early survival of invertebrates such
as pāua and cat’s eye snails (Lunella smaragda), were abundant in the low tidal zone at most sites. In
contrast to the slow-recovering large algae, broadcast-spawners, especially a suite of limpets (mostly

Fisheries New Zealand                                                    Kaikōura earthquake - rocky reef impacts• 1
Cellana spp.), recruited heavily within a couple of years post-earthquake. Their abundance was
unrelated to the degree of uplift but was highly variable among sites. Community patterns, taking
account of all the species encountered and their abundances, still showed a clear separation among sites
depending on their degree of uplift. This is a clear indication that ‘recovery’ to pre-earthquake
conditions is far from complete.

Subtidally, there was some recovery of seaweeds and invertebrates at Waipapa Bay, the area with the
highest uplift and most evident earthquake damage, but there were extensive areas of bare rock still
present. There were two striking differences compared with our earlier post-earthquake surveys: (i)
there was a decrease in large brown algae at some sites around the Kaikōura Peninsula and at Okiwi
Bay. This decline may have been due to altered wave dynamics following the uplift, marine heatwaves,
and/or scour due to movement of cobble, gravel, or sand substrates; (ii) in at least one site, there was a
replacement of stands of large brown algae by fleshy red algae (similar to that seen in the low intertidal
zone in some areas). This has resulted in considerable amounts of drifting red algae in shallow areas,
which may prove to be beneficial as food for passive grazers such as pāua.

The physical habitats themselves have continued to change. Intertidal reefs and boulder fields, which
mostly comprise soft sedimentary rock, are continuing to erode and break up. Gravel movement and
accumulation were evident in both the intertidal and subtidal zones, sometimes infilling large areas of
reef and burying resident organisms. Shifts in sand and gravel can delay the recovery of benthic
communities by scouring rock surfaces and smothering organisms and are indicative of a very dynamic
physical environment. Reef erosion is no doubt contributing to the poor recovery of benthic
communities in many areas.

This and related studies are showing a clear picture of the difficulties in resilience and recovery after a
cataclysmic event. Decades of small-scale disturbance experiments along the coast of the South Island
have shown that recovery can be very slow. For example, clearances of several square meters of large
brown algal canopies can take up to 8 years to regain their original cover, and even longer for full
communities to return. ‘Resilience’ usually means a quick recovery to a previous state. This is clearly
not the case along the earthquake coast. ‘Recovery’ also implies a return to a previous state. This has
not yet occurred. The major impediments to recovery are continuing changes to reef integrity, especially
erosion and gravel movement, and poor connectivity between large brown algal populations. This is
especially true for bull kelp, which have a very limited reproductive season and only short-range
propagule dispersal except through drifting, reproductive adults. A slow recovery was expected, and
further changes to algal-dominated communities are anticipated over the next few years. The recovery
of bull kelp populations will be a clear signal that a major pre-earthquake configuration has returned.

This research has been presented regularly to local community groups, iwi, the commercial pāua fishing
industry, and resource managers to facilitate a re-opening strategy for the Kaikōura coast.

2 • Kaikōura earthquake – rocky reef impacts                                             Fisheries New Zealand
1.       INTRODUCTION

The 2016 Kaikōura earthquake caused extensive coastal uplift along about 130 km of coastline (Clark
et al. 2017, Hamling et al. 2017), severely affecting highly productive nearshore ecosystems (Schiel et
al. 2018, Schiel et al. 2019, Gerrity et al. 2020, Thomsen et al. 2020). The Kaikōura coastline is home
to numerous taonga species which support customary, recreational, and commercial fisheries. It is
important to monitor the health of the wider ecosystem, including abundance of biogenic habitats and
seaweed communities, in addition to stock assessments. Extensive field surveys were done between
2017 and 2018 as part of the Ministry for Primary Industries (MPI) Kaikōura Earthquake Marine
Recovery Package to assess the impacts of the earthquake on rocky intertidal and shallow subtidal
biogenic habitats (Alestra et al. 2019). This research provided a detailed assessment of the state of rocky
reef systems along the uplifted coastline and of the impacts of the earthquake on species of ecological,
cultural, and/or commercial significance (e.g., pāua, bull kelp, etc.). It also established a baseline to
gauge successional sequences and recovery dynamics. In summary, the initial research programme
found that the coastline had undergone significant changes in the structure and function of rocky
intertidal and subtidal algal and invertebrate communities and was experiencing variable states of
recovery. Even small changes in tidal elevation as a result of coastal uplift affected habitat-forming
algae and invertebrate abundance. Nearly all intertidal algal and invertebrate taxa experienced reduced
abundance in the months and years following the earthquake compared with pre-earthquake levels.
Although the subtidal communities were less affected, there was a significant decrease in the abundance
of large brown algae, and an increase in newly emerged bare rock. In both intertidal and subtidal zones,
erosion and the presence of mobile substrata such as gravel and sand likely inhibited recovery at some
sites. Despite these impacts, clear signs of post-earthquake reproduction, settlement, and recruitment of
pāua and large brown algae were documented, suggesting some potential for recovery.

The work done as part of the Kaikōura Earthquake Marine Recovery Package assessed the initial
responses of rocky reef systems up to 16 months following the earthquake (to March 2018). To monitor
long-term recovery trajectories and better understand the outcomes of this catastrophic event, further
intertidal and subtidal surveys were carried out in late 2018/early 2019 (described by Alestra et al. 2020)
and between late 2019 and mid-2020 (described in this report). The objectives of this research extension
were to continue monitoring for the original objectives of the 2017 contract:

Overall objective
            1. To quantify the impact of the Kaikōura earthquake on rocky reef intertidal and subtidal
               fauna and either quantify, or establish long-term monitoring sites to quantify, the
               recovery from the earthquake in order to inform future marine management decisions.”
Specific objectives
            1. Determine the impact of the Kaikōura earthquake on rocky reef systems, this may also
               include sub-lethal responses where methodologies to test this exist.
            2. Assess long-term monitoring sites to quantify the recovery from the earthquake in order
               to inform future marine management decisions.
            3. Compare impacts across the range of uplift and habitats impacted on the rocky shore.
            4. Continue monitoring sediment cover to suggest causation between short-term uplift and
               potentially longer-term increased sedimentation as a result of the Kaikōura earthquake.
            5. Where possible include local participation in the recovery package work and specifically
               refer to relevant South Island iwi (Te Rūnanga o Kaikōura and Te Tau Ihu), and local
               community

This report provides an updated assessment of the state of intertidal (up to 3 years post-earthquake) and
subtidal rocky reef communities (up to 3.5 years post-earthquake). This information will provide a
context for management decisions, in particular those regarding the re-opening strategy for shellfish

Fisheries New Zealand                                                   Kaikōura earthquake - rocky reef impacts• 3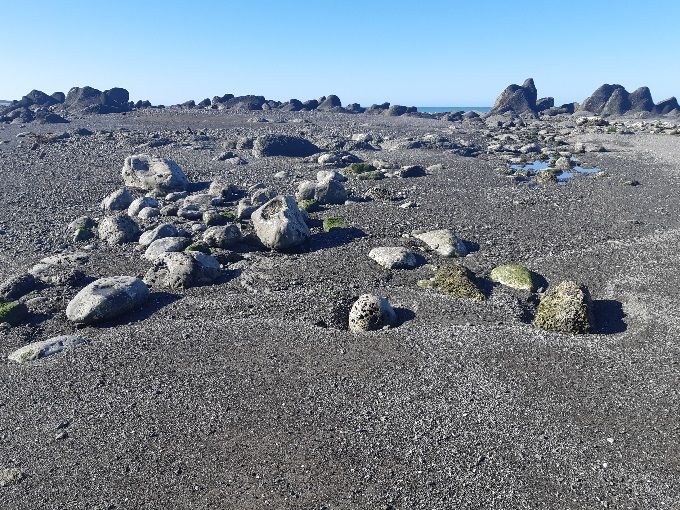
(especially pāua, Haliotis spp.) and seaweed harvest, which has been proposed for late 2021. This work
will also contribute to a very limited pool of long-term studies about post-earthquake recovery of coastal
systems worldwide. Although coastal uplift of this scale is unprecedented, studies from Chile
(Barrientos & Ward 1990, Castilla & Oliva 1990, Jaramillo et al. 2012, Castilla et al. 2010, Castilla
1988) have documented catastrophic effects of seismic disturbances to coastal ecosystems. These
studies consistently show a suite of severe immediate impacts of coastal uplift on marine communities,
followed by a long recovery period of several years. As well, numerous disturbance studies by our
group have shown that even local-scale disturbances to algal canopies can take 8 years to recover (e.g.,
Lilley & Schiel 2006, Schiel & Lilley 2007, Tait & Schiel 2011). This research provides quantitative
survey data to improve our understanding of complex recovery dynamics which follow coastal uplift.

These extended surveys also provide added baselines and references for other research underway. This
uses a more holistic approach based on experimental work and wide-scale habitat mapping to tease out
biological and physical mechanisms driving and underpinning the recovery of earthquake-affected reefs
(Project title: “Community concerns, key species and wahi taonga – recovery trajectories of the marine
ecosystem from the Kaikōura earthquakes”, MBIE, UOCX1704).

2.        METHODS

2.1       Survey design

Intertidal and subtidal surveys were done at a set of sites divided across eight locations which have been
monitored since the earliest round of post-earthquake surveys in mid-2017 (Alestra et al. 2019,
Figure 1). Replicate sites within each location were separated by at least 500 m. These sites were
originally selected to encompass the length of the earthquake-impacted coastline and represent different
levels of uplift (Alestra et al. 2019). Following the uplift categorisation used in previous reports (Alestra
et al. 2019, 2020), the sites are divided into four uplift groups on the basis of uplift information obtained
from GNS Science (K. Clark, personal communication) and our own calculations (Orchard et al.,
unpublished data): control (C – no uplift); low uplift (L – 0.5 to 1.5 m); medium uplift (M – 1.5 to 2.5
m); high uplift (H – 4 to 5.5 m, Figure 1). Recent calculations by Gerrity et al. (2020) showed that rocky
reefs occupy 48 km of the total length of the earthquake-impacted coastline (c.130 km). Three of the
uplift categories used as part of the uplift categorisation are represented and account for 39 km of rocky
reef habitat, whereas only 2 km experienced uplift beyond 4 m (Figure 2).

4 • Kaikōura earthquake – rocky reef impacts                                              Fisheries New Zealand
Figure 1:    The sites used for repeated intertidal and subtidal monitoring were divided across 8 locations
             displayed in this map. The information in parentheses indicates the number of intertidal (int)
             and subtidal sites (subt) per location. Different colours are used for the four uplift categories:
             control (white), low uplift (green), medium uplift (orange), high uplift (red).

Figure 2:    Kilometres of rocky reef habitat that experienced uplift levels in line with our uplift
             characterisation system (white = control, green = low uplift, orange = medium uplift, red = high
             uplift).

Fisheries New Zealand                                                      Kaikōura earthquake - rocky reef impacts• 5
2.2       Intertidal community surveys

Intertidal community surveys were done in November 2019, three years after the Kaikōura earthquake,
at 16 sites across 8 locations and encompassing the degrees of uplift (Figure 1). The methodology
applied in previous post-earthquake sampling was used (Alestra et al. 2019). At each site, sampling was
done along 30-m transects previously established within the current (i.e., post-earthquake) tidal
elevation zones. There was one transect in each of the post-earthquake high, mid (where present), and
low tidal zones. Algae and invertebrates were identified to species level when feasible or to the finest
possible taxonomic resolution, and their abundances were recorded in ten haphazardly located 1-m2
quadrats placed along each transect in each zone. Abundances were expressed as percentage cover for
sessile organisms and as counts for mobile animals.

Data generated by the November 2019 surveys were analysed with univariate (ANOVA) and
multivariate techniques (PERMANOVA) testing for differences among uplift groups and sites
(Anderson et al. 2008, Clarke & Warwick 2001). To provide a comprehensive and easily understandable
overview of the main patterns in intertidal community structure, the results included in this report
mainly relate to broad taxonomic groups (i.e., groups of species sharing common morphological and
life-history traits) and not to individual species.

These include:
   • large brown algae, which are the dominant habitat-forming species along this coastline;
   • fleshy red algae, which account for a large proportion of the diversity in intertidal algal
        communities;
   • coralline red algae, which are also habitat-formers and an important invertebrate settlement
        substrate;
   • limpets, which are the most abundant large intertidal grazers along this coastline.

In light of the opposite patterns of abundance of large brown and fleshy red algae in relation to uplift,
the relationship between these two groups was explored three years after the earthquake. Using the
November 2019 low zone data, a mixed-effects linear regression model was built, with the cover of
large brown algae as a response variable and that of fleshy red algae as a fixed effect. Sites were treated
as random effects to account for the spatial structure of the surveys and partition among- and within-
site variability. Given the large variability in the data, a quantile regression model was used to perform
the same analysis across five different quantiles and test whether the relationship remained stable across
the entire range of the data. Waipapa Bay 1 was excluded from both regression analyses because both
large brown and fleshy red algae were absent at this site three years after the earthquake.

2.3       Subtidal community surveys

Subtidal community surveys were done between May and July 2020, approximately 3.5 years after the
Kaikōura earthquake, at 6 sites selected across 4 locations: Waipapa Bay, Okiwi Bay, and Kaikōura
Peninsula North and South (Figure 1, Appendix 1). These sites encompassed degrees of uplift between
0.5 and 6 m. The low-uplift (around 0.6 m) sites around the Kaikōura Peninsula had no earthquake
damage (Alestra et al. 2019, 2020) and were considered as controls. Sampling followed the
methodology of previous surveys, assessing algae, and sessile and mobile invertebrate community
composition and abundances (Alestra et al. 2019). At each site:
    • three 50 m transects perpendicular to the shore starting from the low tidal mark were re-
        surveyed. Subtidal transects were usually located directly offshore of intertidal transects and
        had been marked using GPS;
    • substrate type and the abundance of all algae, sessile invertebrates, mobile invertebrates, and
        triplefin fish were recorded for 20 × 5 m2 sections along each transect (each section was 1 m
        either side of the transect and 2.5 m in length). Taxa were usually identified to species level,
        and when this was not achievable they were given descriptive names;
    • the sizes of pāua (Haliotis iris and Haliotis australis) were measured using automated calipers
        that also recorded the depth of occurrence;

6 • Kaikōura earthquake – rocky reef impacts                                             Fisheries New Zealand
• the abundance of all large fish was recorded for 5 × 20 m2 sections along each transect (each
section was 1 m either side of the transect, 2 m above the seafloor, and 10 m in length);
• video footage was recorded along transects.
As for previous surveys, subtidal data were filtered to include only quadrats with at least 50% rock
coverage (cobble, boulder, or bedrock). This was done to eliminate the large variability in communities
due to some transects having extensive areas of sand. By eliminating the sandy/gravel quadrats, a more
accurate comparison of the rocky reef communities between transects, sites, and uplift could be made.
The removal of the sand-dominated quadrats resulted in a reduction in the number of replicates,
although most transects (63 out of 67) still had at least 10 quadrats per transect. Numbers of quadrats
per site used in analyses are provided in Appendix 1.
Differences in subtidal community structure and grouped taxa with respect to uplift, site, and transect
were analysed statistically using a distance-based permutational analysis (PERMANOVA). The
PERMANOVA design had four factors; Uplift (fixed, 3 levels: low, medium, high), Survey (fixed, 4
levels), Site (random, nested within Uplift, 6 levels), and Transect (random, nested within Site, 3 levels).
Data were square-root transformed to de-emphasise the influence of abundant organisms, and analyses
were based on Bray-Curtis similarities. For the Bray-Curtis similarity matrices, a dummy variable of
0.01 was used so that double zero data were treated as 100% similar. SIMPER was used to identify taxa
contributing to dissimilarity between communities. To visualise the differences between communities,
principal coordinates analyses (PCO) were run on the resemblance matrices created from distances
among centroids for the unique Site/Transect and Site combinations. Taxa that had a correlation greater
than 0.6 with the PCO axes were displayed as vectors in the PCO plots.
3. RESULTS
3.1 Intertidal benthic community structure
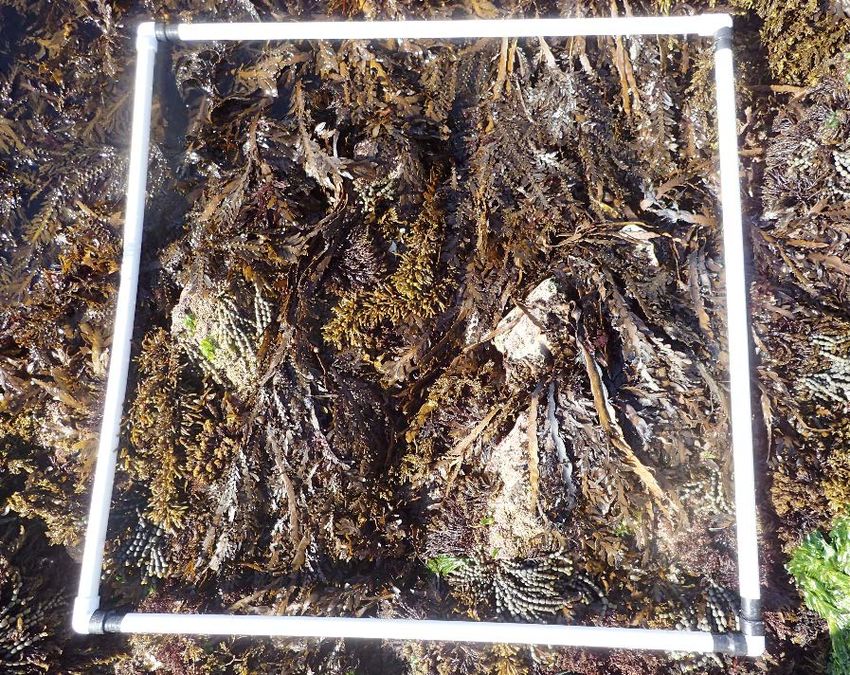
Three years after the earthquake, intertidal reefs remained mostly bare, with algal communities
surviving only in the lowest areas (Figure 3).
Figure 3: Characteristic appearance of post-earthquake intertidal reefs, with extensive bare areas and
algal cover confined to a narrow band in proximity of the low tide mark.
As in previous years (Figures 4 A-D, F-I, K-N), 36 months after the earthquake most of the algal
biomass was found in the post-earthquake low zone on uplifted reefs (Figure 4 O), whereas the high
and the mid zones were generally devoid of algae (Figure 4 E, J). Low algal abundance in the high zone
is typical of rocky intertidal habitats because physical conditions in this area are too harsh for most
seaweeds, but the mid zone environment can support diverse algal communities. However, under all
Fisheries New Zealand Kaikōura earthquake - rocky reef impacts• 7levels of uplift, mid zone areas continued to be mostly unvegetated three years after the earthquake (Figure 4 J). In the low zone, algae were abundant in all uplift groups, and extensive covers of large brown algae characterised communities at the control and low-uplift sites, whereas fleshy red algae were more dominant at the medium- and high-uplift sites (Figure 4 O). Multivariate analyses showed that in November 2019 there was a significant Uplift effect on benthic community composition in the post-earthquake high zone (Uplift: Pseudo-F3,12 = 2.75, P < 0.05, Figure 5 A). However, these differences reflected occasional blooms in the abundance of ephemeral algae rather than a real earthquake legacy. In particular, the control and the low-uplift groups differed from the medium-uplift group because of higher covers of ephemeral green (Ulva spp.) and red algae (Pyropia spp.), respectively (Appendix 2 A). The medium- and high-uplift groups did not differ from each other and there was significant variability in the structure of benthic communities among sites within each uplift group (Pseudo-F12,144 = 6.94, P < 0.001, Figure 5 A). Long-lasting earthquake impacts were more evident in the post-earthquake mid zone, where abundant algal communities could only be found at the control sites (Appendix 2 B). As a result, the control group differed significantly from the low- and medium-uplift groups (Uplift: Pseudo-F2,8 = 3.45, P < 0.05, Figure 5 B) and there was also significant variability in the structure of benthic communities among sites in the low- and medium-uplift groups (Pseudo-F8,99 = 6.08, P < 0.01, Figure 5 B). Finally, in the post-earthquake low zone, the composition of benthic communities was different in the low-uplift group (where large brown algae, particularly Carpophyllum maschalocarpum, were dominant) compared with the medium- and high-uplift groups (which were characterised by high covers of red algae: Uplift: Pseudo-F3,12 = 1.93, P < 0.01, Figure 5 C, Appendix 2 C). No other groups differed from the others and there was significant variability in the structure of benthic communities among sites within each uplift group (Pseudo-F12,144 = 10.08, P < 0.01, Figure 5 C). Waipapa Bay 1 was the only site almost completely devoid of algae in the low zone three years after the earthquake (Figure 5 C). 8 • Kaikōura earthquake – rocky reef impacts Fisheries New Zealand
Figure 4:    Mean abundance of the main algal groups (+SE) and of sessile invertebrates across uplift levels 6, 12, 16, 24, and 36 months after the earthquake. Only
             the high and the low zone were sampled at high-uplift sites.

Fisheries New Zealand                                                                                                            Kaikōura earthquake - rocky reef impacts• 9
Figure 5: Principal coordinates analysis (PCO) plots showing differences in the composition of benthic
communities in the post-earthquake high (A), mid (B), and low zones (C) across sites with
different degrees of uplift 36 months after the earthquake. The symbols represent the centroid
of each site and the colours the different levels of uplift (white = no uplift, green = low uplift,
yellow = medium uplift, red = high uplift). Sites are ordered north to south within each uplift
group. Only the high and the low zone were sampled at high-uplift sites.
10 • Kaikōura earthquake – rocky reef impacts Fisheries New Zealand3.2 Abundance of key intertidal taxa
Because there was very limited recovery of algae in the post-earthquake high and mid zones of uplifted
reefs three years after the earthquake, Sections 3.2.1, 3.2.2, and 3.2.4 describe the recovery of brown
and red algae in the post-earthquake low zone. Section 3.2.3 describes the relationship between large
brown algae and fleshy red algae. Section 3.2.5 focuses on temporal trends in the abundance of the main
intertidal grazers (limpets) across all tidal zones.
3.2.1 Large brown algae
In the post-earthquake low zone, Carpophyllum maschalocarpum was the most abundant species of
large brown algae three years after the earthquake (about 25% average cover across all sites), followed
by Cystophora scalaris, Durvillaea spp., and Marginariella boryana (which had average covers
between 3 and 5% across all sites). In November 2019, the abundance of large brown algae decreased
with increasing uplift across the four groups, which all differed from each other (Uplift: F3,12 = 48.53,
P < 0.001, Figure 6). The control group had the highest average cover of large brown algae (77%),
followed by the low-uplift group (59%), the medium-uplift group (36%), and the high-uplift group
(7%). These results are in line with those from previous sampling dates, showing a steady increase in
the abundance of large brown algae in the low- and medium-uplift groups, and a lack of recovery in the
high-uplift group. The extended time series also shows that the low-uplift group has maintained
abundances of large brown algae in line with pre-earthquake levels across two consecutive years, and
that the control sites are recovering after high mortality during the hot summer and heat wave of 2017–
2018 (Figure 6).
Figure 6: Time series of the mean percentage cover (±SE) of large brown algae per square metre in the
post-earthquake low zone across uplift levels. The dotted blue line indicates the average
abundance of large brown algae in the pre-earthquake low zone across sites sampled in
November 2016 (see Alestra et al. 2019). n = number of sites in each uplift group. *n = 5 after
12 months.
Fisheries New Zealand Kaikōura earthquake - rocky reef impacts• 11Three years after the earthquake, the different sites within each group had a similar cover of large brown
algae (Site: F12,144 = 0.94, P = 0.51, Figure 7). All low-uplift sites had a cover of large brown algae
greater than 48% (Figure 7 B), whereas all medium- and high-uplift sites were below this (Figure 7 C,
D). As in previous sampling events, Waipapa Bay 1 was the only site where large brown algae were
completely absent (Figure 7 D). Comparisons with pre-earthquake data show that the low-uplift sites
have returned or are close to covers in line with pre-earthquake abundances (Figure 7 B), whereas
medium- and high-uplift sites are still well below pre-earthquake levels (Figure 7 C, D).
Figure 7: Time series of the mean percentage cover (±SE) of large brown algae per square metre in the
post-earthquake low zone across sites with no (A), low (B), medium (C), and high uplift (D). For
the sites sampled in November 2016 (see Alestra et al. 2019), the average abundance of large
brown algae in the pre-earthquake low zone is displayed in the grey panels. At Omihi 1 and 2
(panel C) the low zone could not be sampled 12 and 16 months after the earthquake.
12 • Kaikōura earthquake – rocky reef impacts Fisheries New ZealandComparisons with pre-earthquake data also show that post-earthquake assemblages of large brown
algae are no longer dominated by bull kelp (Durvillaea spp.) but instead other species of fucoids
(primarily Carpophyllum maschalocarpum) represent the vast majority of large brown algal cover in
November 2019 (Figures 8 and 9).
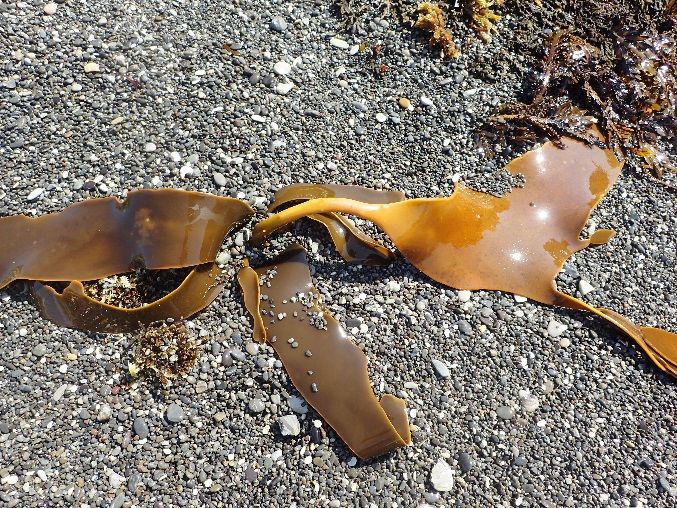
Figure 8: Large brown algae assemblages dominated by bull kelp (Durvillaea poha in the top picture) and
mixed fucoids (mainly Carpophyllum maschalocarpum in the bottom picture).
Fisheries New Zealand Kaikōura earthquake - rocky reef impacts• 13Figure 9: Changes in the relative abundance of bull kelp (Durvillaea spp.) and other species of fucoids
(mixed fucoids - primarily Carpophyllum maschalocarpum, Cystophora scalaris, Marginariella
boryana, and Lessonia variegata) in the pre- (November 2016) and post-earthquake low zone
(November 2019).
Shifts in the composition of large brown algae assemblages resulted from a post-earthquake decline in
the abundance of bull kelp combined with a simultaneous increase in the cover of mixed fucoids. Most
sites had declining abundances of bull kelp following the earthquake (Figure 10), with no sign of
recovery in the area of highest uplift, where bull kelp was completely extirpated (Figure 10 D). At the
same time, the cover of mixed fucoids increased at almost all sites (Figure 11), particularly where there
was no or low uplift (Figure 11 A and B). Three years after the earthquake, the abundance of mixed
fucoids decreased with increasing uplift across the four groups (Uplift: F3,12 = 23.4, P < 0.001) and was
highest in the control group (65%) and lowest in the high-uplift group (7%, Figure 11). Whereas for
bull kelp, there were no significant differences among uplift levels in November 2019 (Uplift: F3,10 =
0.86, P = 0.48), although it remained absent in the high-uplift group, and its cover ranged between 9
and 12% in the others (Figure 10).
14 • Kaikōura earthquake – rocky reef impacts Fisheries New ZealandFigure 10: Time series of the mean percentage cover (±SE) of bull kelp (Durvillaea spp.) per square metre
in the post-earthquake low zone across sites with no (A), low (B), medium (C), and high uplift
(D). For the sites sampled in November 2016 (see Alestra et al. 2019), the average abundance of
bull kelp in the pre-earthquake low zone is displayed in the grey panels. At Omihi 1 and 2 (panel
C) the low zone could not be sampled 12 and 16 months after the earthquake. Kaikōura North
1 and South 1, where bull kelp was not present both before and after the earthquake, are not
included in this figure.
Fisheries New Zealand Kaikōura earthquake - rocky reef impacts• 15Figure 11: Time series of the mean percentage cover (±SE) of mixed fucoids (primarily Carpophyllum
maschalocarpum, Cystophora scalaris, Marginariella boryana, and Lessonia variegata) per
square metre in the post-earthquake low zone across sites with no (A), low (B), medium (C),
and high uplift (D). For the sites sampled in November 2016 (see Alestra et al. 2019), the average
abundance of mixed fucoids in the pre-earthquake low zone is displayed in the grey panels. At
Omihi 1 and 2 (panel C) the low zone could not be sampled 12 and 16 months after the
earthquake.
16 • Kaikōura earthquake – rocky reef impacts Fisheries New Zealand3.2.2 Fleshy red algae
In November 2019, the medium- and high-uplift groups had the highest cover of fleshy red algae in the
post-earthquake low zone (47% and 50%, respectively) and the low-uplift group had the lowest (17%,
Figure 12), but the analysis could not detect significant differences among uplift groups (Uplift:
F3,12 = 1.93, P = 0.18) because these were outweighed by the large variability among sites within all
groups (F12,144 = 8.15, P < 0.001, Figure 13). These patterns are in line with those of previous years,
with high abundances of fleshy red algae in areas with uplift between 1.5 and 5.5 m, although their
cover did not increase as steadily between 2018 and 2019 at many medium- and high-uplift sites
(Figure 13).
Figure 12: Time series of the mean percentage cover (±SE) of fleshy red algae per square metre in the post-
earthquake low zone across uplift levels. The dotted blue line indicates the average abundance
of fleshy red algae in the pre-earthquake low zone across sites sampled in November 2016 (see
Alestra et al. 2019). n = number of sites in each uplift group. *n = 3 after 12 and 16 months.
Fisheries New Zealand Kaikōura earthquake - rocky reef impacts• 17Figure 13: Time series of the mean percentage cover (±SE) of fleshy red algae per square metre in the post-
earthquake low zone across sites with no (A), low (B), medium (C), and high uplift (D). For the
sites sampled in November 2016 (see Alestra et al. 2019), the average abundance of fleshy red
algae in the pre-earthquake low zone is displayed in the grey panels. At Omihi 1 and 2 (panel
C) the low zone could not be sampled 12 and 16 months after the earthquake.
3.2.3 Relationship between large brown algae and fleshy red algae
Regression analysis highlighted a negative relationship between the cover of large brown algae and that
of fleshy red algae (slope: -0.26, P < 0.001, Figure 14 A). This relationship accounted for 10% of the
variability in the abundance of large brown algae in November 2019. The whole model (accounting
also for site by site differences) explained 36% of the variability in the abundance of large brown algae.
Quantile regression analyses confirmed the presence of a strong negative relationship between the two
groups across five different quantiles (q10 slope -0.25, PFigure 14: Relationship between the abundance of large brown and fleshy red algae three years after the
earthquake estimated through mixed effects (A) and quantile regression models (B). Regression
lines are displayed for significant relationships. Symbol colours indicate different levels of uplift
(white = no uplift, green = low uplift, yellow = medium uplift, red = high uplift). Data from
Waipapa Bay 1, where both large brown and fleshy red algae were not present in November
2019, were not included in this analysis.
Fisheries New Zealand Kaikōura earthquake - rocky reef impacts• 193.2.4 Coralline red algae
In November 2019, control, low-, and medium-uplift groups had similar covers of coralline red algae
(between 43–51%), whereas the mean for the high-uplift group was 22% (Figure 15). However, the
analysis found no significant differences among uplift groups (F3,12 = 1.96, P = 0.17). The extended time
series shows a slight decline in the abundance of coralline algae between 24 and 36 months post-
earthquake, with all groups remaining below the pre-earthquake baseline (Figure 15). In November
2019, there was also significant variability among sites in all groups, but the two control sites did not
differ significantly from each other (F12,144 = 7.35, P < 0.001). Across all sites, the cover of corallines
remained stable or declined between 2018 and 2019. Waipapa Bay 1 was the only site where coralline
algae were completely absent (Figure 16).
Figure 15: Time series of the mean percentage cover (±SE) of coralline red algae per square metre in the
post-earthquake low zone across uplift levels. The dotted blue line indicates the average
abundance of coralline red algae in the pre-earthquake low zone across sites sampled in
November 2016 (see Alestra et al. 2019). n = number of sites in each uplift group. *n = 5 after
12 months.
20 • Kaikōura earthquake – rocky reef impacts Fisheries New ZealandFigure 16: Time series of the mean percentage cover (±SE) of coralline red algae per square metre in the
post-earthquake low zone across sites with no (A), low (B), medium (C), and high uplift (D). For
the sites sampled in November 2016 (see Alestra et al. 2019), the average abundance of coralline
red algae in the pre-earthquake low zone is displayed in the grey panels. At Omihi 1 and 2
(panel C) the low zone could not be sampled 12 and 16 months after the earthquake.
3.2.5 Limpets
In November 2019, the medium-uplift group had limpet densities over 50 per m2, whereas limpet
abundances in all other groups were between 12 and 24 individuals per m2 (Figure 17). However, the
analysis found no significant differences among uplift groups (F3,12 = 1.54, P = 0.25) and significant
differences among sites in all groups (F12,144 = 6.91, P < 0.001, Figure 18). High limpet densities in the
medium-uplift group were due to very high numbers at a single site (Okiwi Bay, Figure 18 C). The drop
in limpet numbers in the control group (Figure 17) did not reflect a widespread decline in the abundance
of all limpet species, but simply the absence of large clusters of Siphonaria spp. in November 2019 at
one of the Oaro sites (Figure 18 A).
Fisheries New Zealand Kaikōura earthquake - rocky reef impacts• 21Figure 17: Time series of the mean number (±SE) of limpets per square metre across uplift levels. The
dotted blue line indicates the average abundance of limpets across sites sampled in November
2016 (see Alestra et al. 2019). n = number of sites in each uplift group. *n = 5 after 12 months.
22 • Kaikoura earthquake – rocky reef impacts Fisheries New ZealandFigure 18: Time series of the mean number (±SE) of limpets per square metre across sites with no (A), low
(B), medium (C), and high uplift (D). For the sites sampled in November 2016 (see Alestra et al.
2019), the average abundance of limpets is displayed in the grey panels. At Omihi 1 and 2 (panel
C) the low zone could not be sampled 12 and 16 months after the earthquake.
Fisheries New Zealand Kaikōura earthquake - rocky reef impacts• 233.3 Subtidal community structure
General observations during the 2020 subtidal surveys showed minor recovery of seaweeds and
invertebrates at Waipapa Bay (Figure 19), and a decrease in the abundance of large brown algae around
the Kaikōura Peninsula and at Okiwi Bay (Figure 20). There were shifts in sand and gravel distribution
in some transects at Okiwi Bay South and Waipapa Bay (Figure 21), and an overall decline in algae at
one cobble-dominated site (Okiwi Bay South T1). Sites at Waipapa Bay still had large areas of bare
rock that had not been recolonised three and a half years after the earthquake.
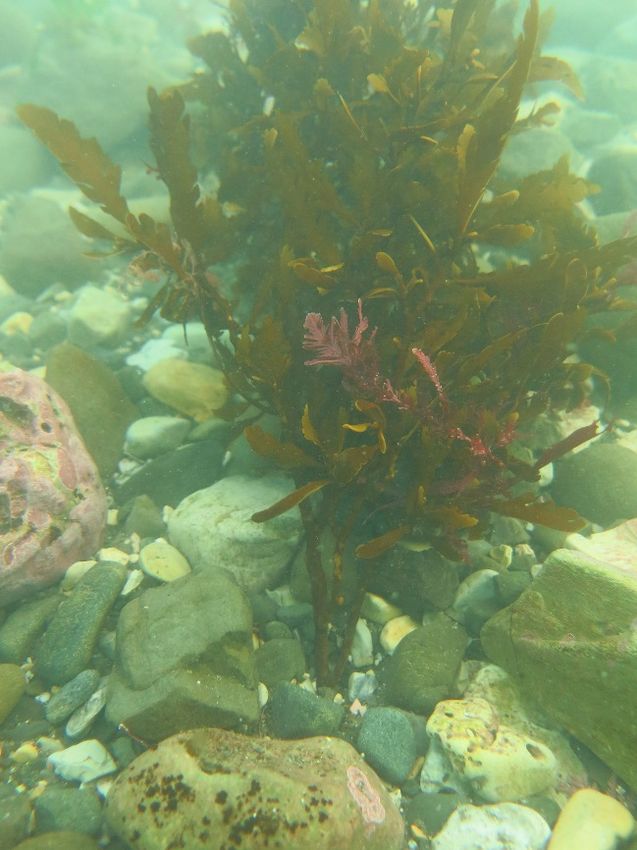
Figure 19: Examples of recruitment of encrusting coralline and encrusting red algae (top), brown
(Landsburgia quercifolia) and red algae (middle), and sessile and mobile invertebrates (bottom)
at Waipapa Bay. Photos taken in July 2020.
24 • Kaikoura earthquake – rocky reef impacts Fisheries New ZealandFigure 20: Subtidal landscape at Okiwi Bay North (Transect 1), showing an area dominated by large
brown algae in 2017 (top) and by red algae in 2020 (bottom).
Fisheries New Zealand Kaikōura earthquake - rocky reef impacts• 25Figure 21: Examples of gravel and cobble covering algae at Okiwi Bay South (top and right), and remnant
holdfasts of Marginariella boryana (bottom left). Photos taken in May 2019.
There were changes in substrate cover (using all data and not filtered to only include quadrats with at
least 50% rock – see page 7 of this report) at some Waipapa Bay and Okiwi Bay sites. The changes
mainly related to the movement of sand and gravel at the sites. Waipapa Bay North and South sites had
declines in sand cover in 2019 and increases in 2020. Gravel cover also fluctuated, particularly at the
south sites. The increase in bedrock at Waipapa Bay South sites is due to sand and gravel cover
decreasing and exposing bedrock, and due to the addition of a different transect in 2018 (Figure 22).
Okiwi South sites also had declines in sand cover since 2017 (from a mean of 13% to 1%) and increases
in cobble (from 14% to 36%). These results agree with observations during the surveys. Other changes
in abundances could be related to slight differences in the positioning of transects.
Percentage covers of some algal groups across sites changed between surveys. There was a decline in
large brown algal cover at Kaikōura Peninsula and Okiwi Bay sites through time, and an increase in red
non-encrusting algae at Okiwi Bay sites (Figure 23). Means of large brown algae declined from 54% to
33% and from 32% to 12% at Kaikōura and Okiwi Bay sites, respectively, whereas red non-encrusting
algae increased from 15% to 32% at Okiwi Bay sites. Although encrusting/turfing algae cover was
similar through time at Kaikōura and Okiwi Bay sites, increases were seen at Waipapa Bay sites (14%
to 38%), along with an increase in red non-encrusting algae (6% to 19%). Some recruitment of large
brown algae was seen around Waipapa Bay, but this was not noticeable in the plots due to the small
sizes of the recruits (Figure 19). Ephemeral green algae (Ulva sp.) had a greater percentage cover at
Okiwi Bay South in 2020 and at Waipapa Bay South in 2018 and 2020 (Figure 23).
There were no clear trends in mobile invertebrate abundances through time at Kaikōura and Okiwi Bay
sites, but Waipapa Bay sites showed increases in numbers (Figure 24). The high numbers of mobile
invertebrates at Waipapa Bay South in 2017 skewed results and were due to a large number of rock
lobsters along one transect, but overall numbers of other mobile invertebrates increased through time.
26 • Kaikoura earthquake – rocky reef impacts Fisheries New ZealandNumbers of Cook’s turban shells (Cookia sulcata) and both species of pāua (Haliotis iris, H. australis)
increased (Figure 25). Numbers of both pāua species also increased at Okiwi Bay sites (means of 0.06
to 0.26 and 0 to 0.09 for H. iris and H. australis respectively), and kina increased at the Kaikōura South
site (from a mean of 0.6 to 1.5).
Sessile invertebrate cover increased at Kaikōura North (1% to 2%), and this was driven by increases in
sponges and ascidians. There were small increases in sponges and ascidians at Waipapa North and
South, respectively (Figure 24).
100
80
Sand and silt
(% cover)
60
40
20
0
100
80
Gravel and shell
(% cover)
60
40
20
0
100
80
(% cover)
60
Cobble
40
20
0
100
80
(% cover)
Boulder
60
40
20
0
100
80
(% cover)
Bedrock
60
40
20
0
2017 2019 2020 2017 2018 2019 2020 2017 2018 2019 2020
Kaikoura Okiwi Waipapa
L M H
Figure 22: Mean percentage cover of substrate types per 5-m2 quadrat at the six sites surveyed between
2017 and 2020. For each pair of bars, the left bar refers to the northern site and the right bar
to the southern site, with locations of the sites labelled below the x-axis. L=Low, M=Medium,
H=High. N = 20. Data are averaged over 3 transects with the exception of 2018 surveys at
Waipapa South, where data are averaged over 4 transects; error bars represent 1 s.e.
Fisheries New Zealand Kaikōura earthquake - rocky reef impacts• 27100
Encrusting/turfing algae
(% cover) 80
60
40
20
0
100
Large brown algae
80
(% cover)
60
40
20
0
100
Red foliose/filamentous/
80
branching algae
(% cover)
60
40
20
0
25
20
Green algae
(% cover)
15
10
5
0
250
200
(% cover)
All algae
150
100
50
0
2017 2019 2020 2017 2018 2019 2020 2017 2018 2019 2020
Kaikoura Okiwi Waipapa
L M H
Figure 23: Mean percentage cover of algae per 5-m2 quadrat at the six sites surveyed between 2017 and
2020. For each pair of bars, the left bar refers to the northern site and the right bar to the
southern site. Data were filtered to only include quadrats with at least 50% rock substrate
(cobble, boulder, or bedrock) (n=variable and noted in Appendix 1). Data are averaged over 3
transects with the exception of 2018 surveys at Waipapa South, where data are averaged over
4 transects; error bars represent 1 s.e. Note different scales for ‘green’ and ‘all algae’ plots.
28 • Kaikoura earthquake – rocky reef impacts Fisheries New ZealandAll mobile invertebrates 6
4
(Number)
2
0
5
All sessile invertebrates
4
(% cover)
3
2
1
0
4
3
(% cover)
Sponges
2
1
0
1.6
1.2
Ascidians
(% cover)
0.8
0.4
0
0.8
0.6
Tripterygiidae
(triplefins)
(Number)
0.4
0.2
0
2017 2019 2020 2017 2018 2019 2020 2017 2018 2019 2020
Kaikoura Okiwi Waipapa
L M H
Figure 24: Mean percentage cover of sessile invertebrates, sponges, and ascidians, and numbers of mobile
invertebrates and triplefins per 5-m2 quadrat at the six sites surveyed between 2017 and 2020.
For each pair of bars, the left bar refers to the northern site and the right bar to the southern
site. Data were filtered to only include quadrats with at least 50% rock substrate (cobble,
boulder or bedrock) (n=variable and noted in Appendix 1). Data are averaged over 3 transects
with the exception of 2018 surveys at Waipapa South, where data are averaged over 4 transects;
error bars represent 1 s.e. Note change in scales.
Fisheries New Zealand Kaikōura earthquake - rocky reef impacts• 290.4
(yellow foot paua)
Haliotis australis
(Number) 0.3
0.2
0.1
0
1
(black foot paua)
0.8
Haliotis iris
(Number)
0.6
0.4
0.2
0
1
(Cook's turban)
Cookia sulcata
0.8
(Number)
0.6
0.4
0.2
0
0.6
Lunella smaragda
(cat's eye snails)
(Number)
0.4
0.2
0
6
Jasus edwardsii
(Number)
(crayfish)
4
2
0
3
Evechinus chloroticus
(Number)
2
(kina)
1
0
0.25
0.2
Sea stars
(Number)
0.15
0.1
0.05
0
2017 2019 2020 2017 2018 2019 2020 2017 2018 2019 2020
Kaikoura Okiwi Waipapa
L M H
Figure 25: Mean number of selected mobile invertebrates per 5-m2 quadrat at the six sites surveyed
between 2017 and 2020. For each pair of bars, the left bar refers to the northern site and the
right bar to the southern site. Data were filtered to only include quadrats with at least 50%
rock substrate (cobble, boulder, or bedrock) (n=variable and noted in Appendix 1). Data are
averaged over 3 transects with the exception of 2018 surveys at Waipapa South, where data are
averaged over 4 transects; error bars represent 1 s.e. Note change in scales.
30 • Kaikoura earthquake – rocky reef impacts Fisheries New ZealandPermanova analysis for the subtidal community data showed that Site was significant and Transect was highly significant (P < 0.001) (Table 1). This indicates there was spatial variability at small (between transects) and large (between sites) scales. The Survey x Transect (Site(Uplift)) interaction term was also highly significant, indicating that one or more transects changed differently from each other between surveys. Principle coordinate analysis of distance between centroids for the Site combinations showed the degree of change in communities between surveys (Figure 26). Okiwi Bay North and South, and Waipapa Bay South communities changed the most between surveys. Communities at Okiwi Bay sites (particularly south sites) had a directional change towards the right of the plot (Figure 26). The communites on the right side had less brown algae and more red algae than the communities on the left side of the plot. Communities at Waipapa Bay showed directional change from the top to the bottom of the plot and this was primarily driven by increases in several different taxa (i.e., recruitment and recovery of algal and invertebrate populations). SIMPER analysis showed that the differences between surveys at Okiwi North were primarily driven by a reduction in some large brown algae (Marginariella boryana and Lessonia variegata) and an increase in several red algal taxa. Differences in surveys at Okiwi Bay South were primarily driven by a reduction in encrusting and turfing corallines, red encrusting algae, some large brown algae (M. boryana, Landsburgia quercifolia, and Lessonia variegata), and some red foliose algal taxa. The increase in the green alga Ulva sp. also contributed to the dissimilarity between communities in 2020 and previous years. Waipapa Bay South sites were dissimilar between surveys primarily due to an increase in encrusting coralline and encrusting red algae, Ulva sp., and some brown algae (L. quercifolia and Halopteris spp.), and a decrease in the brown alga Carpophyllum maschalocarpum. The large difference in the Waipapa Bay South 2017 communities and subsequent surveys was due to a high number of crayfish recorded in one transect in 2017. Communities at Waipapa North were dissimilar through time due to increases in encrusting corallines, red encrusting algae, some red foliose algal taxa, and an encrusting orange sponge. Table 1: PERMANOVA results for epibiota community data. P values: * < 0.05, ** < 0.01, *** < 0.001. Source df SS MS Pseudo-F P(perm) Uplift 2 1.29E+05 6 4401 4.3998 0.0763 Survey 3 28 373 9 457.8 2.2602 0.0600 Site(Uplift) 3 47 077 15 692 3.12 0.0270* Uplift × Survey 5 34 408 6 881.5 1.6259 0.1407 Transect (Site(Uplift)) 13 68 220 5 247.7 12.894 0.0001*** Survey × Site(Uplift) 8 34 276 4 284.5 1.3252 0.1584 Survey×Transect(Site(Uplift)) 32 1.06E+05 3 326.2 8.1729 0.0001*** Res 1 146 4.66E+05 406.98 Fisheries New Zealand Kaikōura earthquake - rocky reef impacts• 31
Figure 26: Principal coordinates analysis (PCO) of distance among centroids for the six sites surveyed
           between 2017 and 2020, based on a Bray-Curtis similarity matrix of community assemblage
           data. Vector overlay shows taxa with > 0.6 correlation.

As in previous surveys, few mobile reef fish (excluding triplefins) were seen in 2019 and 2020 (Figure
27). The exception was at Kaikōura South, which had means of 41 and 18 fish along the transects in
2019 and 2020, respectively. The other sites had averages of fewer than 10 fish (Figure 27). Banded
wrasse (Pseudolabrus fucicola) and spotties (Notolabrus celidotus) were the most abundant fish
species. Other fish observed (in order of decreasing abundance) were blue moki (Latridopsis ciliaris),
butterfish (Odax pullus), blue cod (Parapercis colias), marblefish (Aplodactylus arctidens), and red
moki (Cheilodactylus spectabilis).

32 • Kaikoura earthquake – rocky reef impacts                                       Fisheries New Zealand
50
40
30
Number
20
10
0
2017 2019 2020 2017 2018 2019 2020 2017 2018 2019 2020
Kaikoura Okiwi Bay Waipapa Bay
Figure 27: Average abundances of fish at each site during each survey. In each pair of bars, the left bar
refers to the northern site and the right bar to the southern site. N = 3 transects, with the
exception of second surveys at Waipapa Bay South, where n = 4. Error bars represent 1 s.e.
Transects were 50 m in length, and the area surveyed was 1 m either side of the transect, and
2 m above the transect.
Most black foot and yellow foot pāua (Haliotis iris and Haliotis australis) were recorded in about 0.5–
3.5 m (Figure 28). Numbers of both species appeared to increase at Okiwi Bay sites from 2017 to 2020.
An apparent increase in black foot pāua at Waipapa Bay after 2017 was largely driven by the addition
of a transect at Waipapa Bay South which had several pāua, but a small increase in numbers was
recorded at Waipapa North (see Figure 25). Several yellow foot pāua were observed in 2020 at Waipapa
Bay after being virtually absent between 2017- 2019. Numbers were too low to examine size structure
of populations in any detail, but pāua at Waipapa were generally over the legal size limit.
Fisheries New Zealand Kaikōura earthquake - rocky reef impacts• 33Figure 28: Box-whisker plots showing Haliotis iris (black foot pāua, top) and Haliotis australis (yellow foot
pāua, bottom) depth distributions at each site through time. Sample counts are at the top of
each plot.
34 • Kaikoura earthquake – rocky reef impacts Fisheries New ZealandFigure 29: Box-whisker plot showing Haliotis iris (black foot pāua) size distribution at each site through
time. Sample counts are at the top of the plot. Haliotis australis (yellow foot pāua) sizes are not
shown due to their absence or low numbers. The red dashed line represents the legal harvesting
size of 125 mm.
Fisheries New Zealand Kaikōura earthquake - rocky reef impacts• 354. DISCUSSION
This research extends the previous work done as part of the Kaikōura Earthquake Marine Recovery
Package (Alestra et al. 2019) and provides an updated assessment of the state of rocky reef systems that
underwent impacts from coastal uplift. Overall, the results of the most recent surveys show that
intertidal benthic communities are recovering only in low intertidal zone areas where abundant algal
stands have managed to survive or re-establish. However, these low-zone algal communities have
undergone significant post-earthquake shifts in species composition and are now dominated by different
suites of species compared with the pre-earthquake conditions. Long-lasting impacts on intertidal reefs
were still evident three years after the earthquake and varied across uplift levels. Subtidally, there was
only minor recovery of seaweeds in de-vegetated areas and previously abundant algal stands appear to
have become more sparse and fragmented.
4.1 Intertidal rocky reefs
The latest surveys showed that the biogenic structure of uplifted reefs is still significantly altered by the
impact of the earthquake. Under all degrees of uplift, large portions of intertidal reefs were almost
entirely devoid of algal cover, with most algae surviving only in the low intertidal. These results confirm
that much of the mid-tidal zones, which supported lush and diverse algal communities before the
earthquake (Schiel 2004, Schiel 2006), is now unsuitable for colonisation of large algae.
Hot temperatures and high erosion rates are the most likely causes underlying the lack of algal recovery
over vast areas of uplifted reefs (Schiel at al. 2018, 2019, Alestra et al. 2019). Temperature data
collected from mid-zone areas of uplifted reefs show that, in the absence of algal cover, summer
temperatures in proximity to the substratum often exceed 35 °C, with peaks well over 40 °C (Figure 29).
Despite the reefs still being submerged at high tide, such extreme low-tide temperatures are lethal to
most marine organisms, making any sign of recovery short-lived. For example, sparse recruitment of
the habitat-forming fucoid Hormosira banksii still occurs in the mid zone at some sites during the cooler
months (Figure 29), but the newly settled algae quickly burn off during summer.
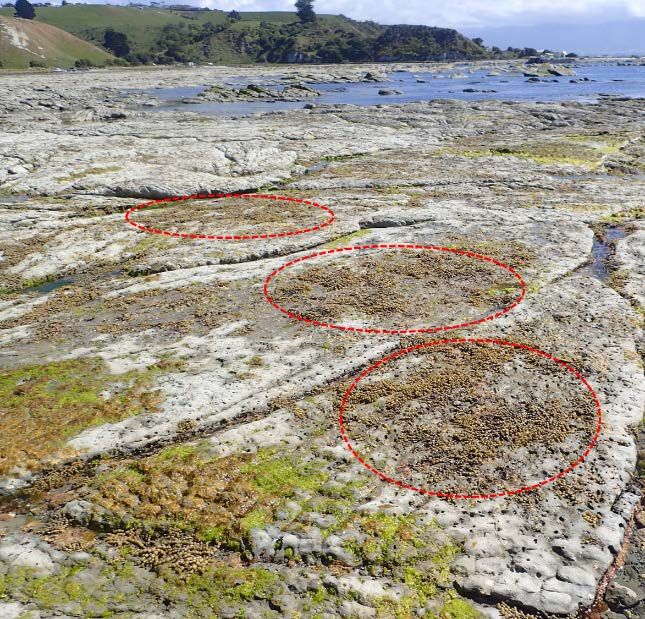
Figure 29: Summer temperatures in mid-intertidal areas often exceed 35 °C (left) and result in the burn-
off of virtually all algae. On the right: patches of Hormosira banksii (within the red circles),
photographed in spring 2018 did not survive the following summer. Temperature data and
photo are from the Kaikōura North 1 site.
36 • Kaikoura earthquake – rocky reef impacts Fisheries New ZealandYou can also read