Australia's Future Health Workforce - Anaesthesia - Department of Health - April 2016
←
→
Page content transcription
If your browser does not render page correctly, please read the page content below
Department of Health

Australia’s Future
Health Workforce –
Anaesthesia

April 2016
Contents
Executive Summary .......................................................................................................... 4
Key considerations ............................................................................................................ 4
Key findings ...................................................................................................................... 5
   Supply and demand projections ................................................................................................ 5
   Training program ...................................................................................................................... 5
   Capacity and distribution for vocational training...................................................................... 6
Overview ........................................................................................................................... 7
   Background ............................................................................................................................... 8
Determining the Future Capacity for Training Needs ...................................................... 9
Introduction ..................................................................................................................... 10
Current workforce status ................................................................................................. 10
   Current trainee status .............................................................................................................. 20
   Trainee demographics ............................................................................................................. 21
   Prevocational intentions .......................................................................................................... 26
   Summary of total workforce by remoteness classification ..................................................... 27
General Practitioners providing anaesthesia services ..................................................... 29
   Background ............................................................................................................................. 29
   Current workforce ................................................................................................................... 29
Workforce projections .................................................................................................... 33
   Supply ..................................................................................................................................... 33
   Demand ................................................................................................................................... 33
Projections....................................................................................................................... 34
   Training pipeline ..................................................................................................................... 36
Capacity and Distribution for Training ........................................................................... 42
   Capacity Analysis ................................................................................................................... 43
   Results of consultation ............................................................................................................ 43
Appendices ...................................................................................................................... 46
   Appendix 1: Summary of modelling inputs ............................................................................ 46
   Appendix 2: Definition of a Specialist .................................................................................... 49
   Appendix 3: Trainees and Intentions ...................................................................................... 53
   Appendix 4: Capacity Analysis Tool (CATool) ..................................................................... 55

                                                                                                                              Page 1 of 61
Appendix 5: Medical Practitioners survey 2014 ..................................................................... 56

Tables
Table 1. Definitions of the Modified Monash Model Categories ........................................................ 15
Table 2. Specialist anaesthetist clinicians (headcount and sector: proportion of specialist clinical FTE in
     public and private) by state and territory ................................................................................... 20
Table 3. Trainees (Headcount) by training level, age group................................................................. 21
Table 4. Trainees (headcount) by age (group), gender and training year (current year of training
     program) .................................................................................................................................... 22
Table 5. Trainee FTE (total hours) by training year and sector ............................................................ 25
Table 6. Summary of anaesthetist’s workforce (Headcount and FTE) by MM ..................................... 28
Table 7. MBS items billed in 2013 & 2014 ........................................................................................... 30
Table 8. Headcount GP anaesthetist by state and number of services provided ................................. 31
Table 9. Summary of the top ten items claimed by GP anaesthetist ................................................... 31
Table 10. headcount and services of GP anaesthetist by Modified Monash Model............................. 32
Table 11. MBS items claimed by MM1 ................................................................................................ 32
Table 12. Anaesthetists: Total Clinical Hours Scenario ........................................................................ 35
Table 13. Anaesthetists: Total Specialist Hours Scenario .................................................................... 35
Table 14. Anaesthetists: College Scenario Reduction to Migration ..................................................... 36
Table 15. Training pipeline transitions/churn ..................................................................................... 36
Table 16. Trainee pipeline analysis, 2008 – 2030................................................................................. 39
Table 17. Alternate trainee pipeline analysis, 2008 – 2030 ................................................................. 40
Table 18. Data variables and sources of the CATool ............................................................................ 55

Figures
Figure 1. Anaesthetist workforce by job role, 2014 ............................................................................. 11
Figure 2. Comparison of anaesthetists that are registered, employed, working in anaesthesia,
     clinicians (headcount) by age group ........................................................................................... 12
Figure 3. Gender distribution of anaesthetist workforce, 2014 .......................................................... 12
Figure 4. Employed anaesthetists by gender, 2008 to 2014 ................................................................ 13
Figure 5. Demographics of the anaesthetist workforce, 2014 ............................................................. 13
Figure 6. Anaesthetist workforce (clinicians) by Modified Monash Model, 2014 ................................ 14
Figure 7. Hours worked as captured in the workforce survey. ............................................................ 16
Figure 8. Estimating total specialty hours ........................................................................................... 16
Figure 9. Total specialty hours used in modelling - example ............................................................... 17
Figure 10. Average hours by total, clinical, specialist clinical and specialist total hours worked, 2014 17
Figure 11. Total hours worked by anaesthetists, 2010-2014 ............................................................... 18
                                                                                                                                 Page 2 of 61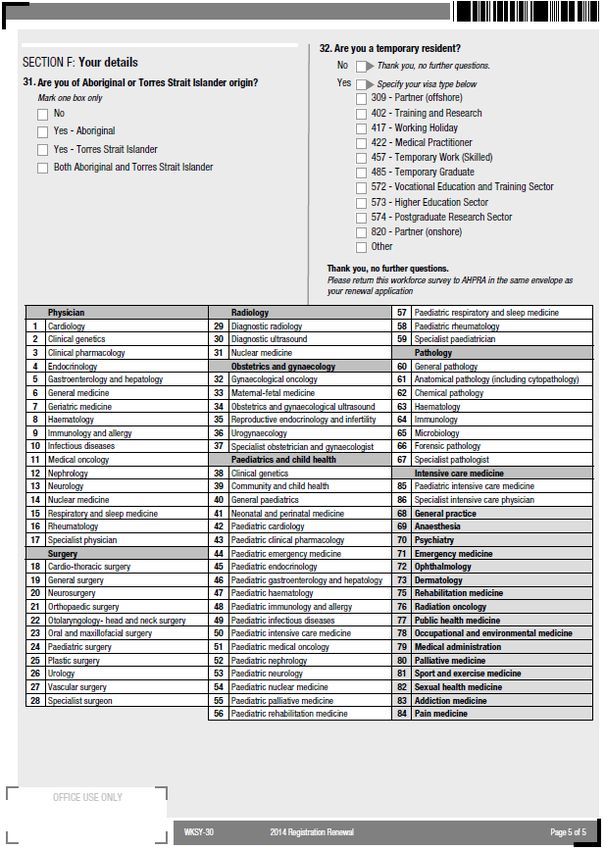
Figure 12. Average total specialist hours and clinical specialist hours by sex and age group, 2014 ..... 18
Figure 13. Average total specialist hours by states and territories ...................................................... 19
Figure 14. Average specialist clinical hours worked by Modified Monash Model)............................... 19
Figure 15. Distribution of anaesthesia trainees by level and location ................................................. 23
Figure 16. Demographics of the anaesthetist trainees in 2014 ............................................................ 24
Figure 17. Trainees by state and territory and MMM.......................................................................... 24
Figure 18. Proportion of trainee FTE by geographic distribution (MM) and sector .............................. 26
Figure 19. Characteristics of HNS who intend to undertake anaesthetist training............................... 26
Figure 20. HNS who intend to undertake specialist anaesthetist training by vocation ........................ 27
Figure 21. Proportion of trainees by geographic distribution (MM) and sector ................................... 27
Figure 22. General Practitioner anaesthetist ....................................................................................... 30
Figure 23. Number of basic and advanced trainees, 2010-2014 .......................................................... 41
Figure 24. New Fellows pipeline projections ....................................................................................... 41
Figure 25. Alternative new Fellows pipeline projections ..................................................................... 42
Figure 26. Survey questions relating to Employment Status ............................................................... 49
Figure 27 Survey questions relating to Clinician Status ....................................................................... 50
Figure 28. Survey questions relating to clinical and non clinical hours ................................................ 50
Figure 29. Survey questions relating to principal field of main specialties .......................................... 51
Figure 30. Survey questions relating to training in Anaesthesia .......................................................... 52
Figure 31. Erroneous answer recorded in question 23 ........................................................................ 52
Figure 32. Survey question related to current specialist training ....................................................... 53
Figure 33. Survey question relating to current year of training program ............................................. 53
Figure 34. Survey questions relating to intending to train in Anaesthesia ........................................... 54

                                                                                                                     Page 3 of 61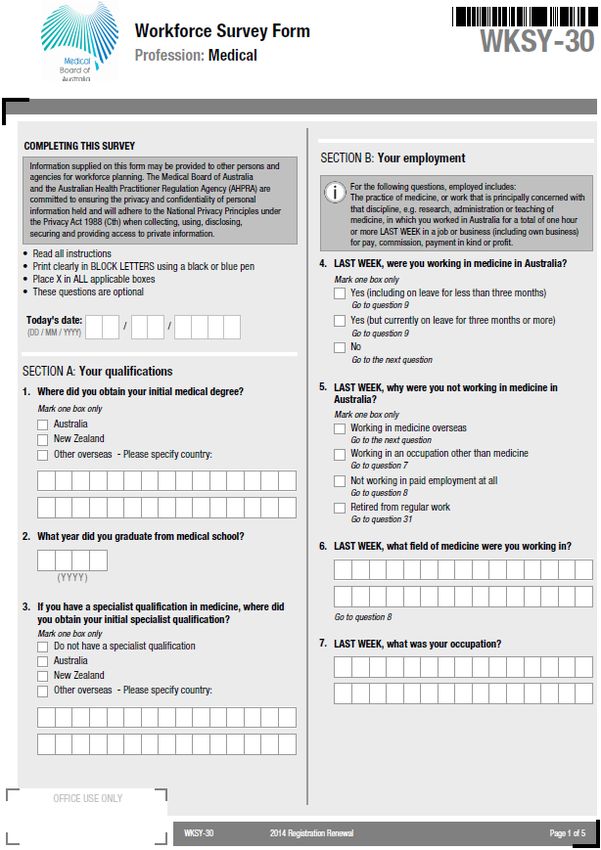
Executive Summary
The Australia’s Future Health Workforce – Doctors (AFHW - Doctors) report
published in December 2014 indicated that Australia’s health workforce is under
pressure and must undergo significant transformation to meet future demands for
healthcare.
Despite the projected overall position of oversupply, imbalances within the medical
specialty workforces currently exist and are projected to continue.
The development of the AFHW – Doctors report was guided by the expert input of the
National Medical Training Advisory Network (NMTAN) that has representation from
all the key stakeholder groups in medical education, training and employment.
The report makes recommendations for future work including:
•   updates to the workforce modelling results to determine requirements for future
    adjustments every two years; and
•   prioritisation of future policy work to gain a better understanding of the
    prevocational years and overall capacity for and distribution of vocational medical
    training.
The NMTAN currently has three subcommittees that explore different aspects of
medical training to inform workforce planning:
•   changing work with the increase in burden of chronic disease;
•   employment patterns and intentions of prevocational doctors and development of
    fact sheets on supply and demand in each of the medical specialties; and
•   the capacity for and distribution of medical training, including the geographic
    distribution of medical training and community needs.
The anaesthesia report is part of the first segment of analysis under the capacity and
distribution work. This report involves updating the supply and demand projections
previously completed by the former Health Workforce Australia (HWA) and published
in Health Workforce 2025 - Medical Specialists Volume 3 (HW 2025 Vol 3).

Key considerations
It is important to note the following regarding demand and supply modelling for all
specialties:
•   Supply only includes the hours worked by specialists in the specific speciality being
    modelled
    -   For anaesthesia this means only the hours worked by specialist anaesthetists in
        anaesthesia contribute toward the supply FTE. In particular there are 360
        specialist anaesthetists who work in anaesthesia AND another speciality – 44
        percent of their FTE was spent working in anaesthesia while 56 percent of their
        FTE was spent working in their other specialty. Only the hours worked in
        anaesthesia contribute toward the supply FTE for anaesthesia.
•   Demand only includes the services provided by specialists in the specialist area

                                                                             Page 4 of 61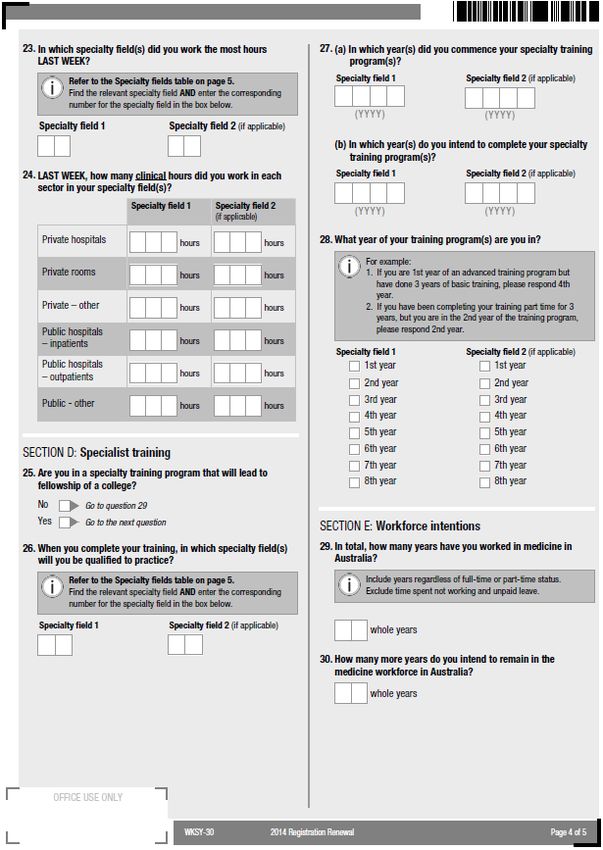
-   For anaesthesia this means only anaesthetic services performed by specialist
        anaesthetists are used in the calculation of demand.
•   Projections for the ‘Clinical hours scenario’ (Table 12) will be produced for every
    specialty. This scenario is NOT recommended by the Australian Government
    Department of Health (DoH).
    -   This scenario is presented for comparison purposes only as it uses the same
        methodology as previous modelling.

Key findings
Supply and demand projections
Results of the projections reveal a workforce that is in balance, with the potential to
shift into oversupply if trainee numbers are increased or if there is not a decrease in
International Medical Graduates (IMGS).
Should a scenario of increased demand for anaesthetists arise, the workforce is in a
position to implement various tactics to meet the community needs:
•    The decrease in hours over the years, and in particular the decrease in hours in the
    45 to 50 year age group, suggests the current workforce may be underutilised. An
    additional reserve of 52.5 FTE could be mobilised if specialist anaesthetists aged 45
    to 50 years worked one extra session per week.
•   There are currently 360 registered and employed specialist anaesthetists who work
    hours in anaesthesia and another specialty. This group spend 56 percent of their
    FTE in a specialty other than anaesthesia. This equates to a supply of
    approximately 200 FTE that has the potential to be redirected to the anaesthetic
    workforce should the need arise.
Training program
The number of prevocational medical practitioners who have indicated their intentions
to train in anaesthesia (421) is quite large relative to the current annual intake into the
training program (just over 200). The Australian and New Zealand College of
Anaesthetists (ANZCA) envisage that “trainee intake numbers could go up due to
pressure to find vocational training jobs for the large number of medical graduates
currently coming through the system”.
The purpose of the AFHW series, however, is to provide evidence to assist in informing
the broader training strategies for all medical colleges. In particular, the results of this
report indicate that intake into the anaesthesia training program should not be driven by
pressure or demand from medical graduates, rather intake should be attenuated with the
aim of achieving a delicate balance between business fiscal interests, medical students
vocational aspirations and evolving community requirements.
Whilst IMGS are not in the training program, they do complete relevant components of
training. The bottleneck of partially comparable IMGS who have not been able to
obtain fellowship under the current regulations reveal a potential opportunity to fine-
tune the assessment of IMGS. In particular, there may need to be an additional or more
meticulous assessment of the candidate’s capability to complete the required
examinations and obtain fellowship before deeming a candidate as partially
comparable.

                                                                               Page 5 of 61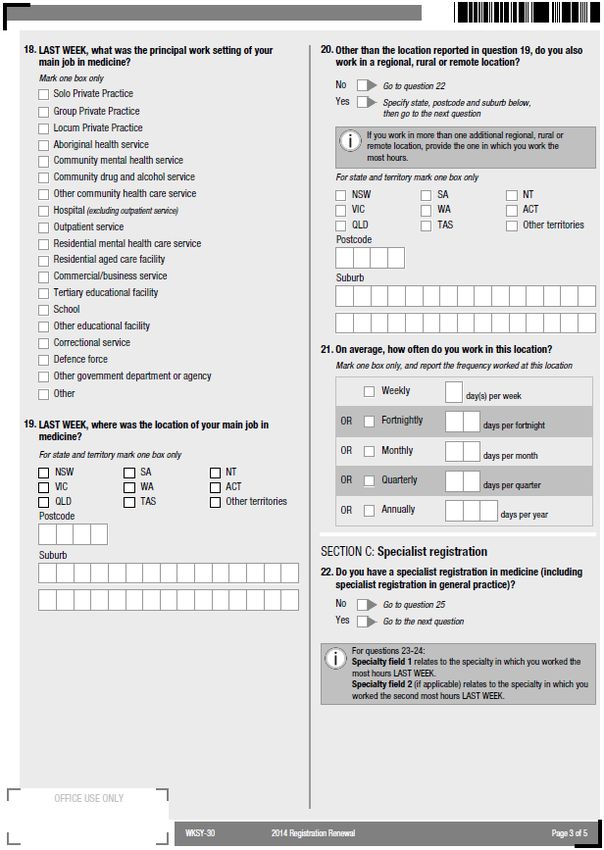
Capacity and distribution for vocational training
Training bottlenecks were previously problematic, especially in particular rotations
such as neurology, paediatrics, cardiac and complex obstetrics. The current training
pipeline suggests that this has eased as a result of the ANZCA curriculum change.
The distribution of training shows that trainees are generally located in the capital cities
or regional centres. ANZCA has expressed concern that decentralisation of training
solely to regional centres would pose a challenge to the completion of specialty training
due to the lack of casemix, volume and complexity of cases in these area
Recommendations:
•   The supply and demand projection be closely monitored by NMTAN and updated
    every two years.
•   The College and the NMTAN continue to monitor the training numbers and
    transition rates
•   The NMTAN monitor the numbers of partially comparable IMGS obtaining
    fellowship and the assessment process to ensure that those can’t complete the
    pathway to fellowship are deemed not comparable.

                                                                               Page 6 of 61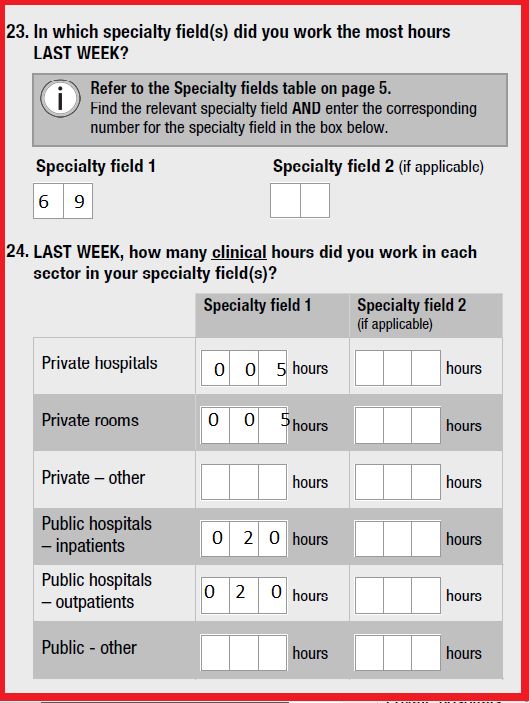
Overview
The Australia’s Future Health Workforce – Doctors (AFHW – Doctors) report
published in December 2014 indicated that Australia’s health workforce is under
pressure and must undergo significant transformation to meet future demands for
healthcare.
Despite the projected overall position of oversupply, imbalances within the medical
specialty workforces currently exist and are projected to continue.
The medical workforce is a national resource; a resource that is valuable to the
community both in terms of the cost of training, which is substantially borne by the
taxpayer, and in terms of the benefit derived by the community from a well-trained
health workforce.
In the past, uncoordinated decision making in the absence of an active workforce
planning mechanism has seen a “boom and bust” cycle in medical training and resulting
doctor numbers. This has been a cost to the community.
The AFHW - Doctors report shows there are three key factors that underpin the
importance of national workforce planning for doctors. First, there is an immediate need
to deal with the significant increase in domestic medical students that has occurred over
the last ten years. This presents an opportunity to influence further training for medical
students, to encourage doctors to move into the locations and specialties that will be
needed in the future.
Second, due to the age demographic of the medical workforce, a number of doctors will
retire from 2025. The length of time it takes to train a doctor means that short term
changes in training levels are not an effective response to short term imbalances
between supply and demand. This re-enforces the need to plan over a medium term
time horizon and to minimise short term movements in medical intakes, which could be
better dealt with using temporary migration.
Third, the report states there is a lack of coordination across the medical training
pipeline. Between governments, universities, medical colleges and the various
employers of doctors, there are hundreds of individuals making decisions on how many
doctors and what type of doctors are trained in Australia. Ensuring these individual
decisions are aligned to what Australia needs from doctors in the future is essential.
The development of the AFHW – Doctors report was guided by the expert input of the
National Medical Training Advisory Network (NMTAN) that has representation from
all the key stakeholder groups in medical education, training and employment.
The report makes recommendations for future work including:
•   updates to the workforce modelling results to determine requirements for future
    adjustments every two years; and
•   prioritisation of future policy work to gain a better understanding of the
    prevocational years and overall capacity for and distribution of vocational medical
    training.

                                                                              Page 7 of 61
Background
The establishment of the NMTAN was approved on 10 August 2012 by the then
Standing Council on Health (SCOH) as a mechanism to enable a nationally coordinated
medical training system in Australia. The NMTAN was established under the auspices
of the former Health Workforce Australia (HWA) and held its first meeting in February
2014. Since August 2014, support to the NMTAN has been provided by the Australian
Government Department of Health (DoH).
The NMTAN provides guidance in the development of a series of medical training
reports to inform government, health and education sectors. In addition, the NMTAN
provides policy advice about the planning and coordination of medical training in
Australia, in collaboration with other networks involved in the medical training space.
The NMTAN currently has three subcommittees that explore different aspects of
medical training to inform future workforce planning:
•   the ‘changing work with the increase in burden of chronic disease’ subcommittee
    examines the implications of the increasing incidence of chronic disease and
    increased delivery of chronic disease management in the primary care setting.
    Modelling of the medical workforce will be undertaken based on a number of
    models of care. It is expected this work will be completed in 2016;
•   the ‘employment patterns and intentions of prevocational doctors’ subcommittee
    aims to improve the modelling undertaken for the prevocational years in medicine
    and use this improved modelling to better inform career planning for junior doctors.
    The subcommittee has developed an internal report that provides a snapshot of the
    existing prevocational doctor workforce in Australia. This information will be used
    to develop a series of fact sheets on each of the medical specialties, to be made
    available on the Australian Government Department of Health (DoH) website. It is
    expected the factsheets will become available from June 2016; and
•   the ‘capacity for and distribution of medical training’ subcommittee makes
    recommendations to the NMTAN Executive Committee on changes to policy and
    practices that could improve geographic distribution of medical training to produce
    the number and proportion of medical specialists needed to provide specialist
    healthcare to Australians. Members have identified a priority list of specialties to be
    modelled, with the focus initially on a small number of specialties seen to be at risk
    of workforce shortage or oversupply, and where there is capacity to address these
    issues with training.
In addition to the policy-focussed subcommittee, a fourth subcommittee – the data
subcommittee – is responsible to support the production of an annual report of medical
education and training, including undergraduate, postgraduate and vocational training
projects. The functions of this subcommittee were transferred from the Medical
Training Review Panel to the NMTAN in 2015.
This anaesthesia report is part of the first segment of analysis under the capacity and
distribution subcommittee work. It involves updating the supply and demand
projections previously completed by the former HWA and published in HW 2025 –
Medical Specialists Volume 3.
This work has been guided by the input of the NMTAN and has been completed in two
stages:

                                                                               Page 8 of 61
•   Stage 1: review and analysis of supply and demand through the modelling of the
    anaesthesia workforce with projections to 2030 and analysis of current training
    capacity and identification of pipeline issues. This resulted in the development of an
    interim report for targeted consultation with NMTAN and relevant
    stakeholders/experts.
•   Stage 2: consolidation of the feedback on the interim report to identify issues to
    develop training target ranges (including capacity in aggregation and by location)
    and policy recommendations for anaesthesia.

Determining the Future Capacity for Training Needs
Australia’s medical training system is delivered through a complex interconnection of
funding and organisation channels that span Commonwealth and state and territory
governments, as well as private and non-government agencies. The cross-sectional
nature of delivering and funding medical training in Australia makes workforce
planning difficult for any particular agency or sector to deliver in isolation. There is
also a risk there will be an ongoing mismatch between the medical workforce that is
trained and that is required to deliver necessary services.
The pathway to independent practice as a vocationally recognised specialist is long and
there are multiple layers of investment in the training from university entrance to the
completion of specialist vocational training. At the same time, there are numerous
players involved in the training pathway, from universities to public and private
hospitals and private medical practices.
The recent growth in the medical workforce is important in the calculated supply and
demand for health services over the time period covered by the workforce modelling.
This increase in the number of medical students and graduates demonstrates a large
increase in the inflows into the medical workforce over a short space of time. This has
implications for clinical training capacity, initially at the university level but extending
into the prevocational and vocational training years. This pressure has already been
seen in the availability of intern training places, which to date has largely kept pace
with the increasing number of graduates.
This pressure is now beginning to move into the next stages of the training pipeline.
There has been an increase of over 30 percent in vocational training positions with
15,478 in 2011 moving to 20,069 by 2015 with unclear links to future workforce
requirements. Previous workforce modelling demonstrates an emerging mismatch
between the number of trainees seeking a vocational training place and the availability
of places based on community need. This mismatch emerges from around 2017 in the
most recent modelling presented in the AFHW – Doctors report and extends to
approximately 1,000 places by 2030.

                                                                               Page 9 of 61
Introduction
Anaesthetists are a specialist medical workforce that practice across a range of clinical
environments from isolated rural environments to large metropolitan teaching hospitals
in both public and private practice. Anaesthetists apply their knowledge and skills to
caring for patients in a variety of clinical contexts, providing anaesthesia and sedation
for surgery and other procedures, providing pain management and perioperative care,
working in resuscitation, trauma and retrieval teams and working with specialists in
intensive care medicine. There are subspecialised areas of practice based around patient
groups such as paediatric anaesthesia and obstetric anaesthesia or surgical sub-
specialties such as anaesthesia for cardiac or neurosurgery.
Anaesthesia was selected as a medical specialty to be considered in the first segment of
analysis by the NMTAN largely due to concerns identified in HW 2025 Volume 3. The
anaesthesia chapter indicated that the workforce was perceived to have no current
shortage while the comparison scenario projected the workforce would be in oversupply
by 130 anaesthetists by 2025. Stakeholder views agreed that:
• There were sufficient anaesthesia trainees to meet service demands.
• The distribution of the anaesthesia workforce was the primary concern; particularly
recruiting specialists to regional areas, with these regional areas often reliant on
non-specialist anaesthesia providers (GP anaesthetists) or Specialist International
Medical Graduates (SIMGS).
• The revised training curriculum, which commenced in 2013, may increase the
duration of training time (although not expected to significantly increase the time)
and may extend the time it takes pre-vocational doctors to enter the training
program, by limiting the first part examination to those on ‘accredited’ training
places.
The last point above reflected stakeholder views at the time that HW 2025 Volume 3
was released. ANZCA has indicated that they do not believe the timing of the primary
exam extends the time it takes prevocational doctors to enter the training program.
Currently candidates enter introductory training then sit the primary exam. This should
not slow down the time it takes prevocational doctors to enter the program.
A summary of the approved modelling inputs can be found in Appendix 1.
Current workforce status
In 2014, there were 4,482 accredited specialist anaesthetists with current registration in
Australia of which 4,135 (92 percent) were employed in the medical workforce. While
the majority (4,101) worked in anaesthesia, 34 did not work in anaesthesia: of these 28
were clinicians, with 24 indicating they were working in specialty fields other than
anaesthesia (the remaining 4 did not answer the question to indicate which specialty
fields, if any, they were working in). The other specialty fields were: intensive
care/paediatric intensive care, pain medicine, palliative medicine, general medicine and
infectious diseases.
Those who did work in anaesthesia were mostly clinicians (90 percent) with the
remainder working as administrators, teachers/educators and researchers (Figure 1).
Page 10 of 61Nine percent (360) of clinical anaesthetists also worked in a specialty other than
anaesthesia. The most common second specialties were: intensive care medicine (195),
pain medicine (128) and general practice (19).
The Medical Board publishes quarterly statistics on Medical Practitioner Registrant
Data 1. In the September 2014 edition there were 4,545 registrants with a specialty of
anaesthesia; 63 more than reported in Figure 1 using the National Health Workforce
Data Set (NHWDS). This is because the NHWDS is a snapshot at a point in time (as at
the date of data extraction) and the figures reported here include only medical
practitioners with a current registration. The Medical Board/AHPRA statistics report an
annual figure and include medical practitioners who held a registration at some point in
the year but may not have a current registration.
In the NHWDS there were 60 anaesthetists who did not have current medical
registration; a difference of only 3 between the NHWDS and the Medical Board
statistics.
Figure 1. Anaesthetist workforce by job role, 2014
Source: NHWDS, Medical Practitioner 2014
Aged and Gender
The age distribution of anaesthetists in Australia (Figure 2) show the majority are in the
35-59 year age groups for registered, employed, clinicians and those working in the
anaesthesia field. The proportion of the registered, employed, clinicians and those
working in the anaesthesia field were similar within each of these age groups. The
largest single age group for anaesthetists is 40-44 years with the numbers in the
workforce reducing significantly beyond 59 years of age.
1
http://www.medicalboard.gov.au/News/Statistics.aspx
Page 11 of 61Figure 2. Comparison of anaesthetists that are registered, employed, working in
anaesthesia, clinicians (headcount) by age group
Source: NHWDS, Medical Practitioner 2014
The gender distribution of anaesthetists (Figure 3) shows that the majority, about two
thirds, are male across all groups of anaesthetists: registered, employed, clinicians and
those working in the field.
Figure 3. Gender distribution of anaesthetist workforce, 2014
Source: NHWDS, Medical Practitioner 2014
Growth
Figure 4 shows that the number of employed anaesthetists has grown over the years
(average annual growth of 4.4 percent), with female anaesthetists experiencing the
largest growth over the last five years – at an average annual rate of 5.8 percent, while
males have only grown at 3.9 percent (average annual growth). However, the
proportion of females has remained fairly constant – on average 26 percent between
2008 and 2014.
Page 12 of 61Figure 4. Employed anaesthetists by gender, 2008 to 2014
Data for 2010 has been omitted as it excludes Queensland and Western Australia due to their registration closing after the national
registration deadline of 30 September 2010.
Sources: AIHW medical workforce surveys 2008 and 2009; NHWDS: medical practitioners 2011 to 2014
According to the 2014 NHWDS, there were 4,021 anaesthetists who indicated they
were employed and working as clinicians (anaesthetist workforce) with the following
characteristics:
Figure 5. Demographics of the anaesthetist workforce, 2014
Source: NHWDS, Medical Practitioner 2014
Page 13 of 61Distribution
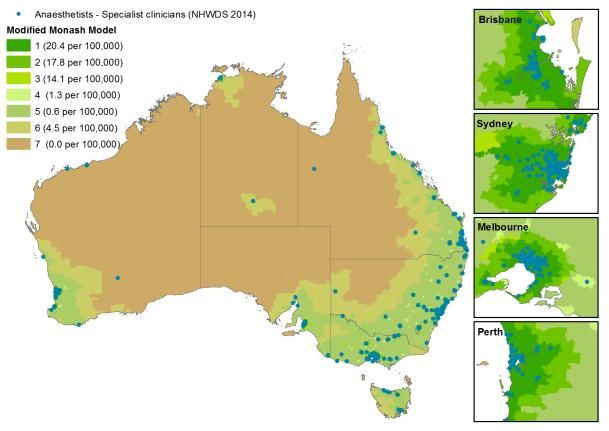
Figure 6 illustrates the Modified Monash Model and density of the anaesthetist
workforce within these areas. The Modified Monash (MM) Model is a new
classification system that better categorises metropolitan, regional, rural and remote
areas according to both geographical remoteness and town size.
The system was developed to recognise the challenges in attracting health professionals
to more remote and smaller communities. MM 1 indicates major cities and progresses
to MM 7, which indicates very remote Australia;
Table 1 below defines each of these MM categories. As can be seen in the map, the
anaesthetist workforce is located throughout Australia, but mainly concentrated in
major cities.
However, it is important to note that due to the collaborative nature of the anaesthetic
field, the distribution or maldistribution of anaesthetists is inextricably tied to the
distribution of other medical specialists.
Figure 6. Anaesthetist workforce (clinicians) by Modified Monash Model, 2014
Source: NHWDS, Medical Practitioner 2014
The old classification system was based on the Australian Standard Geographical
Classification – Remoteness Area (ASGC-RA) system. The Australian Bureau of
Statistics (ABS) has now replaced to ASGC with the Australian Statistical Geography
Standard (ASGS). The ASGS uses the latest residential population data to determine the
five base categories. The MM Model will overlay the ASGS for the purposes of
administering some health workforce programmes.
Page 14 of 61Table 1. Definitions of the Modified Monash Model Categories
Modified
Monash Definition
Category
1 All areas categorised ASGS-RA1.
Areas categorised ASGS-RA 2 and ASGS-RA 3 that are in, or within 20km road distance, of a town
2
with population >50,000.
Areas categorised ASGS-RA 2 and ASGS-RA 3 that are not in MM 2 and are in, or within 15km
3
road distance, of a town with population between 15,000 and 50,000.
Areas categorised ASGS-RA 2 and ASGS-RA 3 that are not in MM 2 or MM 3, and are in, or
4
within 10km road distance, of a town with population between 5,000 and 15,000.
5 All other areas in ASGS-RA 2 and 3.
All areas categorised ASGS-RA 4 that are not on a populated island that is separated from the
6
mainland in the ABS geography and is more than 5km offshore.
All other areas – that being ASGS-RA 5 and areas on a populated island that is separated from the
7
mainland in the ABS geography and is more than 5km offshore.
Source: www.doctorconnect.gov.au
Hours worked
The Medical Practitioner workforce survey (Appendix 5) captures the hours worked at
three levels as shown in Figure 7 below. The first row (A) is where a practitioner
identifies the total hours they worked in the previous week. They are asked to split their
total hours into (B) time spent in clinical roles and non-clinical roles. Non-clinical is
defined as “including teacher, researcher, administrator and other”. They are then asked
to split their clinical hours into (C) time spent in up to two specialities (clinical hours in
specialty 1 and clinical hours in specialty 2).
For example, 9 percent (360) of Anaesthetists worked hours in a specialty other than
anaesthesia (most commonly intensive care medicine and pain medicine). For this
group of dual specialists, 44 percent of their FTE was spent in anaesthesia, while 56
percent was spent in their other specialty.
They grey ‘unknown’ area in row (C) can occur when the hours reported in specialty 1
and specialty 2 do not add up to the clinical hours (B). The unknown clinical hours may
be due to an error when completing the survey form (the medical practitioner
miscalculates their hours) or it may represent time worked as a non-vocationally
registered GP (VRGP) or in a third specialty. The unknown hours were not used in the
modelling inputs. Furthermore, as can been seen in the grey ‘not asked in survey’ area
in row (C), the non-clinical hours worked in each specialty are not captured in the
survey.
Figure 7 shows how the use of clinical hours (highlighted in row B) is flawed for the
purposes of modelling individual medical specialties. The clinical hours (highlighted in
row B) can be much higher than the individual specialist clinical hours (C) as clinical
hours comprises unknown clinical hours and/or hours worked in another speciality
(other than the one being modelled). When clinical hours are used for modelling, the
FTE is overestimated by including hours worked in a specialty other than the one being
modelled as well as unknown/unattributed clinical hours. It also underestimates supply
Page 15 of 61by excluding the time spent in clinical support (non-clinical hours) for a specialty. The
results of projections using clinical hours are presented in the ‘clinical hours scenario’
Table 12. This scenario is NOT recommended by DoH and is presented to enable
comparisons with previous modelling.
Figure 7. Hours worked as captured in the workforce survey.
Figure 8 below shows how the hours for individual specialties have been estimated for
modelling purposes in this report. In order to calculate (D), the total hours worked in
the anaesthesia speciality (clinical and non-clinical), the proportion of the clinical hours
for each of the specialities were used to attribute non-clinical hours to the specialties to
give an indication of the total specialist hours (clinical and non-clinical) a practitioner is
working in a given speciality.
Figure 8. Estimating total specialty hours
Figure 9 below shows which hours contribute to supply in the projections utilising total
specialist hours (‘Total specialist hours scenario Table 13, and ‘College scenario
reduction to migration’ Table 14).
In this example, if a practitioner indicated in specialty field 1 they worked in
anaesthesia and in specialty field 2 they worked in intensive care medicine, then the
Page 16 of 61clinical specialty 1 hours plus the non-clinical estimated specialty 1 hours (highlighted
in black) are used in the modelling for anaesthesia.
Figure 9. Total specialty hours used in modelling - example
Figure 10 below shows the difference between the hours worked by the anaesthetist
workforce, by gender. There is a clear difference between males and females. This
difference is almost the equivalent of a standard day’s work (on average 7 hours), with
females working fewer hours on average. As expected, for both males and females, the
total hours are greater than the clinical hours and these are again greater than the
specialist clinical hours.
Figure 10. Average hours by total, clinical, specialist clinical and specialist total hours
worked, 2014
Source: NHWDS, Medical Practitioner 2014
It is not possible to calculate the total specialist hours by specialty prior to 2013 due to
the differences in the file structure of the NHWDS, however Figure 11 shows that the
total hours worked (and the trend) by anaesthetists declined between 2010 and 2014.
Page 17 of 61Figure 11. Total hours worked by anaesthetists, 2010-2014
*In order to produce a meaningful series the above data is a reflection of the AIHW derived primary specialty
which vary slightly from more recent estimates (using the classifications detailed in Appendix 2).
Figure 12 below shows the difference between the total specialist hours (D) and clinical
specialist hours (C) by gender and age group. A larger gap can be seen between total
specialist hours and clinical specialist hours in the younger age groups for both males
and females, with the gap closing for older anaesthetists. This indicates that younger
anaesthetists are spending more time (roughly 4 hours per week) performing non-
clinical work.
Figure 12. Average total specialist hours and clinical specialist hours by sex and age
group, 2014
The average total specialist hours worked by states and territories is shown below
(Figure 13). Clinical anaesthetists in NSW, NT and ACT tend to work less than the
Page 18 of 61national average (39.8 hours), while those in VIC, WA, and TAS tend to work more
than the national average.
Figure 13. Average total specialist hours by states and territories
Source: NHWDS, Medical Practitioner 2014
Figure 14 shows there are very small variations in the total specialist hours worked
between areas, with the exception of remote areas (MM5 and MM6) tending to be
lower although these areas also have fewer anaesthetists.
Figure 14. Average specialist clinical hours worked by Modified Monash Model)
Source: NHWDS, Medical Practitioner 2014
Table 2 indicates the anaesthetist clinical workload between public and private sectors
and state. The data shows nationwide the majority of anaesthetists work in the public
sector (51 percent) with 49 percent working in the private sector. This is consistent
across locations, with a high of 66 percent of anaesthetists working in public settings in
Page 19 of 61the NT, to a low of 46 percent in QLD. The majority of anaesthetists are located in the
highly populated states of NSW, VIC and QLD and proportionally less in lower
populous territories such as NT and ACT.
Table 2. Specialist anaesthetist clinicians (headcount and sector: proportion of specialist
clinical FTE in public and private) by state and territory
Specialist clinical FTE
Headcount
% Public % Private
NSW 1,238 51% 49%
VIC 960 52% 48%
QLD 847 46% 54%
SA 325 53% 47%
WA 448 51% 50%
TAS 102 54% 47%
NT 31 66% 34%
ACT 70 52% 48%
Total 4,021 51% 49%
Source: NHWDS, Medical Practitioner 2014
Current trainee status
Fellowship program
In 2013 the Australian and New Zealand College of Anaesthetists (ANZCA) revised
their curriculum. This was designed in line with recommendations from a curriculum
review, which began in 2008. The ANZCA training program is divided into four
periods: introductory, basic, advanced and provisional fellowship training:
• Introductory training (IT) – trainees may complete this study unit in a minimum of
26 weeks. This unit introduces the ANZCA Roles in Practice focusing on the
development of basic knowledge and skills across the ANZCA Clinical
Fundamentals and safe, patient-centred practice. Trainees will develop the ability to
manage low-risk cases included in the specialised study units.
• Basic training (BT) – trainees may complete this study unit in a minimum of 78
weeks. This unit further develops the ANZCA Roles in Practice and trainees will
also continue to expand and apply their knowledge of anatomy, basic sciences, and
equipment, necessary to support safe practice across the ANZCA Clinical
Fundamentals. They will extend their clinical assessment knowledge and skills to
assess the severity of common medical conditions that require anaesthesia and
ensure optimisation of patients by appropriate consultation and supervision. They
will be able to participate as a multidisciplinary team member in pain, trauma and
resuscitation teams and will demonstrate sufficient knowledge, skills and
behaviours to manage cases of moderate complexity with level 4 supervision. They
will continue to accrue experience with cases included in the specialised study units.
Page 20 of 61• Advanced training (AT) – trainees may complete this study unit in a minimum of
104 weeks. By the completion of advanced training, trainees will demonstrate
competency across all the ANZCA Roles in Practice, the ANZCA Clinical
Fundamentals and specialised study units. They will be able to assume a leadership
role in multidisciplinary teams where appropriate, and demonstrate a commitment
to the safe and ethical care of patients and others in the dynamic and complex
environments in which they work.
• Provisional fellowship training (PFT) – trainees may complete provisional
fellowship training in a minimum of 52 weeks and a consultant level of practice is
expected by the end of this training period. While provisional Fellows will continue
to develop across all ANZCA Roles in Practice, there will be choice available as to
the development of special expertise in an ANZCA role or roles or in sub-
specialised areas of practice. Provisional Fellows include clinical work as a
minimum of 20 percent of their training time unless otherwise approved by the
director of professional affairs (assessor), and participate in the College's
Continuing Professional Development Program. They will be actively involved in
the teaching and assessment of junior colleagues 2.
Trainee demographics
The NHWDS data is used herein to define trainees – those that have identified as
specialist-in-training (SIT) (Appendix 3). The following tables make comparisons with
the data supplied from ANZCA and that from the NHWDS, as expected there is some
variability between these two data sets. Data supplied by ANZCA provides the total
number of trainees by training level by state and territory for 2014. Table 3 includes all
trainees from introductory training (IT) to provisional fellowship training (PFT); in
2014 there were a total of 1069 trainees.
Table 3. Trainees (Headcount) by training level, age group
Age Year 0.5 (IT) Year 0.5- 2 (BT) Year 3-4 (AT) Year 5 (PFT) Total
25-29 102 95 51 3 251
30-34 61 128 285 88 562
35-39 21 34 90 31 176
40-44 5 14 29 5 53
45-49 1 5 7 3 16
50-54 0 2 6 0 8
55+ 0 0 0 0 0
Total 192 279 468 130 1,069
Source: ANZCA, 2014
2
Anaesthesia Training Program Curriculum, December 2014, ANZCA
Page 21 of 61Table 4 details the trainees by age group, gender and self-reported training year
according to the NHWDS. The main trend that can be seen is that trainees are
predominantly in the 30-34 age group (51.5 percent of total), and that there is a near
even amount of female trainees (44 percent of total).
Table 4. Trainees (headcount) by age (group), gender and training year (current year of
training program)
Unknown/
Age 1st 2nd 3rd 4th 5th 6th 7th 8th Total
NA
Male
20-25 1 0 0 0 0 0 0 0 0 1
25-29 49 33 15 4 0 0 0 0 1 102
30-34 44 50 66 72 42 5 0 1 5 285
35-39 19 16 23 26 34 6 1 3 4 132
40-44 7 7 6 15 11 3 1 3 2 55
45-49 2 4 4 3 4 0 1 0 0 18
50-54 1 0 1 1 1 0 0 4 0 8
60-64 0 0 0 0 0 0 0 0 1 1
Total 123 110 115 121 92 14 3 11 13 602
Female
20-25 3 0 0 0 0 0 0 0 0 3
25-29 52 32 17 2 2 0 0 0 0 105
30-34 35 48 65 71 58 3 3 1 5 289
35-39 3 10 16 13 22 4 2 2 2 74
40-44 0 2 4 2 4 2 0 1 0 15
45-49 0 1 1 3 1 0 0 1 0 7
50-54 0 0 0 0 0 2 0 1 0 3
60-64 0 0 0 0 0 0 0 0 0 0
Total 93 93 103 91 87 11 5 6 7 496
Grand Total 216 203 218 212 179 25 8 17 20 1,098
Unknown/not stated are included in these totals.
Source: NHWDS, Medical Practitioner 2014
The following diagram (Figure 15) gives a visual overview of the location of
anaesthesia trainees, by their training level at a point in time.
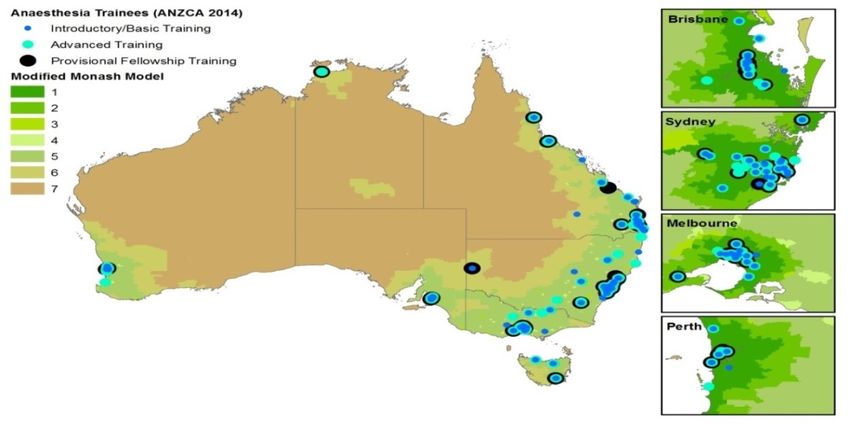
Page 22 of 61Figure 15. Distribution of anaesthesia trainees by level and location
Source: ANZCA, 2014
For the purposes of modelling, DoH has used a combination of data from the ANZCA
and the NHWDS: Medical Practitioner 2014 survey, noting that there are variances
between these data sources. This is largely due to the self-reported nature of the medical
workforce survey data. In comparison to the ANZCA data, the 2014 medical workforce
survey data reported a slightly higher (2.8 percent) number of anaesthesia trainees.
There are a number of factors for this, including that not every practitioner fills out the
survey and each data set has a different collection time point/ cut-off, which will affect
the number of trainees entering and exiting the training program in a given year.
The number of trainees by training level is also collected through the Medical Training
Review Panel (MTRP) data collection each year from medical colleges and reported on
in the MTRP Report. There are differences in the numbers in this report and the MTRP
as the latter captures the number of trainees as at 30 June each year.
According to the 2014 NHWDS, there were 1,098 anaesthesia trainees in Australia,
with the following characteristics:
Page 23 of 61Figure 16. Demographics of the anaesthetist trainees in 2014
Source: NHWDS, Medical Practitioner 2014
Figure 17 outlines the distribution of trainees and shows that the large majority of
trainees (87 percent) are located in major cities (MM1). The MM2 category was the
second largest; accounting for 9 percent of trainees, with this group being the largest for
TAS and NT. The state with the largest number of trainees within the MM2 category is
QLD; whereas NSW had the second largest group in the MM3 category. This shows the
majority of trainee positions are still located in major cities.
Figure 17. Trainees by state and territory and MMM
Source: NHWDS, Medical Practitioner 2014
Page 24 of 61Table 5 details the trainees (FTE) by location, current year of training and sector.
Nationwide public sector based traineeships are still the dominant sector at 94 percent,
with ACT, TAS and NT having only public sector based traineeships.
Table 5. Trainee FTE (total hours) by training year and sector
State Sector 1st 2nd 3rd 4th 5th 6th 7th 8th * Total
Public 94.2 91.8 78.4 74.6 68 12.6 2.4 6.1 5.7 433.5
NSW Private 1.5 0 3 0 0 0 0 0 0 4.5
Both 0 5.9 3 2.9 2.9 0 0 0 0 14.6
Public 52.3 49.2 51.1 49.2 48.4 5.3 3.4 2 8.2 268.9
VIC Private 1 0 1 0 0 0 1.1 0 0 3
Both 1.8 4.1 4.2 1.3 1.8 0 0 0 1.5 14.5
Public 48.8 44.1 55.5 64.3 42 6 1 2.8 2.7 267.1
QLD Private 1 0.6 1 1 3.6 0 0 0 0 7.1
Both 2.9 1.1 4.2 5 0 1.2 0 0 0 14.3
Public 20.8 17.8 17.6 14.3 15.5 0 1.2 3.2 0 90.2
SA Private 0 0 0 0 1.4 0 0 0 0 1.4
Both 0 3.1 0 0 0 0 0 0 0 3.1
Public 18.1 19.2 23.6 21.6 11.4 4.3 0 5.3 3.1 106.5
WA Private 0 0 0 1.1 1.9 0 1 0 0 4
Both 0 0 2.8 1.6 2.5 0 0 0 0 6.9
Public 12.2 4.8 4.4 5.8 3.1 0 0 0 0 30.3
TAS Private 0 0 1 0 0 0 0 0 0 1
Both 0 0 0 0 0 1.2 0 0 0 1.2
Public 1 1.8 4.2 0 4.5 0 0 0 0.8 12.1
NT
Both 0 0 0 1.4 0 0 0 0 0 1.4
ACT Public 6.4 2.3 10.4 2.5 6.1 0 0 0 0 27.5
Public 253.6 230.8 245.1 232.3 198.7 28.2 8 19.2 20.3 1236.1
Private 3.5 0.6 5.9 2.1 6.8 0 2 0 0 20.9
Both 4.6 14.2 14.2 12.2 7.1 2.3 0 0 1.5 56
Australia %
19.30% 17.60% 18.70% 17.70% 15.10% 2.10% 0.60% 1.50% 1.50% 94.10%
Public
%
0.30% 0.00% 0.40% 0.20% 0.50% 0.00% 0.20% 0.00% 0.00% 1.60%
Private
%
0.40% 1.10% 1.10% 0.90% 0.50% 0.20% 0.00% 0.00% 0.10% 4.30%
Both
Source: NHWDS, Medical Practitioner 2014
The proportion of trainees by MMM (Figure 18) also adds to the view that public sector
based traineeships is dominant, including in all MM categories, with private sector
traineeships mostly being available in major cities or inner regional areas.
It should be noted that if training was devolved to rural areas ANZCA has indicated that
trainees will have trouble with case mix and volume of practice of sufficient complexity
to complete specialty training.
Page 25 of 61Figure 18. Proportion of trainee FTE by geographic distribution (MM) and sector
Source: NHWDS, Medical Practitioner 2014
Prevocational intentions
In 2013, a new question was included in the Medical Practitioner workforce survey
which identifies those who intend to undertake vocational training. The information
collected from this questions forms part of the future planning process of having an
indicative number of the future intentions of trainees (Appendix 3).
Figure 19 details the characteristics of the 421 hospital non-specialists (HNS) who
intend to undertake anaesthesia training, according to the 2014 NHWDS:
Figure 19. Characteristics of HNS who intend to undertake anaesthetist training
Source: NHWDS, Medical Practitioner 2014
Page 26 of 61The primary group of HNS who wish to undertake anaesthesia training are Resident
Medical Officers, followed by Hospital Medical Officers and Registrars (Figure 20).
Figure 20. HNS who intend to undertake specialist anaesthetist training by vocation
Source: NHWDS, Medical Practitioner 2014
Similar to the location of trainees in Figure 15 and Figure 17, it appears that the
intention of trainees and HNS are to train primarily in major cities. States such as QLD,
NT and TAS with large MM2 numbers and NSW with large MM3 numbers also have
proportionally the same amount of trainees who want to train in these locations as seen
in Figure 21. This may show that trainees who may wish to train in very remote or
regional locations are limited by the opportunities available with most new trainees and
existing trainees being concentrated in specific public hospitals located in existing
areas.
Figure 21. Proportion of trainees by geographic distribution (MM) and sector
Source: NHWDS, Medical Practitioner 2014
Summary of total workforce by remoteness classification
Table 6 is a broad summary of the population and remoteness characteristics of the
anaesthetist workforce. As can be seen the number of anaesthetists and trainees are
highest in areas with the most population. The number of anaesthetists and trainees per
100,000 population is 26.1 in MM1 areas, 22.2 in MM2 areas and 17.0 in MM3 areas.
Page 27 of 61The level in MM6 areas is only 4.5, for MM4 there is only 1.3 and only 0.5
anaesthetists and trainees per 100,000 population in MM5 categories.
Table 6. Summary of anaesthetist’s workforce (Headcount and FTE) by MM
Modified Specialists Headcount Specialists FTE per
State & 2014
Monash and trainees per 100,000 and trainees 100,000
Territories population
Category (headcount) population (FTE) population
1 16,611,193 4,342 26.1 4,435 26.7
2 2,167,671 482 22.2 502 23.2
3 1,531,627 261 17.0 269 17.6
4 869,540 11 1.3 11 1.2
AUST
5 1,776,229 9 0.5 6 0.4
6 313,323 14 4.5 13 4.2
7 221,153 0 0.0 0 0.0
Grand Total 23,490,736 5,119 21.8 5,235.89 22.3
Note – Trainee FTE is based on clinical hours and specialist FTE is based on total specialist hours.
Page 28 of 61General Practitioners providing anaesthesia services
Background
It is important that General Practitioners (GP) are able to offer anaesthesia services in
rural areas where there is no ongoing specialist cover available. It means that a general
practitioner is able to offer this service to their community to avoid patients having to
travel to larger regional centres to access surgery.
GP anaesthesia training is administered by the Joint Consultative Committee on
Anaesthesia (JCCA). This is a tripartite committee with representatives from the
Australian and New Zealand College of Anaesthetists (ANZCA), the Royal Australian
College of General Practitioners (RACGP- Rural) and the Australian College of Rural
and Remote Medicine (ACRRM). It sets the standards, monitors and examines GP
registrars from the rural training stream of the RACGP and ACRRM who are
completing a 12 month skills post in anaesthesia using the Curriculum Statement in
Anaesthesia for advanced rural skills and advanced specialised training as the basis of
the training. This training includes –
• A twelve month training period in a JCCA-accredited post
• A satisfactory report from the director of the training department. Registrars must
produce this satisfactory report of training from their supervisor before they are
permitted to sit for the examination.
• Success in the JCCA examination.
Upon successful completion of training, these GPs are considered suitable to offer
services to patients in the ASA1-3 rating categories, with some in the ASA3 category
after appropriate assessment.
The total of GP anaesthetists’ included in this section under-represents the number of
GP anaesthetists currently practising. Since the JCCA commenced its training in 1992
approximately 600 GPs have been trained to offer this service. The range of procedures
covered are more than those listed above as GPs can comfortably assist with other
essential services that are not captured by MBS item numbers such as emergency
medicine, airway management, retrieval preparation and pain management.
Furthermore, the number of anaesthetics provided in rural and remote areas by GP
anaesthetists may be higher than the number recognised by this method. The
discrepancy could, in part, be due to the different funding model used for the provision
of services in many areas, including salaried medical positions in many rural and
remote areas of Western Australia and Queensland. The fee for service model is
underrepresented in public hospitals, which are the predominant mode of delivering
healthcare in rural and remote areas.
The NHWDS combines the AHPRA registration data with workforce survey data. A
more complete picture of GP anaesthetists could be achieved if the JCCA qualification
were included on the AHPRA registration system and made available for the NHWDS.
Current MBS services
The Medicare Benefits Schedule (MBS) data is able to provide a partial picture of the
GP anaesthetist workforce. This only includes GPs who have a Medicare provider
Page 29 of 61You can also read