Westpac New Zealand Sharing the Load Report
←
→
Page content transcription
If your browser does not render page correctly, please read the page content below
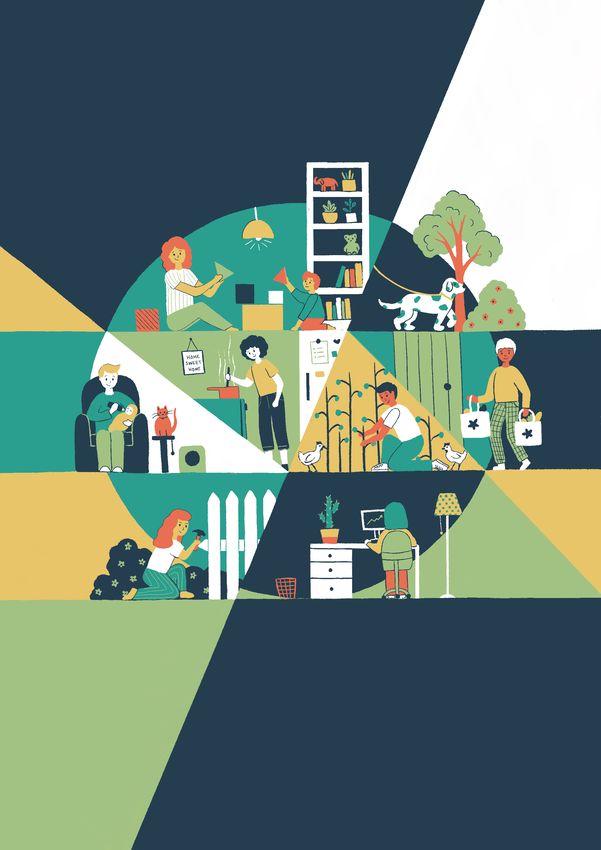
Westpac New Zealand
Sharing the Load Report
                   May 2021
Contents
Executive summary				3

Sharing the load at home			             6

How do we share the
load at home?					8

The economic benefit of
sharing the load at home			             18

Call to action					21

Appendix A: Historical context		        23

Appendix B: Survey information		        26

Appendix C: Modelling the economic
benefit of sharing the load at home		   30

                                            2
Westpac New Zealand: Sharing the load report |
                                              Executive Summary

Executive Summary
Sharing the load at home more equally would improve
wellbeing and deliver a $1.5 billion economic benefit.

The spread of COVID-19 in New Zealand in early 2020                       When we asked respondents what this division would look like
pushed the country into the unchartered territory of                      in an ideal world, women said they wanted to do more paid work
a nationwide Level 4 lockdown. With many New Zealanders                   and less unpaid work, while men wanted to spend less time
working from home, and childcare centres and schools                      working, and pick up more of the load at home instead. During
closed, the way households share the load at home                         Alert Level 4, female respondents said they did proportionately
(i.e. how they divide housework and care responsibilities)                more paid work, while male respondents said they did
was thrust into the spotlight.                                            proportionately more unpaid work.

A year on from the initial lockdown, we have a real opportunity to        How did we determine New Zealand’s economy could increase by
reflect on the decisions we make around the amount of paid and            an average of $1.5 billion each year if we shared the load at home?
unpaid work we do, and who does it. In addition to the implications       Based on our survey data, we conducted econometric modelling
for family life and gender equality, these decisions have a significant   to determine how many hours couples would spend in paid work
impact on New Zealand’s economy.                                          if they shared the load at home more evenly. The modelling found
                                                                          that the higher earner in a relationship would do 1.3 hours less of
As such, Westpac engaged Deloitte to explore attitudes towards            paid work and pick up an extra 3.8 hours of unpaid work at home.
a more equal sharing of the load at home, and measure the                 The lower earner would do 4.3 hours more of paid work each week,
economic benefit it could generate for New Zealand. This report           but reduce their unpaid work in the home by 3.8 hours. This would
is part of Westpac’s ongoing commitment to improving gender               result in a net increase of three labour hours per couple, per week.
equity, and closing the gender pay gap.                                   This means the higher earner would take on more household
                                                                          responsibilities from the lower earner. At a national level, this
A bespoke survey was conducted for this report. The survey
                                                                          results in an increase in the total number of hours worked across
included couples with and without children, as well as solo
                                                                          New Zealand.
parents, but deliberately focused on couples with children.1

The survey and associated analysis had four key findings:

1.		Women typically undertake most of the unpaid work, or
                                                                               Given the number of
     the load at home, while men do the majority of paid work.
                                                                               hours worked is a key
2.		Despite progress in recent years, women continue to
     participate in the workforce at lower rates and are less likely           driver of economic growth,
     to work full-time relative to men. Reducing this participation
     gap could substantially boost our economy.                                this report finds sharing
3.		This could also improve wellbeing and help many                           the load more equally
     New Zealanders meet their aspirations to lead a more
     balanced family life.                                                     could increase the size of
4.		Sharing the load at home more evenly can facilitate an increase
     in the total hours of paid work provided by a couple.
                                                                               New Zealand’s economy
Right now, most New Zealand couples do not share the load at
                                                                               by $1.5 billion on average
home equally. In our survey of 2,421 New Zealanders conducted
in October 2020, just 10% of couples where both partners worked
                                                                               every year, representing
full-time said they split the load at home 50:50. On average, female
respondents said they did 69% of the unpaid work provided by
                                                                               approximately 0.5%
their couple, and 34% of the total paid work.
                                                                               of New Zealand GDP.
                                                                                                                                            3
Westpac New Zealand: Sharing the load report | The economic benefit of sharing the load at home

                                                 Sharing the load at
                                                 home more evenly
                                                                 Increases the labour supply of the

                                                                 lower earner by more
                                                                 than it decreases the supply of the
                                                                 higher earner

                                                                           increase
                                                                 Leading to a net

                                                                 in labour force
                                                                 participation

                                                                        broader
                                                                 Which creates
                                                                 economic benefits
                                                                 for New Zealand.

                                          On average every year,
                                          the economy would be
                                                                                                   billion

                                                                                                             larger
                        with

                                                                                            additional FTEs
4
Westpac New Zealand: Sharing the load report |
                                              Executive Summary

The number of hours worked, or labour supply, is a key driver of      We identified four key areas for action:
economic growth. Computable general equilibrium (CGE) modelling
– which represents the demand and supply relationships in the         1.		Normalising flexible work, which has already been
economy – was used to determine how much this additional                   accelerated by the pandemic, needs to continue. Flexible
labour supply would increase the size of the economy by (i.e. $1.5         working arrangements, including being able to work from
billion on average, each year). For more information, refer to ‘The        home, were perceived by survey respondents as a key incentive
economic benefit of sharing the load at home’, and Appendix C.             to take on paid work. They could also help couples share the
                                                                           load at home more evenly. In our survey, just 10% of couples
                                                                           who both worked full-time shared the load 50:50. Normalising
Ultimately, a society where New Zealand                                    flexible work will be important in encouraging its uptake,
couples share the load at home evenly,                                     especially by men and those in senior roles.

is one where men and women feel                                       2.		Government and businesses have an opportunity to
                                                                           work together to improve parental leave, including by
empowered to participate equally in                                        empowering fathers to spend more time with young children.
both paid and unpaid work.                                                 Research shows this leads to greater involvement in childcare
                                                                           throughout the rest of the child’s life, and provides greater
But moving towards what many New Zealanders want, and                      flexibility for women to take on more paid work. In turn, this
achieving the resulting economic benefit, requires change.                 can increase economic inclusion for women and help close the
We know all New Zealand couples won’t miraculously be able to,             gender pay gap. But for any policy changes to be successful,
or necessarily want to, move to a more equal division of the load          parents need to feel supported to take up new entitlements.
at home overnight. Decisions around how households divide paid
                                                                      3.		Childcare affordability was a challenge for many parents in
and unpaid work will always remain a personal choice.
                                                                           our survey, and is often a barrier to women re-entering or
Given the desire of survey respondents to more equally share the           remaining in the workforce. Given the link between childcare
load at home, and the $1.5 billion economic opportunity at stake,          affordability and labour force participation, it’s worth exploring
this report aims to continue the conversation around how we                what the Government and businesses can do to improve
might achieve this.                                                        childcare affordability.

                                                                      4.		Ultimately, a society where New Zealand couples share the
                                                                           load at home evenly, is one where men and women feel
                                                                           empowered to participate equally in both paid and
                                                                           unpaid work. We hope this report stimulates discussion,
                                                                           and prompts you to consider how your family divides paid
                                                                           and unpaid work, how you might like to in the future, and how
New survey findings from this report                                       businesses and the Government could support you to do so.

How do respondents                    How would respondents           What are the barriers                 What was the impact
and their partners                    and their partners like to      and incentives to achieving           of Alert Level 4?
currently divide paid                 divide paid and unpaid work     the ideal division?
                                                                                                            • During Alert Level 4, male
and unpaid work?                      in an ideal world?
                                                                      • Prioritising maximised                respondents maintained the
• Male respondents said they          • In an ideal world, male         household income was                  same contribution to the
  did 63% of the total paid work        respondents said they           the most common barrier               paid work provided by their
  provided by their couple,             wanted to do 5% less paid       preventing respondents from           couple, on average. However,
  while female respondents              work, and 3% more unpaid        achieving their ideal time            male respondents did 4%
  said they did 34%.                    work.                           division (34%), followed by           more unpaid work.
                                                                        the cost of childcare (24%).
• On average, male                    • Female respondents said                                             • Female respondents saw a
  respondents said they did             they wanted to do 6% more     • 44% of respondents agreed             5% increase in the proportion
  43% of unpaid work within a           paid work, and 7% less          being able to work from               of paid work they provided to
  couple. This compares to 69%          unpaid work.                    home would incentivise them           39%. At the same time, the
  for female respondents.                                               to take on paid work.                 proportion of unpaid work
                                                                                                              they did fell by 6%.
                                                                                                                                            5
Westpac New Zealand: Sharing the load report | Sharing the load at home

Sharing the
load at home
Balancing careers alongside care responsibilities and
housework has always been challenging, but COVID-19 has
put a spotlight on how households share the load at home.

Women in New Zealand are participating in employment at higher             An international survey conducted across 18 countries4 during
rates than ever before. Improved access to parental leave, early           May 2020 showed women, on average, had more responsibility for
childhood education (ECE), and flexible working arrangements,              housework and care responsibilities during lockdown, compared to
have supported New Zealand households to better balance                    men.5 In a similar United Kingdom survey, only a quarter of fathers
commitments at work, and at home.                                          said they had taken on more childcare responsibilities, compared
                                                                           to half of mothers during lockdown.6 However, in New Zealand this
Yet New Zealand’s female labour force participation rate continues         trend was reversed, as shown in this report.
to lag behind males.2 Despite changes to legislation and workplace
policies, women generally continue to do the bulk of care work             COVID-19 has disrupted life as we know it. But it is also an
and housework, while men undertake most of the paid work.3                 opportunity to reflect, consider how the load at home could
This affects the labour force participation patterns of men                be shared in the future, and what this could do for our economy.
and women.                                                                 As such, Westpac engaged Deloitte to explore and measure the
                                                                           economic benefit of a more equal sharing of the load

COVID-19 has disrupted life as we know                                     at home.

it. But it is also an opportunity to reflect,                              The analysis in this report is based on primary research and
                                                                           data analysis, as well as a review of the relevant literature.
consider how the load at home could be                                     In particular, we:
shared in the future, and what this could
                                                                           • Conducted a survey of over 2,421 people across New Zealand to
do for our economy. As such, Westpac                                         understand exactly how men and women divide paid work, and
engaged Deloitte to explore and                                              the load at home.

measure the economic benefit of                                            • Considered the current gender-based division of paid and unpaid
a more equal sharing of the load                                             work, as shown in Appendix A.

at home.                                                                   • Estimated the economic benefits of a more equal sharing of the
                                                                             load at home to New Zealand’s economy using CGE modelling.
In particular, women tend to work fewer hours than men, and
                                                                           This report fills an important gap in existing New Zealand research.
are more likely to take time out of the workforce, or not be in
                                                                           While the unequal distribution of paid and unpaid work between
the workforce altogether. Yet we know many women would like
                                                                           men and women is well-established in the literature, there is
to work more, but already feel like they have too much on their
                                                                           limited research around the economic benefits of a more equal
plate. This report looks at whether sharing the load at home
                                                                           distribution from a New Zealand perspective.
more equally could support greater labour force participation –
particularly by women – and, in turn, grow New Zealand’s economy.

When COVID-19 lockdowns saw childcare centres and schools
close, and children stuck at home, the spotlight was put on how
the load at home is shared.

                                                                                                                                              6
Westpac New Zealand: Sharing the load report |
                                              Sharing the load at home

                           Sharing the load at home
                           Sharing the load at home is an “umbrella” term for the variety of tasks required
                           to run a household, and how these tasks are shared.

                           Housework (i.e. home duties/maintenance) includes activities such as cooking, cleaning, laundry,
                           gardening, home and car maintenance, caring for pets, and household errands like shopping and
                           paying bills.

                           Care responsibilities (or care work) involve looking after dependent children, including playing
                           with them, helping them with personal care, and taking them to and from school and care. Care
                           responsibilities also involve looking after adults, such as a disabled adult relative, spouse, or
                           dependent parents.

                          About the survey
                          This report draws on data from a new survey of 2,421 New Zealand residents
                          aged 18 to 64. The survey was fielded by Dynata during October 2020.

                          The survey is representative across all regions and incomes, and includes people of all sexualities
                          and genders. Our analysis focuses on heterosexual couples due to the size of the data set, and
                          given the key role gender currently plays in how the load at home is shared.

                          While ethnicity was not a focus of our analysis, our data suggests the load at
                          home is currently shared similarly across New Zealand European, Māori, Pasifika,
                          and New Zealand Chinese households. Nevertheless, we acknowledge there may
                          be a number of nuances in how families of different ethnicities share unpaid work,
                          which the data may not necessarily capture.

                          The survey asked up to 26 questions about:

                          • Employment status

                          • Uptake of parental leave

                          • Time use on paid and unpaid work

                          • Attitudes to gender norms

                          • Demographics

                          More information about the survey can be found in Appendix B of this report.

                                                                                                                                7
Westpac New Zealand: Sharing the load report |
                                              How do we share the load at home?

How do we share
the load at home?
Most New Zealand couples do not share the load at
home equally. Instead, men tend to do most of the paid
work, while women take on most of the load at home.

Our survey finds the division of labour is still gendered: men                Young children clearly affect decisions around paid work. Figure 2
typically do most of the paid work, while women undertake the                 shows the percentage of respondents not working full-time to look
bulk of housework and care responsibilities. But in an ideal world,           after their children, by age of eldest child. Respondents with their
most couples wanted to more equally split paid and unpaid work                oldest child aged 0-4 were almost twice as likely as those with their
between them.                                                                 oldest child aged 14-17, to not work full-time in order to look after
                                                                              their child.
How do couples currently divide paid work?
On average, male respondents in a couple said they did 63% of
paid work, while female respondents said they did 34% of paid
work.7 This mirrors Statistics New Zealand’s time use survey,
conducted in 2009/10, which found 63% of male work is paid.8
                                                                                     Current contribution
85% of all male respondents said they worked full-time, compared
to 38% of all female respondents. Women were more than five                          to paid work:
times as likely as men to work part-time, and over three times as
likely to not be employed. As such, it was relatively common for
men to work full-time, while their female partner worked part-time,                                    Male respondents

                                                                                                       63%
casually, or was not employed (i.e. not in the labour force (NILF)).9

Income plays a role in the contribution each partner makes to
the hours of paid work provided by their couple. For example,
female respondents with a household income under $90,000
did 29% of the paid work provided by their couple. In comparison,
female respondents with a household income over $140,000 did                                           Female respondents

                                                                                                       34%
41% of paid work.

Figure 1 shows the main reason respondents are not working
full-time, by gender. Women were over four times as likely as males
to say they were not working full-time in order to look after their
                                                                                   Source: Dynata (2020), Deloitte Analysis, N = 1757
children, particularly if they had infants or toddlers. Moreover,
females were over twice as likely as men to not work full-time                     These figures do not add to 100% as they refer to male
                                                                                   respondents and a separate group of female respondents.
because of housework.

                                                                                                                                                  8
Westpac New Zealand: Sharing the load report |
                                              How do we share the load at home?

                          Figure 1: Main reason respondent is not working full-time, by gender

                                                                                                                      52%
                      Looking after your child(ren)
                                                                                12%

                                                                              10%
                        Home duties/maintenance
                                                                  4%

                                                                          9%
            Unable to find suitable full-time work
                                                                                              19%

                                                                          8%
                       Prefer not to work full-time
                                                                                      14%

                                                                    6%
 Unable to work due to sickness/injury/disability
                                                                                               21%

                                                                   6%
                                  Study or training
                                                                          9%

                                                                  4%
                                              Other
                                                                         7%

                                                             3%
                        Other care responsibilities
                                                         1%

                                                          1%
                                  Prefer not to say
                                                                          9%

                                                          1%
            Looking after other people's children
                                                             3%
                                                                                                            Females
                                                          1%
                                    Voluntary work
                                                         1%                                                 Males

                                                       Source: Dynata (2020), Deloitte Analysis, N = 1070

                          Figure 2: Respondents who are not working full-time to look after their children

                                                                  82%
                                                      79%

                                                                              59%

                                                                                        42%

                                                                                                    18%

                                                       0-1        2- 4        5 -13    14-17        18+

                                                                  Age of eldest child

                                                      Source: Dynata (2020), Deloitte Analysis, N = 784                     9
Westpac New Zealand: Sharing the load report |
                                              How do we share the load at home?

How do couples currently divide the load at home?                             73% of all respondents thought if both partners in a couple
There are clear patterns around who typically shoulders the load              worked, they should share the load at home equally. However,
at home. Within couples, male respondents said they did 43% of                in a typical week, the load at home was equally shared among only:

                                                                                                   10%
unpaid work, on average. In contrast, female respondents said
they did 69% of unpaid work. These findings are broadly consistent
with Statistics New Zealand’s Time Use Survey, which found 65% of
female work is unpaid.8
                                                                                                   of couples who
       Current contribution                                                                        both work full-time
       to the load at home
                          Male respondents                                                         13%
                          43            %                                                          of couples who
                                                                                                   are employed
                        Female respondents

                        69           %                                                             7%
        Source: Dynata (2020), Deloitte Analysis, N = 1757                                         of couples who
                                                                                                   both work the same
Table 1 below shows the average contribution male and female
respondents each made to the total unpaid work provided by their
                                                                                                   number of hours
couple.10 On average, men contributed more housework than care                                     Source: Dynata (2020), Deloitte Analysis, N = 1757
work, while women contributed the same proportion of housework
and care work.                                                                Instead, male respondents with a female partner working the
                                                                              same number of paid hours per week, did 19 hours of unpaid work.
On average, male respondents said they did 11 hours of housework              When it came to female respondents who did the same number of
per week, and 10 hours of care work. Female respondents said                  paid hours as their male partners, females did 28 hours of unpaid
they did 19 hours of housework, and 25 hours of care work.                    work. These findings are supported in the literature. For example,
                                                                              Bittman et al. finds even when paid hours of work are equal,
There tended to be discrepancies in the amount of unpaid work
                                                                              women do more unpaid work than men.11
male respondents thought their female partners did, and the
number of hours of unpaid work reported by female respondents.
For example, male respondents thought their partners did 11
hours of care work per week, well below the 25 hours female
respondents said they did on average.

Table 1: Contribution to unpaid work, by gender

Type of unpaid work                  Male                    Female
                                     respondents             respondents

Average contribution
                                     45%                     69%
to housework

Average contribution
                                     40%                     69%
to care responsibilities

Source: Dynata (2020), Deloitte Analysis, N = 1757

These figures do not add to 100% as they refer to male respondents
and a separate group of female respondents.
                                                                                                                                                        10
Westpac New Zealand: Sharing the load report |
How do we share the load at home?
Income appears to be a factor in how the load at home is currently Why do couples divide their time this way?
shared. Higher income couples were twice as likely as lower income Couples often divided their time this way because they thought
couples to share the load at home equally.12 In part, this may be it was fair, or it was their preference, as Figure 3 shows.15
because higher income couples also tended to divide paid work
more evenly. However, across all incomes, women continued to do Many of the men in our sample tended to work longer hours,
the bulk of unpaid work. while their female partners worked fewer hours, or did not work.
As such, many women thought it made sense, or was fair, for them
The way the load at home is shared also varies by age. Older to pick up more of the load at home.
couples generally did less unpaid work than younger couples.
For example, female respondents aged 45-54 did 13 hours of care But many respondents also said their current division of paid
work per week, compared to 33 hours for female respondents and unpaid work was driven by personal preference.16 Bertrand
aged 25-34. suggests this may reflect ‘sticky stereotypes’ about what men and
women ‘should’ do – i.e. a man should be the breadwinner, and a
While older couples were more likely to share the load at home woman the homemaker.17 These sticky stereotypes shape choices
equally relative to younger couples, most couples across all age that may often be consistent with self-interest.
brackets did not share the load equally. For example, female
respondents aged 45-54 and 25-34 both did around 70% of These stereotypes sway people’s preferences, sometimes to the
care work. extent where individuals are unaware.
Parental leave uptake reflects how unpaid work is typically divided,
as summarised in Table 2. Of the respondents who took Primary What can sharing the load look like?
Carer leave, 83% were women, compared to 17% of men. Relative Jess and Chris Williams
to women, men were almost four times as likely to take Partner’s
Leave. Jess and Chris live in Auckland with their two kids – Emma
aged 18 months, and Jacob aged three. Jess works as a vet
Table 2: Uptake of selected types of statutory parental nurse in Mount Wellington three days a week, while Chris
leave, by gender works for a law firm in the CBD.
On her way to work, Jess drops Jacob at kindy, and Emma at
Type of leave Males Females
her grandma’s house shortly afterwards. Once Jess finishes
Primary Carer Leave 17% 83% work at 4pm, she picks up Jacob and Emma and returns
home to start cooking dinner. Chris has an hour’s commute,
Partner’s Leave 78% 21%
so normally arrives home around 6:30pm and is on bedtime
Extended Leave 21% 79% duty shortly afterwards. Later in the evening, Chris catches
up on emails, while Jess will tidy the kitchen and play area.
Source: Dynata (2020), Deloitte Analysis, N = 1269
Chris puts in a lot of hours at work, so Jess is happy taking
Types of parental leave 13 on more of the load at home. However, if Chris could finish
Statutory Primary carer leave is available to female employees work at 5pm three days a week and do the afternoon pick up,
who are having a baby, or employees who are going to have the Jess would prefer to do a full day and finish at 5:30pm. If Jess
primary responsibility for the care, development and upbringing and Chris switched to this routine, they would take on about
of the child. As at May 2021, employees are entitled to a maximum three more hours of paid work in total, each week.
of $606.46 per week before tax, for up to 26 weeks.14
Chris would also get to spend more time with his children,
Statutory Partner’s Leave provides up to two weeks of unpaid as well as interact with their early childhood teachers and
leave for individuals who are not going to be their child’s other parents.
primary caregiver.
11Current time division
Within couples,
Male respondents said they
did
63 % of paid work.
Female respondents said they
did
34 % of paid work.
Within couples,
Male respondents said they
did
43 % of unpaid work.
Female respondents said they
did
69 % of unpaid work.
73% ofworked,
all respondents thought if both partners in a couple
they should share the load at home equally.
However, just 10%
of couples
who both work full-time had a
50:50 split of unpaid work.
These figures do not add to 100% as they refer to male
respondents and a separate group of female respondents.
12Ideal time division
Within couples,
Male respondents wanted to
do
58
% of paid work.
Female respondents wanted to
do
40
% of paid work.
Within couples,
Male respondents wanted to
do
46
% of unpaid work.
Female respondents wanted to
do
62
% of unpaid work.
These figures do not add to 100% as they refer to male respondents and a separate group of female respondents.
13Westpac New Zealand: Sharing the load report |
How do we share the load at home?
Figure 3: Reasons for current division of paid and unpaid work
It's what we prefer 39%
We think it is fair 36%
It's what we're better at doing 30%
Current earnings/earnings potential 27%
My partner is unwilling or unable to undertake additional
13%
home duties/maintenance or care work
My partner is unwilling or unable to work/work more hours 8%
It is what society expects 7%
None of the above 6%
Other 5%
Source: Dynata (2020), Deloitte Analysis, N = 2093
Alternatively, stereotypes may affect people’s behaviours and
preferences, because of concerns around straying from prescribed What can sharing the load look like?
gender norms.18 This may explain why only 7% of respondents Aroha Davis and Simon Cooper
explicitly agreed ‘what society expects’ was a factor in their
division of paid and unpaid work, while 39% said it was what they Aroha is 36-years-old and lives in Wellington with her
preferred. husband Simon. The couple are busy professionals, who
both work upwards of 40 hours a week in public sector roles.
27% of respondents identified current earnings or earnings They have one son, Micah, who has recently turned five and
potential as a key reason affecting their division of paid and unpaid started school.
work. This was particularly true for 25-44 year olds, those with a
household income between $90,000 and $140,000, and where After school, Micah attends an after school programme in
one person in a couple worked full-time, while the other worked Kelburn until Aroha picks him up just after 5pm. Between
part-time or casually. 5 and 7pm, Aroha typically squeezes in dinner, a load of
laundry, and reads a few books with Micah. Simon arrives
home around 8pm and relaxes, while Aroha preps for
meetings the following morning.
Although they both work a similar amount and Aroha earns
more than Simon, he does much less around the house than
her. The couple spends about 50 hours a week looking after
Micah and keeping the house in order, of which Simon does
10 hours. Aroha thinks it would be fairer if they split the load
at home 50:50, which would be possible if Simon worked
through his lunch break and came home an hour earlier, and
helped out more during weekends.
14Westpac New Zealand: Sharing the load report |
How do we share the load at home?
How do couples want to divide their time in an ideal world?
On average, men want to do less paid work and more unpaid What can sharing the load look like?
work.19 Women, on the other hand, want to do more paid work, and Mike and Rose Chan
less unpaid work.
Mike is a 62-year-old plumber working in Invercargill, who
While both men and women wanted to see a change in how they lives with his wife Rose. Rose teaches at a primary school in
and their partner divided their time, women wanted to see a bigger Invercargill, and enjoys being around kids – especially now
change – particularly when it came to the load at home. that their children have left home.
In an ideal world, 27% of our sample desired a 50:50 split of the Mike enjoys gardening, washing the car, and walking the dog,
load at home. Those on higher incomes have a stronger desire, but also offers to cook dinner once or twice a week. On the
or perhaps perceive a greater ability, to share the load at home other hand, Rose does most of the cleaning and laundry, and
equally. 39% of those on a household income of $140,000 or more the weekly grocery shop. These chores take Mike and Rose
wanted to share the load evenly, compared to 19% of those with a about 20 hours a week, which they split roughly 40:60.
household income below $90,000.
Not everyone wants to change how they share the load at
Even in an ideal world, not all respondents wanted to share home. Mike and Rose have been married for nearly 35 years
the load at home equally. This could be the result of genuine – so they know what works for them, and want to stick with
personal preference. However, gender norms may also be driving it. As Mike and Rose are both nearing retirement, they are
respondents’ attitudes around how they and their partner should keen to keep their evenings and weekends free, rather than
spend their time. working more.
How do we get to respondents’ ideal division?
Given the difference between the current and ideal division of
paid and unpaid work across couples, we wanted to consider
what might be preventing the ideal division, and how it could be
reached. Figure 4 (on the following page) summarises the barriers
respondents identified with.20
15Westpac New Zealand: Sharing the load report |
How do we share the load at home?
Figure 4: Barriers preventing ideal time division
Prioritising maximised household income 34%
Cost of childcare 24%
None of the above 20%
Prioritising career 20%
My partner is unwilling or unable to take on(additional)
18%
home duties/maintenance and care work responsibilities
Unable to find suitable work 13%
Unable to find suitable assistance
9%
for other care responsibilities
My partner is unwilling or unable to take on
8%
(additional) paid work
Unable to find suitable childcare 7%
Other 5%
Source: Dynata (2020), Deloitte Analysis, N = 2093
34% of respondents said prioritising maximised household income Over double the number of women identified these as incentives,
was one factor preventing them from achieving their ideal split of compared to men. Childcare appears to be front-of-mind for
paid and unpaid work, with their partner. This was a barrier for 40% more women than men, given women generally tend to do
of respondents aged 35-44, and for 43% of respondents where more childcare.
either they or their partner were working full-time, while the other
worked part-time or casually. But more instrumental than assistance with childcare was being
able to work from home, and flexible working arrangements –
even for respondents without children, and across a range of
But more instrumental than assistance demographics.
with childcare was being able to work
Figure 5 shows the other factors that could encourage people to
from home, and flexible working undertake more paid work.21
arrangements – even for respondents
without children, and across a range of
demographics.
While finding suitable childcare was not a barrier for most, the cost
of childcare was a key challenge. Nearly a quarter of respondents
thought access to suitable and affordable childcare, and financial
assistance with childcare costs, would incentivise them to
undertake more paid work.
16Westpac New Zealand: Sharing the load report |
How do we share the load at home?
Figure 5: Incentives to take on additional paid work, all respondents
Being able to work from home 44%
Flexible working arrangements 42%
Ability to work part-time rather than full-time 34%
Being able to work a set number of hours on set days 31%
Getting a job that matches your skills and experience 31%
Access to suitable and affordable child care 23%
Financial assistance with childcare costs 23%
Being able to maintain welfare payments 17%
Help/more help from my partner with home the load at home 14%
Source: Dynata (2020), Deloitte Analysis, N = 2093
Table 3: Contribution to paid and unpaid work during
Impact of COVID-19 lockdown, by gender
Our findings suggest Alert Level 4 (lockdown) had a small
effect on the paid and unpaid work patterns of couples, Activity Male Female
as summarised in Table 3.22 respondents respondents
We found the total hours of paid work provided by couples 63% 39%
Paid work (no change on (up 5% on a
fell during lockdown. However, based on the hours
a typical week) typical week)
reported by respondents, women increased their relative
contribution to the paid work (in percentage terms) 49% 62%
Housework (up 4% on a (down 7% on a
provided by their couple.
typical week) typical week)
Couples increased the amount of unpaid work they did 44% 63%
during lockdown, with schools and childcare centres Care responsibilities (up 4% on a (down 6% on a
closed and everyone at home virtually all of the time. typical week) typical week)
Indeed, women continued to do the bulk of unpaid
Source: Dynata (2020), Deloitte Analysis, N = 1757
work during lockdown. However, we found the average
male contribution to unpaid work within a couple
increased during lockdown, while the average female Why share the load at home?
contribution decreased. Respondents expressed a desire to more equally share the load at
home. Moving to a more even share of unpaid work would better
Unlike surveys conducted overseas, our findings do not match what many New Zealanders want, and deliver a significant
suggest women bore the brunt of COVID-19’s impact on benefit to our economy.
the load at home. Instead, both men and women faced
a bigger load at home, which was shared.
Notwithstanding the vast differences between life in
lockdown and everyday life, these findings represent a
version of ‘what could be’ – men taking on more of the
load at home, and women increasing the amount of paid
work they do.
17Westpac New Zealand: Sharing the load report | The economic benefit of sharing the load at home
The economic
benefit of sharing
the load at home
More equally sharing the load at home would grow
New Zealand’s economy by an additional $1.5 billion
on average every year, representing approximately
0.5% of New Zealand GDP.
Overall, sharing the load at home is good for families and Of course, there are a range of factors determining how couples
individuals. Couples where both partners divide unpaid work choose to divide unpaid work – from personal preferences and
more equally are generally healthier23 and happier24 than those upbringing, to practical considerations like income, and access to
who do not. suitable childcare. Not every household will be willing or able to
adopt a more even distribution of unpaid work. However, these
But there’s also a broader economic dividend. Distributing figures indicate the magnitude of the economic opportunity
housework and care responsibilities more equally means more which could result.
people can join the workforce, increasing participation rates.
This is critical to longer term economic growth and could also
catalyse broader economic benefits, such as reducing the More evenly sharing the load at home requires what for
gender pay gap. many would be an achievable reallocation of time. For
the average household, holding the absolute amount of
Sharing the load at home creates an opportunity for an overall unpaid work constant:
increase in the number of hours people spend in paid work.
This report uses econometric modelling to look at how many hours
• T
he lower earner would spend an additional 4.3 hours
couples would be willing to work in a scenario where the load at
on paid work and 3.8 hours less on unpaid work.
home is shared more evenly, based on couples’ stated preferences.
The modelling finds that a more even split of the load would mean • T
he higher earner would spend 3.8 hours more on
higher income earners would tend to work fewer hours. However, unpaid work and 1.3 hours less on paid work, in order to
this decrease is more than offset by an increase in the working accommodate additional household responsibilities.
hours of lower income earners. In net terms, sharing the load at
home leads to an additional three hours labour supplied per
couple, per week.
Yet, the benefit this change creates for the broader economy
is substantial. If all couples in New Zealand shared the load at
home more evenly, it would mean New Zealand’s economy
was on average $1.5 billion larger every year, representing
approximately 0.5% of New Zealand GDP. In employment
terms, it leads to an additional 25,000 full-time employees, on
average each year.
18Westpac New Zealand: Sharing the load report | The economic benefit of sharing the load at home
Sharing the load and labour supply However, not every household is going to be able to make this
Using data on the time-use patterns and labour supply of more change. One reason some households may choose not to share
than 1,600 New Zealand couples from our survey, we determined the load equally is that it may leave them financially worse off; for
the relationship between sharing the load and household labour example, due to wage differences or childcare costs. Additionally,
supply.25 The modelling controls for other factors which might affect if the time spent on unpaid work remains the same, an increase
labour supply, such as location, family type, age, number of children, in paid work may take away from leisure time. Each household will
age of youngest child, household income and ethnicity. Further make their own decisions about the ideal way to spend time based
detail on the model specification is provided in Appendix C. on its needs and preferences. However, across the economy, the
net impact of sharing the load at home is positive.
Specifically, the modelling considered the impact on total hours
Modelling for this report
worked by a couple as a result of moving towards the ideal split of
unpaid work. The ideal division of unpaid work was determined
found that if couples who
based on the stated preferences of survey respondents, for the
portion of respondents who said their current division of labour
would like a more even split
was not a preference.
Modelling for this report found that if couples who would like a
more even split of unpaid work were to move to the ideal, this of unpaid work were to
would lead to a three hour increase every week in labour
supply per couple. move to the ideal, this would
While sharing the load more evenly leads to a net increase in
labour supply at the household level, it means changes in how
lead to a three hour increase
both partners spend their time. The modelling suggests more
evenly sharing the load at home would see the lower income
every week in labour supply
earner (who often does the higher share of unpaid work) willing
to work 4.3 more hours every week. The higher income earner in
per couple.
the relationship (who typically does less housework) would work
The benefits of sharing the load are also likely to persist.
1.3 hours less every week on average, in order to accommodate
In the survey sample, more than three-quarters (76%) of the
increased housework and care responsibilities. For the average
lower earners were female. And it’s well known that women
couple household, more evenly sharing the load at home would
tend to do the bulk of unpaid work – this is true across all OECD
mean moving half an hour of unpaid work from the lower to the
countries.29 In part, this is caused by norms surrounding gendered
higher earner every day, or 3.8 hours every week.26
roles and skills.30
These changes may necessitate a decrease in the leisure time
As women work more hours and men take on a greater share of
of both couple members.27 However, at an aggregate level
the responsibilities at home, this will help to reshape the narrative
households would see an increase in income. Many households
around the gendered division of labour, creating a virtuous cycle.
may also choose to get help with household tasks; for example,
For example, research from Harvard Business School found that
unpaid help (via family or friends) or paid help (e.g. gardeners or
daughters of employed mothers across 29 countries were 1.2
babysitters).28 Indeed, higher levels of outsourcing were correlated
times more likely to be employed, have higher annual earnings,
with greater household labour supply in the survey.
and spend 44 additional minutes at work every day, compared to
daughters of stay-at-home mothers.31 Over time, increasing female
labour supply could also lead to broader benefits for women, such
as reducing the gender pay gap.
19Westpac New Zealand: Sharing the load report | The economic benefit of sharing the load at home
The economic impact of higher labour force participation While it’s true it may take the economy some time to incorporate
Labour supply, or the number of hours worked, is a key driver of more workers, research suggests that changes to participation are
economic growth. Increasing the hours of work being done leads unrelated to unemployment rates over time.35 That is, the increase
to an increase in GDP per capita, all else being equal.32 in labour supply also generates its own demand, developing the
need for those additional workers. That’s why countries with large
By increasing labour supply, sharing the load at home would migration programmes don’t tend to see higher unemployment
create an economic benefit for New Zealanders. Using computable rates over a sustained period.
general equilibrium (CGE) modelling, this report estimated the
impact of higher labour supply on output and jobs in New Zealand Other studies support the idea that increasing participation in the
(see Appendix C for details). labour force would lead to an increase in GDP. For example, Bryant
et al. found increasing the labour force participation of women
This report estimates New Zealand’s economy would be aged 25-34 to the average of the top five OECD nations, would
on average $1.5 billion larger every year under a scenario make GDP 1% higher than it would otherwise have been.36 Similarly,
where all couples shared the load more evenly.33 We McKinsey estimated if female labour force participation in each
conservatively assume it takes 10 years for couples to fully country increased at the same rate as the most rapidly improving
transition from the status quo to one where they are sharing the country in their region, global GDP could increase by $12 trillion
load at home more evenly. over a period of 10 years.37
Sharing the load at home isn’t just good for businesses –
households benefit from a jump in income too. Sharing the load
more evenly would increase gross national income – a measure of
the total income earned in New Zealand – by $1.2 billion on average
every year. This is equivalent to a 0.5% increase every year, or an
additional $530 per household (with the majority of the overall
benefit accruing to those households whose collective labour
supply has increased).34
This benefit is not just a one-off. Every year where couples are
more evenly sharing the load at home means another year of
economic gains. In the longer-term, increased participation could
also lead to improvements in productivity. This is because wages
tend to increase as employees gain more experience, skills and
knowledge relevant to their work, leading to a virtuous cycle.
20Westpac New Zealand: Sharing the load report |
Call to action
Call to action
New Zealand is set to gain from sharing the load at home.
But getting there requires a society where men and
women feel supported to participate equally – both in the
workplace, and at home.
New Zealand is set to gain from sharing the load at home So, what can we do now?
Sharing the load at home would increase the size of New Zealand’s To continue the conversation around how we can share the
economy by an additional $1.5 billion on average every year, load at home more equally, we’ve proposed four key areas for
representing approximately 0.5% of GDP. This economic benefit is action below.
driven by the increased labour force participation facilitated by a
more equal division of housework and care responsibilities. 1. Normalising flexible work
COVID-19 threw New Zealand into a giant experiment. Four in 10
Our modelling finds sharing the load at home leads to a net employed New Zealanders worked from home during lockdown,
additional three hours labour supplied per couple, per week. with many parents also juggling childcare.38 More than ever before,
At a national level, sharing the load at home leads to an employers and employees had to work together to balance paid
additional 25,000 full-time employees, on average each year. work and personal commitments.
But a more equal sharing of the load at home Many employees demonstrated they could work from home, adopt
won’t happen overnight flexible start/finish times, or compress their work weeks, and
The way couples distribute the load at home isn’t a simple continue to work effectively – despite the circumstances posed by
phenomenon, but a web of decisions – like choosing to have lockdown. This has accelerated the shift towards flexible work.
children, putting children in day care, taking time out of the
workforce, or working part-time. Flexible work offers benefits for both employees and employers.
Supporting employees to balance personal commitments and
These decisions are often the result of personal choice, influenced pursuits alongside paid work can result in happier staff, who are
by attitudes, beliefs, values, and societal norms. Often they are more engaged, productive, and likely to remain with their current
also constrained by external factors – such as the cost of childcare, employer. For parents in particular, flexible work can help them
earnings, the availability of suitable work, or leave eligibility. remain in paid employment, and share the load at home. Beyond
the benefits for family life, higher levels of labour force participation
Government and workplaces have the ability to alter many of these can also help to grow the economy.
external factors, such as changing parental leave settings. But
they are less able to immediately shift the narrative around the Normalising flexible work – including for men and those in senior
gendered division of labour, and therefore alter how people make roles – will be important to incentivising its uptake, and minimising
deeply personal choices. any perceptions of those who use flexible work as being less
interested or committed to their careers.39 This will be especially
That requires a combination of policy, and a shift towards a society important in encouraging men to adopt flexible work, so they can
where men and women feel empowered to participate equally – take on a greater share of the load at home.
both in the workplace, and at home.
Working face-to-face will always be important for meaningful and
effective communication, employees to remain connected to
each other, and team culture. Some roles will continue to require
employees to be on-site all the time. But when used tactically,
flexible work offers benefits for individuals, businesses, and the
wider economy.
21Westpac New Zealand: Sharing the load report |
Call to action
2. Encouraging dads to take parental leave 3. Improving childcare affordability
83% of those who took Primary Carer Leave in our survey sample The Government subsidises 30 hours of ECE per week, and fully
were women, while 78% of those who took Partner’s Leave were funds 20 hours of this for three-to five-year-olds.43 In addition,
men. Estimates suggest just 4% of Kiwi dads take the full two weeks the out of school care and recreation (OSCAR) subsidy provides
of Partner’s Leave, let alone assume full childcare responsibilities.40 support for some school-aged children.44
Removing the barriers for men to take on more of the load at Yet for many parents, the cost of childcare remains a challenge.
home, especially when it comes to childcare, starts from the Our survey found it was the second-most common barrier
moment a child is born. Bonding between a father and his baby preventing respondents from achieving their ideal split of paid
during paternity leave can improve a dad’s confidence and ability and unpaid work between them and their partner.
to care for his child in the long-term.41 At the same time, this makes
it easier for mums to take on paid work. Similarly, Statistics New Zealand’s 2017 childcare survey found 19%
of parents working, or wanting to work, cited childcare being too
expensive as their main difficulty in getting childcare.45
Government and businesses This impacts workforce participation, especially that of mothers:
27% of mothers who experienced difficulties getting childcare
have an opportunity work turned down paid work, while 22% stopped searching for paid
work. This compares to 14% and 12% for fathers, respectively.
together to improve parental More affordable childcare may change the way the load is shared
leave. at home, by supporting more families to outsource childcare, or
outsource a greater proportion of it. In turn, this may free up more
To encourage fathers to take parental leave, the Government could individuals – especially women – to participate in the workforce.
introduce a ‘father’s quota’, which would set aside leave specifically Over time, this may help to shift perceptions of women as
for dads, or secondary caregivers. As the leave would be non- homemakers alone.
transferable, it would be lost if not taken by the father.
Given the implications of childcare affordability on labour force
This approach has been adopted in many Nordic countries.42
participation, it’s worth exploring what the Government and
Government and businesses have an opportunity to work together businesses can do to minimise costs.
to improve parental leave. Some businesses have already taken
4. Challenging gender norms
action by topping up eligible employees’ salaries above the
Perhaps the simplest, yet hardest change required is challenging
statutory rate, extending primary carer and partner’s leave, or
stereotypes around what men and women ‘should’ do. Gender
offering a combination of additional leave and a salary top-up.
norms are socially constructed ideals around the appropriate roles
But it’s not just on the Government and businesses to change: and behaviours of men and women. They are so pervasive, they
men need to feel they are able to take parental leave without often alter our preferences without our conscious awareness, or
worrying how it might impact their reputation, earning potential, influence our decisions in ways we may not fully agree with.
and career trajectory. That requires workplaces, men, and their
Everyone has a role to play in changing how we think about gender.
families, to help normalise fatherhood in the workplace.
Openly supporting men and women who wish to work and parent
means not batting an eyelid when dad leaves work early to take his
daughter to a swimming lesson, when mum works 60 hours a week
and dad takes on the load at home, or when mum and dad both
work and look after the kids.
We recognise we don’t have all the answers to how we can more
equally share the load at home, and realise the resulting economic
benefit. But we hope this report prompts you to consider how your
family shares the load at home, how you might like to in the future –
and how workplaces and the Government could help you to do so.
22Westpac New Zealand: Sharing the load report |
Appendix A
Appendix A:
Historical context
New Zealand’s labour force structure and supply differs Participation trends over time
substantially by gender. Men are concentrated in full-time Male and female participation patterns in New Zealand have
employment across their working life, while women are historically been very different, as shown in Figure A.1. Although
more likely to work part-time, or not be employed. female participation remains lower than male participation, it
is catching up. In 1990, the average male participation rate was
Understanding how labour force participation varies by gender – 70%, while the average female participation rate was 51%.46
both over time, and in 2020 – provides important context to our This participation gap was particularly large for 25-34 year olds;
survey findings, in terms of how likely each gender is to participate research suggests this is largely the result of women leaving the
in paid work, and at what intensity. workforce to have children.
New Zealand’s labour force structure and supply differs Male labour force participation in the 25-54 age group has
substantially by gender. Men are more likely to work full-time remained steady since 1990, averaging 92% between 1990
across their lifetimes, while women are more likely than men not and 2020. However, the participation rate of females aged
to work, or work part-time. In addition, male labour supply appears 25-54 has gradually increased over the same period, from 70%
to be virtually unaffected by fatherhood, whereas motherhood has in 1990, to 81% in 2020.46 In addition, female participation in the
a much larger effect on female labour supply. 55-64 age group has grown substantially, rising from 31% in 1990
to 73% in 2020.46
With increased workforce participation often cited as a driver of
economic growth, understanding how more equally sharing the Over time, the female participation rate and pattern has shifted
load at home could increase workforce participation and reduce closer to that of males. For the year ended December 2020,
underutilisation is important – particularly as we continue to the male and female participation rates are similar for 15-24 year
economic recovery from COVID-19. olds.46 Nevertheless, women’s participation rate continues to lag
behind men’s.
Figure A.1: Male and female labour force participation in New Zealand, 1990 versus 2020
100
80
Participation rate (%)
60
40
20
0
15-24 25-34 35-44 45-54 55-64 65+
Age group (years)
Male - 1990 Male - 2020 Female - 1990 Female - 2020
Source: Statistics New Zealand (2021a), HLF035AA 23Westpac New Zealand: Sharing the load report |
Appendix A
What does New Zealand’s labour force look like today?
The working age population is split roughly 50:50 between • 8% of men were employed part-time, compared to
men and women. However, for the December 2020 quarter:47 18% of women.
• 75% of men were in the labour force, compared to Figure A.2 below provides a visual overview of these statistics,
65% of women. and a breakdown of the working age population by gender.
• 64% of men were employed full-time, compared to
44% of women.
Figure A.2: Labour force structure46
Male Female
Working-age Working-age
population population
100% 100%
In the labour Not in the In the labour Not in the
force labour force force labour force
75% 25% 65% 35%
Employed Employed
72% 62%
Unemployed Unemployed
3% 3%
Full-time Full-time
64% 44%
Part-time Part-time
8% 18%
Source: Statistics New Zealand (2021a), HLF035AA 24Westpac New Zealand: Sharing the load report |
Appendix A
The number of hours worked by men and women reflect New Figure A.4: Hours worked in main job, by gender
Zealand’s labour force structure, as Figure A.4 shows.48 Men tended
to work a higher number of hours than women, particularly in the 22%
50 + hours
‘50 hours and over’ bracket. However, the proportion of men and 9%
women working 40 hours was similar, at 25% for females and 31%
for males. Nevertheless, females remained concentrated across 11%
45-49 hours
the bands with fewer hours, given the high proportion of women 6%
working part-time.
4%
Given this distribution of hours, average weekly paid hours were 36 41-44 hours
2%
for men and 30 for women, for the year ended December 2020.49
31%
40 hours
The reasons for the different patterns 25%
and intensity of labour force participation 5%
35-39 hours
between men and women are complex 9%
and multifaceted. However, changing 7%
30-34 hours
the way men and women share the 12%
load at home could shift labour force 7%
20-29 hours
participation patterns, and allow New 14%
Zealand to realise an economic benefit. 5%
10-19 hours
10%
Why is our labour force structured this way?
The reasons for the different patterns and intensity of labour 3%
1-9 hours
force participation between men and women are complex and 7% Hours worked by males
multifaceted. For example, if a couple has a child, decisions around Hours worked by females
who takes primary carer leave, whether one or both partners 5%
0 hours
return to work, and whether they both return full-time, all impact 7%
labour force participation.
Source: Statistics New Zealand (2021b), HLF259AA
However, changing the way men and women share the load at
home could shift labour force participation patterns, and allow
To find out what this economic benefit might be, we asked 2,421
New Zealand to realise an economic benefit.
New Zealanders how they currently divide their time between paid
and unpaid work, and what this division might look like an ideal
world.
These findings are reported earlier in this report.
25Westpac New Zealand: Sharing the load report | Appendix B
Appendix B:
Survey information
This report draws on a survey fielded by Dynata in October 2020. Couple observations were dropped from the sample if
2,421 New Zealanders were asked questions about paid work, care household labour supply was equal to 0, or if it exceeded
responsibilities, housework, and parental leave. 150 hours per week. 150 hours was chosen as a cap, as it is
unrealistic for couples working more than this to increase their
The sample is nationally representative across regions, income hours worked. Couple observations were also excluded if either
and ethnicity. However, we restricted our sample to those aged partner spent more than 150 hours on unpaid work each week,
between 18 and 64, to reflect the bulk of the working or if the household did not do any unpaid work. Further, couple
age population. observations were excluded from the sample if the total reported
hours (spent on paid work, care responsibilities and housework) of
A key focus of this report is on individuals not in the labour force,
either partner exceeded 168.
working part-time, or casually – which tends to be women. As a
result, we oversampled females to ensure statistical robustness. The remaining sample comprised 1,757 couple observations.
Note this differs from the sample of 1,635 observations used
Although part of our survey analysis covers the full sample of 2,421
for modelling, as further cleaning needed for modelling was
respondents, much of the analysis focuses on couples and how
performed on this data.
they divide their time. This analysis uses a filtered dataset. Couple
observations were only included if the respondent stated their This sample was then analysed across various demographics,
relationship status was “Married/in a de facto relationship/in a civil particularly gender, age and income. The graphs below provide
union”, and if they lived with a partner. an overview of the key demographics across the full sample of
2,421 individuals.
Figure B.1: R
egional breakdown of where Figure B.2: Gender of respondents
respondents live
8%
14%
37%
63% 37%
29%
12%
Male
Auckland Female
Wellington Source: Dynata (2020), Deloitte Analysis, N = 2421
Rest of North Island
Canterbury
Rest of South Island
Source: Dynata (2020), Deloitte Analysis, N = 2421
26You can also read