The Value of Technology Releases in the Mobile App Ecosystem
←
→
Page content transcription
If your browser does not render page correctly, please read the page content below
The Value of Technology Releases
in the Mobile App Ecosystem
T H E E C O N O M I C I M PA C T O F S O F T WA R E D E V E L O P E R K I T S

Jin- Hy u k Ki m , Un ivers i t y of Color a do B oulder
Yid a n Su n , I l l i n oi s In s t i tute of Te ch nolo g y
L ia d Wa g m an , I l l i n oi s In s t i tute of Te ch nolo g y
Januar y 2021

T h e Va l u e o f T e c h n o l o g y R e l e a s e s i n t h e M o b i l e A p p E c o s y s t e m

1.EXECUTIVE SUMMARY

The smartphone digital ecosystem comprises many layers. Platforms release new hardware, operating systems, and
functionalities, accompanied by Software Developer Kits (SDKs), which enable app developers to take advantage of the
new hardware and software features. Developers, engineers and designers come up with innovative product ideas, and
these ideas can result in new apps offered to consumers. Despite the theoretical understanding of some layers of platform
markets in the academic literature, and the well-established practice of utilizing SDKs in the app ecosystem, how much
economic value or consumer surplus is being generated by such technology releases has been elusive. Using an expansive
dataset of iOS and Android app market activities from an app intelligence service provider, we derive results that identify
robust effects of technology (SDK) releases on app development, which in turn affect smartphone sales. In addition, we
link technology releases to new job creation, and provide a measure that estimates the consumer surplus associated with
apps.

An implication of SDK adoption is that more apps leverage new platform technologies. Put simply, SDK adoption
reduces the time it takes to develop apps and enables developers to introduce and take advantage of new hardware
functionalities. To that effect, we present preliminary evidence that SDK releases may increase early-stage startup funding
as well as the size of employment in a relevant high-tech sector (e.g., software developers). Our findings further indicate
that billions of dollars in consumer surplus are generated annually from mobile app ecosystems – our calculation is in
some sense a lower bound, taking into account only revenues generated directly within apps (e.g., the consumer surplus
generated from playing a game on a smartphone), and not from potential sales taking place outside of the app ecosystem
or advertising revenues.

Specifically, our analysis indicates that a positive shock to SDK releases (or a big push to mobile technology provision;
e.g., major annual releases of hardware and software), as measured by a one standard deviation rise in quarterly SDKs
released, appears to be associated with a rise in the number of new apps created of more than 38 percent for iOS apps,
and over 100 percent for Android apps, over the next few years from the date of such platform technology shocks. In
addition, a similar shock to SDK releases appears to be associated with increases in early-stage startup financing of almost
200 percent across platforms over the next four years, and in employment in a relevant industry sector (NAICS Code 518,
“Data Processing, Hosting, and Related Services”) of over 30 percent over the next six years.

Our analysis indicates that smartphone users benefit from the availability of mobile apps, to the tune of billions of
dollars in consumer surplus per year: Our estimate of iOS users’ consumer surplus is 1.33 billion dollars in the US, 2.85
billion dollars in the five largest Western European economies (France, Germany, Italy, Spain, and the United Kingdom;
henceforth, 5EU), and 10.5 billion dollars worldwide, annually; and it is 1.41 billion dollars in the US, 1.14 billion dollars
in the 5EU, and 12.2 billion dollars worldwide, annually, in the case of Android. Altogether, our results help illustrate just
how dynamic the smartphone and app ecosystems have been, with signs of significant economic benefits to consumers
and the broader markets.

                                                                           2
T h e Va l u e o f T e c h n o l o g y R e l e a s e s i n t h e M o b i l e A p p E c o s y s t e m

Glossary

                              Refers to the five largest Western European economies (France, Germany, Italy, Spain, and the United
5EU
                              Kingdom)

Android                       An operating system used for mobile devices manufactured by Alphabet, Inc.

Apptopia, App Annie           Mobile App and SDK market intelligence services, tracking performance in the mobile app ecosystem

Average Revenue Per           The average cost-to-download (i.e., the price of the app, which is zero for free-to-download apps) plus the
User (ARPU)                   average revenue per download from IAP

                              An economic measure of the benefit that consumers receive because of paying less for something than
Consumer Surplus (CS)
                              what they were willing to pay

                              A database comprising information about private and public companies, investments and funding
Crunchbase                    information, founding members and individuals in leadership positions, mergers and acquisitions, news,
                              and industry trends

                              Purchases made within an app, with payments made through the app store from which the app was
In-App Purchases (IAP)
                              downloaded, for additional or premium features

iOS                           An operating system used for mobile devices manufactured by Apple, Inc.

                              The North American Industry Classification System (NAICS) was developed for use in the collection and
NAICS Code
                              analysis of statistical data related to the US economy; a NAICS code is a classification within this system

                              Operating System, the software that supports the basic functions of a device, such as executing
OS
                              applications and controlling hardware and peripherals

Software Developer Kit        A set of tools for third-party developers to use in producing applications using a particular framework or
(SDK)                         platform

StatCounter                   Web traffic analysis service

                              A service offering statistics, consumer survey results, and industry studies on a variety of technology and
Statista
                              web-related topics

Structural Vector             A statistical model representing a stochastic process, used to capture the relationship between multiple
Autoregression (SVAR)         quantities as they change over time

Technology Release            Significant and newly available mobile technology provision; e.g., major annual releases of hardware
“Shock”                       and software features

                                                                      3
T h e Va l u e o f T e c h n o l o g y R e l e a s e s i n t h e M o b i l e A p p E c o s y s t e m
2. INTRODUCTION
Since Microsoft’s release of the Windows operating system in 1985, advancements in operating systems (OS: software that
acts as an intermediary between applications and computing hardware) of various types have brought to life new kinds
of devices in the last few decades that are connected to fixed as well as mobile communication networks.
While Windows is probably the most well-known “legacy” OS and maintains over 80% market share to date in the
desktop/laptop OS market, it has a share of less than 1% in the mobile OS market. Instead, the mobile OS market has
been largely divided between Android (developed by Google/Alphabet) and iOS (developed by Apple), with respective
market shares of roughly 70% and 30% (NetMarketShare, 2020).
Android and iOS have pursued different strategies. For instance, while Apple introduced the iPhone in 2007 and kept its
proprietary iOS under tight control across the globe, Google made its Android OS available to phone manufacturers as
well as telecom companies, which has led to a proliferation and widespread adoption of ‘smartphones’ globally.
Both Android and iOS facilitate the offering of software applications (henceforth, apps) on mobile devices. This aspect
of app markets has been extensively studied in the academic literature under the rubric of platform markets, where a
platform brings together the supply side (app developers) and the demand side (phone users), as well as other potential
sides (such as advertisers) to a joint marketplace.
However, the existing literature has paid relatively little attention to the underlying technological drivers or the
developments of so-called technology platforms – developments that have facilitated the rapid growth of mobile apps.
Third-party technology (tech) platforms, besides the mobile OS operators, provide building blocks and/or services that
can be used in mobile apps through their release of SDKs, which facilitate the development of and enable numerous
features in millions of apps.
There are numerous SDKs that support mobile apps and had been actively used over the history of the mobile app
markets we study. In our sample, the vast majority of the SDKs – over 90% of the thousands in our dataset – appear to
have been released by third-party tech platforms rather than by the developers of the operating systems, with millions of
mobile apps in our data having collectively utilized those SDKs. Tech platforms are able to release such SDKs in large part
due to the functionalities offered by the hardware and operating systems of mobile devices. In turn, by adopting SDKs,
developers can leverage services, data, and functionalities from numerous providers, facilitating the development of new
and potentially higher-quality apps. This is because typical app developers, such as an individual or a small startup, may
not have the capacity or ability to develop the requisite infrastructure for an app that an SDK provides.
That is, tech platforms provide ready-to-use codes or tools that leverage hardware and operating system features on one
side, to facilitate new and extended functionalities, potentially incorporating additional services, to app developers on the
other side. App developers embed SDK functionalities into their offerings; creating these SDK tools on their own could
entail considerable effort for developers or be practically impossible. The functionalities of SDKs range from app crash
reporting to advertising and marketing, from reading inputs from hardware sensors to processing payments, to name a
few. Although smartphone users may not directly interact with or be aware of SDKs, their availability has facilitated the
development of apps.
4T h e Va l u e o f T e c h n o l o g y R e l e a s e s i n t h e M o b i l e A p p E c o s y s t e m
The additional SDK layer in the broader app ecosystem raises the question of how much value technology platforms
provide. An approach taken in this report is to assess the economic value (known as consumer surplus) of the apps to the
end users. Given an aggregate measure of how much consumer surplus the mobile ecosystem generates, the effect of SDK
releases on app development can be ultimately linked to the benefits to the end users.
To that end, we use three aggregate time-series variables over eleven years for each mobile platform—namely, the number
of smartphone sales, SDK entries, and app entries, all measured at the quarterly level—to estimate a system of equations
where these variables are interrelated contemporaneously as well as with lagged effects, given that it may take 4-6 months
to build an app (Yarmosh, 2019).
For iOS, we find that if there is, say, a 10% positive shock to the number of new SDKs released in a quarter, then there is
an additional 8.4% increase in the number of new iOS apps released over the next two years; and if there is a 10% positive
shock to the number of new iOS apps in a quarter, then there is an additional 54% increase in the number of iPhones
sold over the next seven years.
For Android, we find that if there is a 10% positive shock to the number of new SDKs released in a quarter, then there is
an additional 20% increase in the number of new Android apps over the next three years; and if there is a 10% positive
shock to the number of new Android apps in a quarter, then there is an additional 22% increase in the number of Android
phones sold over the next two years.
Using 40 iOS app categories, we find that the aggregate daily consumer surplus based on our data varies substantially
across categories, ranging from $20,000 to over $200,000 daily in the US. By aggregating the consumer surplus generated
from all active apps on a day, we estimate that the iOS app market generates an aggregate daily consumer surplus of
$3.65 million in the US, $7.82 million in the 5EU, and $28.7 million worldwide. These estimates do not reflect consumer
surplus from apps that are installed by default.
Using 50 Android app categories, we find that the aggregate consumer surplus similarly varies across app categories. We
estimate that the Android app market generates an aggregate daily consumer surplus of $3.85 million in the US, $3.12
million in the 5EU, and $33.4 million worldwide. Given that our data do not include the Android app market in China
(e.g., Xiaomi, Tencent, etc.), this figure would be a conservative worldwide estimate.
We then assess the broader effects of SDK releases at the national level. While data availability is somewhat limited,
we find that major technology releases can lead to a 200 percent increase in the amount of known early-stage startup
financing over the next four years, and a 33 percent increase in the total employment in the Data Processing, Hosting, and
Related Services (NAICS 518) sector over the next six years.
5T h e Va l u e o f T e c h n o l o g y R e l e a s e s i n t h e M o b i l e A p p E c o s y s t e m
3 . D ATA D E S C R I P T I O N
We use three datasets. The first is quarterly time-series data, 2009:Q1-2020:Q1, comprising the number of smartphone
sales, SDK releases, and app releases in each quarter for each mobile OS (Android and iOS). To be precise, we construct
the quarterly smartphone sales based on two public sources: StatCounter (2020) provides monthly ‘mobile operating
system market share worldwide’ from 2009; and Statista (2020) provides yearly ‘number of smartphones sold to end users
worldwide’ from 2007.
Given that the Apple App Store opened in July 2008 and the Google Play Store in October 2008, we begin our time series
from the first quarter of 2009. Note that we do not have mobile OS market shares prior to 2009; however, we believe that
omitting 2008:Q4 from our analysis would have been sensible even if data were available, because both mobile platforms
encouraged third-party app development through challenges and awards prior to their respective app store launches.
To our knowledge, there are no readily available public data sources for SDK and app releases for either of the mobile
platforms. For instance, it is possible to scrape data from what is available on the mobile app stores; however, app stores
only provide limited information on each app, such as limited ranks and ranges of total downloads (10,000-50,000;
50,000-100,000, etc). Further, accurately collecting these data throughout a decade’s time would be practically difficult
for researchers.
Therefore, we rely on a proprietary data source which collects primitive data (such as SDKs) directly from the programming
codes of apps, and also uses direct data feeds on app performance from a large number of app publishers. Our data
source is Apptopia.com. Apptopia is one of the handful of firms providing app analytics and intelligence services for app
developers, publishers, and others, as well as app SDK analysis. Apptopia documents that their data comprises real data
feed from more than 125,000 apps (Kay, 2020).
Note that there are other app analytics firms. For instance, another well-known analytics provider in the mobile app
market is App Annie. Apptopia and App Annie were founded around the same time (2011 and 2010, respectively) and
our reading of various commentaries and reviews comparing the two firms suggests that the data quality is comparable
between the two. However, App Annie focuses on enterprise clients, and, consequently, declined to provide us with data
for academic research.
Accordingly, we have acquired access to Apptopia’s database that covers millions of apps. To be precise, there are 4.9
million iOS app IDs and 7.6 million Android app IDs in the app-level (profile) database, which includes the initial release
date of each app. These numbers far exceed the quantity of currently available apps on the Google Play and Apple App
Stores (2.7 and 1.8 million, respectively). We thus believe that their app-level data closely resemble the entire history of
the app markets, and we aggregate app releases by quarters.
Apptopia also provides unique SDK intelligence data based on an automated script analysis. For this, the firm pulls the
programming codes for all free-to-download apps, whenever an app is newly released or a new version is made available.
Apptopia cannot pull the codes for all pay-to-download apps, because of the financial implications of doing so. However,
over 90% of all iOS apps and over 95% of all Android apps are or were free-to-download apps; hence, this is unlikely to
cause a systemic bias in our analysis.
6T h e Va l u e o f T e c h n o l o g y R e l e a s e s i n t h e M o b i l e A p p E c o s y s t e m
More specifically, Apptopia tracks the date on which each SDK was installed and uninstalled from each app in our sample.
For our purposes, we need to identify the quarter in which each SDK was released (and thus first installed). Unless there
is a nontrivial number of SDKs that were only installed in paid apps, but not in any of the free-to-download apps (which
include ‘freemium’ apps, or apps that are free-to-download but require a purchase or purchases to fully operate), almost
all SDKs ever installed on a mobile app are very likely to be identified by the SDK fingerprints for millions of free-to-
download or freemium apps.
The second dataset we use is the cross-section of all currently active apps on a randomly chosen date, 6/1/2020, including
the number of downloads, download prices, and in-app purchase revenues. Although Apptopia’s app performance data
are tallied and available for each day in the last few years, we chose to focus on a recent date so as to assess the consumer
surplus of the “current” mobile app market, which is our focus here. We can readily apply our methodology to any other
date, but we do not think that our results are too sensitive to a chosen date, and they do not appear to be sensitive to other
nearby dates.
The sample universe of apps for which Apptopia tracks daily performance is more limited; however, it still includes a
large number of apps both active currently and historically. To be more precise, Apptopia tracks all apps that were ever
ranked on each mobile platform in any app store category in any country. These include the longer aggregate rankings
(e.g., top paid, top free) as well as the shorter (sub)category rankings. Importantly, once an app is ever ranked (even on
a single day), it is not readily dropped from the Apptopia sample although it may drop out of the chart rankings or even
have zero downloads and no active users.
The performance data include other metrics. For instance, each active app has the number of daily active users as well
as monthly active users. An important caveat is that, for any app analytics provider, the performance data include
extrapolation based on actual data from the apps that are sharing their analytics with the service provider (more than
125,000 in Apptopia’s case). Hence, the quality of performance data is a function of the scope of the real data feed and the
proprietary prediction algorithms of Apptopia. We prefer to use downloads over active users because the latter involves
another layer of prediction.
That is, daily or monthly active users represent the number of the total installed user base who logged into the app over
the prior 24 hours or over the prior 30 days. On the other hand, how long a user sticks around after installing an app is
a desirable piece of information in the app market. Therefore, to get at active user figures, Apptopia has to predict the
retention rate for each install cohort, and then aggregate, which could sometimes lead to nontrivial prediction errors.
Downloads, in contrast, are one-time predictions for each day; further, as we explain later, they fit our demand framework
in a stationary environment better than active users.
In the data, Average Revenue Per User (ARPU) refers to the average cost-to-download (i.e., the price of the app, which is
zero for free-to-download apps) plus the average revenue per download from In-App Purchases (IAP). IAP revenue is
often associated with a business model where users pay nothing to download an app but are offered in-app purchases for
additional, premium or sometimes necessary features. Here, revenue is defined as any spend within the app that ‘flows
through’ the app store. Our understanding from Apptopia is that IAP typically includes purchases such as game tokens
or removing ads from an app, as well as premium subscription fees and all other payments processed within the Android
and iOS app stores on behalf of apps.
7T h e Va l u e o f T e c h n o l o g y R e l e a s e s i n t h e M o b i l e A p p E c o s y s t e m
We note that some apps steer subscribers to their own websites or use their own payment systems, in which case any
associated revenues would not be captured by Apptopia. Similarly, Apptopia does not have any visibility into e-commerce
apps like Amazon and Walmart. However, it remains unclear how e-commerce revenues are linked to consumer surplus
from apps (see Section 7). Since we estimate the consumer value from apps, rather than from, say, a broader standpoint,
we think that our analysis is meaningful and sheds light on how smaller publishers and businesses may generate value
through apps for consumers. Moreover, by utilizing ARPU (and thus IAP) as the effective price consumers pay, including
for free-to-download apps, our estimation of app demand is improved relative to those that do not account for in-app
purchases.
Finally, we construct another quarterly time-series data, for the same periods as above, of SDK releases aggregated across
the mobile platforms. To this, we add the time series of early-stage venture financing as well as high-tech employment
(NAICS 518). We note that venture investments are private-market transactions; hence, data on venture investments
may only capture some of the investment universe. Researchers often use proprietary data sources (such as Capital IQ,
PitchBook, or Refinitiv’s VentureXpert) when researching venture-capital markets; however, these data sources tend to
focus on major equity rounds (e.g., Series A, B, etc.), so investments in early-stage startups can be sparsely populated.
We use the Crunchbase database, which focuses more on early-stage startups, and aggregate pre-Series A investments
quarterly.
As for employment information, we use the employment statistics from the Bureau of Labor Statistics. We particularly
focus on NAISC code 518: “Industries in the Data Processing, Hosting, and Related Services subsector group
establishments that provide the infrastructure for hosting and/or data processing services” because the associated
occupations include software developers, computer systems analysts, computer support specialists, and computer
programmers. Both employment and venture financing represent some of the broader effects of SDK releases, going
beyond the effects on the Android and iOS app stores. Our restrictions to early-stage funding and employment under
NAICS code 518 are because they represent the areas where the effects of SDK releases would most plausibly show up.
8T h e Va l u e o f T e c h n o l o g y R e l e a s e s i n t h e M o b i l e A p p E c o s y s t e m
4. SDKS AND THE APP ECOSYSTEM
To reiterate, a Software Development Kit (SDK) is a comprehensive package of app development tools released by OS
providers as well as by third-party technology platforms. An SDK may include multiple Application Programming
Interfaces (APIs), which allow apps to interact with certain functions of and data from the SDK providers. (Individual
APIs, unlike SDKs, often have a more limited set of features, development environments, and flexibilities, and may be
more task-specific or meant to be used for functionalities that are unrelated to app development.)
By releasing SDKs, tech platforms benefit from apps connecting to and utilizing their platforms, which could in turn
result in a broadening of their user bases and/or direct monetary rewards from licensing fees. SDK licensing fees are
mostly privately negotiated, though some SDKs are free and open sourced. Thus, SDK prices are generally unavailable
to researchers. Some platforms post their licensing fees on their websites; however, most tech platforms do not advertise
SDK pricing publicly.
We observe some 1,300 SDKs ever adopted by iOS apps and 1,600 SDKs by Android apps in our respective sample universe
(see Figures A1 and A2 for the distribution of SDKs by function). While a large share of SDKs is dubbed development
platforms, there are also a variety of isolated functions. By adopting SDKs, developers can thus leverage the platforms’
services and data, which would lead to more (and perhaps better) apps that may otherwise not have existed or taken
much longer to develop.
This is because a typical app developer, such as an individual or a small startup, can develop an app but may not be
able to develop a competing platform to provide the same functionalities as the SDKs themselves. For instance, an app
developer may not aim to build a social network, map service, or payment system in order to build an app that uses them.
Therefore, many apps with such functionalities may be developed simply by adopting SDKs, though the extent of such
effects remains to be quantitatively assessed.
In this section, we examine this effect using a platform-level time-series data from 2009:Q1 to 2020:Q1. A time series
is a stochastic realization of a random variable indexed by time (in our case, for each quarter). We use the number of
smartphone sales, SDK releases, and new app entries to describe the app ecosystem at the outset. Unlike cross-sectional
analyses, time-series data are modelled based on the premise that these variables can be correlated with each other across
time as well as potentially contemporaneously.
Figure A3 depicts the graphs of the three time-series data for iOS, and Figure A4 does so for Android. We use the
following Structural Vector Autoregression (SVAR) model, where the three variables (smartphone sales, SDK releases,
and new app entries), as well as their lagged counterparts, form a system of equations. SVAR is one of the most widely-
used models in economics to make predictions at the aggregate level. In an SVAR model, the time-series variables are all
endogenous; thus, some ‘identifying restrictions’ need to be imposed by researchers, often guided by theories and real-
world observations. Our base model is as follows:
9T h e Va l u e o f T e c h n o l o g y R e l e a s e s i n t h e M o b i l e A p p E c o s y s t e m
where A0, A1, and B 0 are 3 by 3 matrices of parameters and the εt’s are so-called structural shocks. Those shocks are,
by assumption, uncorrelated and orthogonal, and have unit variance; that is, εεt~N(0, I) and E(εεtεs ) = 0 for all s ≠ t.
The matrix A0 determines the structure of the contemporaneous correlation among the three variables within a
quarter, in the sense that they may respond differently to a given shock εεt. The matrix B 0 is a diagonal matrix for
scaling purposes.
Note that we do not take the first difference of these time-series variables because the data are already quarterly, not
cumulative. Further, the series are expected to co-move (i.e., they are ‘co-integrated’) because they represent the rapid
development of the app ecosystem from its inception. We thus include once-lagged dependent variables as regressors to
prevent spurious regression problems. Following Sims (1980), we assume that A0 is a lower triangular matrix with ones
on the diagonal, which identifies the covariance matrix of the forecast errors based on Cholesky Decomposition.
The assumption that A is a lower triangular matrix translates to, and is based on, the following set of assumptions about
the app ecosystem: First, a shock to smartphone sales may affect the number of SDK releases as well as app entries within
the same quarter. Second, a shock to SDK releases may affect the number of app entries, but is unlikely to affect the number
of smartphone sales within the same quarter. Third, a shock to new app entries is unlikely to affect either the number of
smartphone sales or SDK releases within the same quarter. This structure is largely driven by the timing of plausible responses.
For instance, smartphone sales, often driven by newer designs, are a vital metric in the mobile ecosystem and may induce
other tech platforms to devote resources towards leveraging the broadened user base and data by releasing SDKs, which may
then induce further app development. Moreover, information about new smartphone sales is more readily available from
market research firms. Hence, tech platforms and app developers may respond to a positive shock by releasing more SDKs
and apps in the same quarter. Similarly, SDK releases are relatively quickly communicated to app developers via formal and
informal channels, whereby new app entries may respond to a positive shock to SDK releases within the same quarter.
On the other hand, the model places no restrictions on how a shock to a variable would affect the SVAR model system
in all subsequent periods; that is, a shock in a quarter can affect all three variables in the following period due to the
lagged dependent variables on the right-hand side. For instance, if there is a shock to new app entries (ε3,t = 1), then
the estimated matrices above would predict the ‘impulse response’ of all three variables to the shock in all subsequent
periods. In Figures 1 to 4, we present such ‘impulse response function’ graphs by mobile app store.
Fig 1. Percentage of new iOS apps released due to a one standard deviation change in iOS SDKs
10T h e Va l u e o f T e c h n o l o g y R e l e a s e s i n t h e M o b i l e A p p E c o s y s t e m
Fig 2. Percentage of new iPhone adoption due to a one standard deviation change in iPhone apps
Fig 3. Percentage of new Android apps released due to a one standard deviation change in Android SDKs
Fig 4. Percentage of new Android phone adoption due to a one standard deviation change in Android apps
11T h e Va l u e o f T e c h n o l o g y R e l e a s e s i n t h e M o b i l e A p p E c o s y s t e m
Specifically, Figure 1 tells us that if there is a one-time shock of a 45% rise in the number of quarterly SDK releases, then
there is a 38% increase in the number of apps available on iOS over the next two years. However, if we were to include
the periods in which the impulse response is not statistically significant, the total response size becomes a 66% increase in
the number of iOS apps over the next seven years. Here, the statistical insignificance is likely due to the short time series,
but it may have some predictive value.
Next, Figure 2 indicates that a one-time shock of a 11% increase in the number of quarterly released iOS apps leads to a
58% increase in the number of iPhones sold over the next seven years, all of which are statistically significant.
One may wonder where the sizes of the initial shocks (45% and 11%) come from. The answer is that they are the standard
deviations of the respective shocks measured by B0. Because each variables would have different scale and variation,
using a one standard deviation shock for impulse response normalizes the shock size to an equal amount of ‘surprise’
across variables. In practical terms, one can envision such a shock to SDKs as being driven by significant technology
(SDK) releases – for instance, as part of major, coordinated platform- and ecosystem-wide releases of new hardware and
software.
Analogously, for the Android platform, Figure 3 indicates that a one-time shock of a 61% increase in the number of
quarterly SDK releases leads to a 128% increase in the number of Android apps over roughly the next four years. Including
the periods in which impulse response is not statistically significant, this figure increases to 213% over the next seven years.
As to Android apps, Figure 4 indicates that a one-time shock of a 19% rise in the number of quarterly released Android
apps leads to a 43% increase in the number of Android smartphone sales over the next two years. Including the periods
in which impulse response is not statistically significant, this figure rises to 68%.
A surprising implication to the above is the asymmetric response (length as well as magnitude) between the two mobile
ecosystems. (Readers are reminded that all three time-series variables have separately measured the respective parameters
available for each mobile platform.) One potential explanation is that the iOS platform is more of a closed ecosystem, so
the impact of third-party SDKs may be relatively lower. In contrast, Android has taken a more open approach to developer
contributions, so there may be more incentives to leverage SDKs. On the other hand, iOS apps have a relatively larger
impact on smartphone sales than Android apps, potentially due to the arguably stricter quality control for iOS apps.
12T h e Va l u e o f T e c h n o l o g y R e l e a s e s i n t h e M o b i l e A p p E c o s y s t e m
5. CONSUMER SURPLUS FROM APPS
Evaluating the economic value to consumers (‘consumer surplus’) of mobile apps using observational (real-world) data is
econometrically a challenging problem. To do so, we follow the classical approach for estimating a demand function for apps.
Specifically, we estimate a static app demand function and the associated consumer surplus on a single day, June 1st, 2020.
This is because our primary aim is to assess the consumer surplus in the current app market, and also because app prices
are slow to change over time, making the data essentially cross-sectional. Further, our time-series plots (Figures A3 and
A4) indicate that, in recent years, smartphone markets have reached a phase in which numerous valuable smartphone
features have been released, and technology providers need to work harder to research and develop new features in order
to convince consumers, who are largely existing smartphone users, to upgrade to newer device models (though, notably,
some providers may update their SDKs to include new improvements, rather than release them as new, separate SDKs).
Hence, although our methodology can be re-applied to any other day, our calculations would not change drastically.
An app demand function is a decreasing function of the price associated with using the app. In general, app ‘demand’ and
‘price’ are not clearly defined concepts, especially in a dynamic setting. One advantage of using a static demand model
is that, as long as the environment is stationary, the quantity demanded of an app can be measured by the number of
downloads on that day. This is because in classical demand theory, what matters is a consumer’s purchase taking place,
rather than when the purchased goods and services are actually consumed or used. In our setting, consumers download
apps on each day, to then use them over whichever timeframe. Hence, our quantity measure is the number of downloads.
In an app market, the price consumers pay is most plausibly defined as the sum of the price-to-download and the expected
in-app purchase (IAP) dollars, which we refer to as the ‘price’ of an app. IAP data is hard to come by; fortunately, Apptopia
estimates the IAP dollar per download and user for all active apps, based on daily real-time data feed from more than
125,000 apps. Here, IAP may include some e-commerce revenues that flow through the app stores, but mostly comprise
in-app transactions to unlock additional features and premium services.
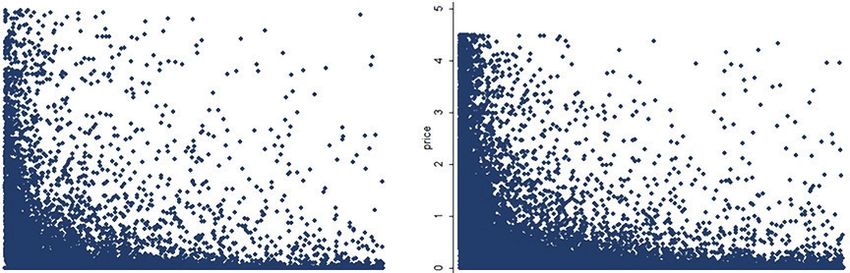
Figures A5 and A6 depict scatter plots of app downloads and the aforementioned prices for all active iOS and Android
apps, respectively, that had non-zero downloads on June 1st, 2020, for the United State (US) as well as worldwide (WW,
which includes the US). In order to give a closer look and a better sense of the nonlinear relationship between the two
variables, the top 1% of downloads and prices are not shown in these graphs; however, we do not exclude any of the top
app observations from our demand function estimation that follows. Our goal is to estimate the following form of demand
functions for a representative app in the game and the non-game categories, separately:
ln Price = ln b - a ln Downloads + ε,
where a and b are the parameters to be estimated. The functional form is deliberately kept simple, in order to calculate
consumer surplus (below the demand and above the price) in a clear manner. One concern in estimating the demand
function is that the price and downloads may be both driven by some omitted variables (e.g., unobserved app quality).
Specifically, a high-quality app might set a higher price and, at the same time, tend to have a higher number of daily
downloads, making the price and the downloads positively, not negatively, correlated; however, the scatter plots suggest
that, on average, there is a clear inverse relationship between price and downloads.
13T h e Va l u e o f T e c h n o l o g y R e l e a s e s i n t h e M o b i l e A p p E c o s y s t e m
Our method for addressing this concern is to estimate an inverse demand function by using an Instrumental Variable
(IV) approach, where the instrument for downloads is the number of app ratings. That is, our identification assumption
is that the number of ratings (as opposed to the ratings themselves) is uncorrelated with the error term in the inverse
demand function equation above. This is plausible because it is hard to imagine that apps will change their download
price or in-app purchase prices based on a common factor that also influences the number of app ratings. For instance,
users may want to post positive reviews about apps being of high quality, but may also be induced to post negative reviews
about apps being of low quality, so the number of reviews (disregarding the content of the reviews and their star ratings)
should not affect the prices that app publishers set.
On the other hand, the number of app downloads and the number of consumers who provided a rating for the app are
naturally positively correlated. Therefore, if our instrument is valid, then the estimated demand parameters, and ,
will not suffer a significant bias. This procedure is applied using the apps belonging to non-game categories, and game
categories, separately. (There are, in total, 37 iOS app categories and 49 Android app categories, as designated by the iOS
and Android platforms.) Hence, we estimate two different demand functions, one for non-game and one for game apps,
with four in total across the two platforms.
Given the estimates of and , the demand function can be rewritten as , which is drawn as the
downward-sloping curve in Figure A7. We then estimate the consumer surplus of each app given the demand curve. In
economics, consumer surplus is calculated as the sum of the difference between each consumer’s maximum willingness
to pay and the consumer’s actual payment for the goods and services. The standard interpretation is that the consumers
can be sorted according to their willingness to pay in a descending order, until the marginal consumer whose willingness
to pay is equal to the price he or she pays. The difference between a consumer’s willingness to pay and the actual price
they pay is their individual consumer surplus, representing funds the consumer can then go on to spend on other goods.
Aggregating this individual consumer surplus across consumers for a particular demand function provides the total
consumer surplus derived from a product over some period of time.
In the context of apps, some app developers and publishers choose to adopt advertising or other types of monetization
methods, which may keep the app’s download price as well as its in-app fees closer to zero. Others may entirely rely on
upfront download costs and/or in-app purchases, while yet others use a combination of both. This creates variation in
the level of price we use (i.e., Average Revenue Per User) for the same level of downloads. Here, our assumption is that the
same shape of the estimated demand curve applies to all active apps. The only difference is that the demand curve shifts
up or down depending on the level of ARPU.
The regression analysis already captures the distribution of ARPUs given different levels of downloads, and the central
relationship between the two is summarized by the resultant parameter estimates. Hence, if an app has downloads
(as in Figure A7) on a day, then consumers’ willingness to pay can be captured by the shaded area. We assume that this
is independent of the producer surplus, which would vary with the actual price (ARPU) even with the same level of
downloads. Our primary assumption here is that the estimated demand curve adequately represents the underlying
distribution of consumers’ net willingness to pay.
Hence, given downloads for an arbitrary app on a day and a pair of and estimates (accounting for whether the app is
a game app or not), the consumer surplus for that app can be approximated with the formula: .
We then aggregate the consumer surplus by the category to which each app belongs and tabulate them in Tables 1 and 2.
14T h e Va l u e o f T e c h n o l o g y R e l e a s e s i n t h e M o b i l e A p p E c o s y s t e m
Therefore, the variation in aggregate consumer surplus across categories is driven by (i) the number of downloads for
each app in the sample, (ii) whether the app is a game or not, and (iii) the number of apps in each category across the
two mobile platforms.
Table 1. Consumer Surplus on June 1st, 2020, by App Category (iOS apps)
Category CS (US) CS (5EU) CS (WW)
Business 132,665 302,009 1,311,137
Weather 51,192 130,162 359,121
Utilities 172,069 430,234 1,860,833
Travel 135,321 369,973 1,535,318
Sports 93,347 293,977 1,164,949
Social Networking 182,417 291,457 1,231,365
Reference 43,170 165,807 672,597
Productivity 141,057 366,748 1,176,792
Photo & Video 220,396 490,492 1,466,747
News 50,308 96,182 647,012
Navigation 40,692 195,886 633,094
Music 147,579 387,306 1,076,303
Lifestyle 154,528 371,892 1,768,633
Health & Fitness 154,655 393,591 1,262,044
Finance 129,170 252,304 1,764,939
Entertainment 229,383 443,809 1,764,647
Education 123,456 334,262 1,557,637
Book 48,603 122,882 746,720
Medical 46,188 124,707 614,126
Food & Drink 107,553 177,212 1,041,721
Shopping 204,261 331,412 1,683,804
Action 116,403 182,855 347,103
Adventure 63,783 123,718 226,232
Casual 150,285 209,870 357,257
Board 43,851 79,567 142,102
Card 40,876 58,148 150,302
Casino 32,682 40,846 96,195
Family 55,802 118,599 203,869
Music 18,183 27,434 64,894
Puzzle 105,037 175,786 341,856
Racing 37,546 75,572 107,201
15T h e Va l u e o f T e c h n o l o g y R e l e a s e s i n t h e M o b i l e A p p E c o s y s t e m
Category CS (US) CS (5EU) CS (WW)
Role Playing 60,886 113,124 246,615
Simulation 127,505 212,032 329,800
Sports 50,374 96,349 138,678
Strategy 54,396 106,229 201,226
Trivia 31,098 55,266 262,247
Word 36,516 55,441 107,488
*Unmatched 17,590 16,516 74,772
SUM TOTAL $3,650,822 $7,819,655 $28,737,376
No. of Apps 85,224 176,270 523,920
Note: All figures are in US dollars, except for the number of apps. 5EU means the sum of five European countries (France;
Germany; Italy; Spain; United Kingdom). The upper panel is app categories, and the lower panel is game subcategories.
*Unmatched means that an app id in the daily app performance data cannot be found in the app profile database.
Table 2. Consumer Surplus on June 1st, 2020, by App Category (Android apps)
Category CS (US) CS (5EU) CS (WW)
Books & Reference 51,909 28,127 711,650
Business 57,541 43,654 787,484
Comics 14,230 29,206 191,948
Communication 122,226 87,242 826,367
Education 69,399 60,146 964,387
Entertainment 225,891 160,897 1,746,227
Finance 109,448 65,715 1,226,024
Health & Fitness 97,493 86,240 704,958
Libraries & Demo 195 21,594 161,766
Lifestyle 104,553 71,374 1,004,600
Medical 118,161 14,590 561,032
Music & Audio 143,188 92,992 1,175,690
News & Magazines 64,150 28,185 537,012
Personalization 78,003 43,320 655,925
Photography 122,163 89,951 868,467
Productivity 119,576 93,256 857,472
Shopping 119,570 85,947 1,260,998
Social 121,261 72,352 767,081
Tools 75,546 93,436 792,874
Travel & Local 71,067 70,464 651,094
Weather 32,711 33,941 165,887
Sports 56,268 75,986 536,539
16T h e Va l u e o f T e c h n o l o g y R e l e a s e s i n t h e M o b i l e A p p E c o s y s t e m
Category CS (US) CS (5EU) CS (WW)
Maps & Navigation 60,474 35,292 474,787
Food & Drink 54,240 33,037 706,637
House & Home 26,865 12,568 315,226
Video Players & Editors 53,541 59,186 495,870
Parenting 3,549 4,727 116,927
Dating 13,256 20,004 186,370
Auto & Vehicles 20,387 26,261 356,354
Art & Design 35,934 18,994 257,704
Beauty 13,477 13,107 172,884
Events 7,457 8,981 203,044
Casual 48,867 62,973 496,087
Racing 31,312 36,116 329,037
Sports 15,852 38,968 196,178
Card 14,901 13,165 119,481
Arcade 70,221 76,181 476,528
Puzzle 40,158 52,075 349,679
Casino 13,107 11,362 136,699
Word 17,425 19,092 124,124
Adventure 20,171 26,154 244,640
Action 49,583 56,237 497,765
Trivia 16,348 16,207 127,394
Board 10,663 15,584 146,187
Simulation 50,881 67,236 550,951
Music 9,865 11,946 100,455
Educational 18,898 29,058 218,337
Strategy 19,569 23,312 148,275
Role Playing 20,883 25,547 210,871
*Unmatched 1,121,550 856,203 8,496,754
SUM TOTAL $3,853,982 $3,118,189 $33,410,727
No. of Apps 241,337 216,783 829,746
Note: All figures are in US dollars, except for the number of apps. 5EU refers to the sum of the five European countries
(France, Germany, Italy, Spain, and the United Kingdom). The upper panel is app categories, and the lower panel is game
subcategories. *Unmatched means that an app id in the daily performance data cannot be found in the app profile database.
17T h e Va l u e o f T e c h n o l o g y R e l e a s e s i n t h e M o b i l e A p p E c o s y s t e m
Note that the last category in Tables 1 and 2 collects all apps that are not matched with the category (app profile) data; a
sizable fraction of Android apps falls in this category. This is because in our sample Android app IDs are a string of words
that look like file names (e.g., pokemon.pikachu.adventure.battle.royale), whereas iOS app IDs are simply numeric. Thus,
the matching rate for Android apps with categories is not as high as for iOS apps due to typos and ID variations. Finally,
the bottom line of the tables sums up aggregate consumer surplus across categories, followed by the number of all active
apps in our sample (comprising primarily ranked apps) used for our calculation.
In the first column of each table, we find that the aggregate consumer surplus generated from all active apps in our
sample in the iOS app categories on a given recent day (June 1w, 2020) amounts to 3.65 million dollars; and the aggregate
consumer surplus from all active apps in our sample in the Android app categories on the same day is about 3.85 million
dollars. These figures are all based on US users only. We then repeat our estimation procedure, as well as the consumer
surplus calculations, for users located in France, Germany, Italy, Spain, and the United Kingdom – we focus on these
five countries because our dataset comprises large enough samples for these European nations. We then aggregate the
consumer surplus across those five countries, and present them in the middle columns of the respective tables.
All five European countries have individually smaller aggregate consumer surplus generated from either iOS or Android
apps than the US, and the aggregate consumer surplus generated from Germany or the United Kingdom is larger than that
from the other three European countries. When combined, the five European countries appear to generate an aggregate
consumer surplus of 7.82 million dollars on June 1st, 2020, from all active iOS apps, and 3.12 million dollars on the same
day from all active Android apps. Hence, the data imply that users in the five European countries either spend relatively
more or have different demand curves for iOS apps.
In the last column, we repeat our procedure using the worldwide app statistics provided by Apptopia. It is perhaps
unsurprising that worldwide consumer surplus is much larger than the previous two figures. Specifically, the aggregate
consumer surplus worldwide from all active iOS apps in our sample is around 28.7 million dollars; and that from all
active Android apps in our sample is about 33.4 million dollars. Although there are more apps available for Android than
for iOS, their respective total consumer surplus is about the same because Android devices are generally more popular in
lower-income demographics, and the apps consumers utilize on Android tend to be lower priced.
In fact, comparing the magnitude of the estimates across the two mobile platforms, we find that tends to be higher
(implying a higher willingness to pay) for iOS apps than for Android apps, although their relative sizes vary by country
and whether the apps are game or non-game apps. This is consistent with the well-known observation among developer
communities that iOS users tend to be more affluent and spend more per app than Android users (BuildFire, 2020). In
contrast, more users use the Android platform. As a result, at the worldwide level, the two mobile platforms yield a similar
level of total consumer surplus.
Assuming a stationary app market over a period of 365 days, we can then extrapolate annual aggregate consumer surplus
by multiplying the above figures by 365. Although this is a back-of-the-envelope calculation, it is appealing because while
the identity of the apps comprising the data may change over time, the distribution of their downloads and prices may
remain relatively stable. If so, then the annual consumer surplus from active iOS apps in our sample is estimated to be
1.33 billion dollars in the US, 2.85 billion dollars in the 5EU, and 10.5 billion dollars worldwide; and the corresponding
figures for active Android apps in our sample is about 1.41 billion dollars in the US, 1.14 billion dollars in the 5EU, and
12.2 billion dollars worldwide.
18T h e Va l u e o f T e c h n o l o g y R e l e a s e s i n t h e M o b i l e A p p E c o s y s t e m
Tables A1 and A2 list the top 30 apps by platform and by geography in terms of estimated consumer surplus (as of June
1st, 2020). Readers are reminded that consumer surplus at the app level is determined by the number of downloads and
whether the app is a game app or not. One caveat is that Chinses apps are populated in Table A1 (iOS) for worldwide
users, but they are missing in Table A2 (Android). As previously mentioned, in China, people use different (native)
Android app stores rather than Google Play (which is what our Apptopia sample comprises). Hence, our calculations may
underestimate the worldwide consumer surplus from Android apps.
19T h e Va l u e o f T e c h n o l o g y R e l e a s e s i n t h e M o b i l e A p p E c o s y s t e m
6. SDK AND THE TECHNOLOGY SECTOR
The broader impact of technology (SDK) releases is that they could stimulate investment in new ideas and in new firms,
and help grow employment in sectors of the economy that depend on the functionalities they help facilitate. While
it is not tractable for us to match the apps in our sample to either specific venture funding or the number of jobs at
specific ventures, the effects of technology releases may show up in aggregate national time-series data. Accordingly, our
approach to assess the potential association between technology releases and their broader effects is to use the same sort
of Structural Vector Autoregression (SVAR) model from Section 4 and incorporate additional variables.
More specifically, it is impractical to match specific ventures raising financing with the millions of apps that are released
by different firms and developers. Many apps in our sample are mostly linked to the names of individuals (such as
developers), rather than the names of specific firms or ventures. Hence, without being able to match individuals to their
employers (domestic and foreign) for millions of apps, we cannot, with a reasonable matching rate, tell which startups
released apps and which did not.
Similarly, it is also impractical to distinguish the share of venture capital invested and total workforce employed that are
specifically associated with developing iOS or Android apps, even in the aggregate, since it would presume the knowledge
of a large number of private firms’ internal operations. Thus, what we have is the national aggregate statistics for each
quarter that represent the total level of ‘early-stage’ venture financing, as well as the total employment size in a relevant
high-tech sector (NAICS code 518: Data Processing, Hosting, and Related Services). While NAICS code 518 represents
one technology sector, its relatively narrow focus enables us to illustrate the potential link between major technology
releases and related employment
Specifically, we aim to aggregate the total amount of early-stage venture financing in our sample; however, this is nontrivial
because a large share of apps is released by small, private startups (or by individuals). One database that perhaps most
closely tracks such early-stage financing is Crunchbase, which in part crowdsources investment information, an aspect
that can be particularly helpful with respect to startups in their earlier stages, when some funding may come from
informal sources such as friends and family.
Using the data on funding rounds that Crunchbase offers, we tally up venture investments based on their investment
stages. Below, we present the result involving investment rounds designated as ‘pre-seed’, ‘seed’, or ‘angel’ in the
Crunchbase database. This is because major venture capital funding rounds (i.e., Series A and later rounds) are mostly
raised after startups have released their products or prototypes and gained some traction. Thus, the financing rounds that
are most likely to affect the mobile app ecosystem are the aforementioned early-stage rounds. Confirming this conjecture,
our empirics do not yield a significant relationship with later financing rounds to the time series representing the app
ecosystem.
We adjust the SVAR model specification as follows: The three variables that we use here are the log of SDK releases (same
as before), the log of early-stage financing, and the log of employment in NAICS code 518, in that order. This implies that
a shock to SDK releases may affect early-stage financing and employment within the same quarter, and a shock to venture
funding may affect employment within the same quarter (the converse, however, is unlikely to hold, since SDK releases,
within a quarter, are often tied to hardware and software innovations, rather than to funding events or an unexpected rise
in employment in the same period).
20T h e Va l u e o f T e c h n o l o g y R e l e a s e s i n t h e M o b i l e A p p E c o s y s t e m
Figure 5 depicts the impulse response of early-stage investments to a one-time 35% (a standard deviation) increase in
the number of SDK releases (in the overall sample, combining iOS and Android SDKs) in a quarter. We find that early-
stage investments increase by almost 200% over the next three years, and this figure climbs up to 268% over seven years
if we count the periods in which the response is not statistically significant. These results suggest that technology (SDK)
releases may play an important role in the aggregate funding of early-stage ventures.
In addition, Figure 6 depicts the impulse response of tech sector (NAICS code 518) employment to the same one-time
shock to SDK releases. Here, we find that employment increases by 33% over the next six years. Although employment
under NAICS code 518 spans a large range of workers, of which developers, and particularly app developers, may be a
relatively small fraction, this finding nonetheless implies that technology (SDK) releases may have a nontrivial effect on
creating jobs in the sector.
Fig 5. Percentage rise in early-stage funding due to a one standard deviation change in SDK releases
21T h e Va l u e o f T e c h n o l o g y R e l e a s e s i n t h e M o b i l e A p p E c o s y s t e m
Fig 6. Percentage rise in tech-related employment (NAICS 518) due to a one standard deviation change in SDK releases
22T h e Va l u e o f T e c h n o l o g y R e l e a s e s i n t h e M o b i l e A p p E c o s y s t e m
7 . R E L AT E D S T U D I E S
There has been a growing interest in mobile platform markets in the literature. Bresnahan et al. (2015) assert that while
mobile platforms lowered the costs of developing and distributing apps, the search and matching processes between
consumers and the wide variety of apps may result in some inefficiencies. In particular, they argue that app rankings
may fail to fully reflect the value created by an app. Similar to their study, we focus on examining the supply side of the
app market, with a primary difference being that our focus is on technology releases that may provide various utility
components to app developers via SDKs. To our knowledge, this report is the first to investigate the time-series data of
the number of smartphone sales, SDK releases, and new app entries simultaneously.
At the same time, our analysis of app demand and consumer surplus builds on their examination of the joint distribution
of app prices and monthly active users. While Bresnahan et al. are concerned with app download statistics being potentially
bought or manipulated, the number of downloads in a given period is a more conservative measure than the number of
active users (which reflects cumulative downloads), as previously mentioned, because the latter may include the former.
Hence, we choose to estimate app demand as well as consumer surplus based on the cross-section of app downloads.
Liu (2017) examines app developers’ entry decisions, in particular, selecting the mobile platform for which to develop
apps. Using the average utility that users experience as a proxy for app quality, Liu finds that in the Google Play store,
the presence of lower-quality apps induces more lower-quality apps to enter, while Apple’s App Store exhibits strong
competitive effects among higher-quality apps. An increase in the smartphone user base could also encourage lower-
quality apps to enter. Ershov (2018) examines the effect of superstar apps on app entry, from the standpoint of product
market competition. Using the emergence of superstar apps as unexpected events, Ershov finds that the app categories
where superstar apps appear experience more entry in subsequent periods by other apps. The new app entries tend to be
of lower quality and have lower prices, but the superstar apps appear to increase the downloads of all apps in the same
category.
Our approach, as well as the main question regarding new app entry, is different from Liu (2007) and Ershov (2018),
who focus on product market competition. In contrast, we examine the effect of SDKs, which are made available to
app developers by tech platforms, on app entry. From the standpoint of technology providers, app developers are not
necessarily competitors but customers who build on their platforms by incorporating their offerings into new products.
In addition, our approach takes a more macro standpoint by focusing on the relationship among aggregate smartphone
sales, SDKs, and app entries over a longer period of time. While the product market effect is important at the micro
level, taking a macro perspective is helpful for understanding the broader trends of the mobile ecosystem. Thus, our
contribution is different in that we aim to identify the aggregate effect of technology releases.
The value of mobile apps has been explored in the literature. For instance, Brynjolfsson et al. (2019) take an experimental
approach. Using consumer choice surveys, they elicit the survey respondent’s willingness to pay to stop using platforms
such as Facebook and YouTube. However, they focus on access to the technology platforms themselves rather than to
the broader app market that the platforms may facilitate. Moreover, their approach is focused on business-to-consumer
cases. Our approach, in contrast, is more indirect. There are over a thousand SDKs for each mobile market and many
of them are not facing end users such as consumers. That is, consumers do not necessarily know that the apps that they
are using embed tools released by certain technology platforms. This makes it difficult to directly assess how much value
23You can also read