NAS-BENCH-301 AND THE CASE FOR SURROGATE BENCHMARKS FOR NEURAL ARCHITECTURE SEARCH
←
→
Page content transcription
If your browser does not render page correctly, please read the page content below
Under review as a conference paper at ICLR 2021

NAS-B ENCH -301 AND THE C ASE FOR S URROGATE
B ENCHMARKS FOR N EURAL A RCHITECTURE S EARCH
 Anonymous authors
 Paper under double-blind review

                                            A BSTRACT

         The most significant barrier to the advancement of Neural Architecture Search
         (NAS) is its demand for large computational resources, which hinders scientifi-
         cally sound empirical evaluations. As a remedy, several tabular NAS benchmarks
         were proposed to simulate runs of NAS methods in seconds. However, all exist-
         ing tabular NAS benchmarks are limited to extremely small architectural spaces
         since they rely on exhaustive evaluations of the space. This leads to unrealistic
         results that do not transfer to larger search spaces. To overcome this fundamen-
         tal limitation, we propose NAS-Bench-301, the first surrogate NAS benchmark,
         using a search space containing 1018 architectures, many orders of magnitude
         larger than any previous tabular NAS benchmark. After motivating the benefits
         of a surrogate benchmark over a tabular one, we fit various regression models on
         our dataset, which consists of ∼60k architecture evaluations, and build surrogates
         via deep ensembles to also model uncertainty. We benchmark a wide range of
         NAS algorithms using NAS-Bench-301 and obtain comparable results to the true
         benchmark at a fraction of the real cost. Finally, we show how NAS-Bench-301
         can be used to generate new scientific insights.

1   I NTRODUCTION
Neural Architecture Search (NAS) promises to advance representation learning by automatically
finding architectures that facilitate the learning of strong representations for a given dataset. NAS
has already achieved state-of-the-art performance on many tasks (Real et al., 2019; Liu et al., 2019a;
Saikia et al., 2019; Elsken et al., 2020) and to create resource-aware architectures (Tan et al., 2018;
Elsken et al., 2019a; Cai et al., 2020). For a review, we refer to Elsken et al. (2019b).
Despite many advancements in terms of both efficiency and performance, empirical evaluations
in NAS are still problematic. Different NAS papers often use different training pipelines, differ-
ent search spaces and different hyperparameters, do not evaluate other methods under comparable
settings, and cannot afford enough runs for testing significance. This practice impedes assertions
about the statistical significance of the reported results, recently brought into focus by several au-
thors (Yang et al., 2019; Lindauer & Hutter, 2019; Shu et al., 2020; Yu et al., 2020).
To circumvent these issues and enable scientifically sound evaluations in NAS, several tabular
benchmarks (Ying et al., 2019; Zela et al., 2020b; Dong & Yang, 2020; Klyuchnikov et al., 2020)
have been proposed recently (see also Appendix A.1 for more details). However, all these bench-
marks rely on an exhaustive evaluation of all architectures in a search space, which limits them to
unrealistically small search spaces (so far containing only between 6k and 423k architectures). This
is a far shot from standard spaces used in the NAS literature, which contain more than 1018 archi-
tectures (Zoph & Le, 2017; Liu et al., 2019b). This discrepancy can cause results gained on existing
tabular NAS benchmarks to not generalize to realistic search spaces; e.g., promising anytime results
of local search on existing tabular NAS benchmarks were shown to not transfer to realistic search
spaces (White et al., 2020b). To address these problems, we make the following contributions:

1. We present NAS-Bench-301, a surrogate NAS benchmark that is first to cover a realistically-sized
   search space (namely the cell-based search space of DARTS (Liu et al., 2019b)), containing
   more than 1018 possible architectures. This is made possible by estimating their performance via
   a surrogate model, removing the constraint to exhaustively evaluate the entire search space.

                                                  1
Under review as a conference paper at ICLR 2021

2. We empirically demonstrate that a surrogate fitted on a subset of architectures can in fact model
   the true performance of architectures better than a tabular benchmark (Section 2).
3. We analyze and release the NAS-Bench-301 training dataset consisting of ∼60k fully trained and
   evaluated architectures, which will also be publicly available in the Open Graph Benchmark (Hu
   et al., 2020) (Section 3).
4. Using this dataset, we thoroughly evaluate a variety of regression models as surrogate candidates,
   showing that strong generalization performance is possible even in large spaces (Section 4).
5. We utilize NAS-Bench-301 as a benchmark for running various NAS optimizers and show that
   the resulting search trajectories closely resemble the ground truth trajectories. This enables sound
   simulations of thousands of GPU hours in a few seconds on a single CPU machine (Section 5).
6. We demonstrate that NAS-Bench-301 can help in generating new scientific insights by studying
   a previous hypothesis on the performance of local search in the DARTS search space (Section 6).

To foster reproducibility, we open-source all our code and data in a public repo: https://
anonymous.4open.science/r/3f99ef91-c472-4394-b666-5d464e099aca/

2       M OTIVATION – C AN WE DO B ETTER T HAN A TABULAR B ENCHMARK ?
We start by motivating the use of surrogate benchmarks by exposing an issue of tabular benchmarks
that has largely gone unnoticed. Tabular benchmarks are built around a costly, exhaustive evaluation
of all possible architectures in a search space, and when an architecture’s performance is queried, the
tabular benchmark simply returns the respective table entry. The issue with this process is that the
stochasticity of mini-batch training is also reflected in the performance of an architecture i, hence
making it a random variable Yi . Therefore, the table only contains results of a few draws yi ∼ Yi
(existing NAS benchmarks feature up to 3 runs per architecture). Given the variance in these evalu-
ations, a tabular benchmark acts as a simple estimator that assumes independent random variables,
and thus estimates the performance of an architecture based only on previous evaluations of the
same architecture. From a machine learning perspective, knowing that similar architectures tend to
yield similar performance, and that the variance of individual evaluations can be high (both shown
to be the case by Ying et al. (2019)), it is natural to assume that better estimators may exist. In the
remainder of this section, we empirically verify this hypothesis and show that surrogate benchmarks
can provide better performance estimates than tabular benchmarks based on less data.

Setup We choose NAS-Bench-101 (Ying et al., 2019) as a tab-                    Model    Mean Absolute Error (MAE)
ular benchmark for our analysis and a Graph Isomorphism Net-                           1, [2, 3]   2, [1, 3]      3, [1, 2]
work (GIN, Xu et al. (2019a)) as our surrogate model.1 Each ar-
                                                                               Tab.    4.534e-3    4.546e-3       4.539e-3
chitecture xi in NAS-Bench-101 contains 3 validation accuracies                Surr.   3.446e-3    3.455e-3       3.441e-3
yi1 , yi2 , yi3 from training xi with 3 different seeds. We excluded
all diverged models with less than 50% validation accuracy on        Table 1: MAE between perfor-
any of the three evaluations in NAS-Bench-101. We split this         mance predicted by a tab./surr.
dataset to train the GIN surrogate model on one of the seeds,        benchmark fitted with one seed
e.g., Dtrain = {(xi , yi1 )}i and evaluate on the other two, e.g.,   each, and the true performance
Dtest = {(xi , ȳi23 )}i , where ȳi23 = (yi2 + yi3 )/2.             of evaluations with the two other
We emphasize that training a surrogate to model a search space seeds. Test seeds in brackets.
is not a typical inductive regression task but rather a transductive
one. By definition of the search space, the set of possible architectures is known ahead of time
(although it may be very large), hence a surrogate model does not have to generalize to out-of-
distribution data if the training data covers the space well.

                                                                     |ŷ −ȳ 23 |
                                                                 P
Results We compute the mean absolute error MAE = i ni i of the surrogate model trained
on Dtrain = {(xi , yi1 )}i , where ŷi is predicted validation accuracy and n = |Dtest |. Table 1 shows
                                                                                                               |y 1 −ȳ 23 |
                                                                                            P
that the surrogate model yields a lower MAE than the tabular benchmark, i.e. MAE = i in i .
We also report the mean squared error and Kendall tau correlation coefficient in Table 6 in the
Appendix showing that the ranking between architectures is also predicted better by the surrogate.

    1
        We used a GIN implementation by Errica et al. (2020); see Appendix B for details on training the GIN.

                                                        2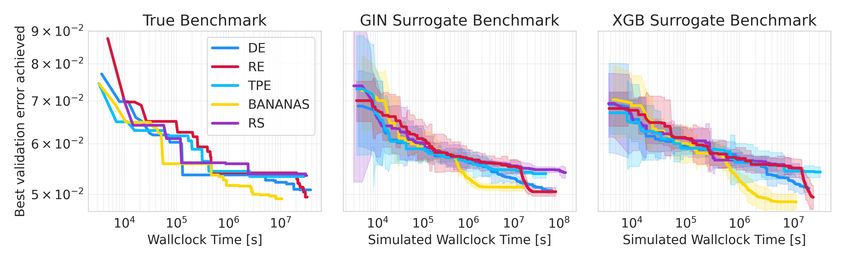
Under review as a conference paper at ICLR 2021
We repeat the experiment in a cross-validation fashion w.r.t to the seeds and conclude: In contrast
to a single tabular entry, the surrogate model learns to smooth out the noise.2
Next, we fit the GIN surrogate on subsets of Dtrain and
Surrogate
Mean Absolute Error
plot how its performance scales with the amount of train- Tabular
ing data used in Figure 1. The surrogate model performs
better than the tabular benchmark when the training set
has more than ∼21,500 architectures. Note that Dtest 10 2
remains the same as in the previous experiment, i.e., it
includes all architectures in NAS-Bench-101. As a re-
sult, we conclude that: A surrogate model can yield strong 101 102 103 104 105
predictive performance when only a subset of the search Number of architectures from NB-101
space is available as training data.
These empirical findings suggest that we can create reli- Figure 1: Number of architectures used
able surrogate benchmarks for much larger and more real- for training the GIN surrogate model vs
istic NAS spaces, which are infeasible to be exhaustively MAE on the NAS-Bench-101 dataset.
evaluated as done by tabular benchmarks. In the remainder of the paper, we focus on creating such
a benchmark.
3 T HE NAS-B ENCH -301 DATASET
We now describe the NAS-Bench-301 dataset which con- NAS methods # eval
sists of ∼60k architectures and their performances on
RS (Bergstra & Bengio, 2012) 23746
CIFAR-10 (Krizhevsky, 2009) sampled from the most
popular NAS cell search space: the one from DARTS (Liu DE (Awad et al., 2020) 7275
Evolution
RE (Real et al., 2019) 4639
et al., 2019b). We use this dataset not only to fit surro-
gate models but also to gain new insights, such as which TPE (Bergstra et al., 2011) 6741
BO BANANAS (White et al., 2019) 2243
regions of the architecture space are being explored by COMBO (Oh et al., 2019) 745
different NAS methods, or what the characteristics of ar-
DARTS (Liu et al., 2019b) 2053
chitectures are that work well. PC-DARTS (Xu et al., 2020) 1588
One-Shot
DrNAS (Chen et al., 2020) 947
3.1 DATA C OLLECTION GDAS (Dong & Yang, 2019) 234
Table 2: NAS methods used to cover the
Since the DARTS search space (detailed description in search space.
Appendix C.1) is far too large to be exhaustively evalu-
ated, care has to be taken when sampling the architectures which will be used to train the surrogate
models. Sampling should yield a good overall coverage of the architecture space while also provid-
ing a special focus on the well-performing regions that optimizers tend to exploit.
Our principal methodology is inspired by Eggensperger
et al. (2015), who collected unbiased data about hyperpa-
rameter spaces by random search, as well as biased and
dense samples in high-performance regions by running
hyperparameter optimizers. This is desirable for a surro-
gate benchmark since we are interested in evaluating NAS
methods that exploit such good regions of the space. Ta-
ble 2 lists the NAS methods we used to collect such sam-
ples and the respective number of samples. Additionally,
we evaluated ∼1k architectures in poorly-performing re-
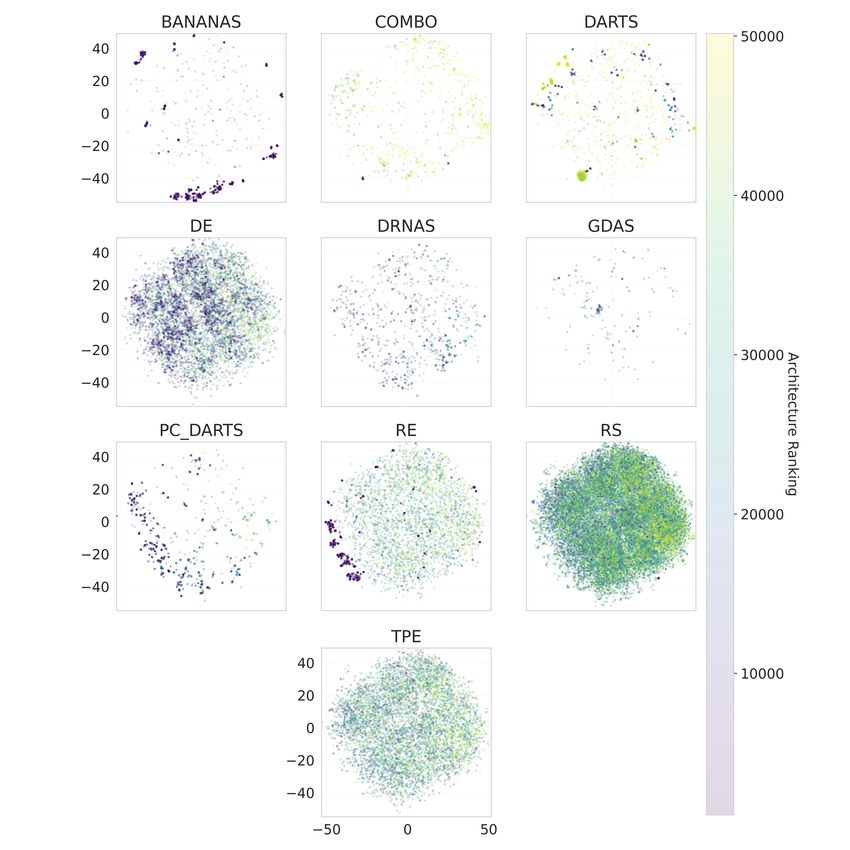
gions for better coverage and another ∼10k for the anal- Figure 2: t-SNE visualization of the
ysis conducted on the dataset and surrogates. We refer to sampled architectures.
Appendices C.2 and C.3 for details on the data collection
and the optimizers, respectively. We would like to point out that in hindsight adding training data of
well-performing regions may be less important for a surrogate NAS benchmark than for a surrogate
HPO benchmark, which we demonstrated in Appendix E.3. We argue that this is a result of HPO
2
√
We do note that the average estimation error of tabular benchmarks could be reduced by a factor of k by
performing k runs for each architecture. The error of a surrogate model would also shrink when the model is
based on more data, but as k grows large tabular benchmarks would become competitive with surrogate models.
3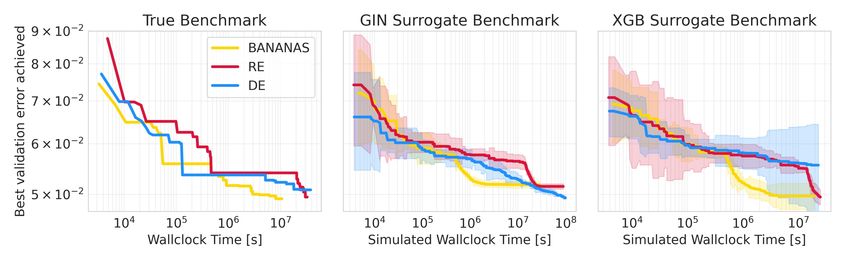
Under review as a conference paper at ICLR 2021

search spaces containing many configurations which yield disfunctional models, which is less com-
mon for architectures in many NAS search spaces, hence allowing random search to give us good
coverage of the space.
In Figure 2, we visualize the overall coverage of the search space as well as the similarity between
sampled architectures using t-SNE (van der Maaten & Hinton, 2008). Besides showing a good over-
all coverage, some well-performing architectures in the search space form distinct clusters which
are mostly located outside the main cloud of points. This clearly indicates that architectures with
similar performance are close to each other in the architecture space. Additionally, we observe that
different optimizers sample different types of architectures, see Figure 9 in the Appendix.

3.2       P ERFORMANCE STATISTICS

Figure 3 shows the validation error on CIFAR-10 (Krizhevsky, 2009) of all sampled architectures
in relation to the model parameters and training runtime. Generally, as expected, models with more
parameters are more costly to train but achieve lower validation errors. We also find that different
NAS methods yield quite different performance distributions (see Appendix C.4 for their individual
performances). Validation and test errors are highly correlated with a Kendall tau rank correlation
of τ = 0.852 (Spearman rank corr. 0.969), minimizing the risk of overfitting on the validation error.
Furthermore, we find that cells of all depths can reach a good performance, but shallow topolo-
gies are slightly favored in our setting (see Figure 10 in the Appendix). Also, a small number of
parameter-free operations (e.g., skip connections) can benefit the performance but featuring many
of these significantly deteriorates performance. For the full analysis, see Appendix C.5.
Following standard practice in modern NAS papers (e.g., Liu et al. (2019b)), we employ various
data augmentation techniques during training for more reliable estimates of an architecture’s perfor-
mance. For a description of our full training pipeline, please see Appendix C.6.

3.3       N OISE IN A RCHITECTURE E VALUATIONS

As discussed in Section 2, the noise in architecture
evaluations can be large enough for surrogate mod-
els to yield more realistic estimates of architecture
performance than a tabular benchmark based on a
single evaluation per architecture. To study the mag-
nitude of this noise on NAS-Bench-301, we evalu-
ated 500 architectures randomly sampled from our
Differential Evolution (DE) (Awad et al., 2020) run
with 5 different seeds each.3 We find a mean stan-
dard deviation of 1.6e−3 for the final validation ac-
curacy which is slightly less than the noise observed
in NAS-Bench-101 (Ying et al., 2019); one possi-
ble reason for this could be a more robust training
pipeline. Figure 12 in the Appendix shows that,
while the noise tends to be lower for the best archi-        Figure 3: Number of parameters against val.
tectures, a correct ranking based on a single evalua-        error with model training time as colorbar.
tion is still difficult. Finally, we compare the MAE        when estimating the architecture performance
from only one sample to the results from Table 1.           Here, we also find a slightly lower MAE of
1.38e−3 than for NAS-Bench-101.

4       F ITTING S URROGATE M ODELS ON THE NAS-B ENCH -301 DATASET

We now focus on creating a surrogate model. To that end, we evaluated a wide range of regression
models on the NAS-Bench-301 dataset. In principle, any such model can give rise to a surrogate
NAS benchmark, but models that fit the true performance better yield surrogate NAS benchmarks
whose characteristics are more similar to the ones of the true benchmark. Therefore, we naturally
    3
        We chose DE because it both explored and exploited well, see Figure 9 in the Appendix.

                                                        4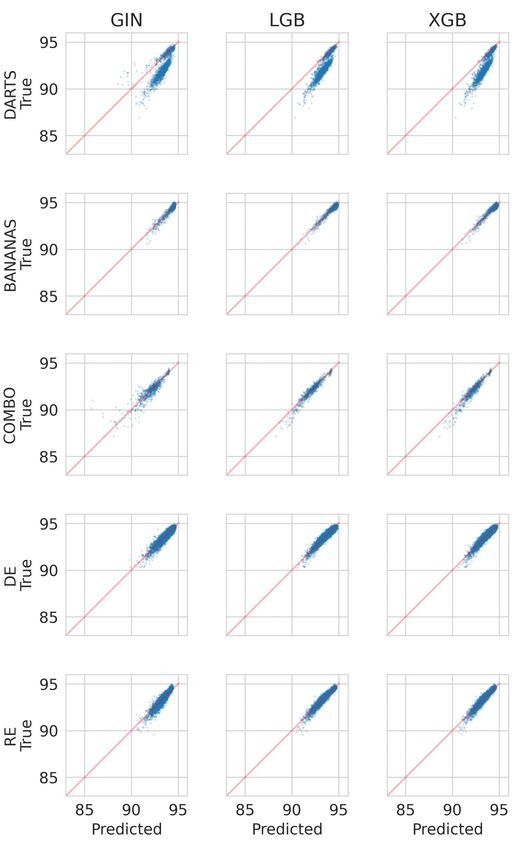
Under review as a conference paper at ICLR 2021

strive for the best-fitting model. We emphasize that in this work we do not attempt to introduce a
new regression model but rather build on the shoulders of the architecture performance prediction
community.

4.1   S URROGATE M ODEL C ANDIDATES

Deep Graph Convolutional Neural Networks are frequently used as NAS predictors (Friede et al.,
2019; Wen et al., 2019; Ning et al., 2020). In particular, we choose the GIN since several works have
found it to perform well on many benchmark datasets (Errica et al., 2020; Hu et al., 2020; Dwivedi
et al., 2020). We use the publicly available implementation from the Open Graph Benchmark (Hu
et al., 2020) and refer to Appendix D.2 for further details.
We compare the GIN to a variety of common regression models. We evaluate Random Forests (RF)
and Support Vector Regression (SVR) using implementations from scikit-learn (Pedregosa et al.,
2011). We also compare to the tree-based gradient boosting methods XGBoost (Chen & Guestrin,
2016). LGBoost (Ke et al., 2017) and NGBoost (Duan et al., 2020), recently used for predictor-
based NAS (Luo et al., 2020). We comprehensively review architecture performance prediction in
Appendix A.2.

4.2   E VALUATING THE DATA FIT

Similarly to Wen et al. (2019) and Baker et al. (2017), we assess                                     Test
the quality of the data fit via the coefficient of determination (R2 )     Model
and the Kendall rank correlation coefficient (τ ). Since Kendall τ is                            R2          sKT
sensitive to noisy evaluations that change the rank of an architec-        LGBoost              0.892        0.816
ture, we follow the recent work by Yu et al. (2020) and use a sparse       XGBoost              0.832        0.817
Kendall Tau (sKT), which ignores rank changes at 0.1% accuracy             GIN                  0.832        0.778
                                                                           NGBoost              0.810        0.759
precision, by rounding the predicted validation accuracy prior to          µ-SVR                0.709        0.677
computing τ .                                                              MLP (Path enc.)      0.704        0.697
                                                                           RF                   0.679        0.683
All hyperparameters of the surrogate models were tuned using               -SVR                0.675        0.660
BOHB (Falkner et al., 2018) as a black-box optimizer; details on
their respective hyperparameter search spaces are given in Table 7 Table 3: Performance of dif-
in the appendix. We use train/val/test splits (0.8/0.1/0.1) stratified ferent regression models fit-
across the NAS methods used for the data collection. This means ted on the NB-301 dataset.
that the ratio of architectures from a particular optimizer is constant
across the splits, e.g. the test set contains 50% of its architectures from RS since RS was used to
obtain 50% of the total architectures we trained and evaluated. We provide additional details on the
preprocessing of the architectures for the surrogate models in Appendix D.1. As Table 3 shows, the
three best-performing models are LGBoost, XGBoost and GIN; we therefore focus our analysis on
these in the following.
In addition to evaluating the data fit on our data splits, we investigate the impact of parameter-
free operations and the cell topology in Appendices D.6 and D.7, respectively. We find that all of
LGBoost, XGBoost and GIN accurately predict the drop in performance when increasingly replac-
ing operations with parameter-free operations in a normal cell.

      Model   No RE   No DE   No COMBO   No TPE   No BANANAS   No DARTS   No PC-DARTS   No DrNAS      No GDAS
      LGB     0.917   0.892   0.919      0.857    0.909        -0.093     0.826         0.699         0.429
R2    XGB     0.907   0.888   0.876      0.842    0.911        -0.151     0.817         0.631         0.672
      GIN     0.856   0.864   0.775      0.789    0.881        0.115      0.661         0.790         0.572
      LGB     0.834   0.782   0.833      0.770    0.592        0.780      0.721         0.694         0.595
sKT   XGB     0.831   0.780   0.817      0.762    0.596        0.775      0.710         0.709         0.638
      GIN     0.798   0.757   0.737      0.718    0.567        0.765      0.645         0.706         0.607

            Table 4: Leave One-Optimizer-Out performance of the best surrogate models.

                                                      5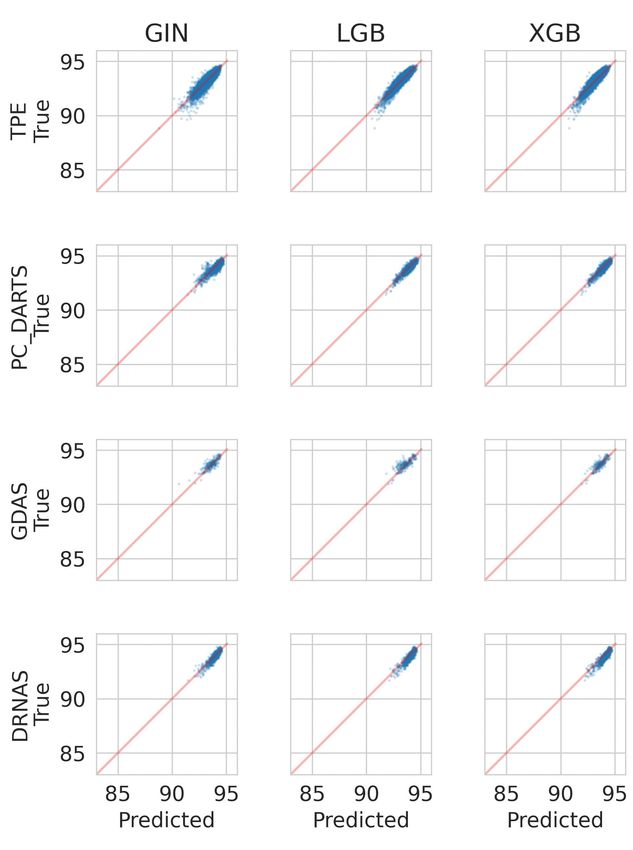
Under review as a conference paper at ICLR 2021

4.3   L EAVE O NE -O PTIMIZER -O UT A NALYSIS

Since the aim of NAS-Bench-301 is to allow efficient benchmarking of novel NAS algorithms, it is
necessary to ensure that the surrogate model can deliver accurate performance estimation on data
from trajectories by unseen NAS methods. Similarly to Eggensperger et al. (2015), we therefore
perform a form of cross-validation on the optimizers we used for data collection, i.e. we leave out
all data collected by one of the NAS methods entirely during training (using a stratified 0.9/0.1
train/val split over the other NAS methods). Then, we predict the unseen results from the left-out
NAS method to evaluate how well the models extrapolate to the region covered by the ’unseen’
method. We refer to this as the leave-one-optimizer-out (LOOO) setting.

Results The results in Table 4 show that the rank correlation between the predicted and observed
validation accuracy remains high even when a well-performing optimizer such as RE is left out.
Predicting BANANAS in the LOOO fashion yields a lower rank correlation, because it focuses on
well-performing architectures that are harder to rank; however, the high R2 shows that the fit is still
good.
Conversely, leaving out DARTS causes a low R2 but still high sKT; this is due to architectures with
many skip connections in the DARTS data that are overpredicted (further discussed in Section 5.2).
For full details, Figure 16 in the appendix provides scatter plots of the predicted vs. true performance
for each NAS method.

4.4   N OISE M ODELLING

Ensemble methods are commonly used to improve predictive performance (Dietterich, 2000). More-
over, ensembles of deep neural networks, so-called deep ensembles, have been proposed as a simple
way to obtain predictive uncertainty (Lakshminarayanan et al., 2017). We therefore create an en-
semble of 10 base learners for each of our three best performing models (GIN, XGB, LGB) using a
10-fold cross-validation for our train and validation split, as well as different initializations. We use
the architectures with multiple evaluations (see Section 3.3) to mirror the analysis in the motivation
in Section 2. We train using only one evaluation per architecture (i.e., seed 1) and take the mean
accuracy of the remaining ones as groundtruth (i.e., seeds 2-5). We then compare against a tabular
model with just one evaluation (seed 1).
Table 5 shows that the GIN and LGB surrogate mod- Model MAE 1, [2,3,4,5] Mean σ KL div.
els yield estimates closer to groundtruth than the
table lookup based on one evaluation. This con- Tabular              1.38e−3        undef.   undef.
firms our main finding from Section 2, but this time   GIN           1.13e-3        0.6e−3    16.4
                                                       LGB           1.33e−3        0.3e−3    68.9
on a much larger search space. We also compare XGB                   1.51e−3        0.3e−3   134.4
the predictive distribution of our ensembles to the
groundtruth. To that end, we assume the noise in the
                                                      Table 5: Metrics for the selected surrogate
architecture performance to be normally distributed
                                                      models on 500 architectures that were evalu-
and compute the Kullback–Leibler (KL) divergence
                                                      ated 5 times.
between the groundtruth accuracy distribution and
predicted distribution. We find the GIN ensemble to quite clearly provide the best estimate.
To allow evaluations of multi-objective NAS methods, and to allow using “simulated wallclock
time” on the x axis of plots, we also predict the runtime of architecture evaluations. For this, we
train an LGB model with the runtime as targets (see Appendix D.4 for details). Runtime prediction
is less challenging than performance prediction, resulting in an excellent fit of our LGB runtime
model on the test set (sKT: 0.936, R2 : 0.987). Other metrics of architectures, such as the number of
parameters and multiply-adds, do not require a surrogate model but can be queried exactly.

5     NAS-B ENCH -301        AS A    S URROGATE NAS B ENCHMARK

Having assessed the ability of the surrogate models to model the search space, we now use
NAS-Bench-301 to benchmark various NAS algorithms.

                                                   6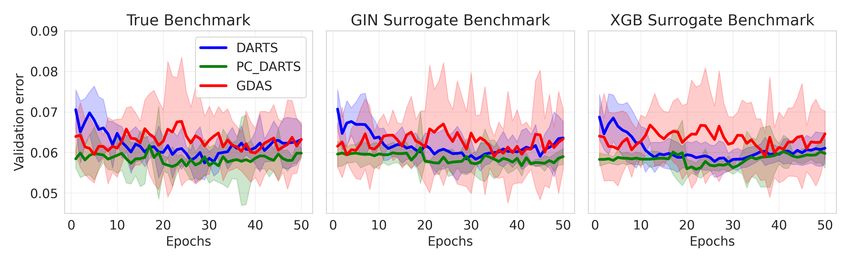
Under review as a conference paper at ICLR 2021

Figure 4: Anytime performance of different optimizers on the real benchmark (left) and the surrogate
benchmark (GIN (middle) and XGB (right)) when training ensembles on data collected from all
optimizers. Trajectories on the surrogate benchmark are averaged over 5 optimizer runs.

Figure 5: Anytime performance of blackbox optimizers, comparing performance achieved on the
real benchmark and on surrogate benchmarks built with GIN and XGB in an LOOO fashion.

5.1   B LACKBOX O PTIMIZERS

We first compare the trajectories on the true benchmark and on the surrogate benchmark for blackbox
optimizers when training the surrogate on all data. For the true benchmark, we show the trajectories
contained in our dataset (based on a single run, since we could not afford repetitions due to the ex-
treme compute requirements of 115 GPU days for a single run). For the evaluations on the surrogate,
on the other hand, we can trivially afford to perform multiple runs. For the surrogate trajectories,
we use an identical initialization for the optimizers (e.g., initial population for RE) but evaluations
of the surrogate benchmark are done by sampling from the surrogate model’s predictive distribution
for the architecture at hand, leading to different trajectories.
Results (all data) As Figure 4 shows, both the XGB and the GIN surrogate capture behaviors
present on the true benchmark. For instance, the strong improvements of BANANAS and RE are
also present on the surrogate benchmark at the correct time. In general, the ranking of the optimizers
towards convergence is accurately reflected on the surrogate benchmark. Also, the initial random
exploration of algorithms like TPE, RE and DE is captured as the large initial variation in perfor-
mance indicates. Notably, the XGB surrogate ensemble exhibits a high variation in well-performing
regions as well and seems to slightly underestimate the error of the best architectures. The GIN
surrogate, on the other hand, shows less variance in these regions but slightly overpredicts for the
best architectures.
Note, that due to the size of the search space, random search stagnates and cannot identify one of
the best architectures even after tens of thousands of evaluations, with BANANAS finding better
architectures orders of magnitude faster. This stands in contrast to previous NAS benchmarks. For
instance, NAS-Bench-201 (Dong & Yang, 2020) only contains 6466 unique architectures in total,
causing the median of random search runs to find the best architecture after only 3233 evaluations.
To simulate benchmarking of novel NAS methods, we expand on the leave-one-optimizer-out anal-
ysis (LOOO) from Section 4.3 and assess each optimizer with surrogate benchmarks based on data
excluding that gathered by said optimizer. We again compare the trajectories obtained from 5 runs
on the surrogate benchmark to the groundtruth.

                                                  7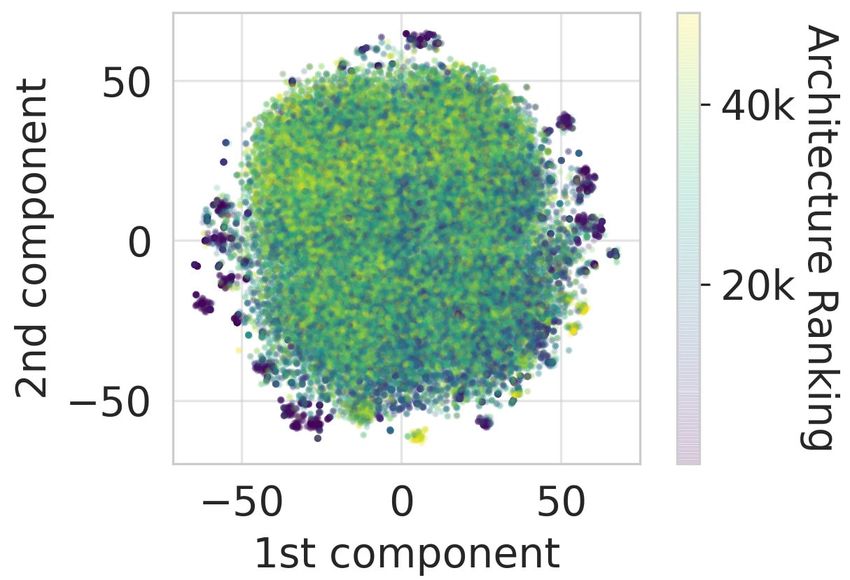
Under review as a conference paper at ICLR 2021

Figure 6: Anytime performance of one-shot optimizers, comparing performance achieved on the
real benchmark and on surrogate benchmarks built with GIN and XGB in a LOOO fashion.

Results (LOOO) Figure 5 shows the trajectories in the leave-one-optimizer-out setting. The XGB
and GIN surrogates again capture the general behavior of different optimizers well, illustrating that
characteristics of new optimization algorithms can be captured with the surrogate benchmark. Leav-
ing out DE appears to be a bigger problem for XGB than GIN, pointing to advantages of the smooth
embedding learned by the GIN compared to gradient-boosting.
In an additional experiment, we found that surrogates built on only well-performing architectures
(92% and above) yielded poor extrapolation to worse architectures, but that surrogate benchmarks
based on them still yielded realistic trajectories. We attribute this to NAS optimizers’ focus on
good architectures. For details, see Appendix E.2. We also investigate whether it is possible to
create benchmarks only on random architectures in Appendix E.3, and find that we can indeed
obtain realistic trajectories but lose some predictive performance in the well-performing regions.
Nevertheless, such benchmarks have the advantage of not possibly favouring any NAS optimizer
used for the generation of training data, and we thus recommend their release in addition to the
benchmarks based on the full training data.

5.2       O NE - SHOT O PTIMIZERS

NAS-Bench-301 can also be used to monitor the behavior of one-shot NAS optimizers throughout
their search phase, by querying the surrogate model with the currently most promising discrete
architecture. This can be extremely useful in many scenarios since uncorrelated proxy and true
objectives can lead to potential failure modes, e.g., to a case where the found architectures contain
only skip connections in the normal cell (Zela et al., 2020a;b; Dong & Yang, 2020) (we study such
a failure case in Appendix E.1 to ensure robustness of the surrogates in said case). We demonstrate
this use case in a similar LOOO analysis as for the black-box optimizers, using evaluations of the
discrete architectures from each search epoch of multiple runs of DARTS, PC-DARTS and GDAS
as ground-truth. Figure 6 shows that the surrogate trajectories closely resemble the true trajectories.

6       U SING NAS-B ENCH -301              TO   D RIVE NAS R ESEARCH

We finally use our new benchmark to perform a case study that demonstrates how NAS-Bench-
301 can drive NAS research. Coming up with research hypotheses and drawing conclusions when
prototyping or evaluating NAS algorithms on less realistic benchmarks is difficult, particularly when
these evaluations require high computational budgets. NAS-Bench-301 alleviates this dilemma via
its cheap and reliable estimates.
To showcase such a scenario, we evaluate Local Search4 (LS) on our surrogate benchmark and the
actual DARTS benchmark. White et al. (2020b) concluded that LS does not perform well on such
a large space by running it for 11.8 GPU days (≈ 106 seconds), and we are able to reproduce the
same results via NAS-Bench-301 in a few seconds (see Fig 7). While White et al. (2020b) could not
afford longer runs (nor repeats), on NAS-Bench-301 this is trivial. Doing so suggests that LS shows
qualitatively different behavior when run for an order of magnitude longer, transitioning from being
    4
        We use the implementation and settings of Local Search provided by White et al. (2020b).

                                                        8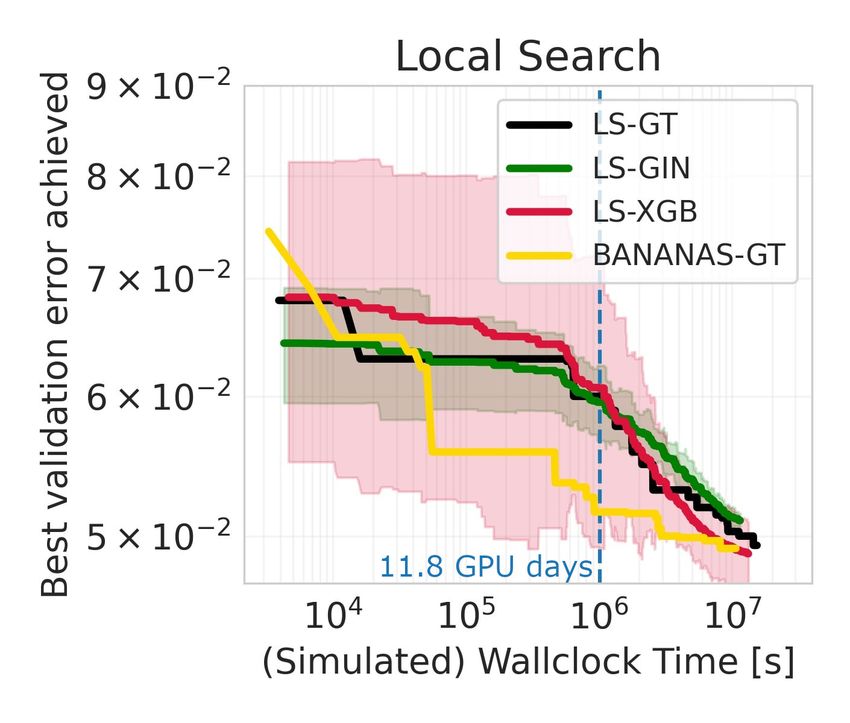
Under review as a conference paper at ICLR 2021

the worst method to being one of the best. We verified this suggestion by running LS for longer
on the actual DARTS benchmark (also see Fig 7). This allows us to revise the initial conclusion of
White et al. (2020b) to: LS is also state-of-the-art for the DARTS search space, but only when given
enough time.
This case study shows how NAS-Bench-301 was al-
ready used to cheaply obtain hints on a research hy-
pothesis that lead to correcting a previous finding
that only held for short runtimes. We look forward
to additional uses along such lines.

7  C ONCLUSIONS & G UIDELINES
FOR USING NAS-B ENCH -301

We proposed NAS-Bench-301, the first surrogate
NAS benchmark and first to cover a realistic search
space which is orders of magnitude larger than all
previous tabular NAS benchmarks. After motivating Figure 7: Case study results for Local
the benefits of a surrogate benchmark over a tabu- Search. GT is the ground truth, GIN and
lar one, we described the strategy used to collect the XGB are results on NAS-Bench-301.
data which we used to fit our selected surrogate models and evaluated their predictive performance.
Lastly, we demonstrated that our surrogate benchmark can accurately simulate real anytime per-
formance trajectories of various NAS methods at a fraction of the true cost and can lead to new
scientific findings. We hope that NAS-Bench-301 will allow the NAS practitioner to quickly pro-
totype and benchmark NAS algorithms on the currently most used search space, without requiring
large computational resources. We also argue that NAS-Bench-301 could also be used to monitor
one-shot optimizers during their search phase, to detect failure cases early on. Finally, the ideas and
methods discussed in our work trivially transfer to other search spaces or datasets, allowing for the
design of many interesting surrogate benchmarks in the future.
Finally, we want to mention the risk that prior knowledge about the surrogate model in
NAS-Bench-301 could lead to the design of algorithms that may overfit to the surrogate benchmark.
To this end, we recommend the following best practices to ensure a safe and fair benchmarking of
NAS methods on NAS-Bench-301 and future surrogate benchmarks:
• The surrogate model should be treated as a black-box function, hence only be used for perfor-
  mance prediction and not exploited to extract, e.g., gradient information.
• We discourage benchmarking methods that internally use the same model as the surrogate model
  picked in NAS-Bench-301 (e.g. GNN-based Bayesian optimization should not only be bench-
  marked using the GIN surrogate benchmark).
• We encourage running experiments on versions of NAS-Bench-301 (and other, future NAS sur-
  rogate benchmarks) that are based on (1) all available training architectures and (2) only archi-
  tectures collected with uninformed methods, such as random search or space-filling designs. As
  shown in Appendix E.3, (1) yields better predictive models, but (2) avoids any potential bias (in
  the sense of making more accurate predictions for architectures explored by a particular type of
  NAS optimizer) and can still yield strong benchmarks.
• In order to ensure comparability of results in different published papers, we ask users to state
  the benchmark’s version number. We will continuously collect more training data and further
  improve the surrogate model predictions. So far, we release NB301-XGB-v1.0, NB301-GIN-
  v1.0, NB301-XGB-rand-v1.0, and NB301-GIN-rand-v1.0.
Due to the flexibility of surrogate NAS benchmarks to cover arbitrary search spaces, we expect
NAS-Bench-301 to be the first of many such benchmarks. We collect best practices for the creation
of new surrogate benchmarks in Appendix F. Having access to a variety of benchmarks is essential
to the development and evaluation of new NAS methods. We therefore encourage the community
to expand the scope of current NAS benchmarks to different search spaces, datasets, and problem
domains utilizing surrogate benchmarks to cover large spaces.
Acknowledgements We thank the anonymous reviewers for suggesting very insightful experiments,
in particular the experiments for NAS benchmarks based only on random architectures.

                                                  9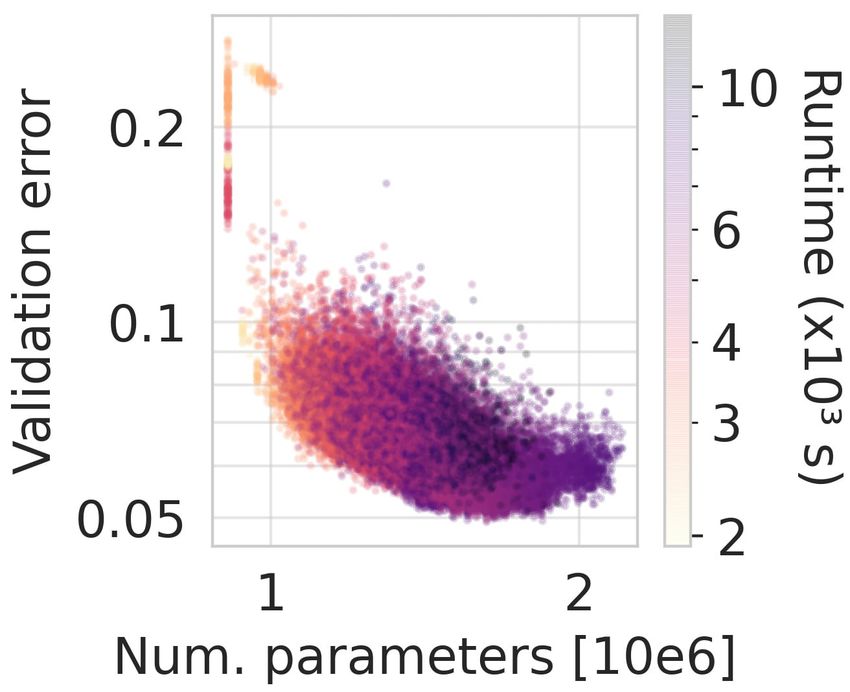
Under review as a conference paper at ICLR 2021

R EFERENCES
N. Awad, N. Mallik, and F. Hutter. Differential evolution for neural architecture search (dehb). In
  International Conference on Machine Learning (ICLR) Neural Architecture Search (NAS) Work-
  shop, 2020.
B. Baker, O. Gupta, R. Raskar, and N. Naik. Accelerating Neural Architecture Search using Perfor-
  mance Prediction. In NeurIPS Workshop on Meta-Learning, 2017.
R. Baptista and M. Poloczek. Bayesian optimization of combinatorial structures. In International
  Conference on Machine Learning (ICLR), pp. 462–471, 2018.
J. Bergstra and Y. Bengio. Random search for hyper-parameter optimization. Journal of Machine
   Learning Research, 13:281–305, 2012.
J. Bergstra, R. Bardenet, Y. Bengio, and B. Kégl. Algorithms for hyper-parameter optimization. In
   J. Shawe-Taylor, R. Zemel, P. Bartlett, F. Pereira, and K. Weinberger (eds.), Proceedings of the
   25th International Conference on Advances in Neural Information Processing Systems (NIPS’11),
   pp. 2546–2554, 2011.
H. Cai, C. Gan, T. Wang, Z. Zhang, and S. Han. Once-for-all: Train one network and specialize it
  for efficient deployment. In International Conference on Learning Representations (ICLR), 2020.
T. Chen and C. Guestrin. Xgboost: A scalable tree boosting system. In Proceedings of the 22nd acm
   sigkdd international conference on knowledge discovery and data mining, pp. 785–794, 2016.
X. Chen, R. Wang, M. Cheng, X. Tang, and C. Hsieh. Drnas: Dirichlet neural architecture search.
  arXiv preprint arXiv:2006.10355, 2020.
P. Chrabaszcz, I. Loshchilov, and F. Hutter. A downsampled variant of imagenet as an alternative to
   the cifar datasets. arXiv preprint arXiv:1707.08819, 2017.
B. Deng, J. Yan, and D. Lin. Peephole: Predicting network performance before training. arXiv
  preprint arXiv:1712.03351, 2017.
T. DeVries and G. W. Taylor. Improved regularization of convolutional neural networks with cutout.
   arXiv preprint arXiv:1708.04552, 2017.
T. Dietterich. Ensemble Methods in Machine Learning, volume 1857 of Lecture Notes in Computer
   Science. Springer Berlin Heidelberg, 2000.
T. Domhan, J. T. Springenberg, and F. Hutter. Speeding up automatic hyperparameter optimization
   of deep neural networks by extrapolation of learning curves. In Q. Yang and M. Wooldridge (eds.),
   Proceedings of the 25th International Joint Conference on Artificial Intelligence (IJCAI’15), pp.
   3460–3468, 2015.
X. Dong and Y. Yang. Searching for a robust neural architecture in four gpu hours. In Proceedings
  of the IEEE Conference on Computer Vision and Pattern Recognition (CVPR), pp. 1761–1770,
  2019.
X. Dong and Y. Yang. Nas-bench-102: Extending the scope of reproducible neural architecture
  search. In International Conference on Learning Representations (ICLR), 2020.
T. Duan, A. Avati, D. Ding, Khanh K. Thai, S. Basu, A. Ng, and A. Schuler. Ngboost: Natural
   gradient boosting for probabilistic prediction. In Proceedings of Machine Learning and Systems
   2020, pp. 6138–6148, 2020.
V. P. Dwivedi, C. K. Joshi, T. Laurent, Y. Bengio, and X. Bresson. Benchmarking graph neural
  networks. arXiv preprint arXiv:2003.00982, 2020.
K. Eggensperger, F. Hutter, H.H. Hoos, and K. Leyton-Brown. Efficient benchmarking of hyperpa-
  rameter optimizers via surrogates. In B. Bonet and S. Koenig (eds.), Proceedings of the Twenty-
  nineth National Conference on Artificial Intelligence (AAAI’15), pp. 1114–1120. AAAI Press,
  2015.

                                                10
Under review as a conference paper at ICLR 2021
T. Elsken, J. H. Metzen, and F. Hutter. Efficient multi-objective neural architecture search via lamar-
ckian evolution. In International Conference on Learning Representations, 2019a.
T. Elsken, J. H. Metzen, and F. Hutter. Neural architecture search: A survey. Journal of Machine
Learning Research, 20(55):1–21, 2019b.
T. Elsken, B. Staffler, J. Metzen, and F. Hutter. Meta-learning of neural architectures for few-
shot learning. In Proceedings of the IEEE/CVF Conference on Computer Vision and Pattern
Recognition, pp. 12365–12375, 2020.
F. Errica, M. Podda, D. Bacciu, and A. Micheli. A fair comparison of graph neural networks for
graph classification. In International Conference on Learning Representations, 2020.
S Falkner, A Klein, and F. Hutter. BOHB: Robust and efficient hyperparameter optimization at
scale. In Proceedings of the 35th International Conference on Machine Learning, volume 80 of
Proceedings of Machine Learning Research, pp. 1437–1446, 2018.
M. Fey and J. E. Lenssen. Fast graph representation learning with PyTorch Geometric. In ICLR
Workshop on Representation Learning on Graphs and Manifolds, 2019.
D. Friede, J. Lukasik, H. Stuckenschmidt, and M. Keuper. A variational-sequential graph autoen-
coder for neural architecture performance prediction. ArXiv, abs/1912.05317, 2019.
D. Golovin and A. Krause. Adaptive submodularity: Theory and applications in active learning and
stochastic optimization. Journal of Artificial Intelligence Research, 42:427–486, 2011.
M. Gori, G. Monfardini, and F. Scarselli. A new model for learning in graph domains. In Pro-
ceedings. 2005 IEEE International Joint Conference on Neural Networks, 2005., volume 2, pp.
729–734. IEEE, 2005.
K. He, X. Zhang, S. Ren, and J. Sun. Deep Residual Learning for Image Recognition. In Computer
Vision and Pattern Recognition (CVPR), 2016.
W. Hu, M. Fey, M. Zitnik, Y. Dong, H. Ren, B. Liu, M. Catasta, and J. Leskovec. Open graph
benchmark: Datasets for machine learning on graphs. arXiv preprint arXiv:2005.00687, 2020.
J. Hwang, S. Lay, and A. Lippman. Nonparametric multivariate density estimation: a comparative
study. IEEE Transactions on Signal Processing, 42(10):2795–2810, 1994.
R. Istrate, F. Scheidegger, G. Mariani, D. Nikolopoulos, C. Bekas, and A. C. I. Malossi. Tapas:
Train-less accuracy predictor for architecture search. In Proceedings of the AAAI Conference on
Artificial Intelligence, volume 33, pp. 3927–3934, 2019.
G. Ke, Q. Meng, T. Finley, T. Wang, W. Chen, W. Ma, Q. Ye, and T. Liu. Lightgbm: A highly
efficient gradient boosting decision tree. In I. Guyon, U. V. Luxburg, S. Bengio, H. Wallach,
R. Fergus, S. Vishwanathan, and R. Garnett (eds.), Advances in Neural Information Processing
Systems 30, pp. 3146–3154. Curran Associates, Inc., 2017.
T. N. Kipf and M. Welling. Semi-supervised classification with graph convolutional networks. In
International Conference on Learning Representations (ICLR), 2017.
A. Klein, S. Falkner, J. T. Springenberg, and F. Hutter. Learning curve prediction with Bayesian
neural networks. In Proceedings of the International Conference on Learning Representations
(ICLR’17). CBLS, 2017.
N. Klyuchnikov, I. Trofimov, E. Artemova, M. Salnikov, M. Fedorov, and E. Burnaev. Nas-bench-
nlp: Neural architecture search benchmark for natural language processing. arXiv preprint
arXiv:2006.07116, 2020.
A. Krizhevsky. Learning multiple layers of features from tiny images. Technical report, University
of Toronto, 2009.
B. Lakshminarayanan, A. Pritzel, and C. Blundell. Simple and scalable predictive uncertainty esti-
mation using deep ensembles. In Advances in neural information processing systems, pp. 6402–
6413, 2017.
11Under review as a conference paper at ICLR 2021
G. Larsson, M. Maire, and G. Shakhnarovich. Fractalnet: Ultra-deep neural networks without resid-
uals. In International Conference on Learning Representations (ICLR), 2017.
M. Lindauer and F. Hutter. Best practices for scientific research on neural architecture search. arXiv
preprint arXiv:1909.02453, 2019.
M. Lindauer, K. Eggensperger, M. Feurer, A. Biedenkapp, J. Marben, P. Müller, and F. Hut-
ter. Boah: A tool suite for multi-fidelity bayesian optimization & analysis of hyperparameters.
arXiv:1908.06756 [cs.LG], 2019.
C. Liu, L. Chen, F. Schroff, H. Adam, W. Hua, A. Yuille, and L. Fei-Fei. Auto-deeplab: Hierar-
chical neural architecture search for semantic image segmentation. In Proceedings of the IEEE
conference on computer vision and pattern recognition, pp. 82–92, 2019a.
H. Liu, K. Simonyan, and Y. Yang. DARTS: Differentiable architecture search. In International
Conference on Learning Representations, 2019b.
I. Loshchilov and F. Hutter. Sgdr: Stochastic gradient descent with warm restarts. In International
Conference on Learning Representations (ICLR) 2017 Conference Track, April 2017.
R. Luo, X. Tan, R. Wang, T. Qin, E. Chen, and T. Liu. Neural architecture search with gbdt. arXiv
preprint arXiv:2007.04785, 2020.
M. D. McKay, R. J. Beckman, and W. J. Conover. A comparison of three methods for selecting
values of input variables in the analysis of output from a computer code. Technometrics, 42(1):
55–61, 2000.
X. Ning, Y. Zheng, T. Zhao, Y. Wang, and H. Yang. A generic graph-based neural architecture
encoding scheme for predictor-based nas. arXiv preprint arXiv:2004.01899, 2020.
C. Oh, J. Tomczak, E. Gavves, and M. Welling. Combinatorial bayesian optimization using the
graph cartesian product. In Advances in Neural Information Processing Systems, pp. 2910–2920,
2019.
F. Pedregosa, G. Varoquaux, A. Gramfort, V. Michel, B. Thirion, O. Grisel, M. Blondel, P. Pretten-
hofer, R. Weiss, V. Dubourg, et al. Scikit-learn: Machine learning in python. Journal of machine
learning research, 12(Oct):2825–2830, 2011.
K. Price, R. M. Storn, and J. A. Lampinen. Differential evolution: a practical approach to global
optimization. Springer Science & Business Media, 2006.
E. Real, A. Aggarwal, Y. Huang, and Q. V. Le. Regularized evolution for image classifier archi-
tecture search. In Proceedings of the aaai conference on artificial intelligence, volume 33, pp.
4780–4789, 2019.
T. Saikia, Y. Marrakchi, A. Zela, F. Hutter, and T. Brox. Autodispnet: Improving disparity estimation
with automl. In IEEE International Conference on Computer Vision (ICCV), 2019.
H. Shi, R. Pi, H. Xu, Z. Li, J. T. Kwok, and T. Zhang. Multi-objective neural architecture search via
predictive network performance optimization. arXiv preprint arXiv:1911.09336, 2019.
Y. Shu, W. Wang, and S. Cai. Understanding architectures learnt by cell-based neural architecture
search. In International Conference on Learning Representations (ICLR), 2020.
I. M. Sobol’. On the distribution of points in a cube and the approximate evaluation of integrals.
Zhurnal Vychislitel’noi Matematiki i Matematicheskoi Fiziki, 7(4):784–802, 1967.
C. Szegedy, W. Liu, Y. Jia, P. Sermanet, S. Reed, D. Anguelov, D. Erhan, V. Vanhoucke, and A. Ra-
binovich. Going deeper with convolutions. In Computer Vision and Pattern Recognition (CVPR),
2015.
M. Tan, B. Chen, R. Pang, V. Vasudevan, and Q. V. Le. Mnasnet: Platform-aware neural architecture
search for mobile. 2019 IEEE/CVF Conference on Computer Vision and Pattern Recognition
(CVPR), pp. 2815–2823, 2018.
12Under review as a conference paper at ICLR 2021
Y. Tang, Y. Wang, Y. Xu, H. Chen, B. Shi, C. Xu, C. Xu, Q. Tian, and C. Xu. A semi-supervised
assessor of neural architectures. In Proceedings of the IEEE/CVF Conference on Computer Vision
and Pattern Recognition (CVPR), June 2020.
L. van der Maaten and G. Hinton. Visualizing data using t-sne. Journal of Machine Learning
Research (JMLR), 9(Nov):2579–2605, 2008.
W. Wen, H. Liu, H. Li, Y. Chen, G. Bender, and P. Kindermans. Neural predictor for neural archi-
tecture search. arXiv preprint arXiv:1912.00848, 2019.
C. White, W. Neiswanger, and Y. Savani. Bananas: Bayesian optimization with neural architectures
for neural architecture search. arXiv preprint arXiv:1910.11858, 2019.
C. White, W. Neiswanger, S. Nolen, and Y. Savani. A study on encodings for neural architecture
search. arXiv preprint arXiv:2007.04965, 2020a.
C. White, S. Nolen, and Y. Savani. Local search is state of the art for nas benchmarks. arXiv preprint
arXiv:2005.02960, 2020b.
Z. Wu, S. Pan, F. Chen, G. Long, C. Zhang, and P. S. Yu. A comprehensive survey on graph neural
networks. arXiv preprint arXiv:1901.00596, 2019.
K. Xu, W. Hu, J. Leskovec, and S. Jegelka. How powerful are graph neural networks? In Interna-
tional Conference on Learning Representations, 2019a.
Y. Xu, Y. Wang, K. Han, H. Chen, Y. Tang, S. Jui, C. Xu, Q. Tian, and C. Xu. Rnas: Architecture
ranking for powerful networks. arXiv preprint arXiv:1910.01523, 2019b.
Y. Xu, L. Xie, X. Zhang, X. Chen, G. Qi, Q. Tian, and H. Xiong. Pc-darts: Partial channel connec-
tions for memory-efficient architecture search. In International Conference on Learning Repre-
sentations, 2020.
A. Yang, P. M. Esperança, and F. M. Carlucci. Nas evaluation is frustratingly hard. arXiv preprint
arXiv:1912.12522, 2019.
C. Ying, A. Klein, E. Christiansen, E. Real, K. Murphy, and F. Hutter. NAS-bench-101: Towards
reproducible neural architecture search. In Kamalika Chaudhuri and Ruslan Salakhutdinov (eds.),
Proceedings of the 36th International Conference on Machine Learning, volume 97 of Proceed-
ings of Machine Learning Research, pp. 7105–7114, 2019.
K. Yu, R. Ranftl, and M. Salzmann. How to train your super-net: An analysis of training heuristics
in weight-sharing nas. arXiv preprint arXiv:2003.04276, 2020.
A. Zela, T. Elsken, T. Saikia, Y. Marrakchi, T. Brox, and F. Hutter. Understanding and robustify-
ing differentiable architecture search. In International Conference on Learning Representations,
2020a.
A. Zela, J. Siems, and F. Hutter. Nas-bench-1shot1: Benchmarking and dissecting one-shot neural
architecture search. In International Conference on Learning Representations, 2020b.
H. Zhang, M. Cisse, Y. N. Dauphin, and D. Lopez-Paz. mixup: Beyond empirical risk minimization.
International Conference on Learning Representations, 2018.
J. Zhou, G. Cui, Z. Zhang, C. Yang, Z. Liu, L. Wang, C. Li, and M. Sun. Graph neural networks: A
review of methods and applications. arXiv preprint arXiv:1812.08434, 2018.
B. Zoph and Q. V. Le. Neural architecture search with reinforcement learning. In International
Conference on Learning Representations (ICLR) 2017 Conference Track, 2017.
13Under review as a conference paper at ICLR 2021
A R ELATED W ORK
A.1 E XISTING NAS BENCHMARKS
Benchmarks for NAS were introduced only recently with NAS-Bench-101 (Ying et al., 2019) as the
first among them. NAS-Bench-101 is a tabular benchmark consisting of ∼423k unique architectures
in a cell structured search space evaluated on CIFAR-10 (Krizhevsky, 2009). To restrict the number
of architectures in the search space, the number of nodes and edges was given an upper bound and
only three operations are considered. One result of this limitation is that One-Shot NAS methods
can only be applied to subspaces of NAS-Bench-101 as demonstrated in NAS-Bench-1Shot1 (Zela
et al., 2020b).
NAS-Bench-201 (Dong & Yang, 2020), in contrast, uses a search space with a fixed number of
nodes and edges, hence allowing for a straight-forward application of one-shot NAS methods. How-
ever, this limits the total number of unique architectures to as few as 6466. NAS-Bench-201 in-
cludes evaluations of all these architectures on three different datasets, namely CIFAR-10, CIFAR-
100 (Krizhevsky, 2009) and Downsampled Imagenet 16×16 (Chrabaszcz et al., 2017), allowing for
transfer learning experiments.
NAS-Bench-NLP (Klyuchnikov et al., 2020) was recently proposed as a tabular benchmark for
NAS in the Natural Language Processing domain. The search space resembles NAS-Bench-101 as
it limits the number of edges and nodes to constrain the search space size resulting in 14k evaluated
architectures.
A.2 N EURAL N ETWORK P ERFORMANCE P REDICTION
In the past, several works have attempted to predict the performance of neural networks by ex-
trapolating learning curves (Domhan et al., 2015; Klein et al., 2017; Baker et al., 2017). A more
recent line of work in performance prediction focuses more on feature encoding of neural archi-
tectures. Peephole (Deng et al., 2017) and TAPAS (Istrate et al., 2019) both use an LSTM to
aggregate information about the operations in chain-structured architectures. On the other hand,
BANANAS (White et al., 2019) introduces a path-based encoding of cells that automatically re-
solves the computational equivalence of architectures.
Graph Neural Networks (GNNs) (Gori et al., 2005; Kipf & Welling, 2017; Zhou et al., 2018; Wu
et al., 2019) with their capability of learning representations of graph-structured data appear to be a
natural choice to learning embeddings of NN architectures. Shi et al. (2019) and Wen et al. (2019)
trained a Graph Convolutional Network (GCN) on a subset of NAS-Bench-101 (Ying et al., 2019)
showing its effectiveness in predicting the performance of unseen architectures. Moreover, Friede
et al. (2019) propose a new variational-sequential graph autoencoder (VS-GAE) which utilizes a
GNN encoder-decoder model in the space of architectures and generates valid graphs in the learned
latent space.
Several recent works further adapt the GNN message passing to embed architecture bias via extra
weights to simulate the operations such as in GATES (Ning et al., 2020) or integrate additional
information on the operations (e.g. flop count) (Xu et al., 2019b). Tang et al. (2020) chose to
operate GNNs on relation graphs based on architecture embeddings in a metric learning setting,
allowing to pose NAS performance prediction as a semi-supervised setting.
B T RAINING D ETAILS FOR THE GIN IN THE M OTIVATION
We set the GIN to have a hidden dimension of 64 with 4 hidden layers resulting in around ∼40k
parameters. We trained for 30 epochs with a batch size of 128. We chose the MSE loss function and
add a logarithmic transformation to emphasize the data fit on well-performing architectures.
14Under review as a conference paper at ICLR 2021
Model Mean Squared Error (MSE) Kendall tau
1, [2, 3] 2, [1, 3] 3, [1, 2] 1, [2, 3] 2, [1, 3] 3, [1, 2]
Tab. 5.44e-5 5.43e-5 5.34e-5 0.83 0.83 0.83
Surr. 3.02e-5 3.07e-5 3.02e-5 0.87 0.87 0.87
Table 6: MSE and Kendall tau correlation between performance predicted by a tab./surr. benchmark
fitted with one seed each, and the true performance of evaluations with the two other seeds (see
Section 2). Test seeds in brackets.
C NAS-B ENCH -301 DATASET
C.1 S EARCH S PACE
We use the same architecture search space as in DARTS (Liu et al., 2019b). Specifically, the normal
and reduction cell each consist of a DAG with 2 input nodes (receiving the output feature maps from
the previous and previous-previous cell), 4 intermediate nodes (each adding element-wise feature
maps from two previous nodes in the cell) and 1 output node (concatenating the outputs of all
intermediate nodes). Input and intermediate nodes are connected by directed edges representing one
of the following operations: Sep. conv 3 × 3, Sep. conv 5 × 5, Dil. conv 3 × 3, Dil. conv 5 × 5,
Max pooling 3 × 3, Avg. pooling 3 × 3, Skip connection.
C.2 DATA C OLLECTION
To achieve good global coverage, we use random search to evaluate ∼23k architectures. We note
that space-filling designs such as quasi-random sequences, e.g. Sobol sequences (Sobol’, 1967), or
Latin Hypercubes (McKay et al., 2000) and Adaptive Submodularity (Golovin & Krause, 2011) may
also provide good initial coverage.
Random search is supplemented by data which we collect from running a variety of optimizers, rep-
resenting Bayesian Optimization (BO), evolutionary algorithms and One-Shot Optimizers. We used
Tree-of-Parzen-Estimators (TPE) (Bergstra et al., 2011) as implemented by Falkner et al. (2018) as
a baseline BO method. Since several recent works have proposed to apply BO over combinatorial
spaces (Oh et al., 2019; Baptista & Poloczek, 2018) we also used COMBO (Oh et al., 2019). We
included BANANAS (White et al., 2019) as our third BO method, which uses a neural network
with a path-based encoding as a surrogate model and hence scales better with the number of func-
tion evaluations. As two representatives of evolutionary approaches to NAS, we chose Regularized
Evolution (RE) (Real et al., 2019) as it is still one of the state-of-the art methods in discrete NAS
and Differential Evolution (Price et al., 2006) as implemented by Awad et al. (2020). Accounting
for the surge in interest in One-Shot NAS, our collected data collection also entails evaluation of
architectures from search trajectories of DARTS (Liu et al., 2019b), GDAS (Dong & Yang, 2019),
DrNAS (Chen et al., 2020) and PC-DARTS (Xu et al., 2020). For details on the architecture training
details, we refer to Section C.6.
For each architecture a ∈ A, the dataset contains the following metrics: train/validation/test accu-
racy, training time and number of model parameters.
C.3 D ETAILS ON EACH OPTIMIZER
In this section we provide the hyperparameters used for the evaluations of NAS optimizers for the
collection of our dataset. Many of the optimizers require a specialized representation to function
on an architecture space because most of them are general HPO optimizers. As recently shown
by White et al. (2020a), this representation can be critical for the performance of a NAS optimizer.
Whenever the representation used by the Optimizer did not act directly on the graph representation,
such as in RE, we detail how we represented the architecture for the optimizer. All optimizers were
set to optimize the validation error.
15Under review as a conference paper at ICLR 2021
BANANAS. We initialized BANANAS with 100 random architectures and modified the opti-
mization of the surrogate model neural network, by adding early stopping based on a 90%/10%
train/validation split and lowering the number of ensemble models to be trained from 5 to 3. These
changes to bananas avoided a computational bottleneck in the training of the neural network.
COMBO. COMBO only attempts to maximize the acquisition function after the entire initial de-
sign (100 architectures) has completed. For workers which are done earlier, we sample a random
architecture, hence increasing the initial design by the number of workers (30) we used for running
the experiments. The search space considered in our work is larger than all search spaces evaluated
in COMBO (Oh et al., 2019) and we regard not simply binary architectural choices, as we have to
make choices about pairs of edges. Hence, we increased the number of initial samples for ascent
acquisition function optimization from 20 to 30. Unfortunately, the optimization of the GP already
became the bottleneck of the BO after around 600 function evaluations, leading to many workers
waiting for new jobs to be assigned.
Representation: In contrast to the COMBO’s original experimental setting, the DARTS search re-
quires choices based on pairs of parents of intermediate nodes where the number of choices increase
with the index of the intermediate nodes. The COMBO representation therefore consists of the graph
cartesian product of the combinatorial choice graphs, increasing in size with each intermediate node.
In addition, there exist 8 choices over the number of parameters for the operation in a cell.
Differential Evolution. DE was started with a generation size of 100. As we used a parallelized
implementation, the workers would have to wait for one generation plus its mutations to be com-
pleted for selection to start. We decided to keep the workers busy by training randomly sampled
architectures in this case, as random architectures provide us good coverage of the space. However,
different methods using asynchronous DE selection would also be possible. Note, that the DE im-
plementation by Awad et al. (2020), performs boundary checks and resamples components of any
individual that exceeds 1.0. We use the rand1 mutation operation which generally favors exploration
over exploitation.
Representation: DE uses a vector representation for each individual in the population. Categorical
choices are scaled to lie within the unit interval [0, 1] and are rounded to the nearest category when
converting back to the discrete representation in the implementation by Awad et al. (2020). Similarly
to COMBO, we represent the increasing number of parent pair choices for the intermediate nodes
by interpreting the respective entries to have an increasing number of sub-intervals in [0, 1].
DARTS, GDAS, PC-DARTS and DrNAS. 1.00
Cumulative prob.
We collected the architectures found by all of
the above one-shot optimizers with their default 0.75 BANANAS
search hyperparameters. We performed multi- COMBO
DARTS
ple searches for each one-shot optimizer. 0.50 DE
DRNAS
GDAS
RE. To allow for a good initial coverage be- 0.25 PC_DARTS
RE
fore mutations start, we decided to randomly RS
sample 3000 architectures as initial population. 0.00 TPE
RE then proceeds with a sample size of 100 0.05 0.1 0.2
to extract well performing architectures from Validation error
the population and mutates them. During mu-
tations RE first decides whether to mutate the Figure 8: Empirical Cumulative Density Func-
normal or reduction cell and then proceeds to tion (ECDF) plot comparing all optimizers in the
perform either a parent change, an operation dataset. Optimizers which cover good regions of
change or no mutation. the search space feature higher values in the low
validation error region.
TPE. For TPE we use the default settings as also used by BOHB. We use the Kernel-Density-
Estimator surrogate model and build two models where the good configs are chosen as the top 15%.
The acquisition function’s expected improvement is optimized by sampling 64 points.
16You can also read