NAS-BENCH-301 AND THE CASE FOR SURROGATE BENCHMARKS FOR NEURAL ARCHITECTURE SEARCH - Machine Learning ...
←
→
Page content transcription
If your browser does not render page correctly, please read the page content below
NAS-B ENCH -301 AND THE C ASE FOR S URROGATE
                                         B ENCHMARKS FOR N EURAL A RCHITECTURE S EARCH
                                          Julien Siems1∗ , Lucas Zimmer1∗, Arber Zela1 , Jovita Lukasik2 ,
                                          Margret Keuper2 & Frank Hutter1,3
                                          1
                                            University of Freiburg, 2 University of Mannheim, 3 Bosch Center for Artificial Intelligence
                                          {siemsj, zimmerl, zelaa, fh}@cs.uni-freiburg.de
                                          {jovita, keuper}@uni-mannheim.de
arXiv:2008.09777v1 [cs.LG] 22 Aug 2020

                                                                                       A BSTRACT

                                                      Neural Architecture Search (NAS) is a logical next step in the automatic learning
                                                      of representations, but the development of NAS methods is slowed by high compu-
                                                      tational demands. As a remedy, several tabular NAS benchmarks were proposed to
                                                      simulate runs of NAS methods in seconds. However, all existing NAS benchmarks
                                                      are limited to extremely small architectural spaces since they rely on exhaustive
                                                      evaluations of the space. This leads to unrealistic results, such as a strong per-
                                                      formance of local search and random search, that do not transfer to larger search
                                                      spaces. To overcome this fundamental limitation, we propose NAS-Bench-301,
                                                      the first model-based surrogate NAS benchmark, using a search space containing
                                                      1018 architectures, orders of magnitude larger than any previous NAS benchmark.
                                                      We first motivate the benefits of using such a surrogate benchmark compared to a
                                                      tabular one by smoothing out the noise stemming from the stochasticity of single
                                                      SGD runs in a tabular benchmark. Then, we analyze our new dataset consisting
                                                      of architecture evaluations and comprehensively evaluate various regression mod-
                                                      els as surrogates to demonstrate their capability to model the architecture space,
                                                      also using deep ensembles to model uncertainty. Finally, we benchmark a wide
                                                      range of NAS algorithms using NAS-Bench-301 allowing us to obtain comparable
                                                      results to the true benchmark at a fraction of the cost.

                                         1       I NTRODUCTION

                                         The successes of deep learning are mainly attributed to its capacity to automatically learn useful
                                         feature representations from data, which largely surpassed previous feature engineering approaches.
                                         In a similar vein, neural architecture search (NAS) promises to advance the field by removing hu-
                                         man bias from architecture design (see, e.g., Elsken et al. (2019b)), achieve new state of the art on
                                         many tasks (Real et al., 2019; Chenxi et al., 2019; Saikia et al., 2019) and create resource-aware
                                         architectures (Tan et al., 2018; Elsken et al., 2019a; Cai et al., 2020).
                                         At its inception, NAS was shown to be effective in automating the architecture design, but also
                                         prohibitively expensive, requiring industry-level compute resources (Zoph & Le, 2017). Since then,
                                         research has focused on improving the efficiency of NAS methods. These efforts have introduced
                                         the weight-sharing paradigm (Pham et al., 2018) which brought down the cost of NAS to a single
                                         GPU day. Many works since then have tried to improve over this paradigm (Liu et al., 2019; Pham
                                         et al., 2018; Xu et al., 2020; Dong & Yang, 2019; Zela et al., 2020a; Nayman et al., 2019).
                                         However, empirical evaluations in NAS are still problematic. Different NAS methods often use
                                         different training pipelines, perform their search on lower-fidelity proxy models and evaluate the
                                         architectures in substantially larger models. In many cases, due to the large computational expense
                                         of NAS, the search phase is only run once and the found architecture is evaluated only once. This
                                         practice impedes assertions about the statistical significance of the reported results, recently brought
                                         into focus by several authors (Yang et al., 2019; Lindauer & Hutter, 2019; Shu et al., 2020; Yu et al.,
                                         2020).
                                             ∗
                                                 Equal contribution

                                                                                              1
Recently, several tabular benchmarks (Ying et al., 2019; Zela et al., 2020b; Dong & Yang, 2020;
Klyuchnikov et al., 2020) have been proposed to circumvent the aforementioned issues and enable
proper scientific evaluations in NAS. However, all of these are severely limited by relying on an
exhaustive evaluation of all architectures in a search space. This leads to unrealistically small search
spaces, so far containing only between 6k and 423k unique architectures, a far shot from standard
search spaces used in the NAS literature, which contain more than 1018 architectures (Zoph & Le,
2017; Pham et al., 2018; Liu et al., 2019; Cai et al., 2019). Unfortunately, this discrepancy in search
spaces leads to very different characteristics of existing NAS benchmarks and realistic NAS search
spaces that limit the conclusions that can be drawn from existing NAS benchmarks: for example,
local search yields the best available results in existing NAS benchmarks but performs poorly in
realistic search spaces (White et al., 2020b), such as the one used by DARTS (Liu et al., 2019).
To address these problems, we make the following contributions:

1. We present NAS-Bench-301, a surrogate NAS benchmark that is first to cover a realistically-sized
   search space (namely the cell-based search space of DARTS (Liu et al., 2019)), containing more
   than 1018 possible architectures. As a surrogate benchmark, rather than having to exhaustively
   evaluate every architecture, NAS-Bench-301 deploys a surrogate model trained on function eval-
   uations to cover this large search space.
2. Using NAS-Bench-101 (Ying et al., 2019), we show that a surrogate benchmark fitted on a subset
   of the architectures in the search space can in fact model the true performance of architectures
   better than a tabular NAS benchmark.
3. We analyze and release NAS-Bench-301 as a dataset consisting of ∼50k architecture evaluations
   that will also be publicly available in the Open Graph Benchmark (OGB) (Hu et al., 2020) for
   evaluating other NAS performance predictors. We evaluate a variety of regression models fitted
   on said dataset as surrogate candidates and show that it is possible to accurately predict the perfor-
   mance of architectures sampled from previously-unseen and extreme regions of the architecture
   space.
4. We utilize NAS-Bench-301 as a benchmark for running black-box (discrete) optimizers resulting
   in a large speedup over the true benchmark since each architecture evaluation takes less than a
   second to query from the surrogate, compared to 1-2 hours for training an architecture. We show
   that the resulting search trajectories on the surrogate benchmark closely resemble groundtruth
   trajectories. In contrast to the much smaller existing NAS-Benchmarks, we can demonstrate that
   random search is not a competitive baseline on our realistic search space.

We hope that NAS-Bench-301 will facilitate statistically sound yet realistic benchmarking of NAS
methods. In order to foster reproducibility, we open-source all the code and data in the following
repository: https://github.com/automl/nasbench301.

2   M OTIVATION – C AN WE DO B ETTER T HAN A TABULAR B ENCHMARK ?
In this section, we expose an issue of tabular benchmarks that has largely gone unnoticed and go
on to show that surrogate benchmarks can provide better performance estimates than tabular bench-
marks based on less data.
Tabular NAS benchmarks are built around a costly, exhaustive evaluation of all possible architectures
in a search space, and when a particular architecture’s performance is queried, the tabular benchmark
simply returns the respective table entry. The issue with this process is that, due to the stochasticity
of SGD training, the result of evaluating the error of architecture i is a random variable Xi , and in
the table we only save the result of a single draw xi ∼ Xi (or a very small number of draws we can
afford to run for each architecture; existing NAS benchmarks have up to 3 runs per architecture).
Given that there is noise in the evaluations, if we have one or more evaluations available for each of
the architectures in a search space, from a statistical perspective, one may then view a tabular NAS
benchmark as a simple estimator that assumes the performance of all architectures to be entirely
independent of each other, and thus estimates the error of an architecture based only on previous
evaluations of this exact architecture. However, from a machine learning perspective, knowing that
similar architectures tend to yield similar performance, and knowing that the variance of individual
evaluations can be high (both described, e.g., in NAS-Bench-101 (Ying et al., 2019)), one may

                                                   2
wonder whether one can construct better estimators. Indeed, this is precisely the supervised learning
problem of performance prediction in the space of neural architectures (see Section 7.2 for related
work on this problem), and, so, under this view it should not come as a surprise that a learned
regression model can show lower estimation error than tabular benchmarks. In the remainder of this
section, we show a concrete example where this is the case.

Setup for Proof of Concept Experiment. We chose NAS-                  Model Type                    Mean Absolute Error (MAE)
Bench-101 (Ying et al., 2019) for our analysis, because it con-                                     2, [0, 1]   1, [0, 2]     0, [1, 2]
tains 3 evaluations per architecture (on the full 108 epoch bud-      Tabular                       4.539e-3    4.546e-3      4.534e-3
get). Given the validation accuracies y1 , y2 , y3 of the three       Surrogate                     3.441e-3    3.455e-3      3.446e-3
evaluations for each architecture, we trained a surrogate model
on a single seed of each architecture in NAS-Bench-101, e.g.         Table 1: Mean absolute error be-
ytrain = y1 . If the surrogate model learns to smooth out the        tween the predicted validation ac-
noise, then the Mean Absolute Error (MAE) between the pre-           curacy for two of the three evalua-
dicted validation accuracy ypred to the average validation ac-       tions per configuration and the re-
curacy of the two remaining seeds, in this case ytest = ȳ23 ,       maining configuration’s validation
should be smaller than the MAE of the validation accuracy of         accuracy. Test seeds are denoted in
y1 to ȳ23 .                                                         brackets.
We emphasize that training a surrogate to model a search space differs from a typical regression
task in that it represents a transductive inference task. By definition of the search space, the set of
possible architectures is known ahead of time (although it may be very large), hence a surrogate
model does not have to generalize to out-of-distribution data if the training data covers the space
well.
Many possible models can be used as surrogates (see the related work in Section 7.2); here, we chose
a graph convolutional network (GCN), specifically, a GIN model (Xu et al., 2019a) (as implemented
by Errica et al. (2020)). We successively increase the amount of training data up to the full data for
one seed of NAS-Bench-101 (∼ 400k unique architectures). Following Wen et al. (2019); Friede
et al. (2019), we excluded the diverged models contained in NAS-Bench-101 by removing models
which obtained less than 50% validation accuracy on any of the three evaluations. Finally, we
evaluated the GIN and the tabular benchmark (both based on one seed) on the remaining two seeds
(ytest ). For training details we refer to Appendix A.1.1.

Results of Proof of Concept Experiment. Table 1 com-                                                                        Surrogate
                                                                     Mean Absolute Error

pares the error between the surrogate model when trained on                                                                 Tabular
one seed of all architectures and the tabular benchmark. For all
possible choices of training seeds, the surrogate model yields                             10   2

a lower MAE than the tabular benchmark.1
Figure 1 depicts how the GIN scales with different percent-           101    102      103      104    105
ages of training data. Only when the ratio of training data for       Number of architectures from NB-101
the GIN surrogate model decreases below 5% of all data in
NAS-Bench-101 (i.e. ∼21,500 architectures), does the surro- Figure 1: Number of architectures
gate model perform worse than the tabular benchmark. We used for training the GIN surro-
note that this analysis is done with the same hyperparameter gate model vs MAE on the NAS-
setting for all ratios of training data. Hence, the surrogates Bench-101 dataset.
could require even less training data to reach similar perfor-
mance to the tabular benchmark if the hyperparameters were tuned on every level.
From this proof of concept, we conclude that a surrogate model can yield strong performance when
only a subset of the search space is available as training data (and can in the extreme even outperform
a tabular benchmark by smoothing out the noise in the architecture evaluation). This opens up a
garden of delights, as it allows us to create NAS benchmarks for arbitrary NAS spaces, in particular
much larger, realistic ones, for which it is completely infeasible to create an exhaustive tabular
benchmark. In the remainder of the paper, we will focus on creating such a surrogate benchmark,
   1
                                                                                                      √
    We do note that the average estimation error of tabular benchmarks could be reduced by a factor of k by
performing k runs for each architecture. The error of a surrogate model would also shrink when the model is
based on more data, but as k grows large the independence assumption of tabular benchmarks would become
competitive with surrogate models.

                                                    3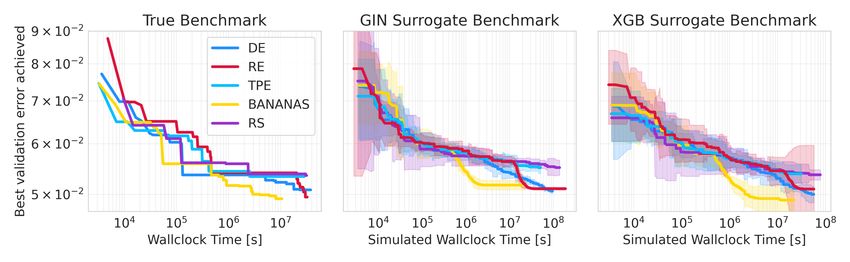
Optimizer                           # Evaluations                          1.00

                                                              cumulative prob.
      Discrete                RS          24047
                              DE          7275                                   0.75                         BANANAS
                  Evolution                                                                                   COMBO
                              RE          4639                                                                DARTS

                              TPE         6741                                   0.50                         DE
                                                                                                              GDAS
                  BO          BANANAS     2243                                                                PC_DARTS
                              COMBO       745                                    0.25                         RANDOM_WS
                                                                                                              RE
      One-Shot                DARTS       2053                                                                RS
                              GDAS        234
                              RANDOM-WS   198
                                                                                 0.00                         TPE

                              PC-DARTS    149                                           0.05        0.1         0.2
                                                                                               Validation error
    Table 2: Overview of the optimizers used to           Figure 2: Empirical Cumulative Density Func-
    cover the search space.                               tion (ECDF) plot comparing all optimizers in the
                                                          dataset. Optimizers which cover good regions
                                                          of the search space will have higher cumulative
                                                          prob in the low validation error region.

NAS-Bench-301, for the most frequently used NAS search space: the one used by DARTS (Liu et al.,
2019).

3     T HE NAS-B ENCH -301 DATASET

In this section, we describe the NAS-Bench-301 dataset of over 50k architectures and their perfor-
mances. Next to its use in order to create the NAS-Bench-301 surrogate NAS benchmark later on in
this paper, this dataset allows us to gain various insights (e.g., which types of architectures are being
explored by different NAS methods, and what are the characteristics of architectures that work well)
and it is also relevant to the Graph Learning community, since it offers a challenging graph space
with noisy evaluations per graph as they may be encountered in practice. To encourage transparency
and reproducibility, we are collaborating with the Open Graph Benchmark (OGB) (Hu et al., 2020)
to offer a public leaderboard.

3.1     S EARCH S PACE

We use the same architecture search space as in DARTS (Liu et al., 2019). Specifically, the normal
and reduction cell each consist of a DAG with 2 input nodes (receiving the output feature maps from
the previous and previous-previous cell), 4 intermediate nodes (each adding element-wise feature
maps from two previous nodes in the cell) and 1 output node (concatenating the outputs of all
intermediate nodes). Input and intermediate nodes are connected by directed edges representing one
of the following operations: {Sep. conv 3 × 3, Sep. conv 5 × 5, Dil. conv 3 × 3, Dil. conv 5 × 5,
Max pooling 3 × 3, Avg. pooling 3 × 3, Skip connection}.

3.2     DATA C OLLECTION

Since the DARTS search space we consider is too large to exhaustively evaluate, a central question in
our design was how to decide which architectures to include to achieve a good coverage of the overall
architecture space while also providing a special focus on well-performing regions that optimizers
tend to explore more. Our principal methodology is inspired by Eggensperger et al. (2015), who
balanced unbiased collection by uniform random sampling for good overall coverage with biased
and dense data collection in high-performance regions by running hyperparameter optimizers. This
is desirable for a surrogate benchmark since we are interested in well-performing optimizers that
explore well-performing regions.
Following this approach, we evaluated over 25k randomly sampled architectures and added architec-
tures found by the following nine optimizers. We used Tree-of-Parzen-Estimators (TPE) (Bergstra
et al., 2011) as implemented by Falkner et al. (2018) as a baseline BO method. Since several recent
works have proposed to apply BO over combinatorial spaces (Oh et al., 2019; Baptista & Poloczek,
2018) we also used COMBO (Oh et al., 2019). We included BANANAS (White et al., 2019) as our
third BO method, which uses a neural network with a path-based encoding as a surrogate model

                                                          4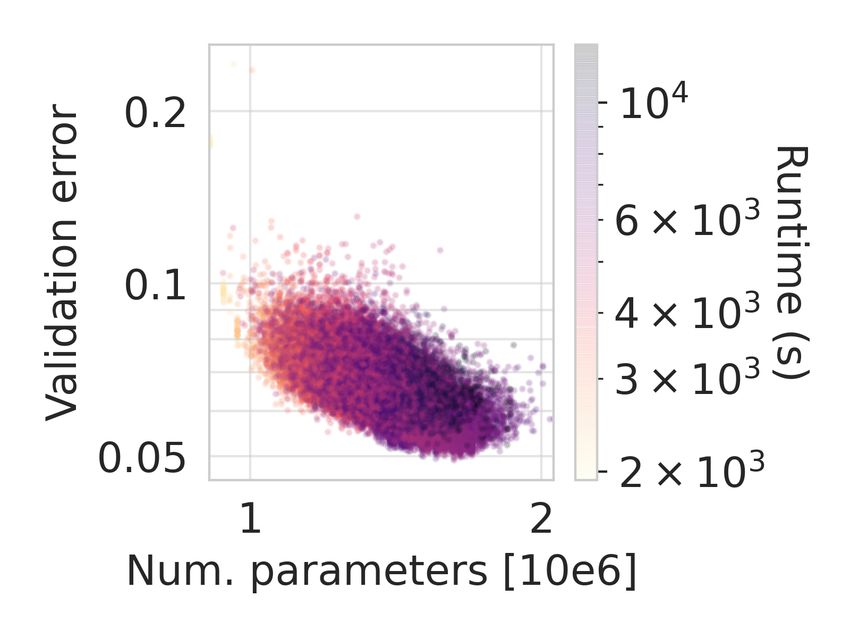
Figure 3: Number of parameters against valida-         Figure 4: t-SNE visualization of the sampled ar-
tion error with model training time as colorbar.       chitectures colored as ranked w.r.t their valida-
                                                       tion accuracy.

and hence scales better with the number of function evaluations. As two representatives of evolu-
tionary approaches to NAS we chose Regularized Evolution (RE) (Real et al., 2019) as it is still
one of the state-of-the art methods in discrete NAS and Differential Evolution (Price et al., 2006) as
implemented by Awad et al. (2020). Accounting for the surge in interest in One-Shot NAS, our data
collection also entails evaluation of architectures from the search trajectory of DARTS (Liu et al.,
2019), GDAS (Dong & Yang, 2019), RANDOM-WS (Li & Talwalkar, 2019) and PC-DARTS (Xu
et al., 2020). For details on the setup of each NAS optimizer and the architecture training details we
refer to Appendices A.3 and A.4, respectively.
In total, our dataset D consists of around 50.000 data points, broken down into the optimizers they
originate from in Table 2. For each architecture λ ∈ Λ, the dataset contains the following metrics:
train/validation/test accuracy, training time and number of model parameters.

3.3   A RCHITECTURE S PACE C OVERAGE

We now perform an in-depth exploration of how the different NAS optimizers cover the search space.
The trajectories from the different NAS optimizers yield quite different performance distributions.
This can be seen in Figure 2 which shows the ECDF of the validation errors of the architectures eval-
uated by each optimizer. As the computational budgets allocated to each optimizer vary widely, this
data does not allow for a fair comparison between the optimizers. However, it is worth mentioning
that the evaluations of BANANAS were focused on the best architectures, followed by PC-DARTS,
DE, GDAS, and RE. TPE only evaluated marginally better architectures than RS, while COMBO
and DARTS evaluated the worst architectures.
To visualize the coverage of the search space further, we performed a t-distributed Stochastic Neigh-
bor Embedding (t-SNE) (Maaten & Hinton, 2008) on the categorical architecture space, see Figure 4.
Besides showing a good overall coverage, some well-performing architectures in the search space
form distinct groups which are mostly located outside the main cloud of points. Similarly, we per-
formed a t-SNE visualization for each optimizer in a common t-SNE projection, demonstrating that
the different optimizers evaluate very different types of architectures (see Figure 12 in the appendix).

3.4   P ERFORMANCE STATISTICS

Figure 3 studies the interplay between validation errors, model parameters, and runtime. Generally,
as expected, models with more parameters are more costly to train but achieve lower validation error.
Training and test errors are highly correlated with a Kendall tau rank correlation of τ = 0.845
(Spearman rank corr. 0.966), minimizing the risk of overfitting on the validation error.
NAS-Bench-301 also avoids some shortcomings of NAS-Bench-101 and NAS-Bench-201 w.r.t. to
the training pipelines. In both NAS-Bench-101 and NAS-Bench-201 the training accuracy of many
of the evaluated architectures reaches 100% which is unrealistic in most practical settings, because
it is avoided by data augmentation techniques which are commonplace as data is usually scarce. In
NAS-Bench-201 the test error appears shifted higher compared to the validation error, pointing to
other shortcomings in their training pipeline. Our training pipeline described in detail section A.4,

                                                   5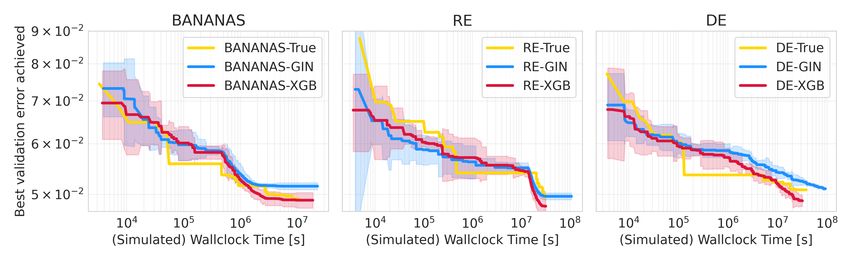
avoids these failures by utilizing many modern data augmentation techniques, leading to a more
realistic assessment of the architectures.

3.5    C ELL TOPOLOGY AND OPERATIONS

We now analyze the collected dataset for NAS-Bench-301 to
                                                                                              0.2   normal

                                                                          Validation error
gain some understanding of the influence of the cell topology                                       reduction
and the operations on the performance of the architectures in
the DARTS search space in our setting. The discovered prop-                                   0.1
erties of the search space then inform our choice of metrics for
the evaluation of different surrogate models.
                                                                                             0.05
We now study how validation error depends on the depth of                    3     4      5    6
architectures. Figure 5 visualizes the performance distribution                   Cell depth
for the normal and reduction cell depth2 via violin plots which
approximate empirical distributions with a kernel density esti- Figure 5: Distribution of the vali-
mation (Hwang et al., 1994). From the plot we can infer that dation error for different cell depth.
the performance distributions for the normal and reduction cell
are similar for the same cell depth. Although cells of all depths can reach high performances, shal-
lower cells seem slightly favored. Note that these observations are subject to changes in the hyper-
parameter setting, e.g. training for more epochs may render deeper cells more competitive. The
best found architecture has a normal and reduction cell of depth 4. We also show the distribution of
normal and reduction cell depths evaluated by each optimizer in Figure 14 in the appendix.
The DARTS search space contains operation choices without parameters such as Skip-Connection,
Max Pooling 3 × 3 and Avg Pooling 3 × 3. We visualize the influence of these parameter-free
operations on the validation error in the normal cell in Figure 7a. For the reduction cell we refer
to Figure 15 in the appendix. While pooling operations in the normal cell seem to have a negative
impact on performance, a small number of skip connections improves overall performance. This
is somewhat expected, since the normal cell is dimension preserving and skip connections help
training by improving gradient flow like in ResNets (He et al., 2016). For both cells, having many
parameter-free operations significantly deteriorate performance. We therefore would expect that a
good surrogate also models this case as a poorly performing region.

3.6    N OISE IN A RCHITECTURE E VALUATIONS

As discussed in Section 2, the noise in architecture evaluations
can be large enough for surrogate models to yield more real-
istic estimates of architecture performance than tabular bench-
mark based on a single evaluation per architecture. To study
the magnitude of this noise for NAS-Bench-301, we evaluated
500 architectures randomly sampled from our DE run with 5
different seeds.3 We also include other architectures that were
evaluated at least 5 times during the optimizer runs.
We find a mean standard deviation of 1.7e − 3 for the final
validation accuracy which is slightly less than the noise ob- Figure 6: Standard deviation of the
served in NAS-Bench-101 (Ying et al., 2019). Figure 6 shows validation accuracy for multiple ar-
that, while the noise tends to be lower for the best architec- chitecture evaluations.
tures, a correct ranking would still be hard based on a single
evaluation. Finally, we compare the MAE when estimating architecture performance from only one
sample to the results from Table 1. On the larger search space and with more evaluations we find an
MAE of 1.2e − 3 which is also slightly lower than found in NAS-Bench-101, one reason possibly
being a more robust training pipeline.

   2
      We follow the definition of cell depth used by Shu et al. (2020), i.e. the length of the longest simple path
through the cell.
    3
      We chose DE because it exhibits good exploration while achieving good performance, see Figure 12 in the
appendix.

                                                        6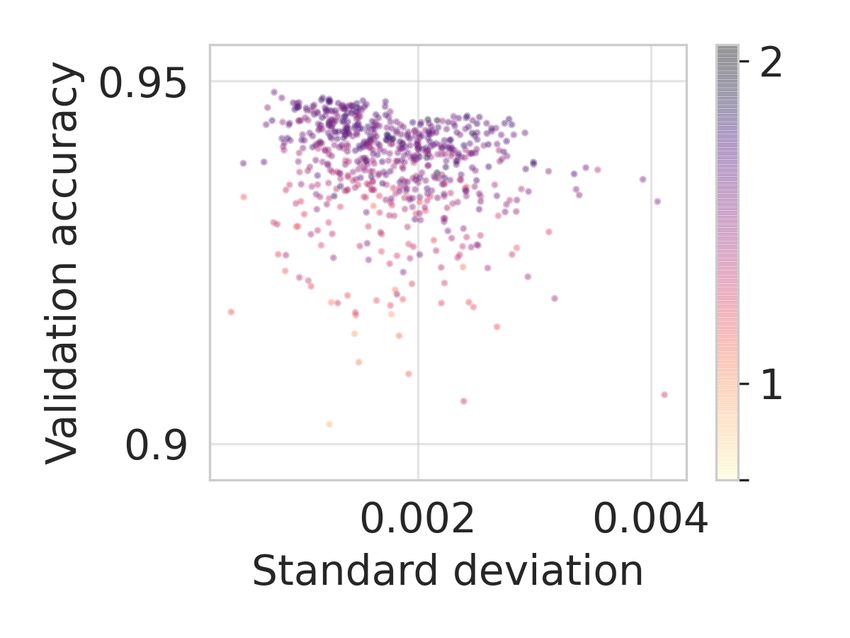
4     F ITTING S URROGATE M ODELS ON THE NAS-B ENCH -301 DATASET

In this section, we fit and evaluate a wide range of surrogate models to the NAS-Bench-301 dataset.
The predictions of any such regression model give rise to a surrogate NAS benchmark, but mod-
els that fit the true performance better can of course be expected to give rise to surrogate NAS
benchmarks whose characteristics are more similar to the ones of the original (non-surrogate) NAS
benchmark. Therefore, naturally, we strive for the best-fitting model. We emphasize that we do
not attempt to introduce a new regression model but rather build on the shoulders of the architec-
ture performance prediction community. As the state-of-the-art in this field improves, our surrogate
NAS benchmarks will only get better, and in order to facilitate progress along these lines, we are
collaborating with the Open Graph Benchmark (OGB) (Hu et al., 2020) to offer a public leaderboard.
The metrics we chose to evaluate different surrogate models take into account our goal of creat-
ing surrogate NAS benchmarks whose characteristics resemble the original (non-surrogate) NAS
benchmark they are based on. They include simple correlation statistics between predicted and true
performance of architectures, correlation statistics when evaluating on architectures sampled by a
new NAS optimizer not used for data collection, as well as qualitative evaluations of the model’s
behaviour when changing the cell topology and number of parameters. We also ensemble regressors
to obtain a predictive distribution and compare to the noise observed on groundtruth data. Finally,
in the next section, we will also study the actual resemblance of NAS optimizers’ trajectories on the
surrogate and original NAS benchmarks.

4.1   S URROGATE M ODEL C ANDIDATES

Deep Graph Convolutional Neural Networks are frequently used as NAS predictors (Friede et al.,
2019; Wen et al., 2019; Ning et al., 2020; Dwivedi et al., 2020). In particular, we choose the GIN
since several works have found that it performs well on many benchmark datasets (Errica et al., 2020;
Hu et al., 2020). We use the publicly available implementation from the Open Graph Benchmark (Hu
et al., 2020). This implementation uses virtual nodes (additional nodes which are connected to all
nodes in the graph) to boost performance as well as generalization and consistently achieves good
performance on their public leaderboards. Other GNNs from Errica et al. (2020), such as DGCNN
and DiffPool, performed worse in our initial experiments and are therefore not considered.
Following recent work in Predictor-based NAS (Ning et al., 2020; Xu et al., 2019b), we use a
per batch ranking loss, because the ranking of an architecture is equally important to an accurate
prediction of the validation accuracy in a NAS setting. We use the ranking loss formulation by
GATES (Ning et al., 2020) which is a hinge pair-wise ranking loss with margin m=0.1.
We compare the GIN to a large variety of regression models commonly used in Machine Learning.
We evaluate Random Forests (RF) and Support Vector Regression (SVR) using implementations
from Pedregosa et al. (2011). In addition, we compare with the tree-based gradient boosting methods
XGBoost (Chen & Guestrin, 2016) and LGBoost (Ke et al., 2017), which have recently been used
for predictor-based NAS (Luo et al., 2020).

4.2   E VALUATING THE DATA FIT
                                                                               Validation          Test
                                                                Model
Similarly to Wen et al. (2019); Baker et al. (2017) we                        R2      sKT     R2          sKT
assess the quality of the data fit via the coefficient of de-
                                                                GIN          0.809   0.787   0.804        0.782
termination (R2 ) and the Kendall rank correlation coeffi-      BANANAS      0.697   0.699   0.703        0.691
cient (τ ). However, Kendall τ is sensitive to noisy evalu-     XGBoost      0.890   0.821   0.886        0.820
ations that change the rank of an architecture. Therefore,      LGBoost      0.893   0.824   0.894        0.814
we follow the recent work by Yu et al. (2020) and use a         NGBoost      0.793   0.753   0.797        0.751
sparse Kendall Tau (sKT), which ignores rank changes at         RF           0.609   0.676   0.651        0.666
                                                                -SVR        0.687   0.678   0.676        0.665
0.1% accuracy precision, by rounding the predicted vali-        µ-SVR        0.685   0.665   0.675        0.662
dation accuracy prior to computing the Kendall Tau.
All hyperparameters of the models were tuned using              Table 3: Coefficient of determination
BOHB (Falkner et al., 2018) as a black-box optimizer.           R2 and sparse Kendall-τ rank correla-
Details on the hyperparameter search spaces for the re-         tion coefficient for different regression
spective surrogate models are given in Table 6 in the ap-       models used as surrogates.

                                                    7
Model No RE No DE No COMBO No TPE No BANANAS No DARTS No PC-DARTS No GDAS No RANDOM-WS
GIN 0.311 0.822 0.789 0.778 0.780 0.157 0.468 0.328 0.729
R2 LGB 0.928 0.884 0.921 0.854 0.862 -0.027 0.390 0.487 0.903
XGB 0.919 0.884 0.881 0.838 0.893 -0.104 0.430 0.682 0.949
GIN 0.806 0.756 0.752 0.716 0.542 0.713 0.467 0.575 0.771
sKT LGB 0.828 0.781 0.838 0.769 0.539 0.774 0.484 0.591 0.844
XGB 0.826 0.776 0.823 0.759 0.546 0.780 0.468 0.653 0.917
Table 4: Leave One-Optimizer-Out analysis results for a selection of the analyzed surrogate models.
Num avg pool 0.2 Num. avg. pool 0.2 Num. avg. pool
0.2 Num. max pool Num. max pool
Validation error
Num max pool Num. skip conn. Num. skip conn.
Validation error
Validation error
Num skip conn.
0.1 0.1 0.1
0.05 0.05 0.05
0 1 2 3 4 5 6 7 8 0 1 2 3 4 5 6 7 8 0 1 2 3 4 5 6 7 8
Num operations Num. operations Num. operations
(a) NAS-Bench-301 dataset (b) GIN (c) XGB
Figure 7: (Left) Distribution of validation error in dependence of the number of parameter-free
operations in the normal cell on the NAS-Bench-301 dataset. (Middle and Right) Predictions of
each surrogate model for the increase in no-parameter operations. The collected groundtruth data
is shown as scatter plot. Violin plots are cut off at the respective observed minimum and maximum
value.
pendix. We train using train/val/test splits (0.8/0.1/0.1) stratified on the optimizers used for the data
collection. We provide additional details on the preprocessing of the architectures for the surro-
gate models in Appendix A.2. As Table 3 shows, the three best performing models were LGBoost,
XGBoost and GIN; we therefore focus our analysis on these in the following.
4.3 L EAVE O NE -O PTIMIZER -O UT A NALYSIS
Since the aim of NAS-Bench-301 is to allow efficient benchmarking of novel NAS algorithms, it
is necessary to ensure that the surrogate model can deliver accurate performances on trajectories
by unseen optimizers. Similarly to Eggensperger et al. (2015), we therefore perform a form of
cross-validation on the optimizers we used for data collection. For this analysis we train the sur-
rogate model on the data from all but one optimizer (using a stratified 0.9/0.1 train/val split over
the optimizers). Then we predict the unseen results from the left-out optimizer to evaluate how
well the models extrapolate to the region covered by the ’unseen’ optimizer. We refer to this as the
leave-one-optimizer-out (LOOO) setting.
Results Table 2 shows the results for GIN, LGB and XGB. Overall, the rank correlation between
the predicted and observed validation accuracy remains high even when a well-performing optimizer
such as RE is left out. Leaving out BANANAS decreases the rank correlation, however the high R2
measure shows that the fit is good and the decrease in rank correlation can be explained by the
optimization of the acquisition function (which is based on mutating already found architectures).
The One-Shot optimizers PC-DARTS and GDAS appear the most challenging to predict in our
setting, however these are also the optimizers for which we have collected the fewest amount of data
(Table 2) and we are planning to include more architectures found by these optimizers in the near
future.
4.4 PARAMETER - FREE O PERATIONS
Several works have found that methods based on DARTS (Liu et al., 2019) are prone to finding
sub-optimal architectures that contain many, or even only, parameter-free operations (max. pooling,
avg. pooling or skip connections) and perform poorly (Zela et al., 2020a; Xu et al., 2020; Dong &
80.80
sKendall Tau
GIN Model Type MAE 1, [2, 3, 4, 5] Mean σ KL divergence
0.75 LGB Tabular 1.66e-3 1.7e-3 undefined
XGB GIN 1.64e-3 1.2e-3 3.2
LGB 1.44e-3 0.3e-3 63.1
0.70 XGB 1.46e-3 0.3e-3 113.9
3 4 5 6
Cell Depth
Figure 8: Comparison between GIN, XGB and Table 5: Metrics for the selected surrogate models
LGB on the cell topology analysis. on 500 architectures from our DE run that were
evaluated 5 times.
Yang, 2020). The surrogate models are evaluated by replacing a random selection of operations in a
cell with one type of parameter-free operations to match a certain ratio of parameter-free operations
in a cell. This analysis is carried out over the test set of the surrogate models and hence contains
architectures collected by all optimizers. For a more robust analysis, for each ratio of operations to
replace, we repeated this experiment 4 times.
Results Figure 7 shows that both the GIN and the XGB model correctly predict that accuracy
drops with too many parameter-free operations, especially for skip connections. The groundtruth of
architectures with only parameter-free operations is displayed as scatter plot. Out of the two models,
XGB better captures the slight performance improvement of using a few skip connections. LGB
failed to capture this trend but performed very similarly to XGB for the high number of parameter-
free operations.
4.5 C ELL T OPOLOGY A NALYSIS
We now analyze how well changes in the cell topology (rather than in the operations) are modeled
Q4
by the surrogates. We collected groundtruth data by evaluating all k=1 (k+1)k 2 = 180 different
cell topologies (not accounting for isomorphisms) with fixed sets of operations. We assigned the
same architecture to the normal and reduction cell, to focus on the effect of the cell topology. We
sampled 10 operation sets uniformly at random, leading to 1800 architectures as groundtruth for this
analysis.
We evaluate all architectures and group the results based on the cell depth. For each of cell depths
we then compute the sparse Kendall τ rank correlation between the predicted and true validation
accuracy.
Results Results of the cell toplogy analysis are shown in Figure 8. We observe that LGB slightly
outperforms XGB, both of which perform better on deeper cells. The GIN performs worst, but
manages to capture the trend towards better performance for deeper cells.
4.6 N OISE M ODELLING
Ensemble methods are commonly used to improve predictive performance (Dietterich, 2000). More-
over, ensembles of deep neural networks, so-called deep ensembles, have been proposed as a simple
way to additionally obtain predictive uncertainty (Lakshminarayanan et al., 2017). We therefore
create an ensemble of 10 base learners for each of our three best performing models (GIN, XGB,
LGB) using a 10-fold cross-validation for our train and validation split and different initializations.
We use the architectures with multiple evaluations (see Section 3.6) to perform a similar study as
in Section 2. We train an ensemble of surrogate models, using only one evaluation per architecture
(i.e., seed 1) and take the mean accuracy of the remaining ones as groundtruth (i.e., seeds 2-5). We
compare against a tabular model with just one evaluation (seed 1). Table 5 shows that the surrogate
models yield estimates closer to groundtruth than the table lookup based on one evaluation. This
confirms our main finding from Section 2, but this time on a much larger search space.
9Figure 9: Anytime performance of different optimizers on the real benchmark (left) and the surrogate
benchmark (GIN (middle) and XGB (right)) when training ensembles on data from collected from
all optimizers. Trajectories on the surrogate benchmark are averaged over 5 runs.
We also compare the predictive distribution of our ensembles to the groundtruth. To that end, we
assume normally distributed data and compute the KullbackLeibler divergence (KL divergence) be-
tween the groundtruth accuracy distribution and predicted distribution. We report the results in
Table 5. The GIN ensemble provides the closest estimate to the real distribution with a KL diver-
gence of 3.2 and a mean standard deviation of 1.2 e−3 which is closer to the groundtruth than LGB
and XGB.
5 A NALYZING NAS-B ENCH -301 AS A NAS B ENCHMARK
Having assessed the quality of the surrogate models on modeling the search space, we now use
NAS-Bench-301 to benchmark various NAS algorithms.
In addition to predicting the validation accuracy, it is necessary to predict the runtime of an archi-
tecture evaluation. This is achieved by training an LGB model with the runtime as targets. We
performed a separate HPO to obtain our runtime model (for details, see Appendix A.6.1).
5.1 U SING ALL DATA
We first compare the trajectories on the true benchmark and on the surrogate benchmark when
training the surrogate on all data. For the true benchmark, we show the trajectories contained in
our dataset (based on a single run, since we could not afford repetitions due to the extreme compute
requirements of > 107 seconds, i.e., 115 days, of GPU time for a single run). For the evaluations on
the surrogate, in contrast, we can trivially afford to perform multiple runs and provide error bars. For
the surrogate trajectories, we use an identical initialization for the optimizers (e.g. initial population
for RE) but evaluations of the surrogate benchmark are done by sampling from the surrogate model’s
predictive distribution for the architecture at hand, leading to different trajectories.
Results As Figure 9 shows, both the XGB and the GIN surrogate capture behaviors present on
the true benchmark. For instance, the strong improvements of BANANAS and RE are also present
on the surrogate benchmark at the correct time. In general, the ranking of the optimizers towards
convergence is accurately reflected on the surrogate benchmark. Also the initial random exploration
of algorithms like TPE, RE and DE is captured as the large initial variation in performance indicates.
Notably, the XGB surrogate exhibits a high variation in well-performing regions as well and seems
to slightly underestimate the error of the best architectures. The GIN surrogate, on the other hand,
shows less variance in these regions but slightly overpredicts for the best architectures.
An important feature of both the true and surrogate benchmark is the bad performance of random
search. Due to the size of the search space, random search is clearly outmatched by other algorithms
even after many evaluations, with BANANAS finding the best architectures orders of magnitude
faster. This stands in contrast to previous NAS benchmarks. For instance, NAS-Bench-201 (Dong
& Yang, 2020) only contains 6466 architectures in total, causing the median of random search runs
to find the best architecture after only 3233 evaluations.
10Figure 10: Anytime performance of differnet optimizers on the real benchmark and the surrogate
benchmark when using ensembles surrogate models without data from trajectories of the optimizer
under consideration.
5.2 L EAVE O NE -O PTIMIZER -O UT
To simulate benchmarking of novel algorithms, we expand on the leave one optimizer out analy-
sis from Section 4.3 by benchmarking optimizers with surrogate models that have not seen data
from their trajectories. We again compare the trajectories obtained from 5 runs on the surrogate
benchmark to the groundtruth.
Results Figure 10 shows the trajectories in the leave-one-optimizer-out setting. The XGB and
GIN surrogates again capture the general behavior of different optimizers well, illustrating that
characteristics of new optimization algorithms can be captured with the surrogate benchmark.
6 G UIDELINES FOR U SING NAS-B ENCH -301 AND S URROGATE
B ENCHMARKS
To ensure realistic and fair benchmarking of NAS algorithms, we recommend certain best prac-
tices. This is particularily important for a surrogate benchmark, since abusing knowledge about the
surrogate model can lead to the design of algorithms that overfit to the surrogate benchmark. The
following provides a checklist, for clean benchmarking on NAS-Bench-301:
• The surrogate model should be treated as a black-box function and hence only be used for query-
ing. We strongly discourage approaches which e.g. use gradients with respect to the input graphs
to search directly within the embedding space created by our surrogates models as this would
likely lead to overfitting to our benchmark.
• We only recommend using surrogate models whose characteristics match those of the true bench-
mark as closely as possible. So far, we make available three surrogate NAS benchmarks, using
our LGB, XGB, and GIN models.
• We will collect more training data, which will further improve the model fits. Because of this, to
preserve comparability of results in different published papers, we believe version numbers are
crucial. So far, we release NB301-LGB-v0.9, NB301-XGB-v0.9, and NB301-GIN-v0.9.
We encourage the community to propose a wide range of additional surrogate NAS benchmarks, us-
ing different search spaces, datasets, and problem domains. We encourage the creators of such NAS
benchmarks to follow the same principles we followed to gather data from random configurations
and a broad range of state-of-the-art architectures, and to check their predictions both qualitatively
and quantitatively.
7 R ELATED W ORK
7.1 E XISTING NAS BENCHMARKS
Benchmarks for NAS were introduced only recently with NAS-Bench-101 (Ying et al., 2019) as the
first among them. NAS-Bench-101 is a tabular benchmark consisting of ∼423k unique architectures
11in a cell structured search space evaluated on CIFAR-10 (Krizhevsky, 2009). To restrict the number
of architectures in the search space, the number of nodes and edges was restricted and only three
operations are considered. One result of this limitation is that One-Shot NAS methods can only be
applied to subspaces of NAS-Bench-101, given in NAS-Bench-1Shot1 (Zela et al., 2020b).
NAS-Bench-201 (Dong & Yang, 2020), in contrast, uses a search space with a fixed number of nodes
and edges, hence allowing for a straight-forward application of one-shot NAS methods. However,
its search space only has 4 intermediate nodes, limiting the total number of unique architectures
to as few as 6466. NAS-Bench-201 includes evaluations of all these architectures on three dif-
ferent datasets, namely CIFAR-10, CIFAR-100 (Krizhevsky, 2009) and Downsampled Imagenet
16×16 (Chrabaszcz et al., 2017), therefore allowing for transfer learning experiments.
NAS-Bench-NLP (Klyuchnikov et al., 2020) was recently proposed as a tabular benchmark for NAS
in the Natural Language Processing domain. The search space closely resembles NAS-Bench-101
by limiting the number of edges and nodes to constrain the search space size resulting in over 14k
evaluated architectures.
Recent works have shown that search spaces offered by current NAS benchmarks and search spaces
typically used to perform NAS for deployment exhibit significantly different characteristics. For
instance, local search achieves state-of-the-art results on current benchmarks but performs poorly
on the search space used by DARTS (White et al., 2020b). Our proposed NAS-Bench-301 differs
from previous NAS benchmarks in that it covers a significantly larger search space. We overcome
this limitation by proposing the first surrogate benchmark for NAS that allows coverage of the full
DARTS search space.
7.2 N EURAL N ETWORK P ERFORMANCE P REDICTION
There exist several works on predicting NN performance based on their neural architecture, training
hyperparameters, and initial performance. Domhan et al. (2015) used MCMC to extrapolate perfor-
mance only from the initial learning curve, while Klein et al. (2017) constructed a Bayesian NN for
learning curve prediction that also includes architectural features and hyperparameters; Baker et al.
(2017) used traditional regression models to predict final performance based on an initial learning
curve and architectural features.
A more recent line of work in performance prediction focuses more on the featurized representa-
tion of neural architectures. Peephole (Deng et al., 2017) considers only forward architectures and
aggregate the information about the operations in each layer using an LSTM. Similarly, TAPAS (Is-
trate et al., 2019) uses an encoding like Peephole but extends the framework to deal with multiple
datasets following the life-long learning setting. An interesting alternative route to represent neural
architectures was taken by BANANAS (White et al., 2019) which introduced a path-based encoding
of cells that automatically resolves the computational equivalence of two architectures and used it
to train a performance predictor to guide Bayesian optimization.
Graph Neural Networks (GNNs) (Gori et al., 2005; Kipf & Welling, 2017; Zhou et al., 2018; Wu
et al., 2019) with their capability of learning representations of graph-structured data appear to be a
natural choice to learning embeddings of NN architectures. Shi et al. (2019) and Wen et al. (2019)
trained a Graph Convolutional Network (GCN) on a subset of NAS-Bench-101 (Ying et al., 2019)
showing its effectiveness in predicting the performance of unseen architectures. Moreover, Friede
et al. (2019) propose a new variational-sequential graph autoencoder (VS-GAE) which utilizes a
GNN encoder-decoder model in the space of architectures and generates valid graphs in the learned
latent space.
Several recent works further adapt the GNN message passing to embed architecture bias via extra
weights to simulate the operations such as in GATES (Ning et al., 2020) or integrate additional
information on the operations (e.g. flop count) (Xu et al., 2019b).
An interesting alternative route was taken by Tang et al. (2020) who operate GNNs on relation
graph based on architecture embeddings in a metric learning setting allowing them to pose NAS
performance prediction in a semi-supervised setting.
We use methods from NN performance prediction to create our surrogate model. By making our
NAS-Bench-301 training dataset publicly available, we hope to foster benchmarking of performance
12prediction methods via the Open Graph Benchmark (OGB) (Hu et al., 2020) interface. Since our
surrogate NAS benchmark is not commited to a certain performance prediction method, future ad-
vances in this field can also yield improvements of our surrogate benchmark.
8 C ONCLUSION & F UTURE W ORKS
We proposed NAS-Bench-301, the first surrogate benchmark for Neural Architecture Search and
first to cover the full, popular DARTS search space with 1018 architectures which is orders of mag-
nitude larger than all previous NAS benchmarks. Our new benchmark addresses the challenge of
benchmarking NAS methods on realistic search spaces, caused by the computational burden of fully
training an architecture, by replacing the evaluation of an architecture with querying a surrogate
model. We collected data on the DARTS search space by running multiple optimizers on it, includ-
ing random search, and explored the resulting dataset. We used this dataset to train and compare
different regressor models to serve as surrogate model. Finally, we have demonstrated our surrogate
benchmark to accurately and cheaply recover characteristics of different state-of-the-art NAS opti-
mizers found on the true DARTS search space at a fraction of the cost. We hope that NAS-Bench-301
can provide a cheap, yet realistic benchmark to compare new NAS optimziers and allow for fast pro-
totyping. We expect more surrogate benchmarks to be introduced in the future which we expressly
welcome.
R EFERENCES
Proceedings of the International Conference on Learning Representations (ICLR’17), 2017. Pub-
lished online: iclr.cc.
Noor Awad, Neeratyoy Mallik, and Frank Hutter. Differential evolution for neural architecture
search (dehb). In International Conference on Machine Learning (ICLR) Neural Architecture
Search (NAS) Workshop, 2020.
Bowen Baker, Otkrist Gupta, Ramesh Raskar, and Nikhil Naik. Accelerating Neural Architecture
Search using Performance Prediction. In NIPS Workshop on Meta-Learning, 2017.
Ricardo Baptista and Matthias Poloczek. Bayesian optimization of combinatorial structures. In
International Conference on Machine Learning, pp. 462–471, 2018.
J. Bergstra, R. Bardenet, Y. Bengio, and B. Kégl. Algorithms for hyper-parameter optimization. In
J. Shawe-Taylor, R. Zemel, P. Bartlett, F. Pereira, and K. Weinberger (eds.), Proceedings of the
25th International Conference on Advances in Neural Information Processing Systems (NIPS’11),
pp. 2546–2554, 2011.
Han Cai, Ligeng Zhu, and Song Han. Proxylessnas: Direct neural architecture search on target task
and hardware. In International Conference on Learning Representations, 2019.
Han Cai, Chuang Gan, Tianzhe Wang, Zhekai Zhang, and Song Han. Once-for-all: Train one
network and specialize it for efficient deployment. In International Conference on Learning
Representations, 2020. URL https://openreview.net/forum?id=HylxE1HKwS.
Tianqi Chen and Carlos Guestrin. Xgboost: A scalable tree boosting system. In Proceedings of the
22nd acm sigkdd international conference on knowledge discovery and data mining, pp. 785–794,
2016.
Liu Chenxi, Chen Liang Chieh, Schroff Florian, Adam Hartwig, Hua Wei, Yuille Alan L., and
Fei Fei Li. Auto-deeplab: Hierarchical neural architecture search for semantic image segmenta-
tion. In Conference on Computer Vision and Pattern Recognition, 2019.
Patryk Chrabaszcz, Ilya Loshchilov, and Frank Hutter. A downsampled variant of imagenet as an
alternative to the cifar datasets. arXiv preprint arXiv:1707.08819, 2017.
Boyang Deng, Junjie Yan, and Dahua Lin. Peephole: Predicting network performance before train-
ing. arXiv preprint arXiv:1712.03351, 2017.
13T. Dietterich. Ensemble Methods in Machine Learning, volume 1857 of Lecture Notes in Computer
Science. Springer Berlin Heidelberg, 2000.
T. Domhan, J. T. Springenberg, and F. Hutter. Speeding up automatic hyperparameter optimization
of deep neural networks by extrapolation of learning curves. In Q. Yang and M. Wooldridge (eds.),
Proceedings of the 25th International Joint Conference on Artificial Intelligence (IJCAI’15), pp.
3460–3468, 2015.
Xuanyi Dong and Yi Yang. Searching for a robust neural architecture in four gpu hours. In Proceed-
ings of the IEEE Conference on Computer Vision and Pattern Recognition (CVPR), pp. 1761–
1770, 2019.
Xuanyi Dong and Yi Yang. Nas-bench-102: Extending the scope of reproducible neural architec-
ture search. In International Conference on Learning Representations, 2020. URL https:
//openreview.net/forum?id=HJxyZkBKDr.
Vijay Prakash Dwivedi, Chaitanya K Joshi, Thomas Laurent, Yoshua Bengio, and Xavier Bresson.
Benchmarking graph neural networks. arXiv preprint arXiv:2003.00982, 2020.
K. Eggensperger, F. Hutter, H.H. Hoos, and K. Leyton-Brown. Efficient benchmarking of hyperpa-
rameter optimizers via surrogates. In B. Bonet and S. Koenig (eds.), Proceedings of the Twenty-
nineth National Conference on Artificial Intelligence (AAAI’15), pp. 1114–1120. AAAI Press,
2015.
Thomas Elsken, Jan Hendrik Metzen, and Frank Hutter. Efficient multi-objective neural architec-
ture search via lamarckian evolution. In International Conference on Learning Representations,
2019a.
Thomas Elsken, Jan Hendrik Metzen, and Frank Hutter. Neural architecture search: A survey.
Journal of Machine Learning Research, 20(55):1–21, 2019b.
Federico Errica, Marco Podda, Davide Bacciu, and Alessio Micheli. A fair comparison of graph neu-
ral networks for graph classification. In International Conference on Learning Representations,
2020. URL https://openreview.net/forum?id=HygDF6NFPB.
Stefan Falkner, Aaron Klein, and Frank Hutter. BOHB: Robust and efficient hyperparameter op-
timization at scale. In Jennifer Dy and Andreas Krause (eds.), Proceedings of the 35th Inter-
national Conference on Machine Learning, volume 80 of Proceedings of Machine Learning Re-
search, pp. 1437–1446, Stockholmsmässan, Stockholm Sweden, 10–15 Jul 2018. PMLR. URL
http://proceedings.mlr.press/v80/falkner18a.html.
Matthias Fey and Jan E. Lenssen. Fast graph representation learning with PyTorch Geometric. In
ICLR Workshop on Representation Learning on Graphs and Manifolds, 2019.
David Friede, Jovita Lukasik, Heiner Stuckenschmidt, and Margret Keuper. A variational-sequential
graph autoencoder for neural architecture performance prediction. ArXiv, abs/1912.05317, 2019.
Marco Gori, Gabriele Monfardini, and Franco Scarselli. A new model for learning in graph domains.
In Proceedings. 2005 IEEE International Joint Conference on Neural Networks, 2005., volume 2,
pp. 729–734. IEEE, 2005.
Kaiming He, Xiangyu Zhang, Shaoqing Ren, and Jian Sun. Deep Residual Learning for Image
Recognition. In CVPR, 2016.
Weihua Hu, Matthias Fey, Marinka Zitnik, Yuxiao Dong, Hongyu Ren, Bowen Liu, Michele Catasta,
and Jure Leskovec. Open graph benchmark: Datasets for machine learning on graphs. arXiv
preprint arXiv:2005.00687, 2020.
Jenq-Neng Hwang, Shyh-Rong Lay, and Alan Lippman. Nonparametric multivariate density esti-
mation: a comparative study. IEEE Transactions on Signal Processing, 42(10):2795–2810, 1994.
Roxana Istrate, Florian Scheidegger, Giovanni Mariani, Dimitrios Nikolopoulos, Costas Bekas, and
A Cristiano I Malossi. Tapas: Train-less accuracy predictor for architecture search. In Proceed-
ings of the AAAI Conference on Artificial Intelligence, volume 33, pp. 3927–3934, 2019.
14Guolin Ke, Qi Meng, Thomas Finley, Taifeng Wang, Wei Chen, Weidong Ma, Qiwei Ye, and Tie-
Yan Liu. Lightgbm: A highly efficient gradient boosting decision tree. In I. Guyon, U. V. Luxburg,
S. Bengio, H. Wallach, R. Fergus, S. Vishwanathan, and R. Garnett (eds.), Advances in Neural
Information Processing Systems 30, pp. 3146–3154. Curran Associates, Inc., 2017.
Thomas N. Kipf and Max Welling. Semi-supervised classification with graph convolutional net-
works. In International Conference on Learning Representations (ICLR), 2017.
A. Klein, S. Falkner, J. T. Springenberg, and F. Hutter. Learning curve prediction with Bayesian
neural networks. In Proceedings of the International Conference on Learning Representations
(ICLR’17) icl (2017). Published online: iclr.cc.
Nikita Klyuchnikov, Ilya Trofimov, Ekaterina Artemova, Mikhail Salnikov, Maxim Fedorov, and
Evgeny Burnaev. Nas-bench-nlp: Neural architecture search benchmark for natural language
processing. arXiv preprint arXiv:2006.07116, 2020.
A. Krizhevsky. Learning multiple layers of features from tiny images. Technical report, University
of Toronto, 2009.
Balaji Lakshminarayanan, Alexander Pritzel, and Charles Blundell. Simple and scalable predic-
tive uncertainty estimation using deep ensembles. In Advances in neural information processing
systems, pp. 6402–6413, 2017.
Gustav Larsson, Michael Maire, and Gregory Shakhnarovich. Fractalnet: Ultra-deep neural net-
works without residuals. In ICLR, 2017.
Liam Li and Ameet Talwalkar. Random search and reproducibility for neural architecture search. In
Proceedings of the Thirty-Fifth Conference on Uncertainty in Artificial Intelligence, UAI 2019,
Tel Aviv, Israel, July 22-25, 2019, pp. 129, 2019. URL http://auai.org/uai2019/
proceedings/papers/129.pdf.
M. Lindauer, K. Eggensperger, M. Feurer, A. Biedenkapp, J. Marben, P. Mller, and F. Hutter.
Boah: A tool suite for multi-fidelity bayesian optimization & analysis of hyperparameters.
arXiv:1908.06756 [cs.LG], 2019.
Marius Lindauer and Frank Hutter. Best practices for scientific research on neural architecture
search. arXiv preprint arXiv:1909.02453, 2019.
Hanxiao Liu, Karen Simonyan, and Yiming Yang. DARTS: Differentiable architecture search. In
International Conference on Learning Representations, 2019.
I. Loshchilov and F. Hutter. Sgdr: Stochastic gradient descent with warm restarts. In International
Conference on Learning Representations (ICLR) 2017 Conference Track, April 2017.
Renqian Luo, Xu Tan, Rui Wang, Tao Qin, Enhong Chen, and Tie-Yan Liu. Neural architecture
search with gbdt. arXiv preprint arXiv:2007.04785, 2020.
Laurens van der Maaten and Geoffrey Hinton. Visualizing data using t-sne. Journal of machine
learning research, 9(Nov):2579–2605, 2008.
Niv Nayman, Asaf Noy, Tal Ridnik, Itamar Friedman, Rong Jin, and Lihi Zelnik. Xnas: Neural
architecture search with expert advice. In H. Wallach, H. Larochelle, A. Beygelzimer, F. d Alché-
Buc, E. Fox, and R. Garnett (eds.), Advances in Neural Information Processing Systems 32, pp.
1975–1985. Curran Associates, Inc., 2019.
Xuefei Ning, Yin Zheng, Tianchen Zhao, Yu Wang, and Huazhong Yang. A generic graph-based
neural architecture encoding scheme for predictor-based nas. arXiv preprint arXiv:2004.01899,
2020.
Changyong Oh, Jakub Tomczak, Efstratios Gavves, and Max Welling. Combinatorial bayesian
optimization using the graph cartesian product. In Advances in Neural Information Processing
Systems, pp. 2910–2920, 2019.
15Fabian Pedregosa, Gaël Varoquaux, Alexandre Gramfort, Vincent Michel, Bertrand Thirion, Olivier
Grisel, Mathieu Blondel, Peter Prettenhofer, Ron Weiss, Vincent Dubourg, et al. Scikit-learn:
Machine learning in python. Journal of machine learning research, 12(Oct):2825–2830, 2011.
Hieu Pham, Melody Y. Guan, Barret Zoph, Quoc V. Le, and Jeff Dean. Efficient neural architecture
search via parameter sharing. Arxiv, 1802.03268, 2018.
Kenneth Price, Rainer M Storn, and Jouni A Lampinen. Differential evolution: a practical approach
to global optimization. Springer Science & Business Media, 2006.
Esteban Real, Alok Aggarwal, Yanping Huang, and Quoc V Le. Regularized evolution for image
classifier architecture search. In Proceedings of the aaai conference on artificial intelligence,
volume 33, pp. 4780–4789, 2019.
T. Saikia, Y. Marrakchi, A. Zela, F. Hutter, and T. Brox. Autodispnet: Improving disparity estimation
with automl. In IEEE International Conference on Computer Vision (ICCV), 2019. URL http:
//lmb.informatik.uni-freiburg.de/Publications/2019/SMB19.
Han Shi, Renjie Pi, Hang Xu, Zhenguo Li, James T Kwok, and Tong Zhang. Multi-objective
neural architecture search via predictive network performance optimization. arXiv preprint
arXiv:1911.09336, 2019.
Yao Shu, Wei Wang, and Shaofeng Cai. Understanding architectures learnt by cell-based neu-
ral architecture search. In International Conference on Learning Representations, 2020. URL
https://openreview.net/forum?id=BJxH22EKPS.
Christian Szegedy, Wei Liu, Yangqing Jia, Pierre Sermanet, Scott Reed, Dragomir Anguelov, Du-
mitru Erhan, Vincent Vanhoucke, and Andrew Rabinovich. Going deeper with convolutions. In
Computer Vision and Pattern Recognition (CVPR), 2015. URL http://arxiv.org/abs/
1409.4842.
Mingxing Tan, Bo Chen, Ruoming Pang, Vijay Vasudevan, and Quoc V. Le. Mnasnet: Platform-
aware neural architecture search for mobile. 2019 IEEE/CVF Conference on Computer Vision
and Pattern Recognition (CVPR), pp. 2815–2823, 2018.
Yehui Tang, Yunhe Wang, Yixing Xu, Hanting Chen, Boxin Shi, Chao Xu, Chunjing Xu, Qi Tian,
and Chang Xu. A semi-supervised assessor of neural architectures. In Proceedings of the
IEEE/CVF Conference on Computer Vision and Pattern Recognition (CVPR), June 2020.
Wei Wen, Hanxiao Liu, Hai Li, Yiran Chen, Gabriel Bender, and Pieter-Jan Kindermans. Neural
predictor for neural architecture search. arXiv preprint arXiv:1912.00848, 2019.
Colin White, Willie Neiswanger, and Yash Savani. Bananas: Bayesian optimization with neural
architectures for neural architecture search. arXiv preprint arXiv:1910.11858, 2019.
Colin White, Willie Neiswanger, Sam Nolen, and Yash Savani. A study on encodings for neural
architecture search. arXiv preprint arXiv:2007.04965, 2020a.
Colin White, Sam Nolen, and Yash Savani. Local search is state of the art for nas benchmarks. arXiv
preprint arXiv:2005.02960, 2020b.
Zonghan Wu, Shirui Pan, Fengwen Chen, Guodong Long, Chengqi Zhang, and Philip S Yu. A
comprehensive survey on graph neural networks. arXiv preprint arXiv:1901.00596, 2019.
Keyulu Xu, Weihua Hu, Jure Leskovec, and Stefanie Jegelka. How powerful are graph neural
networks? In International Conference on Learning Representations, 2019a. URL https:
//openreview.net/forum?id=ryGs6iA5Km.
Yixing Xu, Yunhe Wang, Kai Han, Hanting Chen, Yehui Tang, Shangling Jui, Chunjing Xu, Qi Tian,
and Chang Xu. Rnas: Architecture ranking for powerful networks. ArXiv, abs/1910.01523, 2019b.
Yuhui Xu, Lingxi Xie, Xiaopeng Zhang, Xin Chen, Guo-Jun Qi, Qi Tian, and Hongkai Xiong.
Pc-darts: Partial channel connections for memory-efficient architecture search. In International
Conference on Learning Representations, 2020. URL https://openreview.net/forum?
id=BJlS634tPr.
16You can also read