The space weather station at the University of Alcala - Journal of Space Weather and Space Climate
←
→
Page content transcription
If your browser does not render page correctly, please read the page content below
J. Space Weather Space Clim. 2021, 11, 24
Ó A. Guerrero et al., Published by EDP Sciences 2021
https://doi.org/10.1051/swsc/2021007
                                                                                                                                     Available online at:
                                                                                                                                    www.swsc-journal.org
Topical Issue - Space Weather Instrumentation
 TECHNICAL ARTICLE                                                                                                               OPEN          ACCESS

The space weather station at the University of Alcala
Antonio Guerrero*, Consuelo Cid, Alberto García, Emilio Domínguez, Fernando Montoya, and Elena Saiz
Space Weather research group, Physics and Mathematics Dpt., Universidad de Alcalá, Plaza San Diego s/n,
28801 Alcalá de Henares, Madrid, Spain

              Received 31 May 2020 / Accepted 16 February 2021

              Abstract – The Space Weather station at the University of Alcala (UAH-STA) is a place for instrumenta-
              tion that is able to produce useful products and services even in a worst case scenario (when power grid
              and/or communications have been compromised), assuring the access of critical data to decision-makers
              and consequently, increasing the confidence to take actions. The current development consists of an
              antenna to monitor ionospheric disturbances through the reception of very low frequency waves and a
              magnetometer to indicate the geomagnetic disturbances caused by sources external to the Earth. This work
              shows the development of both instruments and some examples of ionospheric and geomagnetic events
              recorded by both of them. This project serves also as a success story of using space weather as a teaching
              tool due to the involvement of undergraduate students at their final stage of industrial and telecommunica-
              tion engineering.

              Keywords: space weather instrumentation / magnetometer / VLF antenna / resilience

1 Introduction                                                                    space weather incstrumentation might be housed and operated
                                                                                  from facilities that are not dedicated to space weather
     Space weather is a natural hazard being officially recognized                 monitoring.
nationally in some countries around the world, with a growing                         The Space Weather (SWE) station (STA) at the University of
interest in others. Monitoring space weather should be a priority                 Alcala (UAH), UAH-STA, is conceived as a resilient system
for our highly technology-dependent society. For risk manage-                     for monitoring real time space weather activity able to work in
ment, resilience of the instruments that provide measurements                     the worst situation, i.e. without dependencies on other infrastruc-
is a mandatory feature. However, the question is: Are we aware                    tures. The design allows sufficient information for decision-
of the resilience limits of the systems that are monitoring space                 makers even during hazardous space weather conditions.
weather activity? Many of the measurements used in monitoring                     Moreover, the station has been successfully used as a lab for
and forecasting space weather are recorded by instruments on                      students where they are able to design, test and improve their
board spacecraft. These measurements include but are not                          knowledge. The station is operated by students in a win-
limited to flaring activity, solar disc and coronal imaging, solar                 win situation; it provides training for students in a real environ-
particle events, solar wind plasma parameters or interplanetary                   ment and their involvement facilitates the operation of the station.
magnetic field data. Many of these measurements are only pos-                          At the time of writing this paper, the UAH-STA consists of
sible by going into space. Thus, one drawback is the increased                    two instruments: a Very Low Frequency (VLF) antenna and a
vulnerability of space-based instrumentation to adverse condi-                    magnetometer. The involvement of students in these two instru-
tions that might impact observations or even damage instru-                       ments is described in Section 2. The instruments are described
ments, which, of course, might be the case during major space                     in Sections 3 and 4. Section 5 describes common infrastructure
weather events. Ground measurements are also involved in space                    and future development of the instruments. Finally, our conclu-
weather services, for example, ground magnetic field, iono-                        sions appear in Section 6.
spheric parameters or solar images at certain wavelengths. All
space weather instruments and facilities have requirements, in
terms of ground-based instruments they might be constraints                       2 Students involvement in space weather
related to environmental cleanliness, or even potential access
                                                                                    development. A win-win situation
difficulties in certain conditions, and these can lead to particular
vulnerabilities or limitations. In some ground-based systems the
                                                                                    We cannot deny space weather is a discipline in growth.
*
    Corressponding author: aguerrero@uah.es                                       We are still discovering new effects of solar activity in our

     This is an Open Access article distributed under the terms of the Creative Commons Attribution License (https://creativecommons.org/licenses/by/4.0),
                  which permits unrestricted use, distribution, and reproduction in any medium, provided the original work is properly cited.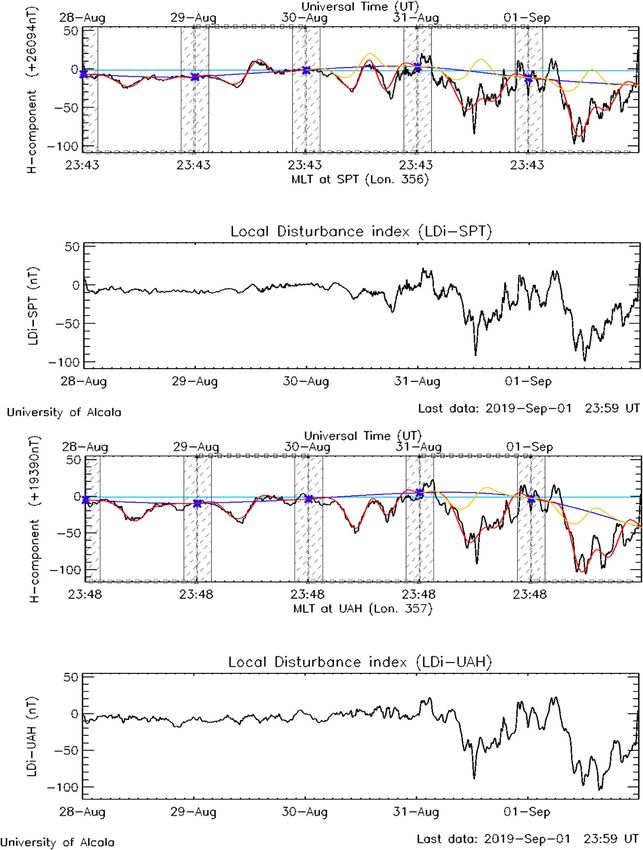
A. Guerrero et al.: J. Space Weather Space Clim. 2021, 11, 24

technology as well as new ways to detect and measure those             analyze and identify noise sources versus real geomagnetic
effects. This situation is an excellent breeding ground for fresh      variations.
minds like those of students at undergraduate level and higher.             Moreover, the students work did not end with these projects
The UAH-STA is a successful story that proves the involvement          as they continue being involved in the interpretation of data and
of students as a win-win situation.                                    operation of the instruments. Monitoring the correct functioning
     In this scenario, the VLF monitoring station at the Univer-       of the instruments at early stages of developments is a must and
sity of Alcala was conceived at a very first stage as an academic       students are actively involved in these activities. Unexpected
project to involve graduate students in space weather and              shutdowns were successfully recovered, sometimes with the
research activities. Two first-year undergraduate students              need of getting physically into the installation. Apart from
showed interest in the project from the beginning, getting them        increasing availability, every time the Sun was active they were
involved through the years until presenting the work as final           analyzing the outputs and even tuning parameters in order to
degree projects (García, 2019; Montoya, 2019). Their first work         better capture disturbances.
focused on getting a prototype of the instrument working and                The work presented in the following sections is the result of
able to measure the activity of the Sun. After successfully            the involvement of students in hands-on development and oper-
capturing some flares, the students got quickly engaged in              ation of space weather instrumentation and is a good model for
designing and building a system optimized for their own engi-          space weather application, particularly for modest ground-based
neering requirements. The UAH-VLF system was separated in              stations, as well as for the development of future workers in the
two parts, the antenna system (including preamplifier) and the          space weather discipline. Whilst space weather makes use of
data acquisition system. Each student was responsible for one          major space-based instrumentation developed by multinational
of the parts. Nonetheless, they had to communicate to each             consortia, this project demonstrates that, the field also requires
other and work together integrating both parts as an individual        smaller, accessible ground-based systems that can be run, effec-
system. Alberto García was responsible for the antenna design          tively, with quite modest resources.
and the circuitry that preamplified the antenna signal. This work
is described in Sections 3.1 and 3.2. Fernando Montoya was
responsible for the development of the data acquisition unit           3 The UAH-VLF monitoring station
described in Section 3.4. Their work was not exclusively
focused on the systems engineering part, because they were                 Solar flares are powerful releases of electromagnetic energy
involved also in understanding the data when the Sun was both          in the solar atmosphere, which are observed at all wavelengths
active and quiet. They solved problems by their own and                from radio waves to gamma-rays. For flaring monitoring, major
searched for answers to explain the observations. Some results         agencies rely nowadays on measurements of solar soft X-ray
were presented at the 15th European Space Weather Week in              emission such as from the GOES spacecraft observations,
2018.                                                                  although other ground-based flare monitoring activity exist,
     The UAH-MAG has a similar timeline, it started as a project       e.g. in H-alpha observations. Nevertheless, flares can also be
to involve students in a previous prototype with a configuration        monitored by considering the propagation of radio waves of dis-
of three single low-cost sensors and data acquisition system           tant VLF transmitters (Stokes, 1989; Raulin et al., 2010; Wenzel
based on Arduino (an open-source electronic prototyping                et al., 2016; George et al., 2019), which not only gives informa-
platform). Although this first prototype gave satisfactory results,     tion about the flare but also about the actual impact on the Earth.
the errors involved in the final construction were not acceptable       When the electromagnetic energy released during solar flares
for an operational use mainly due to error on orthogonality            reaches the Earth, it is absorbed in the upper terrestrial
between the three axis (three individual axis were acquired from       atmosphere and greatly enhance ionization of neutral species,
manufacturer and a single three-axis sensor was constructed out        including oxygen and nitrogen (Mitra, 1974). One of the effects
of them without proper construction and calibration tools).            of this ionization is the lowering of the effective height of the
Later, the research group acquired three-axis sensor with better       D-region, the lowest region of the Earth’s ionosphere, affecting
sensitivity and was able to obtain data with the required quality.     the propagation of VLF radio waves (3–30 kHz), which
The process of setting up such a system requires also knowledge        propagate using the Earth-ionosphere channel as a waveguide.
and specialized work in order to obtain measurements useful for        When a flare occurs, the local electron density increases altering
space weather purposes. Emilio Domínguez, a student in indus-          the VLF wave path, causing registered wave amplitude and
trial engineering at the time had to work on different aspects of      phase to be disturbed too, especially on very long transmission
the project in order to get the results presented in his final degree   paths (Bracewell et al., 1949).
project (Domínguez, 2019) summarized in Section 4. The first                The relationship between the phase delay perturbations and
stage was the design and construction of connection wires for          received VLF amplitude versus the peak of the X-ray flux was
the different electronic modules that compose the whole                investigated in previous studies (McRae & Thomson, 2004;
system. These involved communication wires as well as power            Thomson et al., 2005; Kumar & Kumar, 2018). A strong,
cables together with the provision of the proper power source          almost linear correlation between the logarithm of the peak
for the equipment. Another stage of the project was the study          X-ray flux and the measured phase change was found by
of the place for the first measurements, evaluating the quality         Thomson et al. (2005). This trend allowed to give the size of
of the data and management of the data transmission channel            the greatest solar flare on 4 November 2003, which saturated
and power supply facilities. Again, in this project, the student       the GOES X-ray detectors. Regarding the received VLF
was involved in more than just getting a system recording the          amplitude, Thomson et al. (2005) obtained that it increases
data. He had to interpret what the measurements showed and             with the flare power, but not in a linear trend. On contrary,

                                                               Page 2 of 13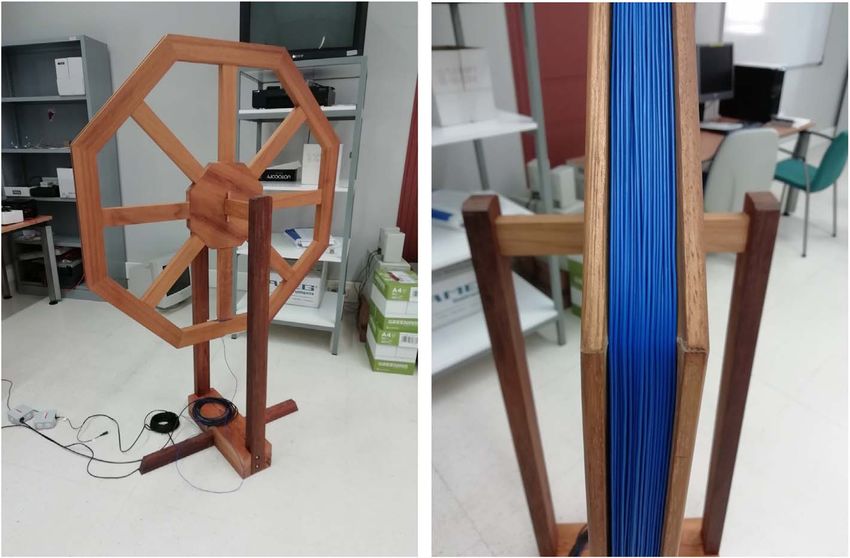
A. Guerrero et al.: J. Space Weather Space Clim. 2021, 11, 24

Kumar & Kumar (2018) found that the solar flare-associated             a very large loop can be a problem during the manufacturing
enhancements on both the amplitude and phase of VLF signals           process.
vary proportionally with the logarithm of the X-ray flux.                   Combining efficiency and easiness of construction, an
    Nowadays, the UAH-VLF station consists of a VLF antenna           octagon is a decent bet, as it only has a 6% area reduction over
receiver and a set of data acquisition, data storage and graph        a circle while being easy to build. For this specific case, a total
generation software. It is located at the University of Alcala        of 250 m of wire have been used which, when arranged in an
in Spain (40° 300 N, 3° 210 W) and has turned into an essential       octagon of side length 44.9 cm, produced a total of 68 turns.
instrument for flaring monitoring in Spain. Hopefully one day it       This provides a total effective area of 69.22 m2 which translates
will be part of (at least) a European network of VLF antennas,        into an effective height of 29 mm at 20 kHz.
possibly along with other existing facilities such as those                Regarding the physical build, the structure of the antenna
described by Biagi et al. (2015) and Raulin et al. (2009), or         must be able to withstand adverse weather conditions in case
in partnership with new ones dedicated to space weather               it is placed outside. Electrical conducting materials should be
purposes. The UAH-SWE group has already taken initiatives             avoided, as they would form a loop by themselves and, while
(at the International Workshop “Ionosphere at low frequency”          plastic fits our electromagnetic requirements, it is sometimes
(http://esters.obspm.fr/spip.php?article84) together with Paris       difficult to build a structure that can support itself without defor-
observatory to form such a European network with these                mations. This can be solved by using proper wood that can
specific purposes.                                                     withstand outdoor conditions. From the wide range available,
                                                                      iroko wood was chosen to build the structure. This type of wood
3.1 The antenna design                                                is commonly used in boats and doors and requires minimum
                                                                      maintenance. Several beams were given to a carpenter, with
    Common types of antennas that are used in VLF frequency           the instructions to build an octagon with its support structure.
range are monopoles (whip) antennas, dipoles and loop anten-          The resulting masterpiece is shown in Figure 1. It has to be
nas. As it is not possible to build antennas comparable to the        noted that no screws or nails were used to join the different
size of a wavelength in this frequency range, these will all          pieces of wood, just wood joinery techniques. Once the struc-
belong to the so called electrically small antennas category.         ture is complete, the loop can be wound. Using 23 American
Whip antennas and dipoles couple to the electric field of the          wire gauge (AWG) solid core copper wire a total of 68 turns
incoming wave, while loops couple to the magnetic field. While         were made. These all fit in a groove carved on the wood in
whip antennas and dipoles have omnidirectional patterns in            the side of the loop, shown in Figure 1. Finally, once the coil
azimuth when used for vertical polarization, loops do not. This       is complete, in order to improve interference rejection, the
may be seen as an advantage as it allows us to monitor stations       exceeding length of the wires must be twisted until they are
from different directions. However, it also leads to a higher         soldered to the coaxial cable.
level of interference as they can be picked up from any direc-             The electrical properties of the antenna were studied with a
tion. On the other hand, small loop antennas provide two sharp        lumped element model with a non ideal load recreating a
nulls on azimuth. These can be used to attenuate interference         passive filter. Modelling these components has no standard
sources when carefully placed. These reasons lead us to choose        procedure and the result might always differ from real values.
the so called Small Magnetic Loop (SML) antenna for the               Taking into account resistance, capacitance and inductance
UAH-VLF station. This choice has previously shown to be a             parameters calculated with the help of the formulas given in
good practice as in the Stanford Space Weather monitor project        Grover (2004) inductance the cut off frequency was found over
(http://solar-center.stanford.edu/SID/).                              100 kHz, far from the frequencies of interest.
    Unregarding the orientation of the antenna, the effective
height of an SML measures how well an antenna converts the            3.2 The circuitry: preamplifier and power supply
receiving fields into electrical signals, so it has to be maximized.
The expression for the effective height is given by equation (1):         Although some kits are readily available for the preamplifier
                                                                      and power supply (The Stanford SuperSID is now available
                                 2pNS
                           hef ¼                             ð1Þ      throughout the Society of Amateour Radio Astronomers
                                   k                                  (http://www.radio-astronomy.org/contact/SuperSID)) the design
where N is the number of turns, S the area enclosed by the coil       and development of these circuits can be used as an educational
and k is the wavelength.                                              practice for engineering students. With this purpose in mind and
    The length of the wire used for the loop sets a limit in the      taking as a reference the Atmospheric Weather Electromagnetic
highest frequency able to record due to inductive effects. It is      System for Observation, Modeling, and Education (AWE-
then necessary to optimally wind the loop to get the highest          SOME) receiver (Cohen et al., 2009), a prototype was built
effective area possible for a given wire length. Considering          around a common personal computer (PC) sound card which
the area of a regular polygon of n sides enclosed by a fixed           would sample the signal coming out of the antenna. These sound
perimeter, the best approach will be a circumference, but this        cards usually come in a range of sampling rates, from the typical
shape can pose a problem for the construction.                        44 kHz to the high end 192 kHz (due to Nyquist-Shannon
    Maximizing hef can be done both, increasing the number of         Sampling Theorem, the highest frequency able to recover will
loops, N, and/or increasing the area enclosed by the antenna, S,      be half the sampling frequency). Additionally, using a PC would
for the same length of wire. Considering again the length of the      satisfy several needs as the storage media, sampling device and
wire as the primary limiting factor for the loop antenna,             network connection are easily available. It also provides enough
the equation for hef shows a dependence with N1. Thus, a             computing power to compute the Fast Fourier Transform (FFT)
big single loop would be the best theoretical option, but again,      in real time. Gaps in the recorded data are filled with NaN

                                                              Page 3 of 13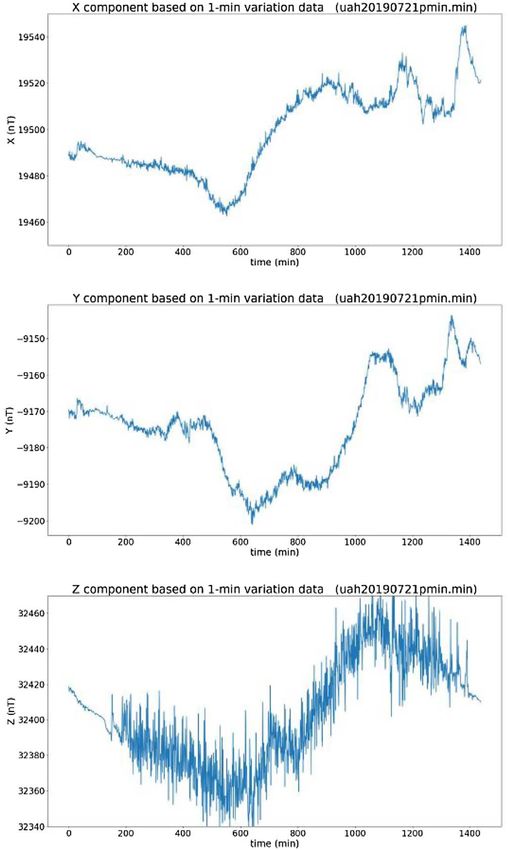
A. Guerrero et al.: J. Space Weather Space Clim. 2021, 11, 24

Fig. 1. Antenna structure with an octagon shape (left) and coil winding (right).

Fig. 2. Simplified block diagram of the complete system.

(Not a Number) to avoid transients when applying the digital            arrangement of the elements by placing the element that offer
processing algorithms and to ensure that all logs have the same         gain at the beginning of the chain.
number of samples.                                                          Instead of sending DC over a cable all the way up to the
    The signal levels coming out of the loop are too weak to be         amplifier, it was decided to send the AC output of a transformer
used, so they need to be boosted. As the antenna is conceived to        which also suits the selected power supply topology. The con-
be placed far away from the computer, the signal will travel            nections of the whole system are made up of 3.5 mm audio
over relatively long wires. This makes amplification necessary           jacks.
to give the level of signal to noise ratio needed at the other              The amplification uses a design in two stages. The first one
end. In addition, an active filter will filter out unwanted               is suited by the instrumentation amplifier INA128 by Texas
frequencies.                                                            Instruments providing an output proportional to the voltage dif-
    The simplified block diagram for the complete system                 ference between the two inputs. The instrumentation amplifier is
appears in Figure 2. It consists of an amplifier with noise figure        configured using the AC-coupled design given in its datasheet
F2 and gain G2, a filter with attenuation L3, and the cables that        using an operational amplifier (OPA2228D) as feedback to
carry the signal from the antenna to the amplifier and to the            create an active filtering stage. The second stage uses also an
computer modeled as passive purely resistive attenuators with           operational amplifier and offers a low pass filter with variable
attenuation L1 and L4 respectively. The receiver chain can be           gain and fixed cut off frequency.
characterized with its total gain and the noise factor. Though              The power supply for the amplifier is also part of the
the total gain is determined by the gain of the filter and the atten-    UAH-VLF design. When testing the amplifier, the current con-
uation of the cables, the noise factor can be optimized with the        sumption was measured to be close to 20 mA, thus a linear

                                                               Page 4 of 13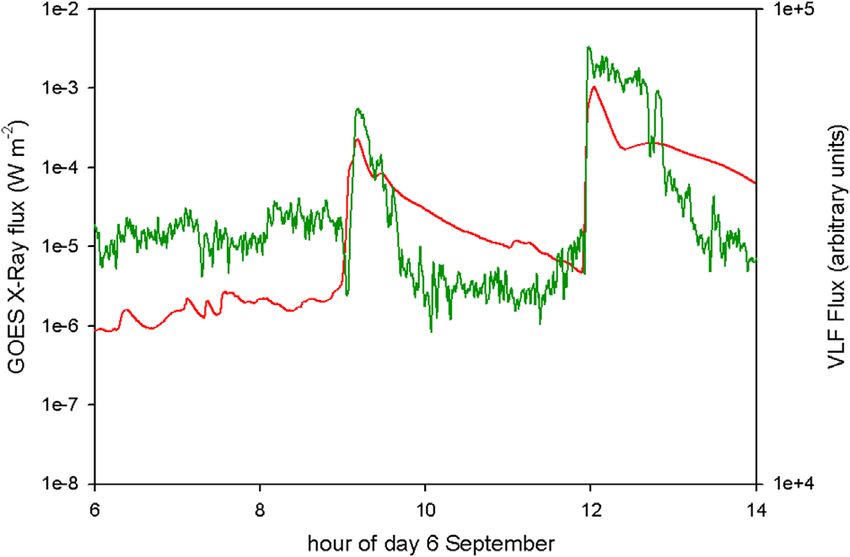
A. Guerrero et al.: J. Space Weather Space Clim. 2021, 11, 24

power supply suits our needs as it offers a high ripple rejection
and at the same time it is easy to design and build. In addition,
we are also avoiding the switching noise of switched mode
power supplies. In our design, the transformer sits next to the
computer and sends the low voltage AC power to the rest of
the circuit (used for rectification), which is right next to the
antenna and the preamplifier. The rectification circuit converting
AC to DC is composed of a full bridge rectifier and a linear
voltage regulator (LM317). This regulator gives up to 100 mA
and its output voltage can be configured with two resistors.
    Once the system was all set up, a computer was configured
with the SuperSID software, coded by EricGibert, available at
GitHub (http://github.com/ericgibert/supersid). This software
controls all the sampling and logging tasks that are required
to monitor the selected frequencies, and outputs the raw data
to a file. Data were taken at 5 s sampling period and then filtered    Fig. 3. Superposed plot of the GOES X-ray flux (red) and the
by a moving average of 13 points. The data are plotted by an         amplitude of GQD recorded at UAH receiver (green) from 6 to 14
adaptation by Alberto García of the SuperSID plotting code           UT on 6 September 2017.
to include additional functionality which is available at GitHub
(http://github.com/AlbertoGM97/sid_plot). The real time output
as well as an archive are kept at http://vlf.spaceweather.es.
                                                                     by the sound card. This design has been properly tested and
3.3 From raw data to space weather monitoring                        offers also specific functionality and options in its own display.
                                                                     The device is planned to be installed in the next update of the
    The current UAH-VLF version uses the design shown                UAH-VLF.
previously and gives real time plots that can be accessed at              After studying different approaches from different micro-
the previously given website. This design was motivated by           controllers available in the market, the choice was a system
the results from a previous prototype that was able to capture       based on the Arduino Due board. The study took into account
the intense flaring activity in September 2017. This first proto-      microcontrollers with good embeded analog to digital convert-
type of the VLF monitoring system consisted of PVC structure         ers (ADC), like ST Microelectronics family and simple micro-
and a crude preamplifier and power source implementation but          controllers with its own external ADC designed for this kind
demonstrated the possibilities of a monitoring station.              of signal. Arduino is an open-source electronics platform based
    A prototype was ready by July 2017 at the Polytechnic            on easy-to-use hardware and software. The flexibility of its
school. While in the training phase, several anomalies were          Integrated Development Environment (IDE), the accessible
recorded due to the flaring activity of AR12674 in September          libraries and the hardware built to work together with it, could
2017. These anomalies showed us that the UAH-VLF monitor-            facilitate the work of integrating all the components of the sys-
ing station was working properly, although in a noisy environ-       tem. About the available boards, the requirements of the project
ment and motivated the improvement for a more robust system          made the choice difficult because the microprocessors offered
(shown in Fig. 1). Due to low solar activity after the new system    by this platform usually have low capabilities and are used
was set up, the results in this paper belongs to the prototype.      for low requirements. The typical boards are Arduino UNO,
However, minor flares have been recorded by the new system.           with an 8-bit processor with 20 MHz, and Arduino Mega, with
Figure 3 shows two flares happening on 6 September 2017 as            more input and outputs ports but with an 8-bit processor with
recorded by GOES in soft X-ray 0.1–0.8 nm flux and by the             16 MHz also. On the other hand, Arduino has a board based
amplitude of the UAH-VLF receiver when monitoring the                on the well-known 32-bit Cortex-M3 processor, called Arduino
19.6 kHz signal emitted by the Anthorn Ratio Station transmit-       Due. This board implements the AT91SAM3X8E microcon-
ter with the call sign GQD at Anthorn, UK (54.911° N,                troller with 32-bit bus, clock speed of 84 MHz, Direct Memory
3.280° W), with a time resolution of 5 s.                            Access (DMA) hardware, 12-bits ADC up to 1 msps (mega
    While time resolution is crucial for determining when a          samples per second), and so on.
flare event starts, has its maximum, etc., it leads to a sparse            The heart and brain of the system is this Arduino board. The
spectrum where the flare information is concentrated at the           rest of the hardware that complement the system is an TFT
lowest frequencies. This increases the total noise bandwidth         Screen, a Real Time Clock (RTC), SD memory card and
and lets high frequency interferences get through which can          another microcontroller called ESP8266. The TFT screen is
mask out smaller events. To solve this, a two stage digital          designed to show a menu when the system is turned on. You
FIR filter was designed to remove these effects, featuring a zero     can select four options that is, basically, to view the signal in
phase total response and side lobes below 40 dB on each stage       real time that the board is processing, view the spectrum of that
(for more information see García, 2019).                             signal, select 4 frequency components to store in both the SD
                                                                     card and in the SWE-UAH server, and the option to start
3.4 An alternative data acquisition unit                             logging the data of this 4 frequency components selected. Each
                                                                     frequency component corresponding to each receiving VLF
    The UAH-VLF monitor includes also a data acquisition unit        station. The purpose of the RTC is to keep the time with an
designed to substitute a personal computer and sampling device       accuracy of about ± 50 parts per million.

                                                             Page 5 of 13
A. Guerrero et al.: J. Space Weather Space Clim. 2021, 11, 24
To store the data, the system starts to sample the input and This simplified picture sets the measurements of the geomag-
store the digital values in a buffer in memory. When the buffer netic field on the ground as a primary and an essential tool to
is empty, a Fast Fourier Transform is applied to decompose the monitor and diagnose space weather activity.
signal in its frequency components and then store the amplitude Geomagnetic observatories around the world usually need
of 4 frequencies selected in other buffer. When a minute is two sets of equipment to precisely measure the geomagnetic
passed, the microcontroller takes the average of the values field for long periods. One of the systems is dedicated to mea-
stored in this set of time and, with this final value, the system sure the absolute magnitude of the geomagnetic field vector
stores the data. The data stored is a csv file in the SD card that while the other system is dedicated to the variation (variome-
shows in each row the 4 frequencies and its corresponding ters). For space weather purposes the information given from
amplitudes with the timestamp at the end of the row. In addition variometers is more relevant at current stage of knowledge.
to this, the system sends this average value through a serial Geomagnetic stations with variometer only equipment are much
communication to the other microcontroller (ESP8266) in order more simpler to design, install and operate. This fact has
to upload the data to the SWE-UAH server. Once uploaded the resulted in an increase of geomagnetic stations around the world
data is publicly available for users and/or forecasters with a in the last decades and the creation of initiatives like SuperMAG
delay of minutes after the value is obtained. (Gjerloev, 2009) to compile most of these data. The magne-
The ESP8266 is a low-cost Wi-Fi chip that implements a tometer station UAH-MAG was born in this context (although
TCP/IP complete stack and a processor called Tensilica Xtensa the data are not currently uploaded to SuperMAG it could be
with 32 bits and 80MHz. Although the processor is nearly the so in the future), with the specific purpose to serve as an
same as AT91SAM3X8E, the poor Input/Output (I/O) capabil- indicator of regional geomagnetic disturbances integrated in
ity and the low memory capacity do not allow us to implement the global objectives of the UAH-STA given in Section 5. This
all functions on it. This chip can be programmed through section describes the development of the instrument and its
Arduino IDE as well. A simple program is stored in its memory current state.
to communicate with the Arduino Due to receive the data and
then upload them through a GET command (HTTP protocol) 4.1 Configuration of the system
to the server. In the server there is a php web page that receives
the data and saves them in a text file which can be viewed The basic equipment for measuring geomagnetic distur-
through the internet. bances consists of a tri-axial fluxgate sensor, an analog to digital
The screen used is a 2.800 SPI module based on an ILI9341 converter and a computer to register the data. This basic equip-
controller. This screen has also a touch panel that lies under the ment is enhanced with data processing techniques focused on
display. Furthermore, the PCB of the screen counts also with a removing environmental noise and solar regular variations in
SD slot and the corresponding tracks to implement the SPI pro- order to be left with a useful signal representing geomagnetic
tocol also with this memory hardware. For these reasons disturbances from sources external to the Earth. pffiffiffiffiffiffi
together with the existence of an Arduino Due library to handle The magnetometer sensor is a low noise (25 pT/ Hz at
this controller using the DMA, this choice fitted very well our 1 Hz) and low power (3.3–3.7 V) LEMI-031 from Lemi LLC
purposes. (http://www.lemisensors.com). It is also characterized by a
The RTC is based on the DS323 chip. This clock is used to low temperature drift (< 1.5 nT/°C). The analog signals from
give the timestamp of the samples in order to know when the the three axis channels go to the 24-bits analog/digital converter
signal is processed. The system creates in the SD card the file ObsDAQ from MinGeo Ltd (http://www.mingeo.com) which
corresponding with the current day named according to the year, are sampled simultaneously and then recorded by its compan-
month and day. ion computer MAGREC-4B. This equipment has previously
Another specific implementation on the system, which was shown to be capable of recording 1 s resolution with the
part of a bachelor thesis (Montoya, 2019), is the code to calcu- INTERMAGNET quality standard (Pedersen & Merenyi,
late the Fast Fourier transform. The tests to check the complex- 2016). The configuration and setup test of the system was also
ity of the algorithms for the Discrete Fourier Transform (DFT) part of an academic project at the Polythecnic school
and the FFT were also part of the work. For more details we (Domínguez, 2019). It is important to state that comparing
refer the reader to the cited work. Current data recorded by with similar equipment, and collaboration between institutes
the SWE-UAH station can be accessed publicly at http://sta. with similar equipment, world-wide, is essential as it allows
spaceweather.es. for event confirmation and better coverage, as well as for
standardization.
All connection cables between components of the system
were created for this purpose as well as power cables and power
4 The magnetometer station: UAH-MAG source for the components. The only exception to this was the
connection from the sensor to the conditioning board (pre-
The primary tools traditionally used to study solar-terrestrial amplifier) which was provided by the manufacturer. From the
relations are geomagnetic indices, which have been used to pre-amplifier to the Obs-DAQ we use a 10-m cable with
characterize geomagnetic variations due to forces that are 12 wires of 0.5 mm section and shielded for interference. Each
external to the Earth. The irregular geomagnetic variations axis of the sensor gives a differential signal with a common
caused by solar activity are also one of the main sources respon- virtual ground for the three of them, thus, only seven wires
sible for disruption of technology. In consequence, geomagnetic are needed for the signal of the three components. Two more
indices are mainly produced by removing the contributions of wires are used to power the device from a regulated power
regular variations to geomagnetic measurements on the ground. supply giving a constant 3.5 V (recommended 3.3–3.7 V).
Page 6 of 13A. Guerrero et al.: J. Space Weather Space Clim. 2021, 11, 24
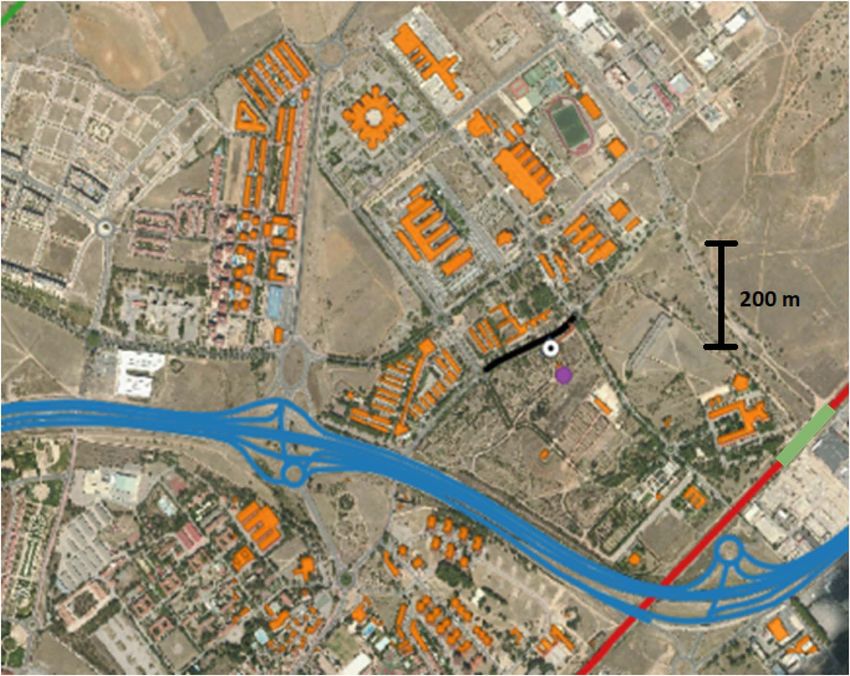
Fig. 4. Map showing the environment surrounding the station. The black dot inside a small white circle shows the location of the
magnetometer test recordings. The Madrid-Barcelona highway is shown in blue, railways are marked in red and close buildings are colored in
orange.
The cable is connected to the conditioning board by a single Botanical Garden of the UAH (Real Jardín Botánico Juan
connector with 10 pins (one is unused). On the other side of Carlos I) which provided easy power supply (although no inter-
the cable, the Obs-DAQ needs separated differential inputs for net connection). All the results shown on this paper comes from
each of the axis. These are provided by USB type B mini this location. After all the test runs, the system was unmounted
connectors. and ready to be placed at its definitive location with better
The connection between Obs-DAQ and MAGREC uses the infrastructure (see Sect. 4.3) before the COVID-19 lock-down
manufacturer recommended configuration, which is the RS485 prevented further activities here.
connector on the Obs-DAQ side and the COM3 on the The Royal Botanical Garden and its surroundings are not an
MAGREC side. The computer (MAGREC) runs a linux system environmentally clean place for placing a magnetometer as we
and manufacturer software already installed on it. The communi- show herein, but it has other advantages which are highlighted
cation with Obs-DAQ is configured for automatic control of the for the main purposes of this paper and specifically for the
bit rate. The software (MAGLIN) is configured to output the data purposes of real time space weather monitoring. The test place
in files following IAGA2002 format for both 1 s and 1 min data. is located at latitude: 40°300 27.0000 N and longitude:
The scale factor of each component is given as a first approxima- 3°200 37.4700 W. Figure 4 shows the location of the sensor and
tion as the inverse of the differential sensitivity given by the the house for the rest of the equipment with a white dot. There
manufactured sensor (60 lV/nT) in volts to satisfy the units is a road close to the building highlighted with a black line.
requested by the software (nT/V). Configuration parameters Even though the road is not the main road of the University
for the A/D conversion (input range, full-scale, sample rate, campus, it is frequently used to access the surrounding faculty
etc) are also those recommended by the manufacturer. buildings. The blue lines mark the national highway from
Madrid to Barcelona, which is one of the busiest highways in
4.2 Test location and first measurements the country. The red line marks the railways which are powered
by high DC voltage. The orange layer shows the location of
At the time of writing this paper the UAH-MAG was buildings. Those closer to the magnetometer station are within
already tested satisfactorily on a location of The Royal the university campus.
Page 7 of 13A. Guerrero et al.: J. Space Weather Space Clim. 2021, 11, 24
The data acquisition system is placed inside the house where
the system is plugged in to conventional power supply. The
sensor was placed outside the house using the 10 m cable and
measurements were taken over the surface of the ground
1.5 m high. The sensor was inside a cork box to reduce temper-
ature effects and the box inside another one to provide protec-
tion against rain and other problems like animals or insects.
For the purpose of this first test, the sensor was oriented
with the X component pointing north with the help of a
compass. Orthogonality between components is assured by
the manufacturer (three axis embedded together) and horizontal
orientation tested with a spirit level. For space weather purposes
the horizontal component of the geomagnetic field gives the
most useful source of information, thus, the primary efforts must
be taken to the correct orientation for horizontal level than for
north orientation of the X component. The reason is that orthog-
onality between the north component (X) axis sensor and the
east component (Y) axis sensor is assured by construction and
the horizontal component (H) of the geomagnetic field does
not depend on the relative orientation of these axes with real
north. It is important to mention here that the configuration of
the sensor outside the house does not isolate completely from
temperature drifts giving important measure drifts (A. Guerrero et al.: J. Space Weather Space Clim. 2021, 11, 24
Fig. 6. Comparison of the 5 days of recordings from UAH-MAG and SPT observatory during a geomagnetic event. From top to bottom:
temperature recorded at a weather station (3170Y), the recorded raw data from the magnetometer sensor, magnetometer signal corrected for
temperature and noise, data from SPT observatory and scatter plot of UAH-MAG vs. SPT data with the regression fitting line and parameters
obtained.
for space weather purposes. The purpose of this section is to producing a Local Disturbance index (LDi). The method is
show that even in a noisy environment the instrument can be specially designed for mid latitudes, able to run in real time
used for space weather purposes. A local geomagnetic index and with high resolution data (1 min). It is in a high state of
is already part of the products offered by the Spanish Space development, given by an Applicability User Level of nine
Weather Service led by the SWE-UAH group, obtained from (AUL-9) (see Cid et al., 2019; Halford et al., 2019 for more
measurements of an official INTERMAGNET observatory of information). The LDi procedure has been applied to UAH-
the Iberian Peninsula. The data are processed by a patented tech- MAG (temperature) corrected data satisfactorily. The accom-
nique property of University of Alcala (Guerrero et al., 2016) plished results are given in Figure 7 together with a comparison
Page 9 of 13A. Guerrero et al.: J. Space Weather Space Clim. 2021, 11, 24
Fig. 7. Two top panels: curves involved in the procedure to obtain the Local Disturbance index (LDi) and the result for SPT data. Two bottom
panels are equivalent for UAH-MAG data. Red curves are the solar regular variation fitting to the data, yellow lines are the adopted solar quiet
curves, the blue line is an auxiliary curve for the calculations and the green line is the baseline considering secular variation.
with the results of applying LDi procedure to SPT data. All stream coming from a coronal hole on the Sun). The top panel
panels show the same time range as the Section 4.2, selected shows the signals involved in the LDi calculations. The shaded
because of the presence of disturbed periods on the last 2 days area marks local night time, the top axis gives UT time and the
of the figure (geomagnetic storm associated to fast solar wind bottom axis gives magnetic local time. Since the longitude of
Page 10 of 13A. Guerrero et al.: J. Space Weather Space Clim. 2021, 11, 24
the UAH-MAG location is only 4 degrees from Greenwich the data close to the service provider (currently, the scientist).
meridian, the difference between them is only 17 min. The base- That means that every step in the communication path has to
line taking into account secular variation is given by the light be powered by a secured and independent source. For example,
blue line close to zero on the plot. Be aware that the plot Y axis mobile communication systems are not considered as they
has an offset given by the number in parenthesis in the same depend on systems out of the research group control. Systems
axis title. The dark blue line is an auxiliary trend line obtained that work with long range communication protocols like LoRa
from night time values and used only for other calculations in (Long Range) are being considered to extend the capabilities.
the procedure. The red line is the fitting of the model to the data Furthermore, future developments of the station are focus on
(recreating the Solar Regular variation) and the yellow line is expanding the reception of UAH-VLF to capture the phase of
the actual data used as Solar Quiet for that day. The procedure the signal, which requires a system with better time keeping
is able to discriminate between quiet and disturbed periods and accuracy. The instrument will be improved also by adding the
select the closest solar quiet data when disturbed period is capability to receive signals in any direction. This feature can
detected. LDi data can be obtained by subtracting the baseline be achieved with different approaches. The antenna structure
and solar quiet data from the measurements. The result for can rotate and the system will sample the signal with the angular
SPT data (LDi-SPT) is shown in the second panel (this is the reference in order to identify the sources. Another option is to
reference for comparison of the index obtained from an official have two antennas perpendicular to each other in order to be
observatory). The third and fourth panels are the equivalent able to reconstruct the signals coming from any direction.
panels for the case of UAH-MAG data. The results show low In terms of software, the system can be improved updating
discrepancies between both of them (second and fourth panels) the capabilities to record not only some frequencies (specific
even though UAH-MAG measurements were taken under test stations) but the whole spectrum, which requires a vast amount
conditions, with no recording of the temperature of the sensor of data storage. A proper analysis of the data in real time could
and even on a noisy environment. help to reduce space keeping only most relevant signals. In the
case of UAH-MAG, the priority is to place the instrument in a
fixed place with either sensor temperature registration or
5 Common infrastructure and future temperature control environment. Then, the instrument will
undergo full calibration at an official geomagnetic observatory.
development
The long-term goal is to be able to reproduce the instruments in
other locations. The purpose is to be able to monitor ground dis-
The UAH-STA is in its first stage of development and the turbances with a higher spatial resolution than the current one
next step will pursue a common infrastructure for communica- and have redundancy if possible. The motivation can be found
tion and power source for the instruments following three main in recent results that show that some extreme geomagnetic
goals (an important point about these goals is that they are disturbances, usually thought to be a global effect caused by
compatible with the educational purposes mentioned throughout the enhancement of ring current are indeed more isolated that
the paper): previously known. Even the extreme local geomagnetic distur-
bance recorded at Colaba observatory during the Carrington
– To be able to keep the data safe and close (no more than a event could be the result of having the right sensor (Colaba
few kilometers) to the institution location providing the magnetometer) at the right spot and not the result of a global
services. disturbance. For more information about this issue and how
– To have independent (from other institutions) power localized can be these type of disturbances (see Cid et al., 2015).
sources infrastructure capable to maintain operational
activities.
– To obtain the lowest cost that allows proper space weather
activities. 6 Conclusions
The first goal is accomplished by placing the instruments The (UAH-STA) is conceived as a system capable of
close to the University campus where the research group has obtaining space-weather products on its own, reducing external
their activities. The second goal needs independent power dependencies to other systems to zero. We have also tried to
sources and redundancy if possible. In our case, power will reduce the distance to the station from working offices to a
come from solar panels that will charge a bank of batteries. minimum not to interrupt decision-maker actions when they
Redundancy will be accomplished by a gas power supply and are more important, at high risk of technological disruptions.
at last by traditional power source. In this configuration, the tra- These design pre-requisites make the station a good model easy
ditional power grid source is the last option in case other sources to replicate at other locations, whilst also allowing it to be scaled
are not available. The solar panels are already in the definitive up. In the development of the instrumentation we have consid-
location for the UAH-STA within The Botanical Garden but ered low-cost materials whenever possible.
the existing batteries still need to be tested for proper operations. The UAH-VLF instrument started with previous designs
When the power source is working properly, both instruments from other institutions already known to work properly and it
UAH-VLF and UAH-MAG, will be installed at the same loca- evolved to a new system where all hardware parts were specif-
tion. The UAH-MAG station needs to be properly calibrated at ically designed from scratch. This type of instrument, where
a reference observatory. VLF signals from very far stations are processed in order to
The data transfer system relies on its own infrastructure obtain useful space weather information, falls into an uncom-
(communication and power source) with the goal of placing mon area of science and technology joint together. This fact
Page 11 of 13A. Guerrero et al.: J. Space Weather Space Clim. 2021, 11, 24
provides advantages and disadvantages. On one hand, it makes application of the AULs framework. Space Weather 18(1):
it difficult to find the best design and configuration that gives the e2019SW002171. https://doi.org/10.1029/2019SW002171.
best achievable result. The final goal must be the scientific Cohen MB, Inan US, Paschal EW. 2009. Sensitive broadband ELF/
and/or operational results that should come out of them, but VLF radio reception with the AWESOME instrument. IEEE Trans
sometimes this falls in a field under development, so that engi- Geosci Remote Sens 48(1): 3–17. https://doi.org/10.1109/
neering requirements could not be easily imposed. This also TGRS.2009.2028334.
opens up the door for advantages in the sense that hardware Domínguez E. 2019. Puesta en funcionamiento de un magnetómetro
and software designs are more flexible. It is this flexibility that incluyendo estudio de ubicación, control de ruido electro-
magnético e influencia de la temperatura para su posterior
may result in new scientific results and sometimes unexpected
instalación. Bachelor thesis, University of Alcala. Available at
uses.
http://hdl.handle.net/10017/39514
The current setup of the UAH-MAG uses a tri-axial sensor García A. 2019. Design and construction of a VLF monitoring station
with better characteristics and data acquisition system designed for solar flare detection. Bachelor thesis, University of Alcala.
to record geomagnetic data and improved over a long period of Available at http://hdl.handle.net/10017/38751.
years. The LDi processing technique added to the data acquired George HE, Rodger CJ, Clilverd MA, Cresswell-Moorcock K,
from the sensor complies the removal of a baseline and the quiet Brundell JB, Thomson NR. 2019. Developing a nowcasting
day regular variation, which allows to offer a real time indica- capability for X-class solar flares using VLF radiowave propaga-
tion of the local geomagnetic disturbance caused by sources tion changes. Space Weather 17(12): 1783–1799. https://doi.org/
external to the Earth. 10.1029/2019SW002297.
The station is now on its first stage, but has shown to be able Gjerloev J. 2009. A global ground-based magnetometer initiative.
to operate in a harsh environment commonly thought not to Eos Trans AGU 90(27): 230–231. https://doi.org/10.1029/
work for these type of instruments. The current set of instru- 2009EO270002.
ments is able to monitor solar flares (probably those with erup- Grover FW. 2004. Inductance calculations: working formulas and
tive signatures) and to monitor local geomagnetic disturbances, tables. Courier Corporation. ISBN 0-486-49577-9.
which are the primary space weather diagnosis tool. The fruitful Guerrero A, Cid C, Saiz E, Palacios J, Cerrato Y. 2016. Dispositivo y
results shown in this paper give support to step forward in the procedimiento de obtencion de la perturbacion geomagnetica local
development of an operational space weather station capable a latitudes medias. Spanish Patent Office (WO2017174843A1).
of offering exclusive products by exploiting new instrument Available at https://patents.google.com/patent/WO2017174843A1.
designs and the use of new data processing techniques. Halford AJ, Kellerman AC, Garcia-Sage K, Klenzing J, Carter BA,
This project also proves the capability of space weather as a et al. 2019. Application usability levels: a framework for tracking
project product progress. J Space Weather Space Clim 9: A34.
teaching tool. Three students from industrial and telecommuni-
https://doi.org/10.1051/swsc/2019030.
cation engineering were involved in part of the tasks of this pro-
Jankowski J, Sucksdorff C. 1996. Guide for magnetic measurements
ject. They developed their own designs, solved problems on and observatory practice. International Association of Geomag-
their own in order to make it work, and interpreted results suc- netism and Aeronomy Warsaw. http://www.iaga-aiga.org/data/
cessfully. They participated actively in the dissemination of uploads/pdf/guides/iaga-guide-observatories.pdf.
results in congresses or journals like this. Kumar A, Kumar S. 2018. Solar flare effects on D-region ionosphere
using VLF measurements during low-and high-solar activity
Acknowledgements. We acknowledge funding from the phases of solar cycle 24. Earth Planets Space 70(1): 29.
University of Alcala (project CCG2018/EXP-071) and the https://doi.org/10.1186/s40623-018-0794-8.
Spanish Ministry of Economy (MINECO) project Lowes F. 2009. DC railways and the magnetic fields they produce –
AYA2016-80881P (including FEDER funds). We acknowl- the geomagnetic context. Earth Planets Space 61(8): i–xv.
edge Instituto Geográfico Nacional (IGN) for providing the https://doi.org/10.1186/BF03352944.
ground magnetic field data from San Pablo-Toledo (SPT) Margiono R, Yusuf M. 2014. On the influence of DC railway noise
observatory and the staff of SPT for their work in recording on variation data from tangerang geomagnetic observatories. In:
high-quality data. The editor thanks two anonymous review- 1st International Conference On Applied Electromagnetic Tech-
ers for their assistance in evaluating this paper. nology. ISBN 978-602-70279-0-9.
McRae WM, Thomson NR. 2004. Solar flare induced ionospheric
D-region enhancements from VLF phase and amplitude observa-
tions. J Atmos Sol-Terr Phys 66(1): 77–87. https://doi.org/
References 10.1016/j.jastp.2003.09.009.
Mitra A. 1974. Ionospheric effects of solar flares. In: Vol. 46 of
Biagi PF, Maggipinto T, Ermini A. 2015. The European VLF/LF Astrophysics and Space Science Library, D. Reidel Publishing
radio network: current status. Acta Geod Geoph 50(1): 109–120. Co., Dordrecht. https://doi.org/10.1007/978-94-010-2231-6.
https://doi.org/10.1007/s40328-014-0089-x. Montoya F. 2019. Portable data acquisition and representation
Bracewell RN, Straker TW, Redman RO. 1949. The study of solar system for a VLF receptor. Bachelor thesis, University of Alcala.
flares by means of very long radio waves. Mon Notic Roy Astron Available at http://hdl.handle.net/10017/38167.
Soc 109(1): 28–45. https://doi.org/10.1093/mnras/109.1.28. Pedersen LW, Merenyi L. 2016. The FGE magnetometer and the
Cid C, Saiz E, Guerrero A, Palacios J, Cerrato Y. 2015. A Carrington- INTERMAGNET 1 second standard. J Ind Geophys Union 2:
like geomagnetic storm observed in the 21st century. J Space 30–36. Available at https://www.space.dtu.dk/english/-/media/
Weather Space Clim 5: A16. https://doi.org/10.1051/swsc/2015017. Institutter/Space/English/instruments_systems_methods/3-axis_
Cid C, Guerrero A, Saiz E, Halford A, Kellerman A. 2019. fluxgate_magnetometer_model_fgm-fge/FGE-and-Intermagnet-
Developing the LDi and LCi geomagnetic indices, an example of 1-sec-standardap.ashx.
Page 12 of 13A. Guerrero et al.: J. Space Weather Space Clim. 2021, 11, 24
Pirjola R, Newitt L, Boteler D, Trichtchenko L, Fernberg P, McKee L, Santarelli L, Palangio P, De Lauretis M. 2014. Electromagnetic
Danskin D, Van Beek GJ. 2007. Modelling the disturbance caused background noise at L’Aquila geomagnetic observatory. Ann
by a dc-electrified railway to geomagnetic measurements. Earth Geophys 57(2): 0211. https://doi.org/10.4401/ag-6299.
Planets Space 59(8): 943–949. https://doi.org/10.1186/BF03352033. Stokes AJ. 1989. A VLF receiver system for monitoring solar flares.
Raulin J-P, Correia de Matos P, David P, Hadano R, Saraiva A, J Am Assoc Var Star Obs 18(2): 146–147. Available at https://ui.
Correia E, Kaufmann P. 2009. The south America VLF NETwork adsabs.harvard.edu/abs/1989JAVSO.18.146S.
(SAVNET): Development, installation status, first results. Geofs Thomson NR, Rodger CJ, Clilverd MA. 2005. Large solar flares and
Int 48(3): 253–261. http://www.scielo.org.mx/pdf/geoint/v48n3/ their ionospheric D region enhancements. J Geophys Res (Space
v48n3a1.pdf. Phys) 110(A6): A06306. https://doi.org/10.1029/2005JA011008.
Raulin J-P, Bertoni FCP, Gavilán HR, Guevara-Day W, Rodriguez R, Wenzel D, Jakowski N, Berdermann J, Mayer C, Valladares C,
et al. 2010. Solar flare detection sensitivity using the South America Heber B. 2016. Global ionospheric flare detection system
VLF Network (SAVNET). J Geophys Res (Space Phys) 115(A7): (GIFDS). J Atmos Sol-Terr Phys 138: 233–242. https://doi.org/
A07301. https://doi.org/10.1029/2009JA015154. 10.1016/j.jastp.2015.12.011.
Cite this article as: Guerrero A, Cid C, García A, Domínguez E, Montoya F, et al. 2021. The space weather station at the University of
Alcala. J. Space Weather Space Clim. 11, 24. https://doi.org/10.1051/swsc/2021007.
Page 13 of 13You can also read